Article

Genetic Variation in ZmPAT7 Contributes to Tassel Branch Number in Maize

Institute of Crop Sciences, Chinese Academy of Agricultural Sciences, Beijing 100081, China
*
Authors to whom correspondence should be addressed.
Int. J. Mol. Sci. 2022, 23(5), 2586; https://doi.org/10.3390/ijms23052586
Submission received: 10 February 2022 / Revised: 22 February 2022 / Accepted: 24 February 2022 / Published: 26 February 2022
(This article belongs to the Topic Plant Functional Genomics and Crop Genetic Improvement)

Abstract

:
Tassel branch number (TBN) is one of the important agronomic traits that contribute to the efficiency of seed production and has been selected strongly during the modern maize breeding process. However, the genetic mechanisms of TBN in maize are not entirely clear. In this study, we used a B73 × CML247 recombination inbred lines (RILs) population to detect quantitative trait loci (QTLs) for TBN. A total of four QTLs (qTBN2a, qTBN2b, qTBN4, and qTBN6) and six candidate genes were identified through expression analysis. Further, one of the candidates (GRMZM2G010011, ZmPAT7) encoding an S-acyltransferase was selected to validate its function by CRISPR-Cas9 technology, and its loss-of-function lines showed a significant increase in TBN. A key SNP(−101) variation in the promoter of ZmPAT7 was significantly associated with TBN. A total of 17 distant eQTLs associated with the expression of ZmPAT7 were identified in expression quantitative trait loci (eQTL) analysis, and ZmNAC3 may be a major factor involved in regulating ZmPAT7. These findings of the present study promote our understanding of the genetic basis of tassel architecture and provide new gene resources for maize breeding improvement.

1. Introduction

Maize is a monoecious cross-pollination crop. The male inflorescence (tassel) provides pollen for hybridization, which is important for maize grain production. Tassel size and weight have been reduced during modern breeding improvement [1,2]. Smaller tassels reduce the plant’s energy requirements for general maintenance and make more energy available for grain production [3]. On the other hand, tassel with sufficient pollens directly contributes to the efficiency of seed production and hybrid yield performance [4]. Therefore, an optimal tassel architecture is needed that can produce sufficient pollen and transform more energy into the kernel. As a major component of tassel architecture, tassel branch number (TBN) is significantly negatively correlated with grain yield, and the reduction in TBN has been experienced strong selection during the modern maize breeding process [5].
TBN is a complex quantitative trait controlled by multigenes. A large number of quantitative trait loci (QTLs)/quantitative trait nucleotides (QTNs) for TBN have been mapped in different mapping populations. Zhao et al. (2017) detected 11 QTLs using two F2:3 populations and identified 13 meta-QTLs (mQTLs) by integrating QTLs reported previously [6]. Li et al. (2018) summarized 100 QTLs and 360 QTNs for TBN, identified in several previous studies, and found that these QTLs and QTNs were mainly located at 20 genomic regions [7]. Recently, Wang et al. (2018) detected six minor effect QTLs for TBN using a Zheng58 × Chang7-2 recombination inbred lines (RILs) population with super-high-density genotyping [8]. Liu et al. (2019) detected seven QTLs using an F2:3 population that generated from the cross between Lv28 and H082183 [9]. Wang et al. (2019) detected 51 QTNs and 19 QTLs associated with TBN in an association mapping population and a doubled haploid (DH) population, respectively [10]. Notably, a nested association mapping (NAM) population was used to identify 39 QTLs and 325 QTNs for TBN by joint linkage analysis and genome-wide association studies (GWAS) [11]. Furthermore, Wu et al. (2016) integrated two NAM populations (a NAM from the US and a NAM from China) and identified 63 QTLs and 549 QTNs for TBN [12]. Identification of those QTLs is beneficial to elucidating the genetic basis and facilitating gene cloning for TBN in maize.
Some tassel architecture-related genes were cloned based on maize mutants previously. For example, RAMOSA2 (RA2), and RAMOSA3 (RA3), which function in the ramosa pathway, regulate the identity and determinacy of inflorescence axillary meristems. Additionally, those ramosa mutants show an increase in tassel branch number [13,14]. The two fasciated ear mutants, fasciated ear2 (fea2) and fasciated ear3 (fea3), also showed a larger tassel branch number. FEA2 and FEA3 encode membrane-localized leucine-rich repeat receptors and involve in the CLAVATA pathway [15,16]. UNBRANCHED2 (UB2), UB3, and TSH4 all encode SBP-box genes and function as redundant factors that limit the rate of cell differentiation to the lateral primordia. Loss-of-function mutations in ub2, ub3, and tsh4 result in smaller TBN [17,18]. Barren inflorescence2 (bif2) mutation has a reduced number of branches and spikelets in tassels. BIF2 encodes a serine–threonine protein kinase, which is modified the transition from inflorescence meristem (IM) to spikelet pair meristem (SPM) and indirectly affected the development of branch meristems [19,20]. However, because of negative pleiotropy, these genes cloned by mutants are difficult to use in maize breeding. Recently, a natural variation related to tassel branch number was identified in the 5′-UTR (untranslated region) of QDtbn1. QDtbn1 encodes a Kelch repeat-containing F-box protein, negatively regulates TBN with a dominant model, and participates in the ABA signaling pathway [21]. Despite these studies, there are still very few genes cloned through natural variation.
In this study, a B73 × CML247 RILs population was used to detect QTLs for TBN. Four QTLs were detected and colocated with the TBN-related associated loci that were reported by Wu et al. (2016), using two NAM populations to identify candidate genes [12]. ZmPAT7 was identified as a major candidate gene through bioinformatics and expression analysis. ZmPAT7 negatively regulated TBN, and its knockout lines had more TBN. A key SNP variation in the promoter of ZmPAT7 may confer the expression of ZmPAT7 and shows significant association with TBN. Moreover, 17 distant eQTLs associated with the expression of ZmPAT7 were identified in expression quantitative trait loci (eQTL) analysis.

2. Results

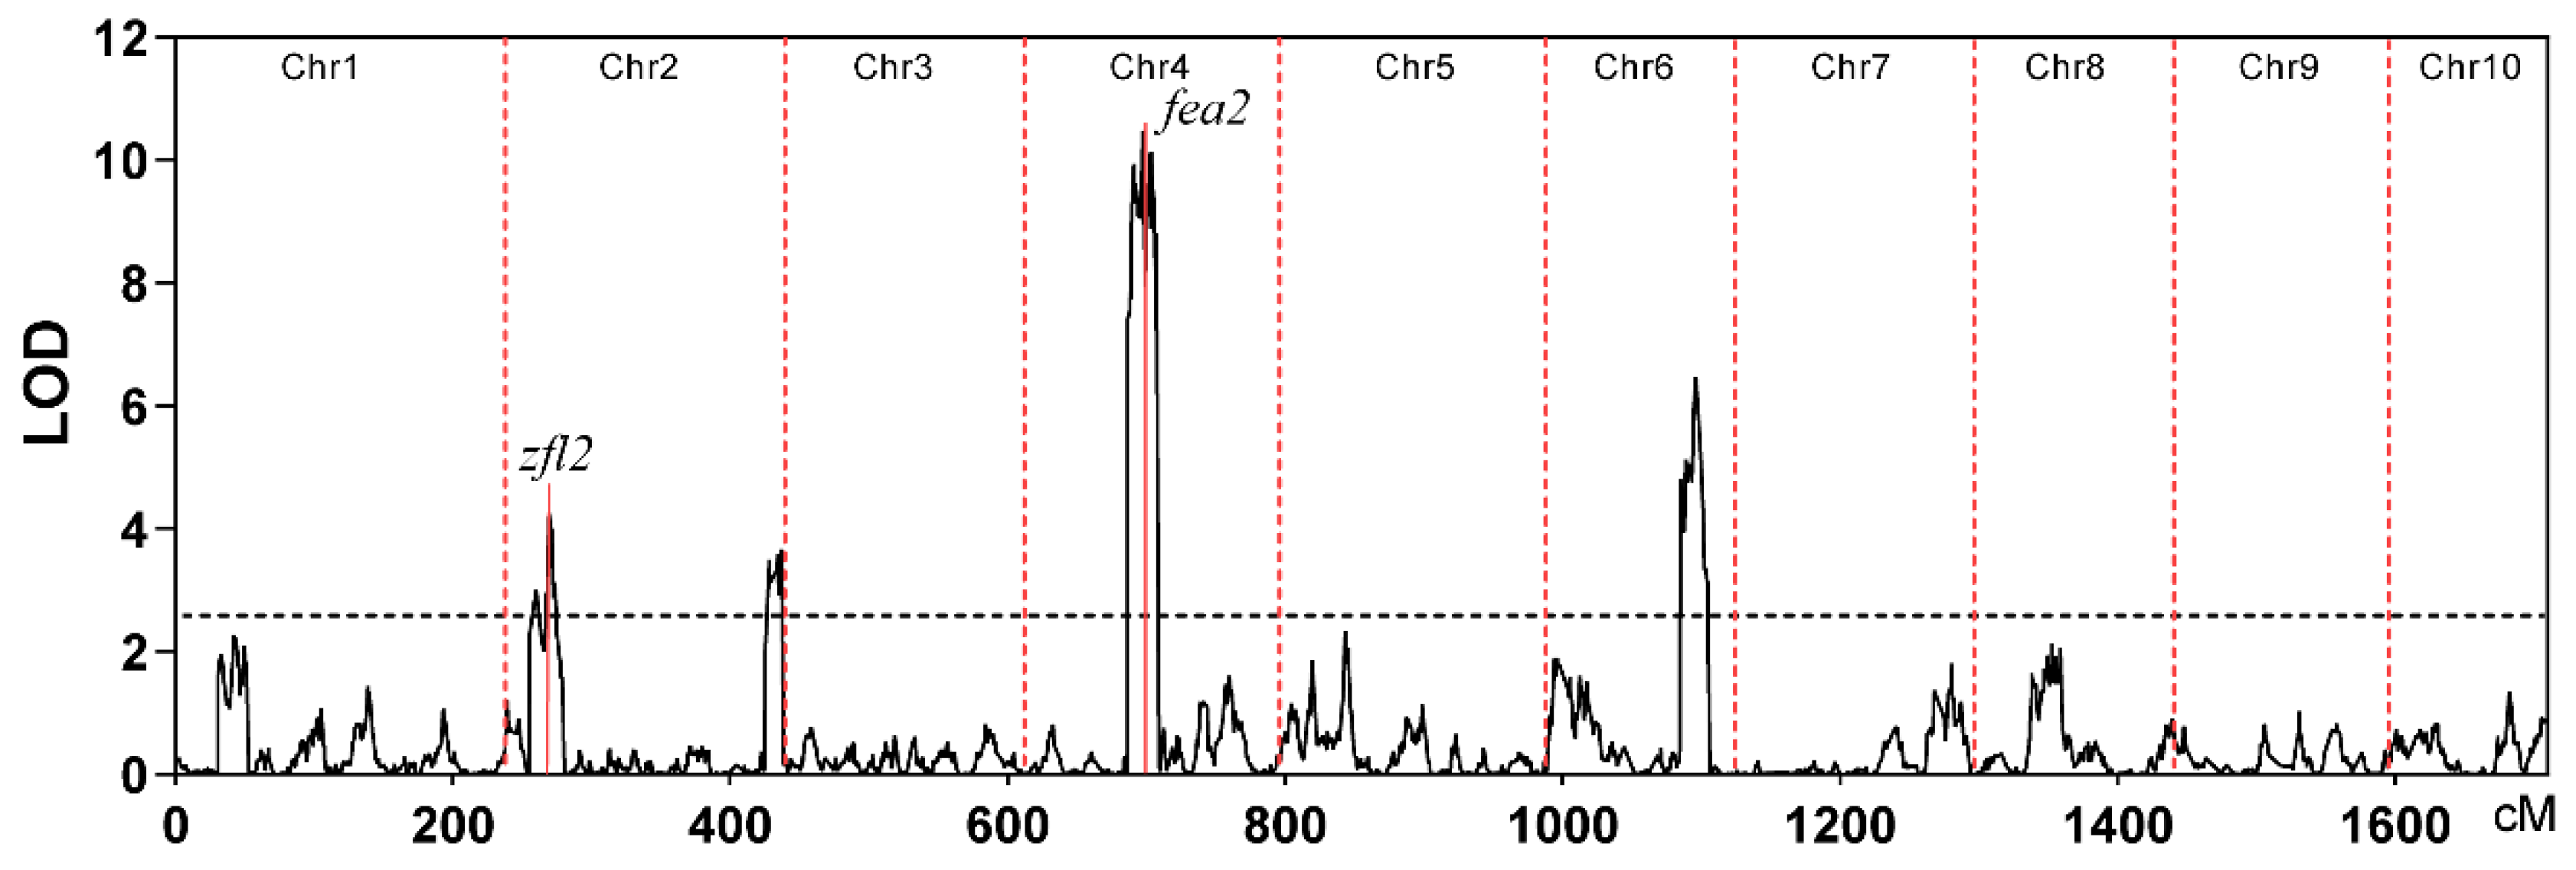
2.1. QTL Mapping and Identification of Candidate Genes for TBN

The two inbred lines, B73 and CML247, display great differences in tassel branch number. CML247 plants had more TBN than B73 plants, and the B73 × CML247 RIL population also revealed considerable variations in TBN (Figure S1a). Therefore, we used the RIL population to conduct subsequent QTL mapping. A total of four QTLs were detected above a cutoff of LOD > 2.5, including two QTL (qTBN2a and qTBN2b), one QTL (qTBN4), and one QTL (qTBN6) on chromosomes 2, 4, and 6, respectively (Figure 1, Table 1). Individual QTLs explained phenotypic variation ranging from 5.21% to 16.22%, and qTBN4 showed the largest effect among the four QTLs (Table 1). The number of genes in the interval of QTLs varied from 217 to 2510 (Table 1). We further checked whether the known cloned genes regulating the development of male inflorescence were located in QTL regions. We found that FASCIATED EAR2 (FEA2), involved in the CLAVATA pathway to control the size of the inflorescence meristem, was colocated with qTBN4. zfl2, whose mutant exhibited disruptions of floral organ identity and patterning, and defects of inflorescence architecture, and in the vegetative to reproductive phase transition [22], they were colocated with qTBN2a.
Previously, Wu et al. (2016) performed a genome-wide association study using the CN-NAM and US-NAM populations for tassel architecture and identified a total of 549 QTNs for TBN [12]. It was found that 25 among the 549 QTNs were colocated in the four QTLs detected in this study, including 15 QTNs colocated with qTBN2a, 4 QTNs colocated with qTBN2b, 5 QTNs colocated with qTBN4, and 1 QTN colocated with qTBN6. Subsequently, we identified a total of 36 candidate genes underlying TBN (Table 2). Furthermore, we compared the expression of those candidate genes in shoot apical meristem (SAM) between the two parents, i.e., B73 and CML247 (Figure S1b). Six candidate genes (GRMZM2G302701, GRMZM5G897776, GRMZM2G162266, GRMZM2G163067, GRMZM2G010011, and GRMZM2G423636) showed high expression and also differential expression between B73 and CML247, which might play a role in regulating maize TBN. The three candidate genes, i.e., GRMZM2G162266, GRMZM2G163067, and GRMZM2G423636, encode uncharacterized proteins. GRMZM2G010011 encodes an S-acyltransferase. GRMZM2G302701 encodes a nucleolar preribosomal-associated protein 1. GRMZM5G897776 encodes a starch synthase 3 involved in starch biosynthesis.

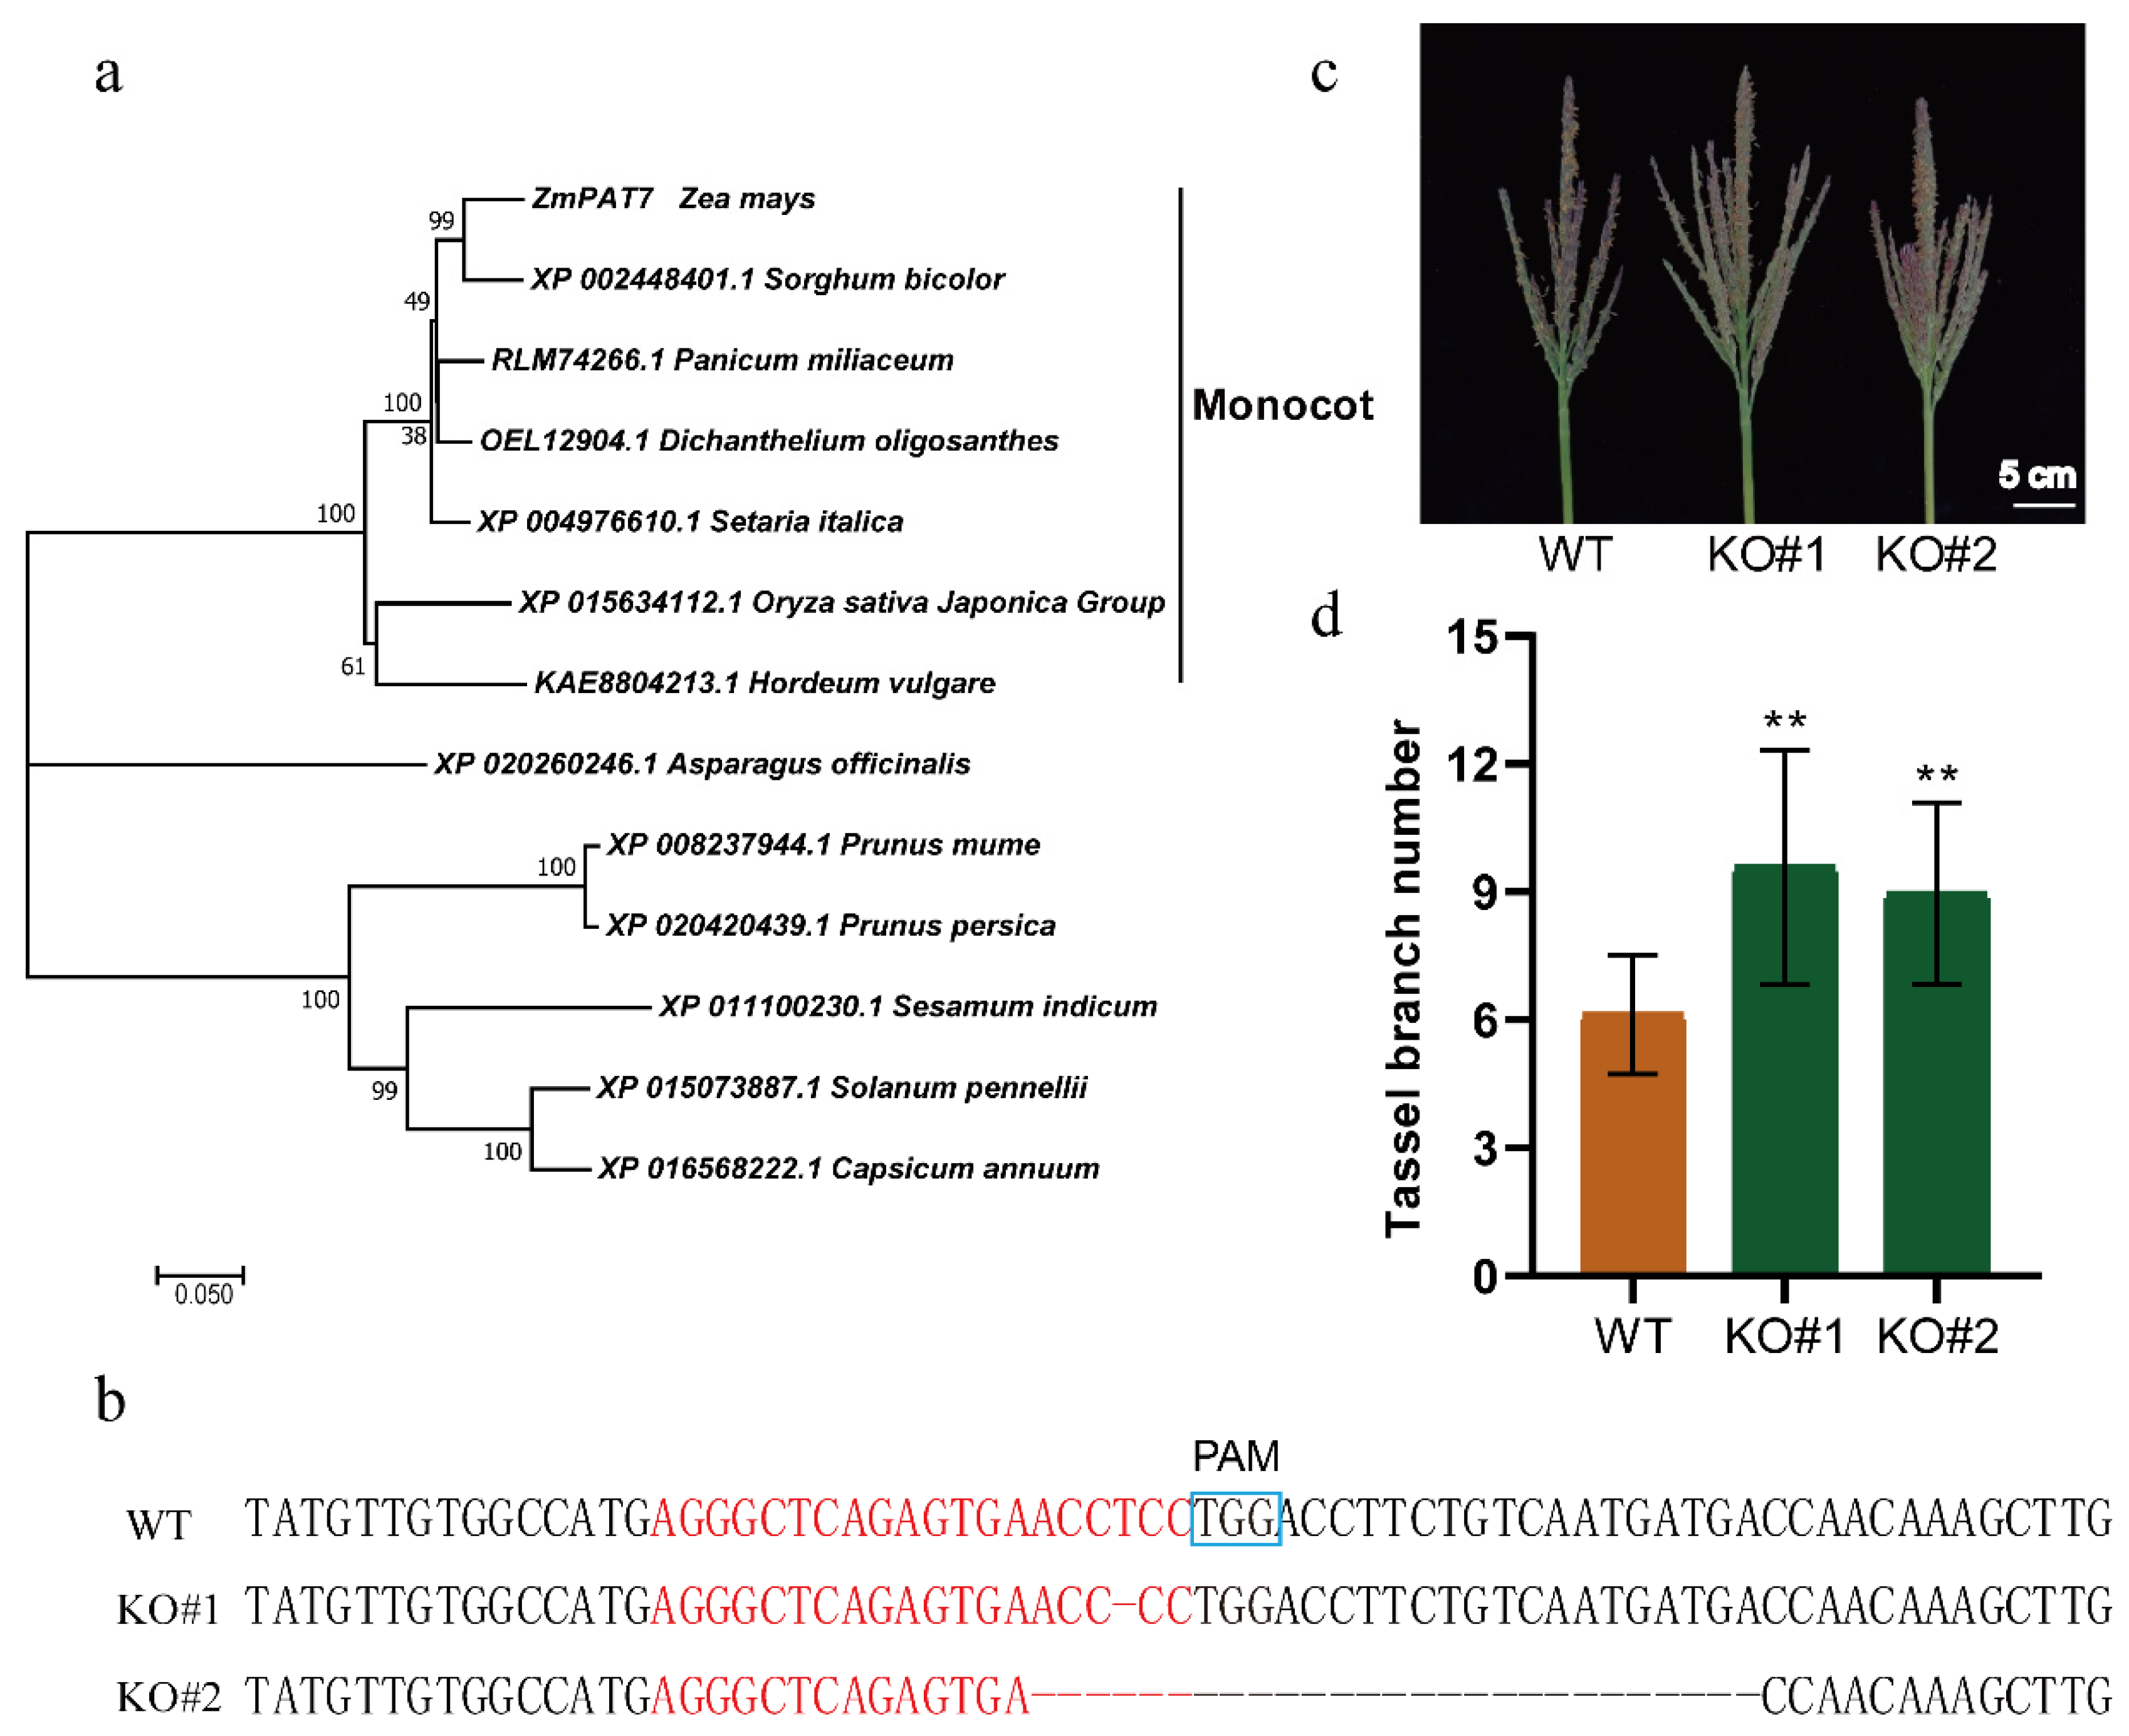
2.2. ZmPAT7 Negatively Controls Tassel Branch Number in Maize

Previous studies suggested that S-acyltransferases play an important role in regulating plant architecture in plants [23,24,25,26]. Therefore, we focused on GRMZM2G010011 to further validate its function. Previously, 38 Protein S-acyltransferases (PAT) genes have been identified in the maize genome, and GRMZM2G010011 was named ZmPAT7 [27]. ZmPAT7 harbors a conserved Asp–His–His–Cys (DHHC) domain that is representative of S-acyltransferases and has four transmembrane motifs (Figure S2a,b). Phylogenetic analyses of ZmPAT7 with high homology protein from other plants showed that ZmPAT7 was closely related with PAT proteins in monocot (Figure 2a). To confirm the function of ZmPAT7 underlying TBN, we obtained two knockout lines (KO#1 and KO#2) using CRISPR/Cas9 technology. Gene editing of ZmPAT7 was screened by PCR amplification and Sanger sequencing of the target region. KO#1 carrying a 1 bp deletion and KO#2 carrying a 27 bp deletion were used for subsequent analysis (Figure 2b). Compared with the wild-type line, the two loss-of-function lines of ZmPAT7 showed a significant increase in TBN (Figure 2c,d).

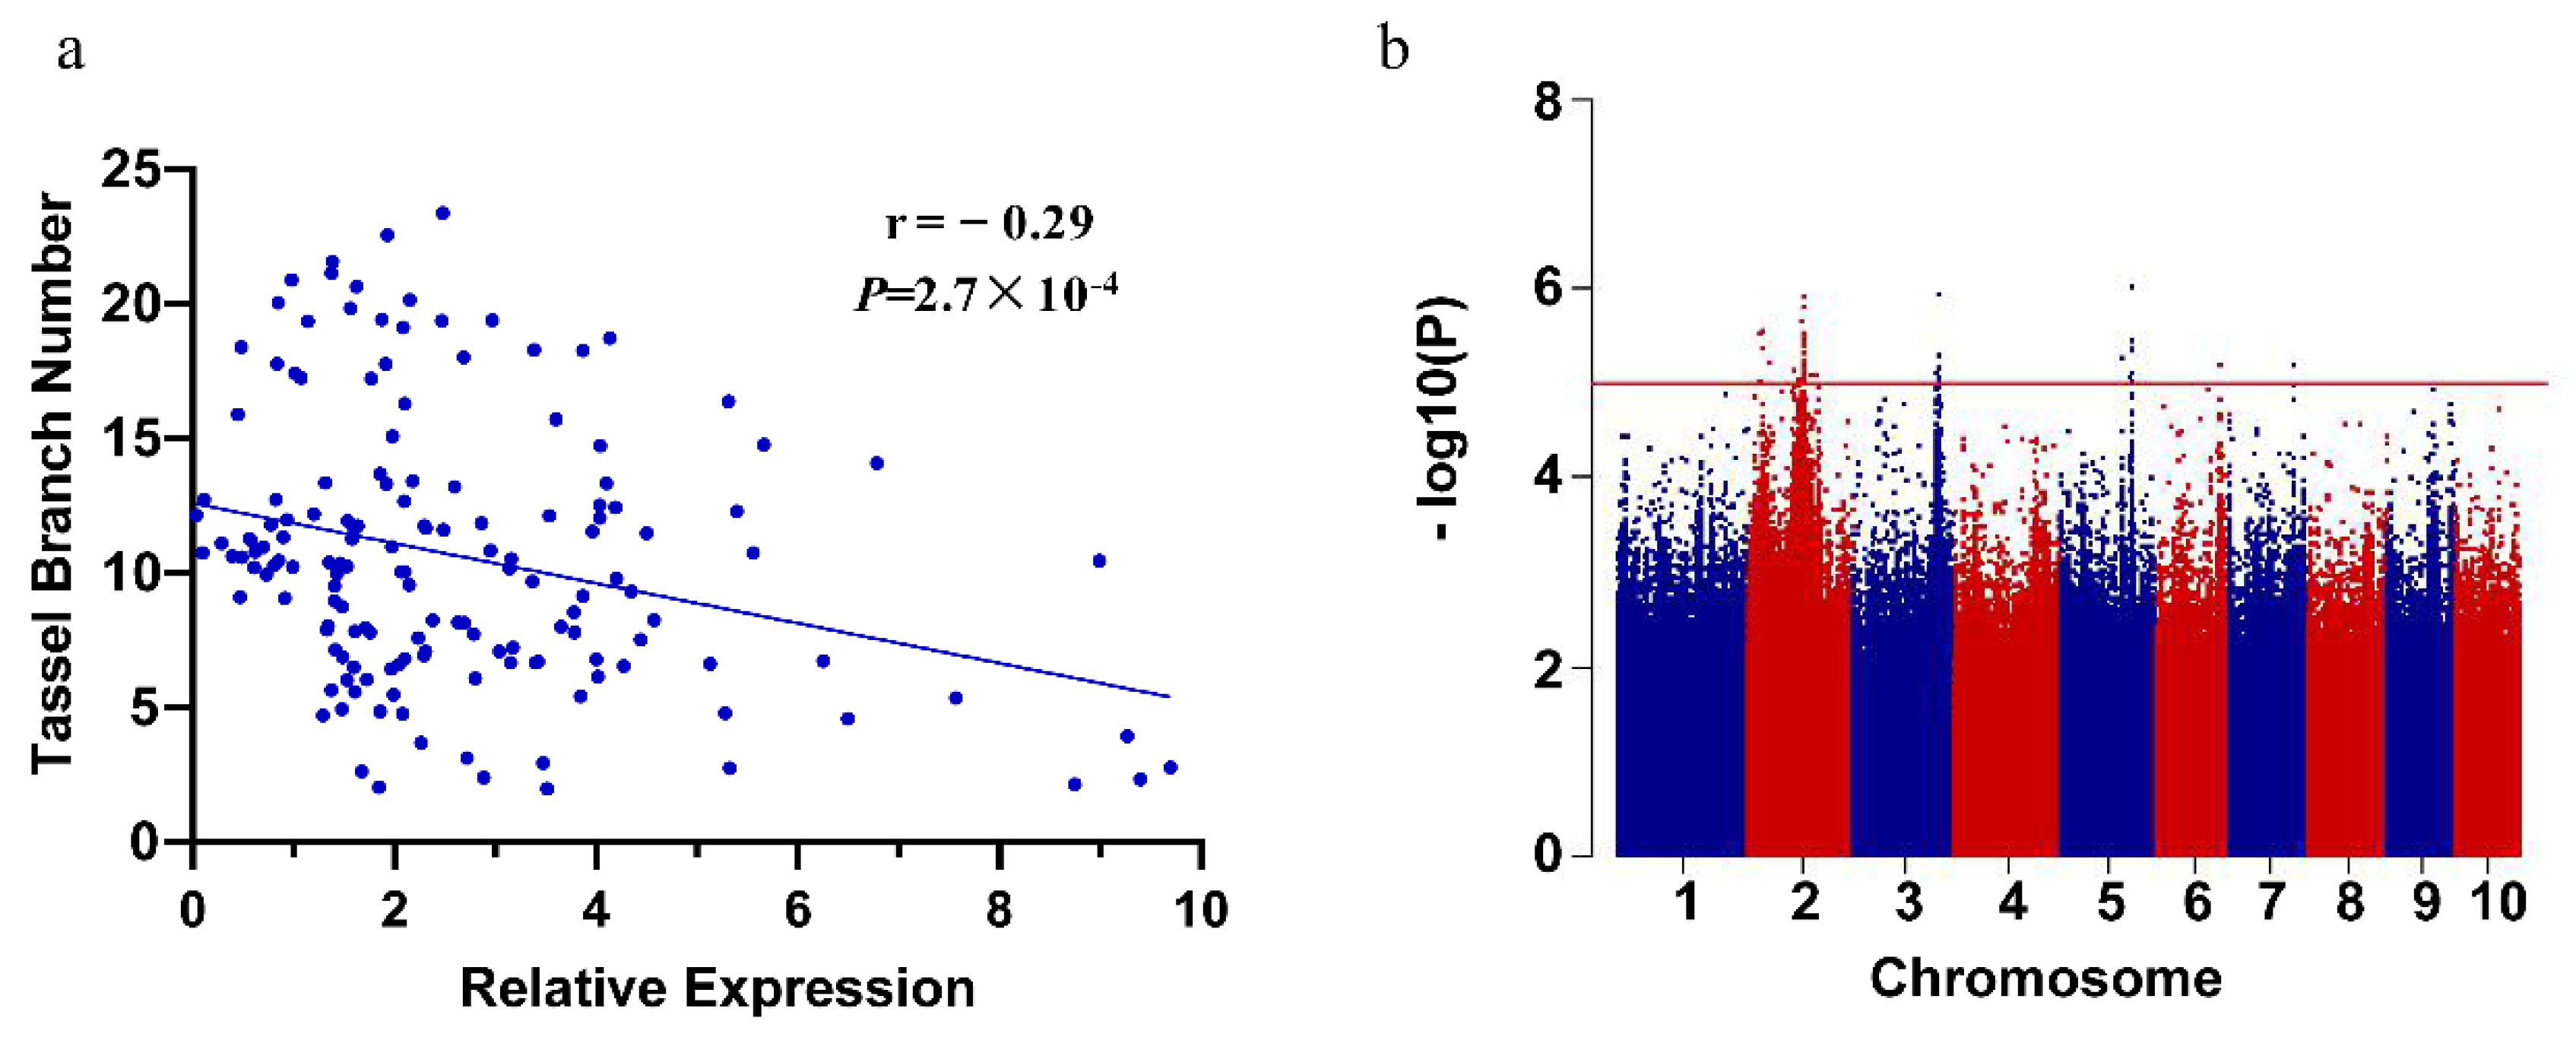
2.3. Natural Alleles of ZmPAT7

To identify key variations in ZmPAT7 associated with TBN, we obtained the polymorphic variants in a ~12.5 kb genomic region, covering the promoter and gene body of ZmPAT7, from 1604 resequenced maize inbred lines. We identified 200 polymorphic variants (SNPs and indels) (Figure 3a) and found that three SNPs (−101, 3771, and 8855 bp) were significantly associated with TBN. The three SNPs were located in the promoter, the fifth intron region, and downstream of the gene body, respectively. Based on the three significant variants, we classified the 1604 maize genotypes into 4 haplotype groups (Figure 3b). The lines with Hap1 or Hap2 have lower TBN than those with Hap3 or Hap4, and no significant differences were observed between lines with Hap1 and Hap2 or between lines with Hap3 and Hap4. Therefore, we designated Hap1 or Hap2 as a favorable haplotype, which is consistent with the haplotype groups classified only by SNP (−101). The SNP (−101) may be a key variant in regulating TBN. For example, the inbred lines Zheng58 and Chang7-2, two parents of hybrid Zhengdan958 widely planted in China, had significant differences in TBN (Figure 3c,d). Zheng58 with Hap1 had a smaller TBN (5.5 ± 1.1) than Chang7-2 with Hap4 (18 ± 1.9). Furthermore, we chose 20 lines with Hap1 and 20 lines with Hap4 to conduct gene expression analysis. ZmPAT7 exhibited higher expression in low TBN lines with Hap1 than that in high TBN lines with Hap4 (Figure 3e). These results suggested that the expression of ZmPAT7 may contribute to the phenotypic variation in maize tassel branch number.

2.4. Expression Quantitative Trait Loci Analysis of ZmPAT7

We used 223 inbred lines with large phenotypic variations in TBN (from 1.97 to 23.37) (Table S1, Figure S3) to analyze the expression level of ZmPAT7. The expression of ZmPAT7 showed a considerable variation and negatively correlated with TBN (r = −0.29, p = 2.7 × 10⁻⁴) (Figure 4a). Association analysis was conducted using the expression of ZmPAT7 as phenotypic value and a total of 49 significantly associated SNPs were identified (Figure 4b). Based on the significant SNPs, a total of 17 eQTLs associated with the expression of ZmPAT7 were identified. These included nine on chromosome 2, three on chromosome 3, three on chromosome 5, one on chromosome 6, and one on chromosome 7 (Table 3). All the 17 eQTLs were defined as “distant eQTLs” following the previous method proposed by Fu et al. (2013) and Pang et al. (2019) [28,29]. In total, 44 genes were found in LD distance (200 kb) adjacent to the SNPs (Table 3), among which some transcription factor genes, e.g., Zm00001d038207 (ZmNAC3), may be involved in regulating ZmPAT7. Interestingly, we also found an SNP (−274, T/A) in the promoter of ZmPAT7 between B73 and CML247, which results in the cis-element NAC motif change. The NAC motif (TCTTGACC) existed in B73, while the NAC core promoter element was absent in CML247 (Figure S4). These results suggested that ZmNAC3 may be a major factor that mediated the expression of ZmPAT7.

3. Discussion

In this study, we mapped four QTLs for TBN by using a high-quality recombination map of the B73 × CML247 RIL population. In previous studies, all identified QTLs were colocated with the QTLs/QTNs detected in other populations [6,9,11,12]. qTBN2a mapped at 7.85–14.72 Mb interval on chromosome 2 in our study was also reported previously. For example, Q32CN-NAM and Q46US-NAM identified by Wu et al. (2016) using joint linkage analysis for TBN [12] were colocated with qTBN2a. Zhao et al. (2017) also identified an mQTL2-1 on chromosome 2 using meta-QTL analysis [6], which overlapped with qTBN2a in our study. In addition, a tassel dry weight (TW) related QTL, qTW2_1, was also colocated with qTBN2a [9]. Q50US-NAM and four QTNs reported by Wu et al. (2016) [12] were colocated with qTBN2b, and Q44CN-NAM reported by the same study was colocated with qTBN6. Eight QTNs and five QTNs reported by Brown et al. (2011) [11] and Wu et al. (2016) [12], respectively, fell in the interval of qTBN4. Furthermore, some maize inflorescence developmental genes were located in those QTLs detected in this study. For example, zfl2, regulating the development of inflorescence architecture, was colocated with qTBN2a. In addition, fea2, controlling the size of the inflorescence meristem, was colocated with qTBN4. These comparisons suggested that the QTLs detected in the present study were important genomic regions controlling TBN.
A large number of QTLs for TBN have been identified by using bi-parental populations [6,8,9,30,31,32,33]. These QTLs have generally large genomic intervals, which is difficult to find candidate genes quickly. The interval of QTLs in our study is also large, containing many genes (Table 1). On another front, many QTNs for TBN were identified using GWAS [11,12,34]. Combining GWAS and linkage mapping would be beneficial to quickly identify candidate genes. For example, Wang et al. (2019) detected 55 candidate genes according to the colocated loci between QTNs and QTLs [10]. Wu et al. (2016) detected 113 male inflorescence-related candidate genes by integrating the results of joint-linkage mapping and GWAS [12]. To identify candidate genes, we integrated our QTL results and the QTNs of GWAS from the US-NAM and CN-NAM populations reported by Wu et al. (2016) [12]. A total of 25 QTNs were colocated with the 4 QTLs obtained in this study, and 36 candidate genes were then identified.
Transcriptome data can be used in narrowing the range of candidate genes for specific traits. Thus, we used the expression data in B73 and CML247 shoot apical meristem (SAM) from https://qteller.maizegdb.org/ (accessed on 18 May 2020) [35] for identifying the most possible candidate genes. Six candidate genes (GRMZM2G302701, GRMZM5G897776, GRMZM2G162266, GRMZM2G163067, GRMZM2G010011, and GRMZM2G423636) were identified to further explore the regulation mechanisms of TBN, among which GRMZM2G010011 (ZmPAT7) encodes an S-acyltransferase.
S-acylation is a reversible post-translational modification process occurring in eukaryotes that regulates tracking, regulation, signaling, membrane association, and target protein functions [36]. Several studies have reported that S-acyltransferases encoded by the PAT gene family play an important role in regulating plant architecture and other traits in plants. For instance, OsPAT15 regulates plant architecture by altering the tiller in rice [24], and overexpression of OsPAT15 results in increased branch and seed yield in Brassica napus [37]. Knockout lines of PbPAT14 exhibited the dwarf yellowing phenotype, and the function of PbPAT14 was related to the ABA pathway [25]. In addition, Hemsley et al. (2005) reported an S-acyltransferase gene in Arabidopsis, Tip Growth Defective 1 (TIP1)/PAT24, which exhibits impairment in root hair elongation and defective growth of pollen tubes [23]. Zhang et al. (2020) reported that ZmTIP1, which encodes a functional S-acyltransferase, plays a positive role in regulating the length of root hairs and drought tolerance in maize [26]. Two homologous proteins, PAT13 and PAT14, are cooperatively involved in regulating precocious leaf senescence in Arabidopsis [38,39]. PAT10 is localized on Golgi and tonoplast membranes, and those mutations performed pleiotropic defects in plant development [40,41]. PAT4 was also reported to mediate root hair growth in Arabidopsis [42]. AtPAT21, another PAT reported recently, participates in both male and female gametogenesis [43]. Although ZmPAT7 harbors a conserved DHHC domain that is representative of S-acyltransferases (Supplementary Figure S2a,b), and phylogenetic analyses of ZmPAT7 showed that it was highly conserved in monocots, functions of these S-acyltransferase proteins that are close to ZmPAT7 are still unknown.
In our study, the two loss-of-function lines of ZmPAT7 showed significant increases in TBN (Figure 2c,d). ZmPAT7 exhibited higher expression in low TBN lines than that in high TBN lines (Figure 3d), suggesting that the expression of ZmPAT7 negatively regulated TBN in maize. We identified a key variant SNP (−101) in the ZmPAT7 promoter which caused the change in expression level and was further verified in the inbred lines of Zheng58 and Chang7-2 (Figure 3b,c). Additionally, the sequences of ZmPAT7 promoter in B73 and CML247 also showed several variants (Supplementary Figure S4), e.g., the SNP (−157, A/C) resulting in the ERF element difference, the SNP(−274, T/A) in the cis-element NAC motif change, and the SNP(−433, G/T) in the MYB element difference. Taken together, we speculated that ZmPAT7 plays an important role in natural variations in TBN in maize.

4. Materials and Methods

4.1. Plant Materials

The B73 × CML247 RILs population containing 193 lines was used for QTL mapping. A large association population containing 1604 maize inbred lines comprising 1227 from China, 344 from the United States, and 33 from other countries [44] was used for candidate gene association analysis. Furthermore, we chose 223 inbred lines that showed considerable variations in TBN from the association panel to conduct expression assay and eQTL analysis. To detect the expression of ZmPAT7, we grew the 223 inbred lines in a field in Beijing, China, in the summer of 2019, and sampled the leaf at the V5 stage.

4.2. QTL Mapping and Identification of Candidate Genes

The phenotypic data of TBN for the US-NAM RILs were collected in eight environments as described by Brown et al. (2011) [11], which were transformed using the Box–Cox function in R software, and used to calculate best-unbiased predictor (BLUP). The BLUP values of TBN in B73 × CML247 RILs were used for QTL mapping. A high-quality recombination map containing 2183 bin markers of the B73 × CML247 RILs was reported by Li et al. (2015) [45]. The total linkage distance of the genetic map is 1708.44 cM, and the average interval between adjacent bins was 0.78 cM [45]. A total of 193 RILs were matched between the phenotype and genotype. QTL analysis was conducted using the WinQTLCart cartographer v2.5 software (North Carolina State University, Raleigh, NC, USA) with composite interval mapping (CIM) method [46], with a 1000 permutation test at 95% confidence level to determine the optimal log of odds (LOD) threshold values. Then, the 2-LOD drop method was applied for defining the QTL confidence interval. Then, we identified the colocated loci with the QTNs reported by Wu et al. (2016) [12]. Genes falling within 50 kb of colocated loci were considered candidate genes. Furthermore, the expression data in B73 and CML247 shoot apical meristem (SAM) of candidate genes was extracted from https://qteller.maizegdb.org/ (accessed on 18 May 2020) [35] and used to find differential expression genes between B73 and CML247. The genes with high expression in SAM and the ratio of expression between B73 and CML247 greater than 1.5 (B73/CML247 > 1.5 or CML247/B73 > 1.5) were considered candidate genes.

4.3. Identification of the CRISPR/Cas9 Mutants of ZmPAT7

The CRISPR/Cas9 mutants of ZmPAT7 were ordered from http://www.wimibio.com/maize.html (accessed on 5 May 2019) and the methods of vector construction, genetic transformation for creating CRISPR/Cas9 mutants were reported by Liu et al. (2020) [47]. Briefly, the single guide RNA (sgRNA) sequence is AGGGCTCAGAGTGAACCTCC. The vector pCPB-ZmUbi-hspCas9 was first linearized by HindIII. Separately, ZmU6 and the sgRNA scaffold of ZmPAT7 were amplified through overlapping PCR with a homologous arm. Additionally, homologous arms that match linearized pCPB-ZmUbi-hspCas9 were also added to the insertion fragment in the overlap PCR. Finally, the gene-specific insertion fragments were incorporated into the pCPB-ZmUbi-hspCas9 vector. Additionally, the maize inbred line KN5585 was then used for Agrobacterium tumefaciens-mediated transformation of immature embryos. We planted the T1 lines in the field to identify the homozygous positive lines. Genomic editing of ZmPAT7 was screened by PCR amplification and Sanger sequencing of the target region. The PCR primers were cr-F: CAATCTTGACAAAGAAACC and cr-R: TTGAAATGATAGAACGCAC. The T2 homozygous positive lines and its wild-type line KN5585 were phenotyped at Sanya (18° N, 109° E) in the winter of 2020. The experiment in the field followed a randomized block design, with three replicates.

4.4. Candidate Gene-Based Association Analysis

The phenotypic data of TBN for the 1604 inbred lines were identified at five locations in 2018 and 2019, which were used to calculate the best-unbiased predictor (BLUP). The polymorphic variants in a ~12.5 kb region covering 2.5 kb upstream, 9.5 kb gene body of ZmPAT7 and 0.5 kb downstream region were extracted from 1604 inbred lines resequenced data [44]. Those variants with minor allele frequency (MAF) over 5% were identified and used for candidate gene-based association analysis. Association analysis was performed using a mixed linear model (MLM) in Tassel v3.0 (Cornell University, Ithaca, NY, USA), with the population structure and kinship analyzed in Tassel v5.0 [48]. A Bonferroni-corrected significant association threshold (p ≤ 0.1/200 = 5.0 × 10⁻⁴) was used to determine the significantly associated variants.

4.5. Expression Quantitative Trait Loci Analysis

The leaves at V5 of 223 inbred lines were isolated for qRT–PCR. A total of 8,974,340 SNPs was identified with a minor allele frequency (MAF) > 0.05. The Kinship (K) matrix of pairwise genetic distances was calculated by EMMAX and was used as the variance-covariance matrix of the random effects for association analysis. The association analysis using a mixed linear model (MLM) was performed with the EMMAX software package. The suggestive threshold was 1.0 × 10⁻⁵, which was used to identify significantly associated signals. The significant SNPs were defined as candidate eQTLs, and if there were more than two SNPs in a 5 kb region, the SNPs were regarded as a cluster, and the most significant SNPs in the clusters were considered as candidate eQTLs. If two candidate eQTLs of a single gene were under LD (r2 > 0.1), the less significant eQTL was removed. The eQTLs were divided into two types using 20 kb as a cutoff to define “local eQTLs” versus “distant eQTLs”. The methods mentioned above were similar to those in previous studies [28,29].

4.6. RNA Isolation and Quantitative Reverse Transcription PCR (qRT–PCR)

Total RNAs were extracted from plant tissues using the Plant Total RNA Isolation Kit (Genebetter, Beijing, China). First-strand cDNA was synthesized using the Uni One-Step gDNA Removal and cDNA Synthesis SuperMix Kit (TranScript, Beijing, China). Quantitative real-time PCR (qRT–PCR) was performed using the Taq Pro Universal SYBR qPCR Master Mix (Vazyme, Nanjing, China) with a QuanStudio 3 Real-Time PCR System cycler (Applied Biosystems, San Francisco, CA, USA). The maize GAPDH gene was used as the internal control, and the relative expression was calculated using the 2−ΔΔCt method. The PCR conditions consisted of an initial denaturation step at 95 °C for 30 s, followed by 40 cycles at 95 °C for 10 s, and 60 °C for 30 s. The primers of ZmPAT7 and GAPDH were qPAT7 (qPAT7-f: CCAGTATGAGGCAGACAGTGA, qPAT7-R: TGGATGGTGCTCGGCTATG) and qGAPDH (qGAPDH-F: CCCTTCATCACCACGGACTAC qGAPDH-R: AACCTTCTTGGCACCACCCT), respectively.

4.7. Sequence Blast and Phylogenetic Analysis

The sequences of ZmPAT7 promoter in B73 and CML247 were obtained from maizeGDB (https://www.maizegdb.org/, accessed on 18 May 2021). Sequence alignment was conducted using Tbtools (a Toolkit for Biologists integrating various biological data-handling tools) [49]. Homologs of ZmPAT7 were identified using the BLASTP (https://blast.ncbi.nlm.nih.gov/, accessed on 10 October 2021). The phylogenetic tree was conducted using the neighbor-joining method in MEGA7.0 (https://www.megasoftware.net/, accessed on 10 October 2021) with 1000 replicate bootstrap, and the following parameters: p-distance mode, pairwise deletion. Cis-acting elements on the promoter were predicted using PlantPAN 3.0 [50].

Supplementary Materials

The following supporting information can be downloaded at: https://www.mdpi.com/article/10.3390/ijms23052586/s1.

Author Contributions

Y.L. (Yu Li) and C.L. designed the research. H.G., X.C., and K.W. conducted the experiments. X.L., D.Z., Y.L. (Yongxiang Li), Y.S. (Yanchun Song), Y.S. (Yunsu Shi), and T.W. participated in some experiments. H.G. and C.L. analyzed the data and wrote the manuscript. Y.L. (Yu Li) revised the manuscript. All authors have read and agreed to the published version of the manuscript.

Funding

This research was supported by the National Key R&D Program of China (2021YFD1200700), the National Natural Science Foundation of China (31971891), and the Science and Technology Innovation Project of the Chinese Academy of Agricultural Sciences (CAAS-ZDRW202004).

Institutional Review Board Statement

Not applicable.

Informed Consent Statement

Not applicable.

Data Availability Statement

Not applicable.

Conflicts of Interest

The authors declare no conflict of interest.

References

  1. Duvick, D.N.; Cassman, K.G. Post-green revolution trends in yield potential of temperate maize in the north-central United States. Crop Sci. 1999, 39, 1622–1630. [Google Scholar] [CrossRef]
  2. Gage, J.L.; White, M.R.; Edwards, J.W.; Kaeppler, S.; de Leon, N. Selection Signatures Underlying Dramatic Male Inflorescence Transformation during Modern Hybrid Maize Breeding. Genetics 2018, 210, 1125–1138. [Google Scholar] [CrossRef] [Green Version]
  3. Duvick, D.N.; Smith, J.S.C.; Cooper, M.; Longper, M.; Smith, J.S.C.C. ng Modern Hybrid Maize Breeding. In Plant Breeding Reviews, Part 2: Long-Term Selection: Crops, Animals, and Bacteria; Janick, J., Ed.; John Wiley & Sons, Inc.: Hoboken, NJ, USA, 2004; Volume 24, pp. 109–151. [Google Scholar]
  4. Upadyayula, N.; da Silva, H.S.; Bohn, M.O.; Rocheford, T.R. Genetic and QTL analysis of maize tassel and ear inflorescence architecture. Theor. Appl. Genet. 2006, 112, 592–606. [Google Scholar] [CrossRef] [PubMed]
  5. Wang, B.B.; Lin, Z.C.; Li, X.; Zhao, Y.P.; Zhao, B.B.; Wu, G.X.; Ma, X.J.; Wang, H.; Xie, Y.R.; Li, Q.Q.; et al. Genome-wide selection and genetic improvement during modern maize breeding. Nat. Genet. 2020, 52, 565–571. [Google Scholar] [CrossRef]
  6. Zhao, X.Q.; Peng, Y.L.; Zhang, J.W.; Fang, P.; Wu, B.Y. Mapping QTLs and meta-QTLs for two inflorescence architecture traits in multiple maize populations under different watering environments. Mol. Breed. 2017, 37, 91. [Google Scholar] [CrossRef]
  7. Li, M.F.; Zhong, W.S.; Yang, F.; Zhang, Z.X. Genetic and Molecular Mechanisms of Quantitative Trait Loci Controlling Maize Inflorescence Architecture. Plant Cell Physiol. 2018, 59, 448–457. [Google Scholar] [CrossRef] [Green Version]
  8. Wang, B.B.; Liu, H.; Liu, Z.P.; Dong, X.M.; Guo, J.J.; Li, W.; Chen, J.; Gao, C.; Zhu, Y.B.; Zheng, X.M.; et al. Identification of minor effect QTLs for plant architecture related traits using super high density genotyping and large recombinant inbred population in maize (Zea mays). BMC Plant Biol. 2018, 18, 17. [Google Scholar] [CrossRef] [PubMed] [Green Version]
  9. Liu, X.Y.; Hao, L.Y.; Kou, S.R.; Su, E.H.; Zhou, Y.Q.; Wang, R.L.; Mohamed, A.; Gao, C.X.; Zhang, D.F.; Li, Y.X.; et al. High-density quantitative trait locus mapping revealed genetic architecture of leaf angle and tassel size in maize. Mol. Breed. 2019, 39, 7. [Google Scholar] [CrossRef]
  10. Wang, Y.L.; Chen, J.; Guan, Z.R.; Zhang, X.X.; Zhang, Y.C.; Ma, L.L.; Yao, Y.M.; Peng, H.W.; Zhang, Q.; Zhang, B.; et al. Combination of multi-locus genome-wide association study and QTL mapping reveals genetic basis of tassel architecture in maize. Mol. Genet. Genom. 2019, 294, 1421–1440. [Google Scholar] [CrossRef]
  11. Brown, P.J.; Upadyayula, N.; Mahone, G.S.; Tian, F.; Bradbury, P.J.; Myles, S.; Holland, J.B.; Flint-Garcia, S.; McMullen, M.D.; Buckler, E.S.; et al. Distinct Genetic Architectures for Male and Female Inflorescence Traits of Maize. PLoS Genet. 2011, 7, e1002383. [Google Scholar] [CrossRef] [Green Version]
  12. Wu, X.; Li, Y.X.; Shi, Y.S.; Song, Y.C.; Zhang, D.F.; Li, C.H.; Buckler, E.S.; Li, Y.; Zhang, Z.W.; Wang, T.Y. Joint-linkage mapping and GWAS reveal extensive genetic loci that regulate male inflorescence size in maize. Plant Biotechnol. J. 2016, 14, 1551–1562. [Google Scholar] [CrossRef] [PubMed] [Green Version]
  13. Bortiri, E.; Chuck, G.; Vollbrecht, E.; Rocheford, T.; Martienssen, R.; Hake, S. ramosa2 encodes a LATERAL ORGAN BOUNDARY domain protein that determines the fate of stem cells in branch meristems of maize. Plant Cell 2006, 18, 574–585. [Google Scholar] [CrossRef] [PubMed] [Green Version]
  14. Satoh-Nagasawa, N.; Nagasawa, N.; Malcomber, S.; Sakai, H.; Jackson, D. A trehalose metabolic enzyme controls inflorescence architecture in maize. Nature 2006, 441, 227–230. [Google Scholar] [CrossRef] [PubMed]
  15. Taguchi-Shiobara, F.; Yuan, Z.; Hake, S.; Jackson, D. The fasciated ear2 gene encodes a leucine-rich repeat receptor-like protein that regulates shoot meristem proliferation in maize. Gene Dev. 2001, 15, 2755–2766. [Google Scholar] [CrossRef] [Green Version]
  16. Je, B.I.; Gruel, J.; Lee, Y.K.; Bommert, P.; Arevalo, E.D.; Eveland, A.L.; Wu, Q.Y.; Goldshmidt, A.; Meeley, R.; Bartlett, M.; et al. Signaling from maize organ primordia via FASCIATED EAR3 regulates stem cell proliferation and yield traits. Nat Genet. 2016, 48, 785–791. [Google Scholar] [CrossRef] [Green Version]
  17. Chuck, G.; Whipple, C.; Jackson, D.; Hake, S. The maize SBP-box transcription factor encoded by tasselsheath4 regulates bract development and the establishment of meristem boundaries. Development 2010, 137, 1243–1250. [Google Scholar] [CrossRef] [Green Version]
  18. Chuck, G.S.; Brown, P.J.; Meeley, R.; Hake, S. Maize SBP-box transcription factors unbranched2 and unbranched3 affect yield traits by regulating the rate of lateral primordia initiation. Proc. Natl. Acad. Sci. USA 2014, 111, 18775–18780. [Google Scholar] [CrossRef] [PubMed] [Green Version]
  19. McSteen, P.; Hake, S. barren inflorescence2 regulates axillary meristem development in the maize inflorescence. Development 2001, 128, 2881–2891. [Google Scholar] [CrossRef]
  20. Skirpan, A.; Culler, A.H.; Gallavotti, A.; Jackson, D.; Cohen, J.D.; McSteen, P. BARREN INFLORESCENCE2 Interaction with ZmPIN1a Suggests a Role in Auxin Transport during Maize Inflorescence Development. Plant Cell Physiol. 2009, 50, 652–657. [Google Scholar] [CrossRef] [Green Version]
  21. Qin, X.E.; Tian, S.K.; Zhang, W.L.; Dong, X.; Ma, C.X.; Wang, Y.; Yan, J.B.; Yue, B. Q(Dtbn1), an F-box gene affecting maize tassel branch number by a dominant model. Plant Biotechnol. J. 2021, 19, 1183–1194. [Google Scholar] [CrossRef] [PubMed]
  22. Bomblies, K.; Wang, R.L.; Ambrose, B.A.; Schmidt, R.J.; Meeley, R.B.; Doebley, J. Duplicate FLORICAULA/LEAFY homologs zfl1 and zfl2 control inflorescence architecture and flower patterning in maize. Development 2003, 130, 2385–2395. [Google Scholar] [CrossRef] [PubMed] [Green Version]
  23. Hemsley, P.A.; Kemp, A.C.; Grierson, C.S. The TIP GROWTH DEFECTIVE1 S-acyl transferase regulates plant cell growth in Arabidopsis. Plant Cell 2005, 17, 2554–2563. [Google Scholar] [CrossRef] [PubMed] [Green Version]
  24. Zhou, B.; Lin, J.Z.; Peng, D.; Yang, Y.Z.; Guo, M.; Tang, D.Y.; Tan, X.F.; Liu, X.M. Plant architecture and grain yield are regulated by the novel DHHC-type zinc finger protein genes in rice (Oryza sativa L.). Plant Sci. 2017, 254, 12–21. [Google Scholar] [CrossRef] [PubMed]
  25. Pang, H.G.; Yan, Q.; Zhao, S.L.; He, F.; Xu, J.F.; Qi, B.X.; Zhang, Y.X. Knockout of the S-acyltransferase Gene, PbPAT14, Confers the Dwarf Yellowing Phenotype in First Generation Pear by ABA Accumulation. Int. J. Mol. Sci. 2019, 20, 6347. [Google Scholar] [CrossRef] [PubMed] [Green Version]
  26. Zhang, X.M.; Mi, Y.; Mao, H.D.; Liu, S.X.; Chen, L.M.; Qin, F. Genetic variation in ZmTIP1 contributes to root hair elongation and drought tolerance in maize. Plant Biotechnol. J. 2020, 18, 1271–1283. [Google Scholar] [CrossRef] [Green Version]
  27. Yuan, X.W.; Zhang, S.Z.; Sun, M.H.; Liu, S.Y.; Qi, B.X.; Li, X.Z. Putative DHHC-Cysteine-Rich Domain S-Acyltransferase in Plants. PLoS ONE 2013, 8, e75985. [Google Scholar] [CrossRef] [Green Version]
  28. Pang, J.L.; Fu, J.J.; Zong, N.; Wang, J.; Song, D.D.; Zhang, X.; He, C.; Fang, T.; Zhang, H.W.; Fan, Y.L.; et al. Kernel size-related genes revealed by an integrated eQTL analysis during early maize kernel development. Plant J. 2019, 98, 19–32. [Google Scholar] [CrossRef]
  29. Fu, J.J.; Cheng, Y.B.; Linghu, J.J.; Yang, X.H.; Kang, L.; Zhang, Z.X.; Zhang, J.; He, C.; Du, X.M.; Peng, Z.Y.; et al. RNA sequencing reveals the complex regulatory network in the maize kernel. Nat. Commun. 2013, 4, 3832. [Google Scholar] [CrossRef] [Green Version]
  30. Berke, T.G.; Rocheford, T.R. Quantitative trait loci for tassel traits in maize. Crop Sci. 1999, 39, 1439–1443. [Google Scholar] [CrossRef]
  31. Mickelson, S.M.; Stuber, C.S.; Senior, L.; Kaeppler, S.M. Quantitative trait loci controlling leaf and tassel traits in a B73 x MO17 population of maize. Crop Sci. 2002, 42, 1902–1909. [Google Scholar] [CrossRef]
  32. Chen, Z.L.; Wang, B.B.; Dong, X.M.; Liu, H.; Ren, L.H.; Chen, J.; Hauck, A.; Song, W.B.; Lai, J.S. An ultra-high density bin-map for rapid QTL mapping for tassel and ear architecture in a large F2 maize population. BMC Genom. 2014, 15, 433. [Google Scholar] [CrossRef] [PubMed] [Green Version]
  33. Chen, Z.J.; Yang, C.; Tang, D.G.; Zhang, L.; Zhang, L.; Qu, J.T.; Liu, J. Dissection of the genetic architecture for tassel branch number by QTL analysis in two related populations in maize. J. Integr. Agric. 2017, 16, 1432–1442. [Google Scholar] [CrossRef] [Green Version]
  34. Yang, N.; Lu, Y.L.; Yang, X.H.; Huang, J.; Zhou, Y.; Ali, F.; Wen, W.W.; Liu, J.; Li, J.S.; Yan, J.B. Genome Wide Association Studies Using a New Nonparametric Model Reveal the Genetic Architecture of 17 Agronomic Traits in an Enlarged Maize Association Panel. PLoS Genet. 2014, 10, e1004573. [Google Scholar] [CrossRef] [PubMed] [Green Version]
  35. Lin, H.Y.; Liu, Q.; Li, X.; Yang, J.L.; Liu, S.Z.; Huang, Y.L.; Scanlon, M.J.; Nettleton, D.; Schnable, P.S. Substantial contribution of genetic variation in the expression of transcription factors to phenotypic variation revealed by eRD-GWAS. Genome Biol. 2017, 18, 192. [Google Scholar] [CrossRef]
  36. Hemsley, P.A.; Weimar, T.; Lilley, K.S.; Dupree, P.; Grierson, C.S. A proteomic approach identifies many novel palmitoylated proteins in Arabidopsis. New Phytol. 2013, 197, 805–814. [Google Scholar] [CrossRef] [Green Version]
  37. Peng, D.; Tan, X.F.; Zhang, L.; Yuan, D.Y.; Lin, J.Z.; Liu, X.M.; Jiang, Y.Q.; Zhou, B. Increasing branch and seed yield through heterologous expression of the novel rice S-acyl transferase gene OsPAT15 in Brassica napus L. Breed. Sci. 2018, 68, 326–335. [Google Scholar] [CrossRef] [Green Version]
  38. Lai, J.B.; Yu, B.Y.; Cao, Z.D.; Chen, Y.M.; Wu, Q.; Huang, J.Y.; Yang, C.W. Two homologous protein S-acyltransferases, PAT13 and PAT14, cooperatively regulate leaf senescence in Arabidopsis. J. Exp. Bot. 2015, 66, 6345–6353. [Google Scholar] [CrossRef] [Green Version]
  39. Li, Y.X.; Scott, R.; Doughty, J.; Grant, M.; Qi, B.X. Protein S-Acyltransferase 14: A Specific Role for Palmitoylation in Leaf Senescence in Arabidopsis. Plant Physiol. 2016, 170, 415–428. [Google Scholar] [CrossRef] [PubMed] [Green Version]
  40. Qi, B.X.; Doughty, J.; Hooley, R. A Golgi and tonoplast localized S-acyl transferase is involved in cell expansion, cell division, vascular patterning and fertility in Arabidopsis. New Phytol. 2013, 200, 443–454. [Google Scholar] [CrossRef] [Green Version]
  41. Zhou, L.Z.; Li, S.; Feng, Q.N.; Zhang, Y.L.; Zhao, X.Y.; Zeng, Y.L.; Wang, H.; Jiang, L.W.; Zhang, Y. PROTEIN S-ACYL TRANSFERASE10 is Critical for Development and Salt Tolerance in Arabidopsis. Plant Cell 2013, 25, 1093–1107. [Google Scholar] [CrossRef] [Green Version]
  42. Wan, Z.Y.; Chai, S.; Ge, F.R.; Feng, Q.N.; Zhang, Y.; Li, S. Arabidopsis PROTEIN S-ACYL TRANSFERASE4 mediates root hair growth. Plant J. 2017, 90, 249–260. [Google Scholar] [CrossRef] [PubMed] [Green Version]
  43. Li, Y.X.; Li, H.J.; Morgan, C.; Bomblies, K.; Yang, W.C.; Qi, B.X. Both male and female gametogenesis require a fully functional protein S-acyl transferase 21 in Arabidopsis thaliana. Plant J. 2019, 100, 754–767. [Google Scholar] [CrossRef]
  44. Li, C.H.; Guan, H.H.; Jing, X.; Li, Y.Y.; Wang, B.B.; Li, Y.X.; Liu, X.Y.; Zhang, D.F.; Liu, C.; Xie, X.Q.; et al. Genomic Insights into Historical Improvement of Heterotic Groups during Modern Hybrid Maize Breeding; to be submitted; Institute of Crop Science, Chinese Academy of Agricultural Sciences: Beijing, China, 2022. [Google Scholar]
  45. Li, C.H.; Li, Y.X.; Bradbury, P.J.; Wu, X.; Shi, Y.S.; Song, Y.C.; Zhang, D.F.; Rodgers-Melnick, E.; Buckler, E.S.; Zhang, Z.W.; et al. Construction of high-quality recombination maps with low-coverage genomic sequencing for joint linkage analysis in maize. BMC Biol. 2015, 13, 78. [Google Scholar] [CrossRef] [PubMed] [Green Version]
  46. Wang, S.; Basten, C.J.; Zeng, Z.B. Windows QTL Cartographer 2.5 Department of Statistics; North Carolina State University: Raleigh, NC, USA, 2012; Available online: http://statgen.ncsu.edu/qtlcart/WQTLCart.htm (accessed on 15 May 2020).
  47. Liu, H.J.; Jian, L.M.; Xu, J.T.; Zhang, Q.H.; Zhang, M.L.; Jin, M.L.; Peng, Y.; Yan, J.L.; Han, B.Z.; Liu, J.; et al. High-Throughput CRISPR/Cas9 Mutagenesis Streamlines Trait Gene Identification in Maize. Plant Cell 2020, 32, 1397–1413. [Google Scholar] [CrossRef] [PubMed] [Green Version]
  48. Bradbury, P.J.; Zhang, Z.; Kroon, D.E.; Casstevens, T.M.; Ramdoss, Y.; Buckler, E.S. TASSEL: Software for association mapping of complex traits in diverse samples. Bioinformatics 2007, 23, 2633–2635. [Google Scholar] [CrossRef] [PubMed]
  49. Chen, C.J.; Chen, H.; Zhang, Y.; Thomas, H.R.; Frank, M.H.; He, Y.H.; Xia, R. TBtools: An Integrative Toolkit Developed for Interactive Analyses of Big Biological Data. Mol. Plant 2020, 13, 1194–1202. [Google Scholar] [CrossRef]
  50. Chow, C.N.; Lee, T.Y.; Hung, Y.C.; Li, G.Z.; Tseng, K.C.; Liu, Y.H.; Kuo, P.L.; Zheng, H.Q.; Chang, W.C. PlantPAN3.0: A new and updated resource for reconstructing transcriptional regulatory networks from ChIP-seq experiments in plants. Nucleic Acids Res. 2019, 47, D1155–D1163. [Google Scholar] [CrossRef] [PubMed] [Green Version]
Figure 1. QTLs detected for TBN in the B73 × CML247 RILs population. zfl2 and fea2 were colocated with qTBN2a and qTBN4, respectively.
Ijms 23 02586 g001
Figure 2. Phylogenetic tree of PAT proteins and the TBN performance in ZmPAT7 CRISPR/Cas9 mutants. (a) phylogenetic analysis of ZmPAT7 and 12 PAT proteins from other plants; (b) knockout of ZmPAT7 by CRISPR/Cas9 technology, the blue box is protospacer adjacent motif (PAM) sequence, the red font is single guide sequence (20 bp sequence adjacent to PAM) targeting ZmPAT7 in inbred line KN5585. Image (c) and statistics (d) show the TBN differences between wild-type (WT) and CRISPR-knockout (KO#1 and KO#2) plants. Data are represented as mean ± SD; ** indicates significant difference at 0.01 level by two-sided t-test.
Ijms 23 02586 g002
Figure 3. Genetic variations in the ZmPAT7 promoter are linked to TBN: (a) association analysis of the genetic variation in ZmPAT7 with TBN; (b) the TBN values of inbred lines of the four haplotypes are displayed in the box plot. Here, n denotes the number of inbred lines belonging to each haplotype group. Statistical significance was determined using a two-sided t-test. ** indicates significant difference at 0.01 level; ns indicates no significant difference. Image (c) and statistics (d) show the TBN differences between Zheng58 and Chang7-2. Values are represented as mean ± SD, and the p values of two-sided t-test are shown; (e) expression analysis of ZmPAT7 between the 20 lines with Hap1 and the 20 lines with Hap4.
Ijms 23 02586 g003
Figure 4. eQTL analysis for ZmPAT7: (a) the expression of ZmPAT7 at the V5 stage negatively correlated with TBN (b) Manhattan plot for eQTL analysis, with the suggestive threshold of 1.0 × 10⁻⁵.
Ijms 23 02586 g004
Table 1. List of QTL for TBN in the B73 × CML247 RILs population.
QTLChrPeaks (cM)Interval (cM)LODInterval (Mb)AddR2 (%)Number of Genes in the Interval
qTBN2a230.1217.25–37.374.247.85–14.72−0.566.08571
qTBN2b2192.7187.05–199.073.69233.63–236.440.565.21217
qTBN4468.0961.14–77.3910.4758.51–134.620.9316.222510
qTBN66104.699.09–109.456.47152.15–156.88−0.79.53413
Table 2. List of colocated SNPs and the annotation of candidate genes.
QTLTag SNPsChrPos (bp)p ValueCandidate Genes That near the Tag SNPs
qTBN2aS2_880901828,809,0183.77 × 10−10GRMZM2G002559; GRMZM2G302701; GRMZM2G302712
S2_888927828,889,2783.31 × 109GRMZM5G897776
S2_944304629,443,0461.09 × 10−10GRMZM2G080041; GRMZM2G080054
S2_11829845211,829,8455.70 × 10−10GRMZM2G392125; GRMZM2G091118; GRMZM2G090872
S2_12687587212,687,5875.61 × 10−11GRMZM2G149556
S2_12691259212,691,2597.73 × 10−10GRMZM2G149556
S2_12798388212,798,3889.40 × 10−11GRMZM2G024898
S2_12898426212,898,4262.16 × 10−11GRMZM2G463280; GRMZM2G463267; GRMZM2G162266
S2_13299879213,299,8794.32 × 10−10GRMZM2G038722; GRMZM2G038714; GRMZM2G342039
S2_13636982213,636,9824.49 × 10−10
S2_13638186213,638,1868.50 × 109GRMZM2G090332
S2_14264763214,264,7633.38 × 109GRMZM2G163067
S2_14267757214,267,7573.8 × 10−10GRMZM2G163067
S2_14467324214,467,3241.38 × 10−10GRMZM2G146866; GRMZM2G146847; GRMZM2G010011
S2_14541295214,541,2952.43 × 10−10GRMZM2G314396; GRMZM2G017197; GRMZM2G314386; GRMZM2G314412
qTBN2bS2_2336323882233,632,3885.21 × 10−10GRMZM2G176347; GRMZM2G176375
S2_2345313252234,531,3251.94 × 10−10GRMZM2G423640; GRMZM2G423636
S2_2347073062234,707,3061.46 × 109GRMZM2G324507
S2_2358027952235,802,7951.03 × 10−10GRMZM2G347995
qTBN4S4_66857201466,857,2013.35 × 10−10GRMZM2G399421
S4_66908736466,908,7361.39 × 10−10GRMZM2G030628
S4_71986141471,986,1417.14 × 10−12GRMZM2G448456
PZE-1040612794120,847,6213.38 × 106
S4_1227479784122,747,9781.53 × 10−12
qTBN6S6_1532068736153,206,8732.97 × 10−12GRMZM2G359892
Table 3. List of eQTL for ZmPAT7 and the annotation of candidate genes.
Code of eQTLPeak_SNPp_ValueV4_Gene_IdAnnotation
eQTL-12:26,517,6523.05 × 10−6Zm00001d002917RNA-binding region RNP-1
eQTL-22:33,010,6374.51 × 10−6Zm00001d003123NA
Zm00001d003124DNA glycosylase superfamily protein
Zm00001d003125Uncharacterized protein
eQTL-32:52,125,7426.25 × 10−6
eQTL-42:104,153,3167.62 × 10−6Zm00001d004336NA
eQTL-52:115,870,5889.34 × 10−6Zm00001d004509Terpene synthase 7
Zm00001d004512Transcription factor E2FC
Zm00001d004513Bifunctional 3-phosphoadenosine 5-phosphosulfate synthetase 2
eQTL-62:122,415,9242.26 × 10−6Zm00001d004619NA
eQTL-72:131,987,6621.27 × 10−6Zm00001d004697IAA27-auxin-responsive Aux/IAA family member
Zm00001d004698Serine–threonine-protein kinase-like protein CCR4
eQTL-82:147,699,0718.28 × 10−6Zm00001d004897Basic-leucine zipper (bZIP) transcription factor family protein
eQTL-92:158,878,8098.32 × 10−6Zm00001d005112SAC3 family protein B
eQTL-103:194,080,8388.12 × 10−6Zm00001d043273SR protein related family member
Zm00001d043274Insulin-degrading enzyme-like 1 peroxisomal
Zm00001d043275Vacuole membrane protein KMS1
eQTL-113:200,375,4479.92 × 10−6Zm00001d043444plant-specific domain TIGR01615 family protein expressed
Zm00001d043445Dihydroorotase
Zm00001d043446Uncharacterized protein
Zm00001d043447PP2A
Zm00001d043449RNA-binding S4 domain-containing protein
Zm00001d043450DNA-binding WRKY
Zm00001d043451Dynamin-related protein 5A
Zm00001d043452Hox2a protein
Zm00001d043453Early nodulin-like protein 3
Zm00001d043454Uncharacterized protein
eQTL-123:200,789,0188.80 × 10−6Zm00001d043461ZCN12
Zm00001d043462Uncharacterized protein
Zm00001d043463Protein NRT1/PTR FAMILY 4.2
Zm00001d043464Oil body-associated protein 2A
Zm00001d04346550S ribosomal protein L13 chloroplastic
eQTL-135:143,694,8855.49 × 10−6Zm00001d016083NA
Zm00001d016084Pre-mRNA-splicing factor 3
Zm00001d016085Putative uncharacterized protein
eQTL-145:163,991,5168.74 × 10−6Zm00001d016477Eukaryotic aspartyl protease family protein
eQTL-155:170,985,1321.02 × 10−6Zm00001d016636Putative uncharacterized protein
Zm00001d016637NA
eQTL-166:151,600,4886.51 × 10−6Zm00001d038205MLO-like protein
Zm00001d038206Pentatricopeptide repeat-containing protein mitochondrial
Zm00001d038207ZmNAC3, NAC domain-containing protein 35
eQTL-177:145,022,1656.56 × 10−6Zm00001d021172NA
Zm00001d021173Formin-like protein 1
Zm00001d021176Disease resistance protein RPM1
Zm00001d021177NA
Publisher’s Note: MDPI stays neutral with regard to jurisdictional claims in published maps and institutional affiliations.

