
Computational Characterization of Mechanical, Hemodynamic, and Surface Interaction Conditions: Role of Protein Adsorption on the Regenerative Response of TEVGs

 ,
,  ,
,  ,
,  ,
,  and
and
Abstract
1. Introduction
2. Results
2.1. Fluid Model
2.2. Two-Way FSI Model
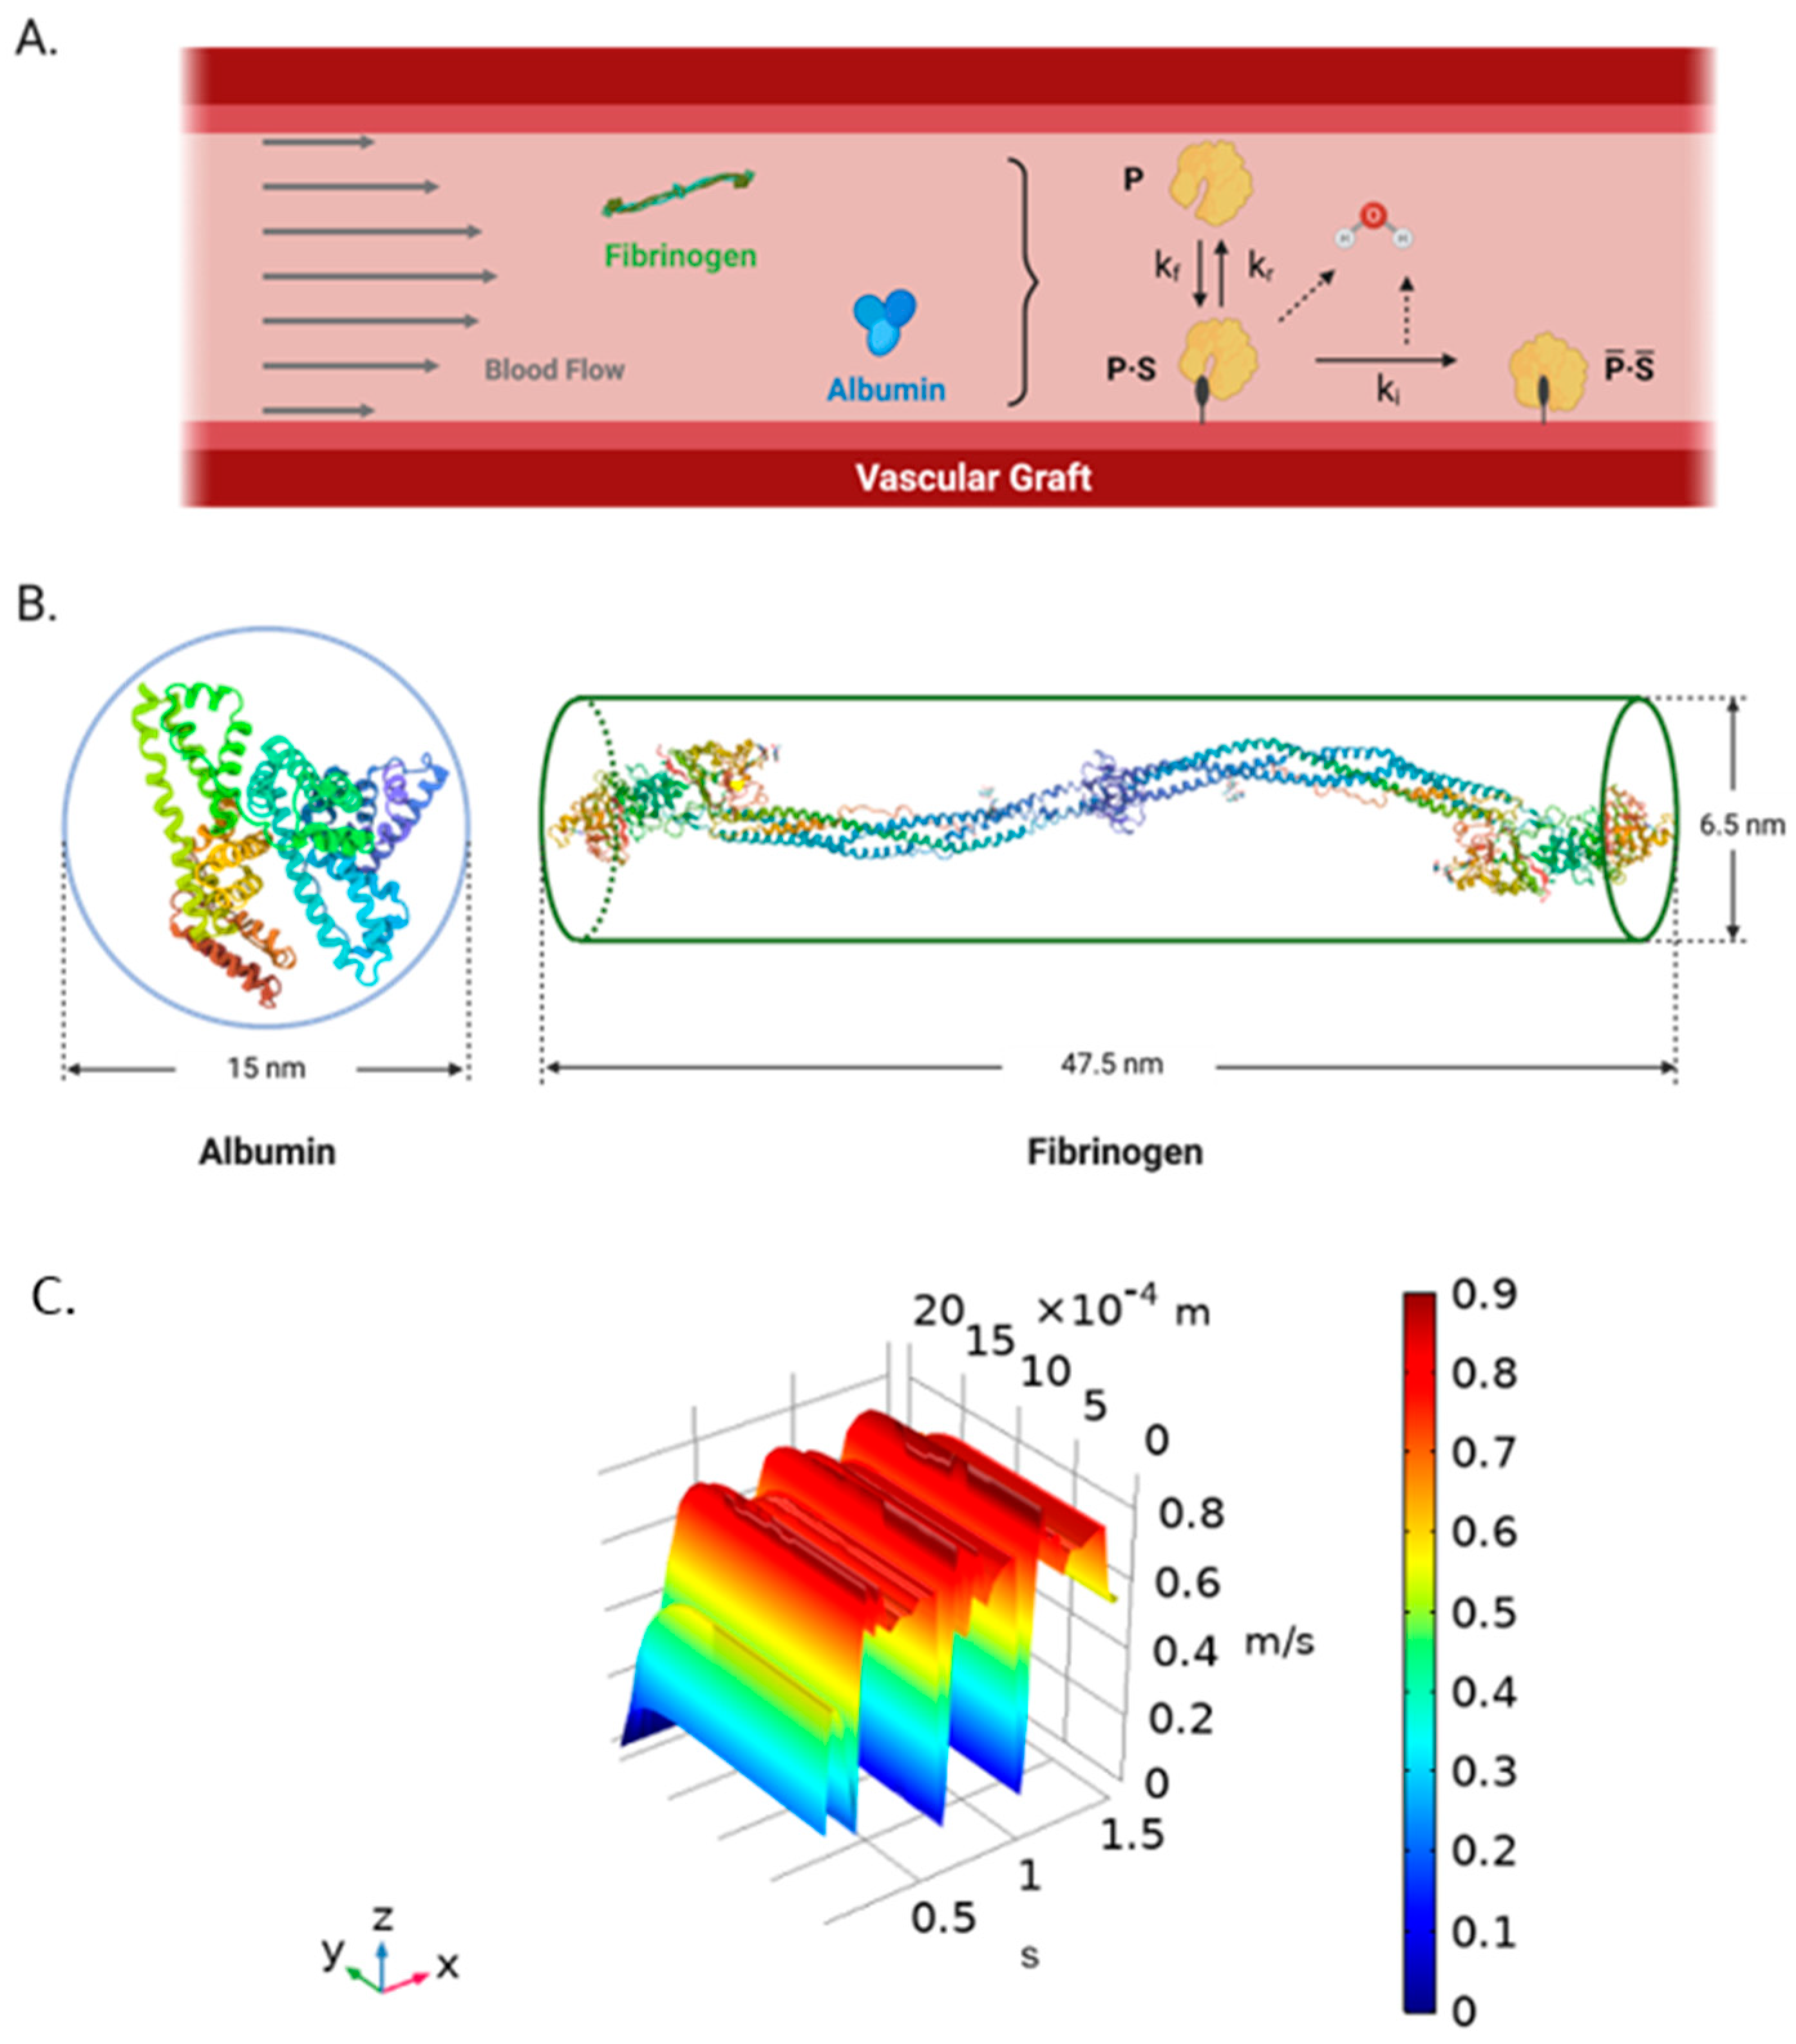
2.3. Kinetic Model
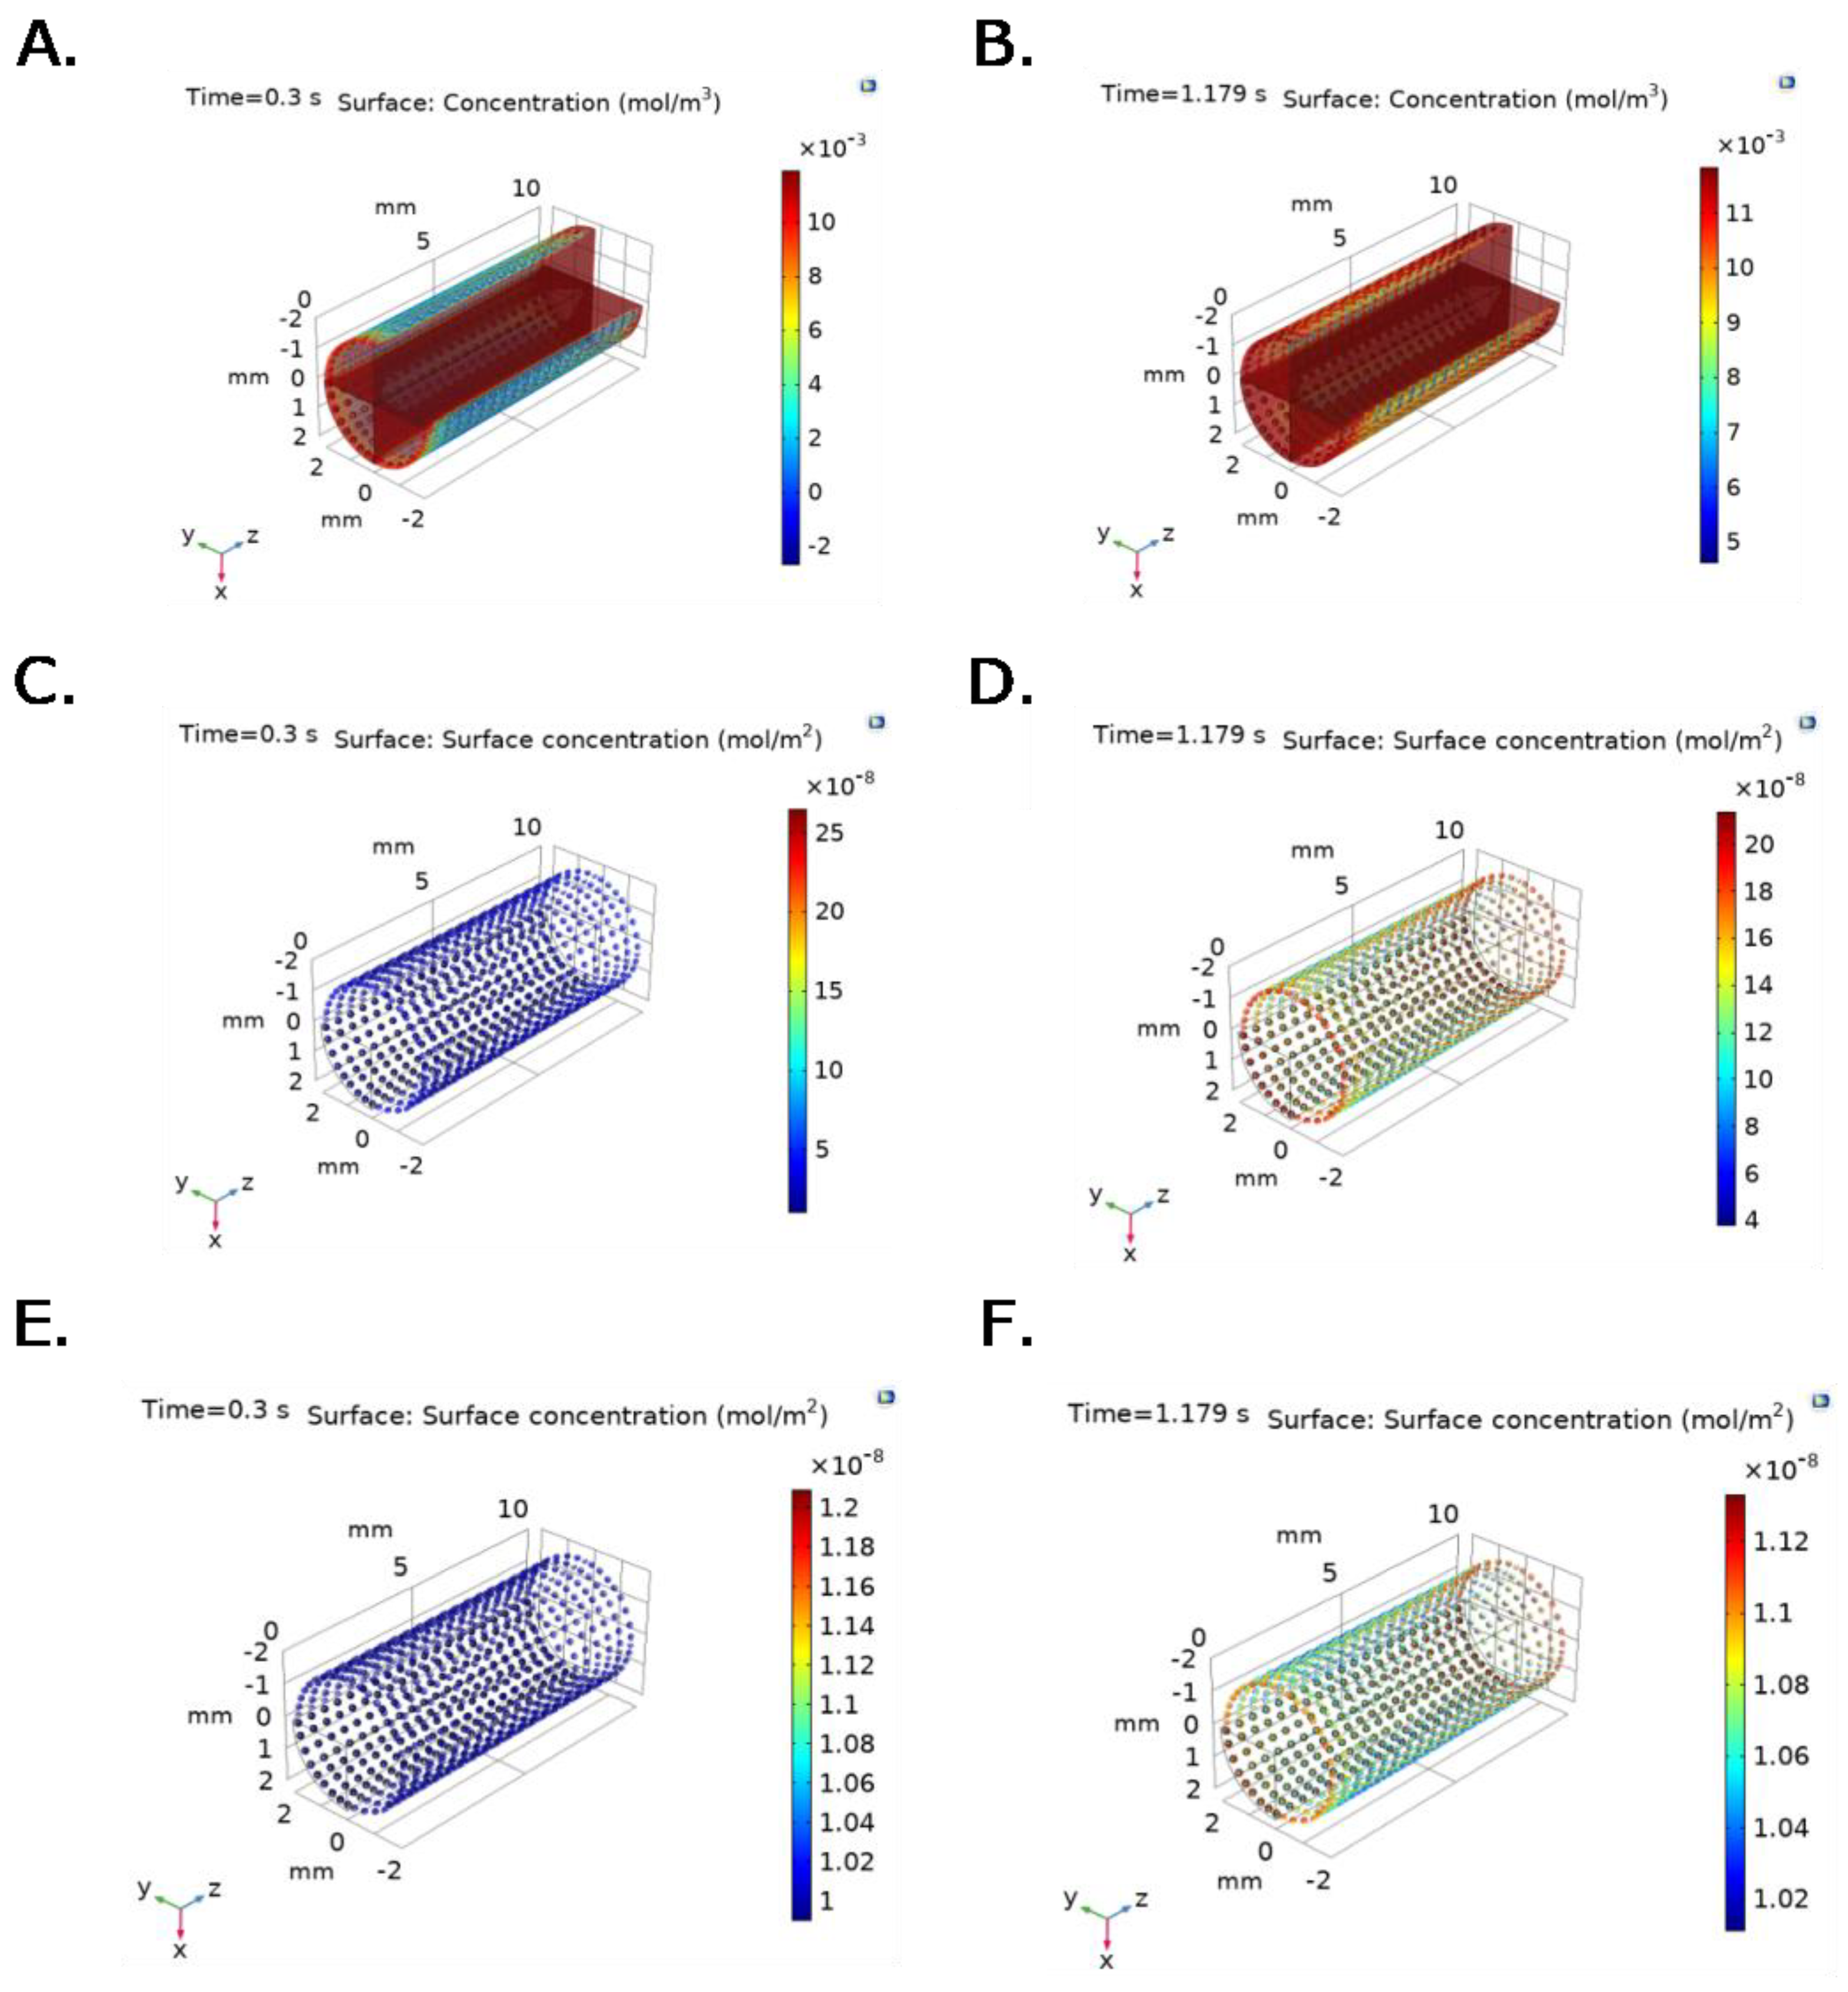
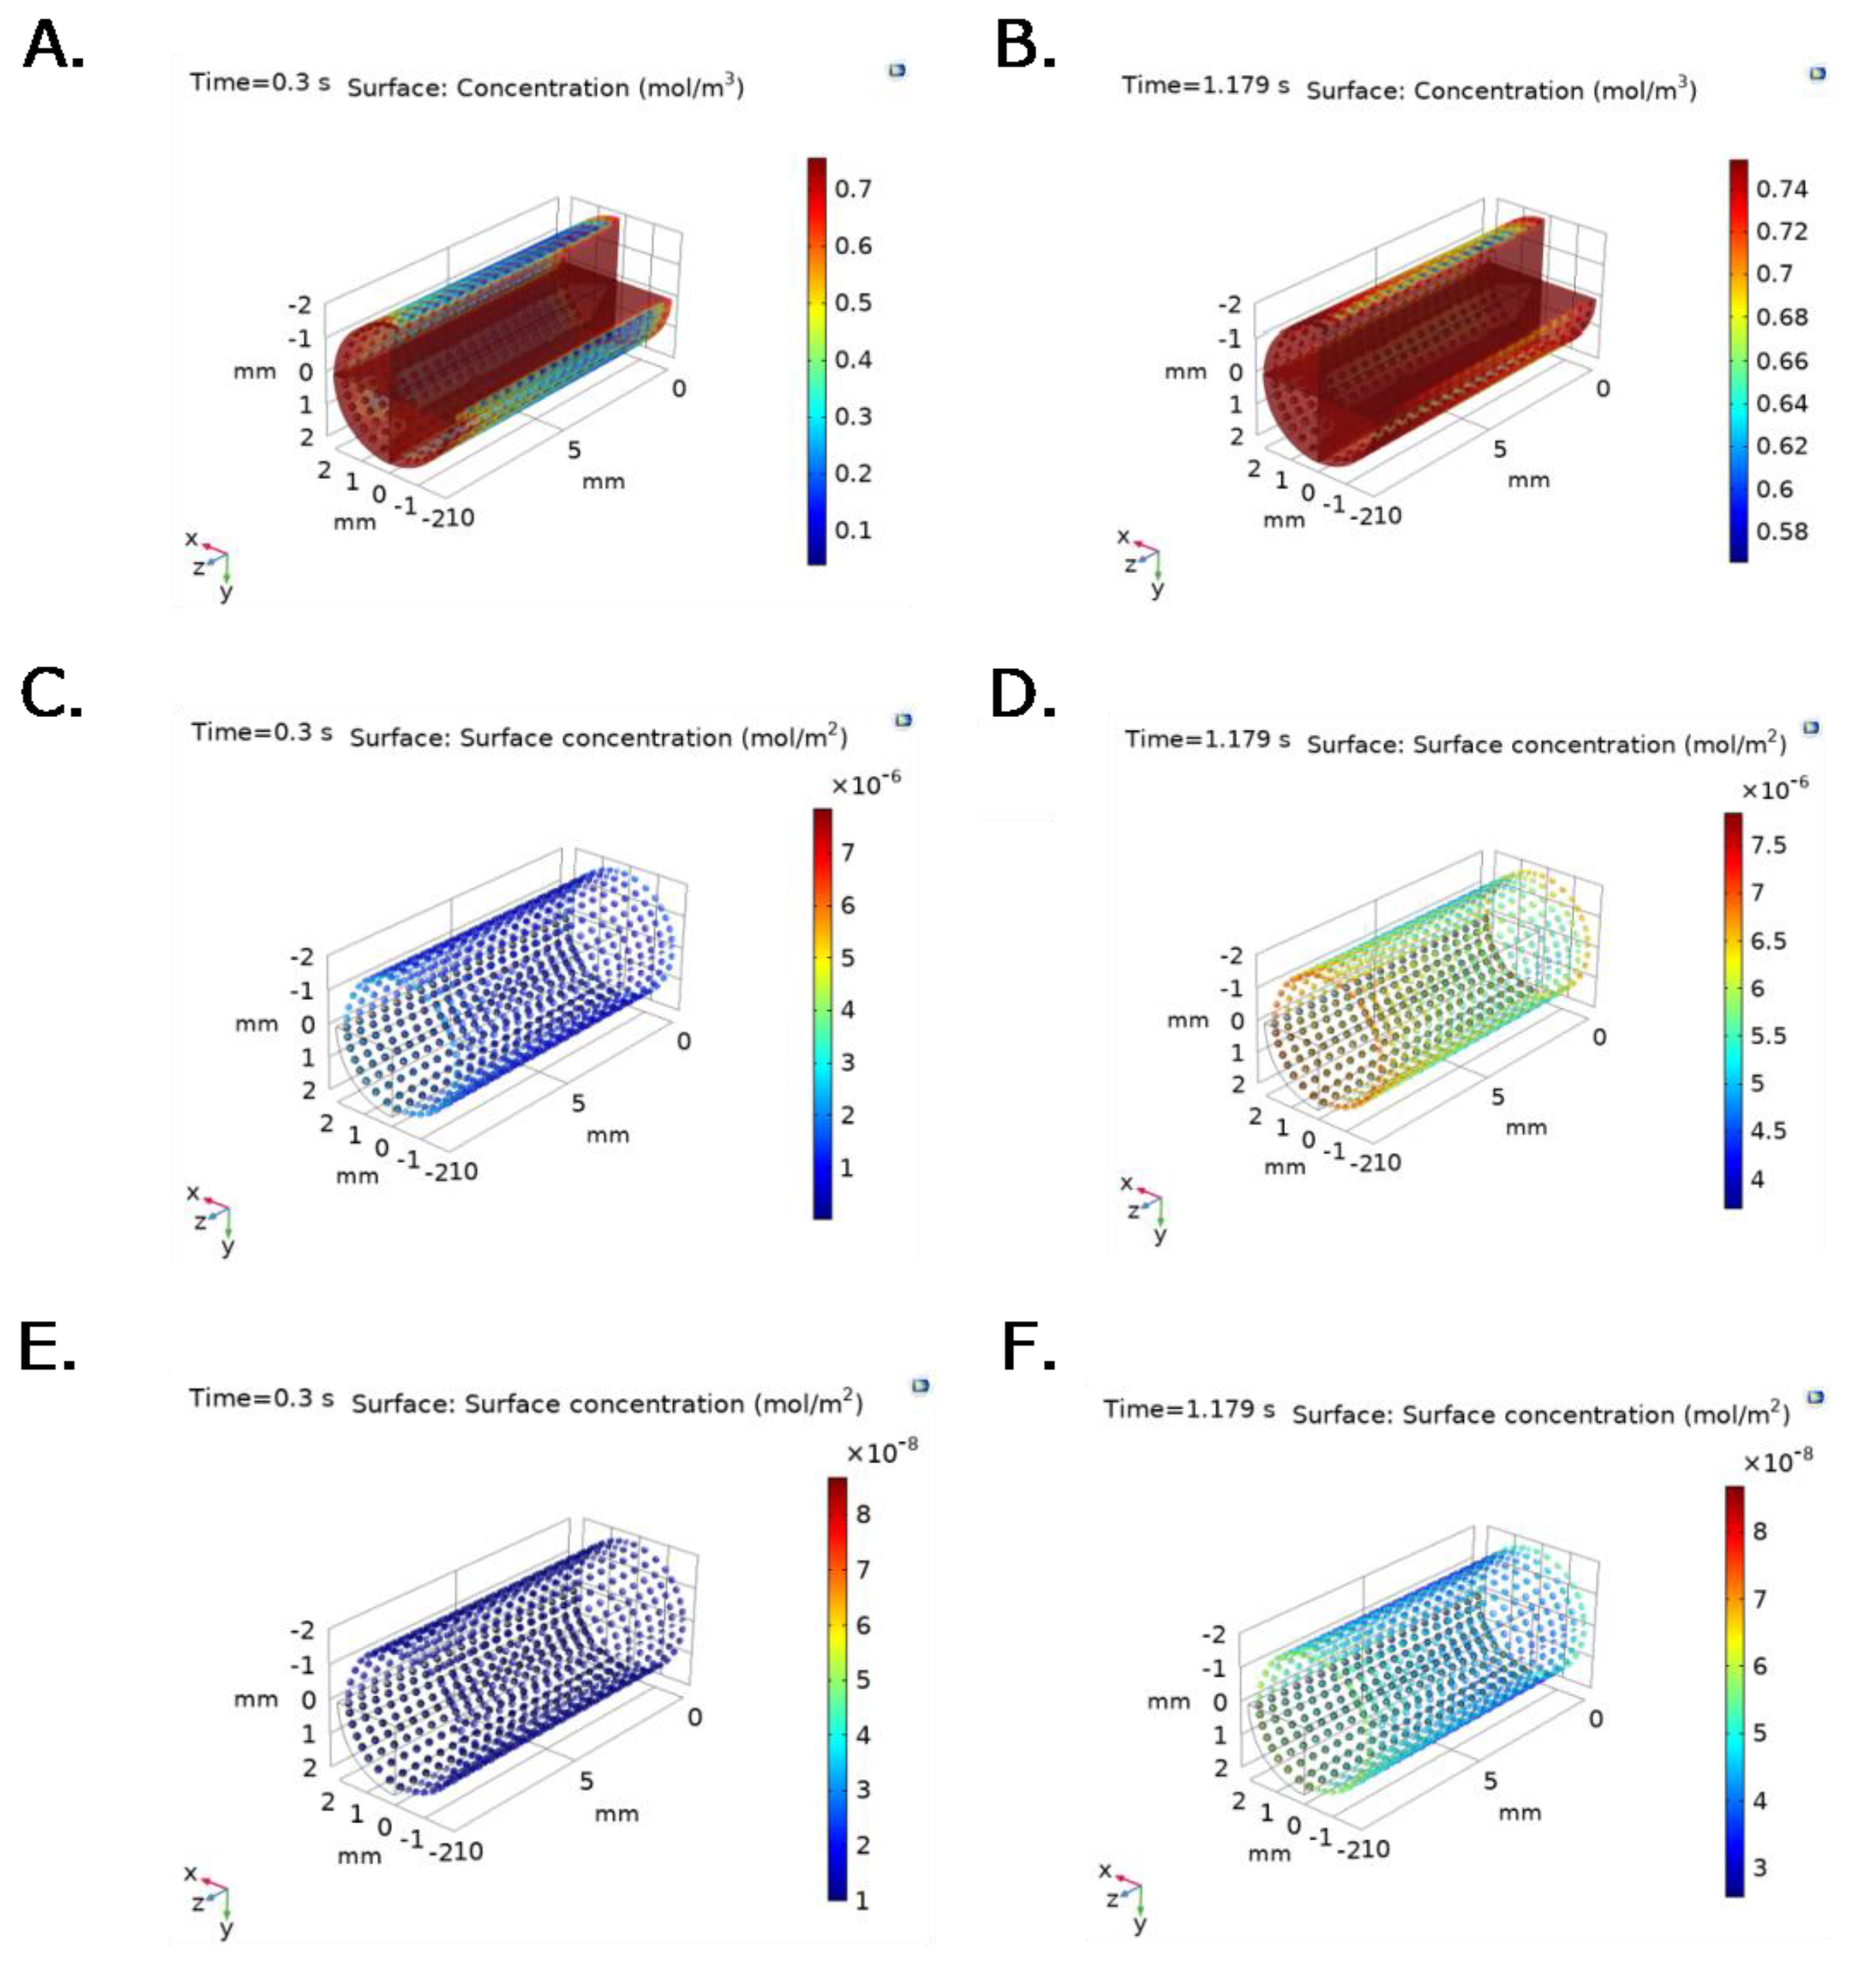
2.4. Two-Way FSI and Protein Adsorption Models Coupling
3. Discussion
4. Materials and Methods
4.1. Two-Way Fluid-Structure Interaction Model
4.2. Structural Model
4.3. Flow Model
4.4. Fluid and Transient Structural Models Coupling
4.5. Protein Adsorption on TEVG: Biochemical Parameters
4.6. Two-Way FSI and Protein Adsorption Models Coupling
5. Conclusions
Supplementary Materials
Author Contributions
Funding
Institutional Review Board Statement
Informed Consent Statement
Data Availability Statement
Acknowledgments
Conflicts of Interest
Appendix A
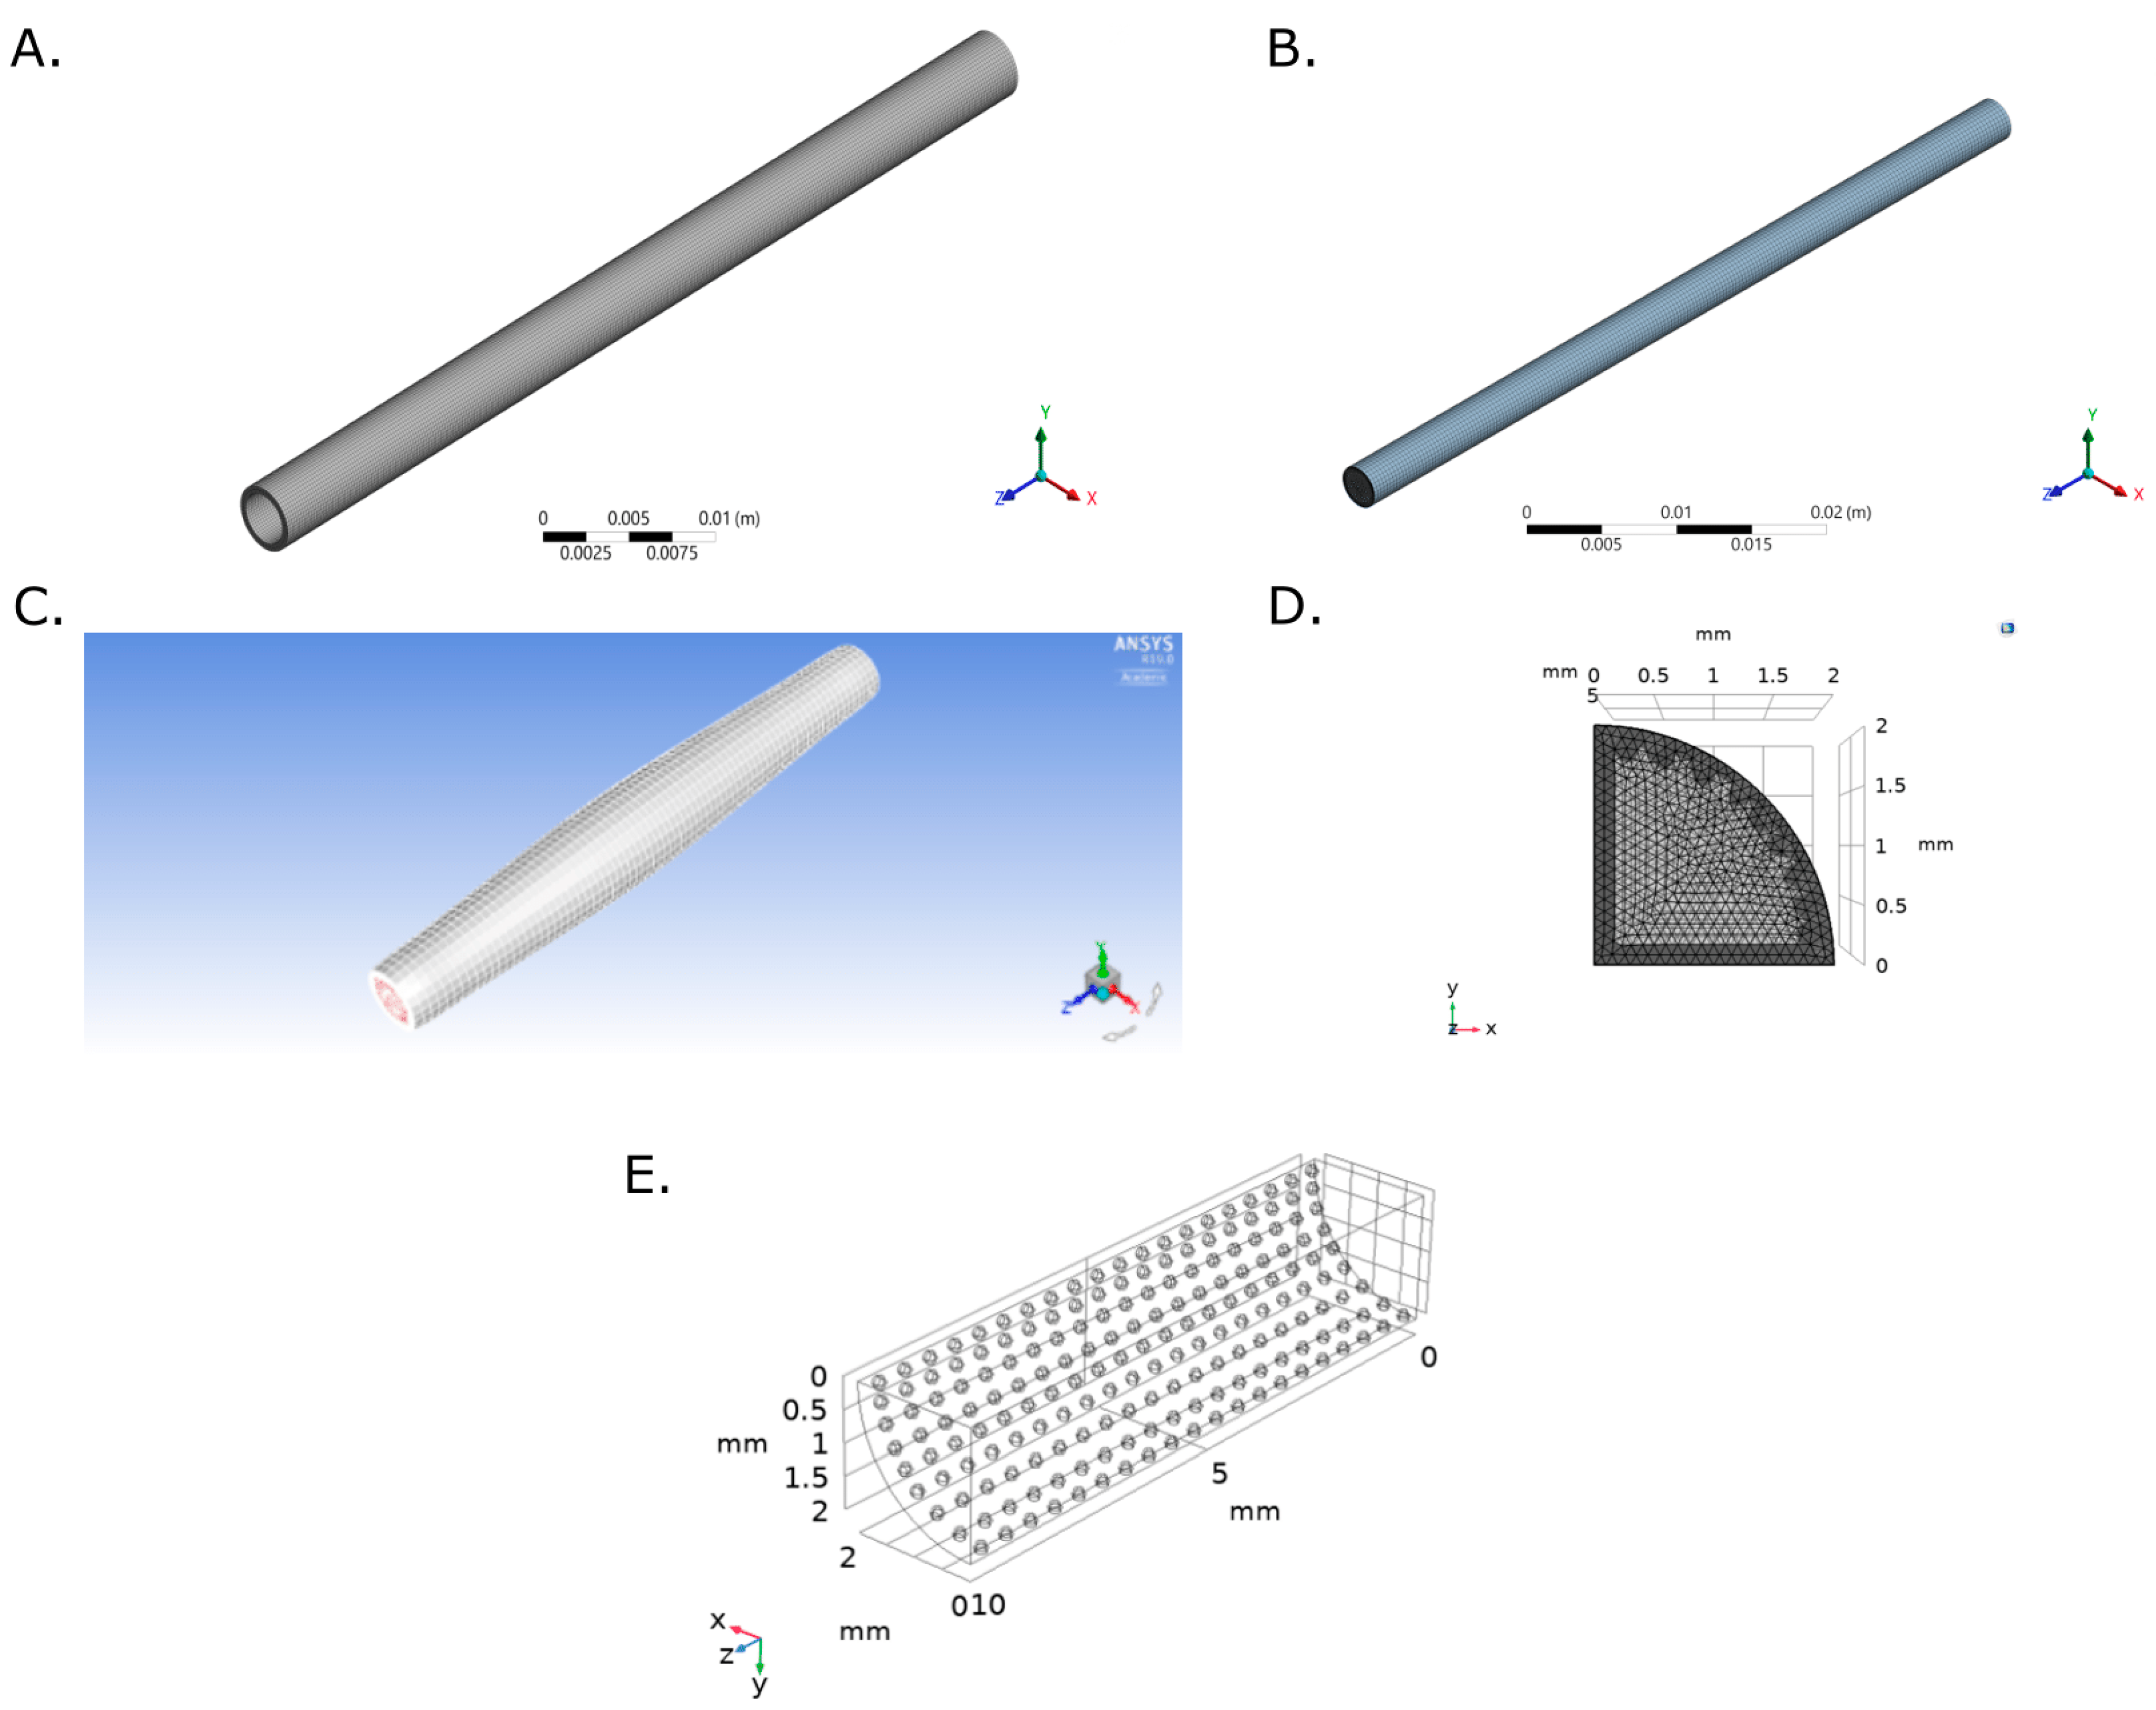
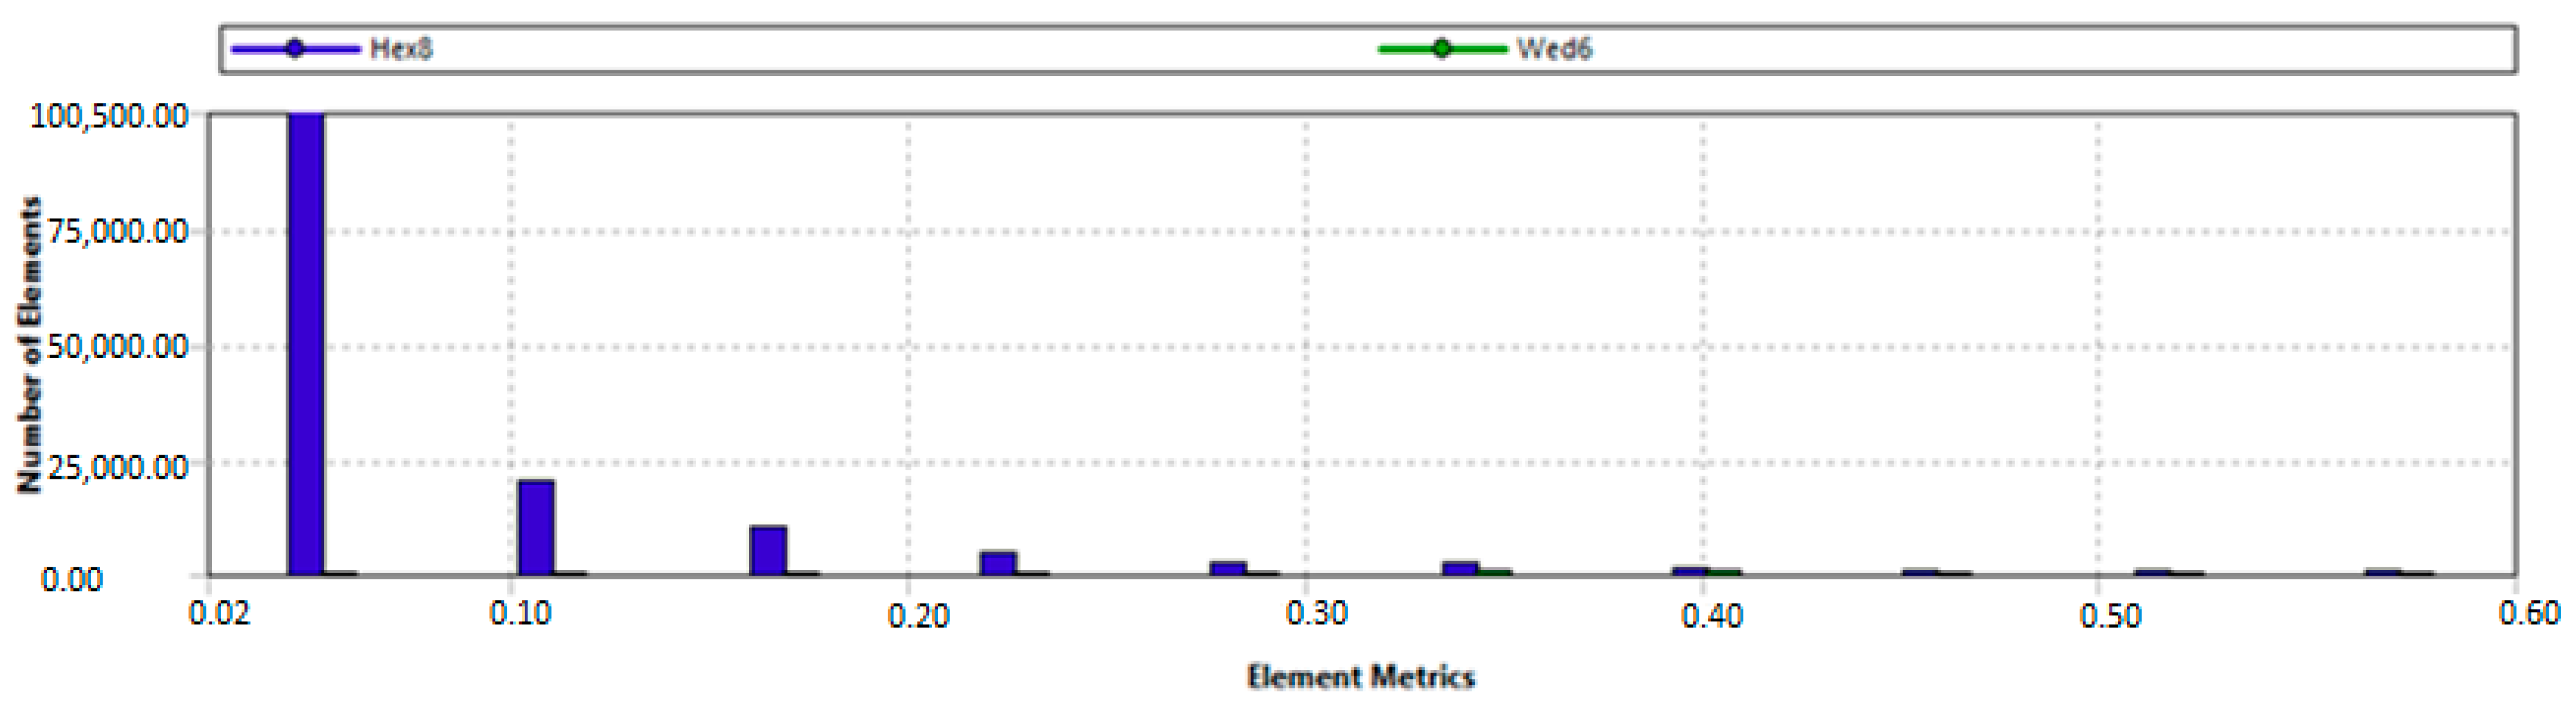
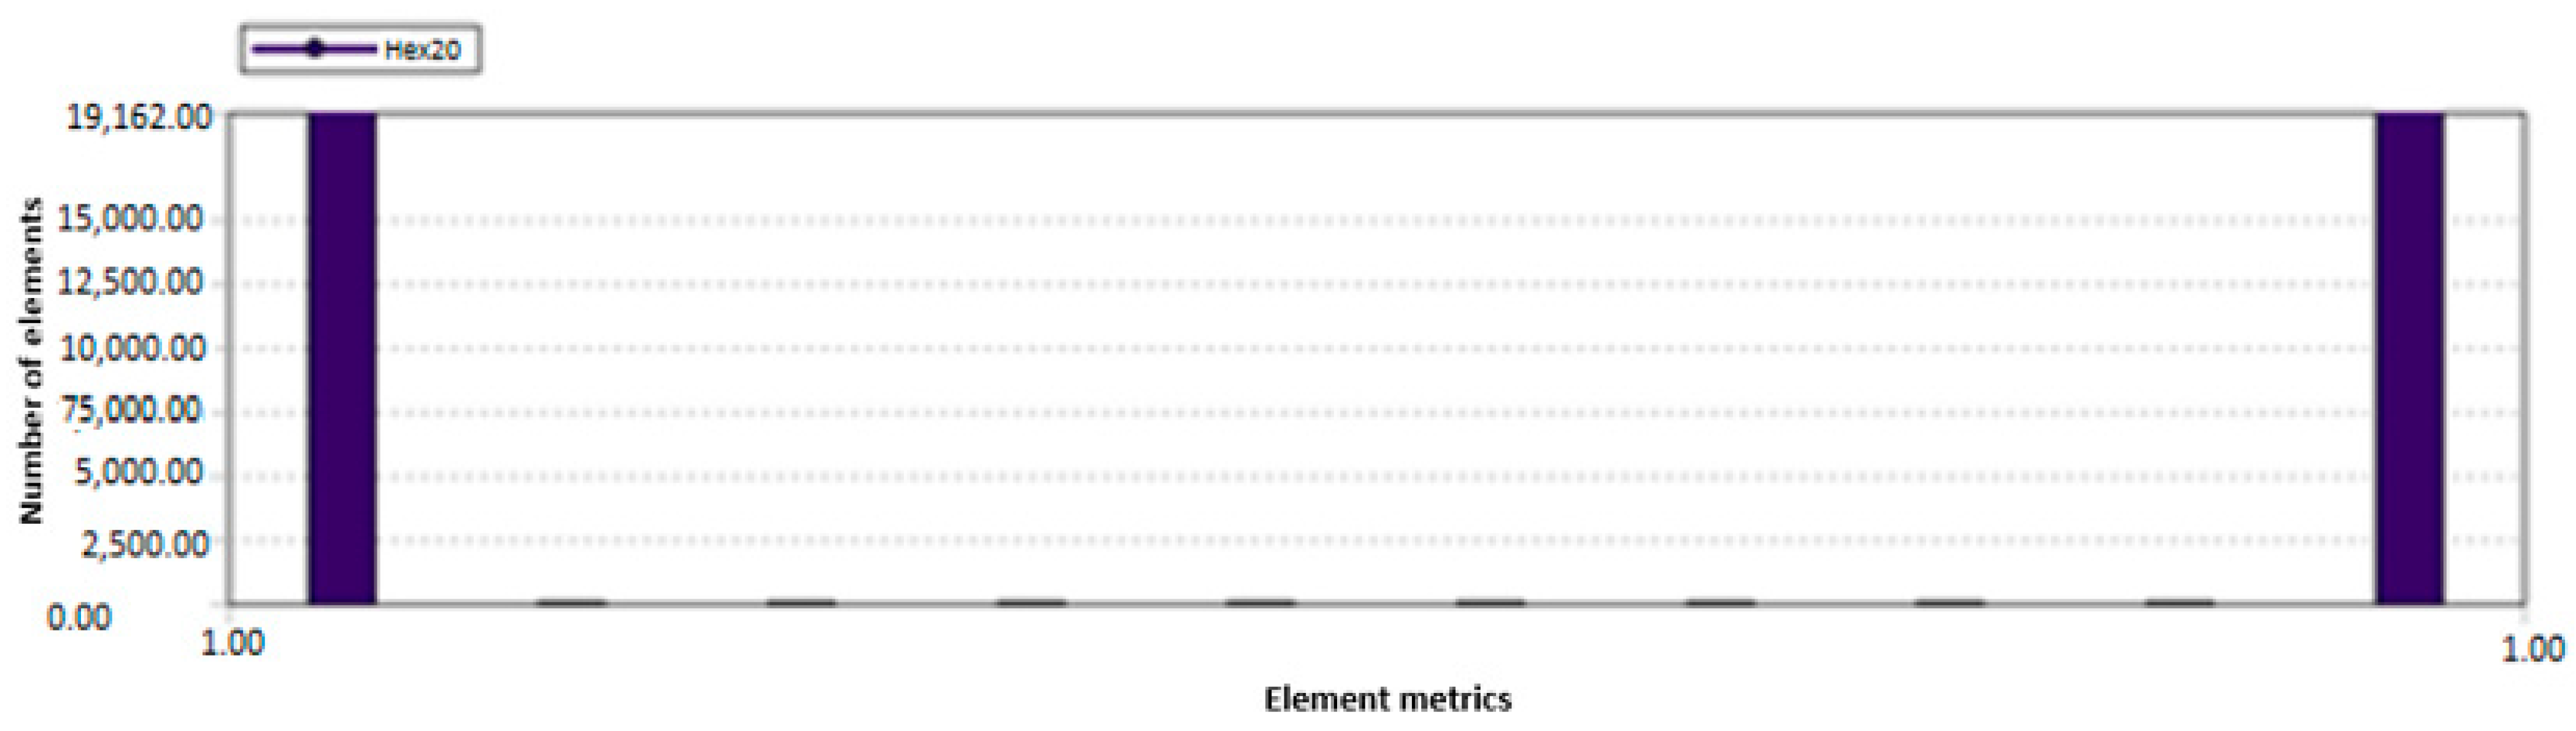
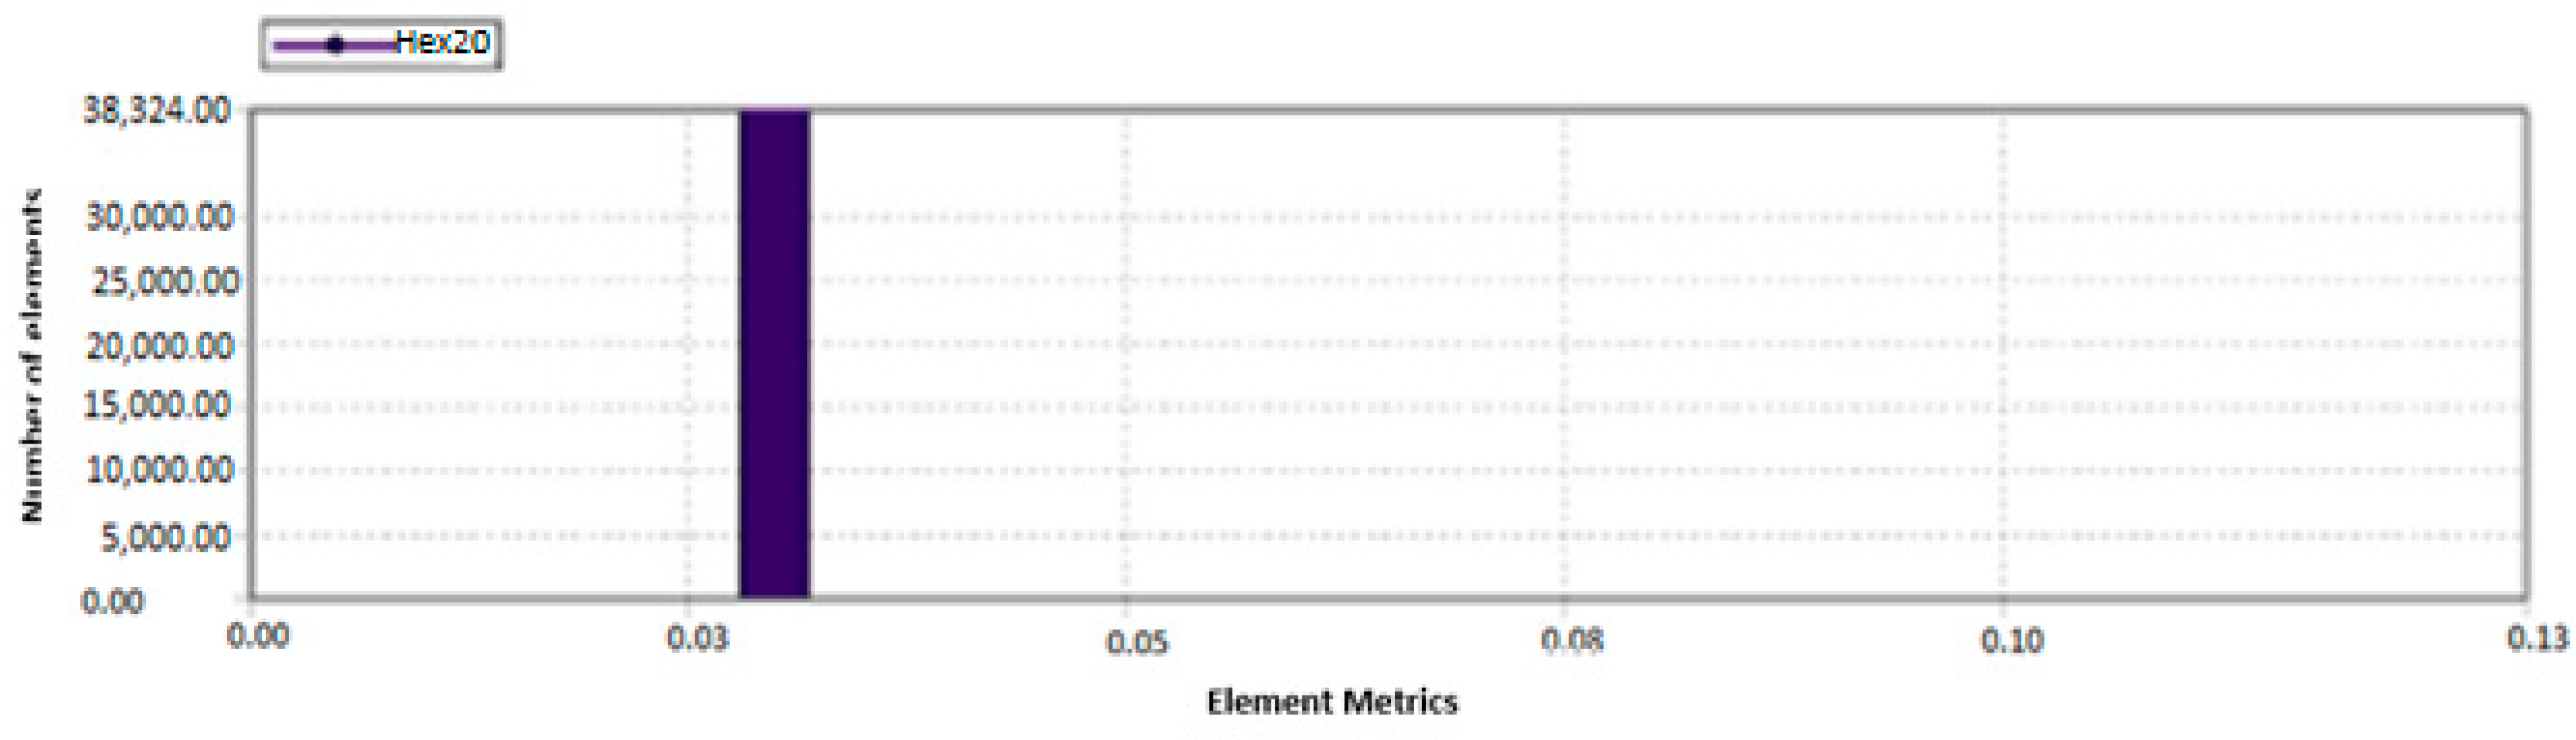
- Mesh quality ANSYS models


Appendix B
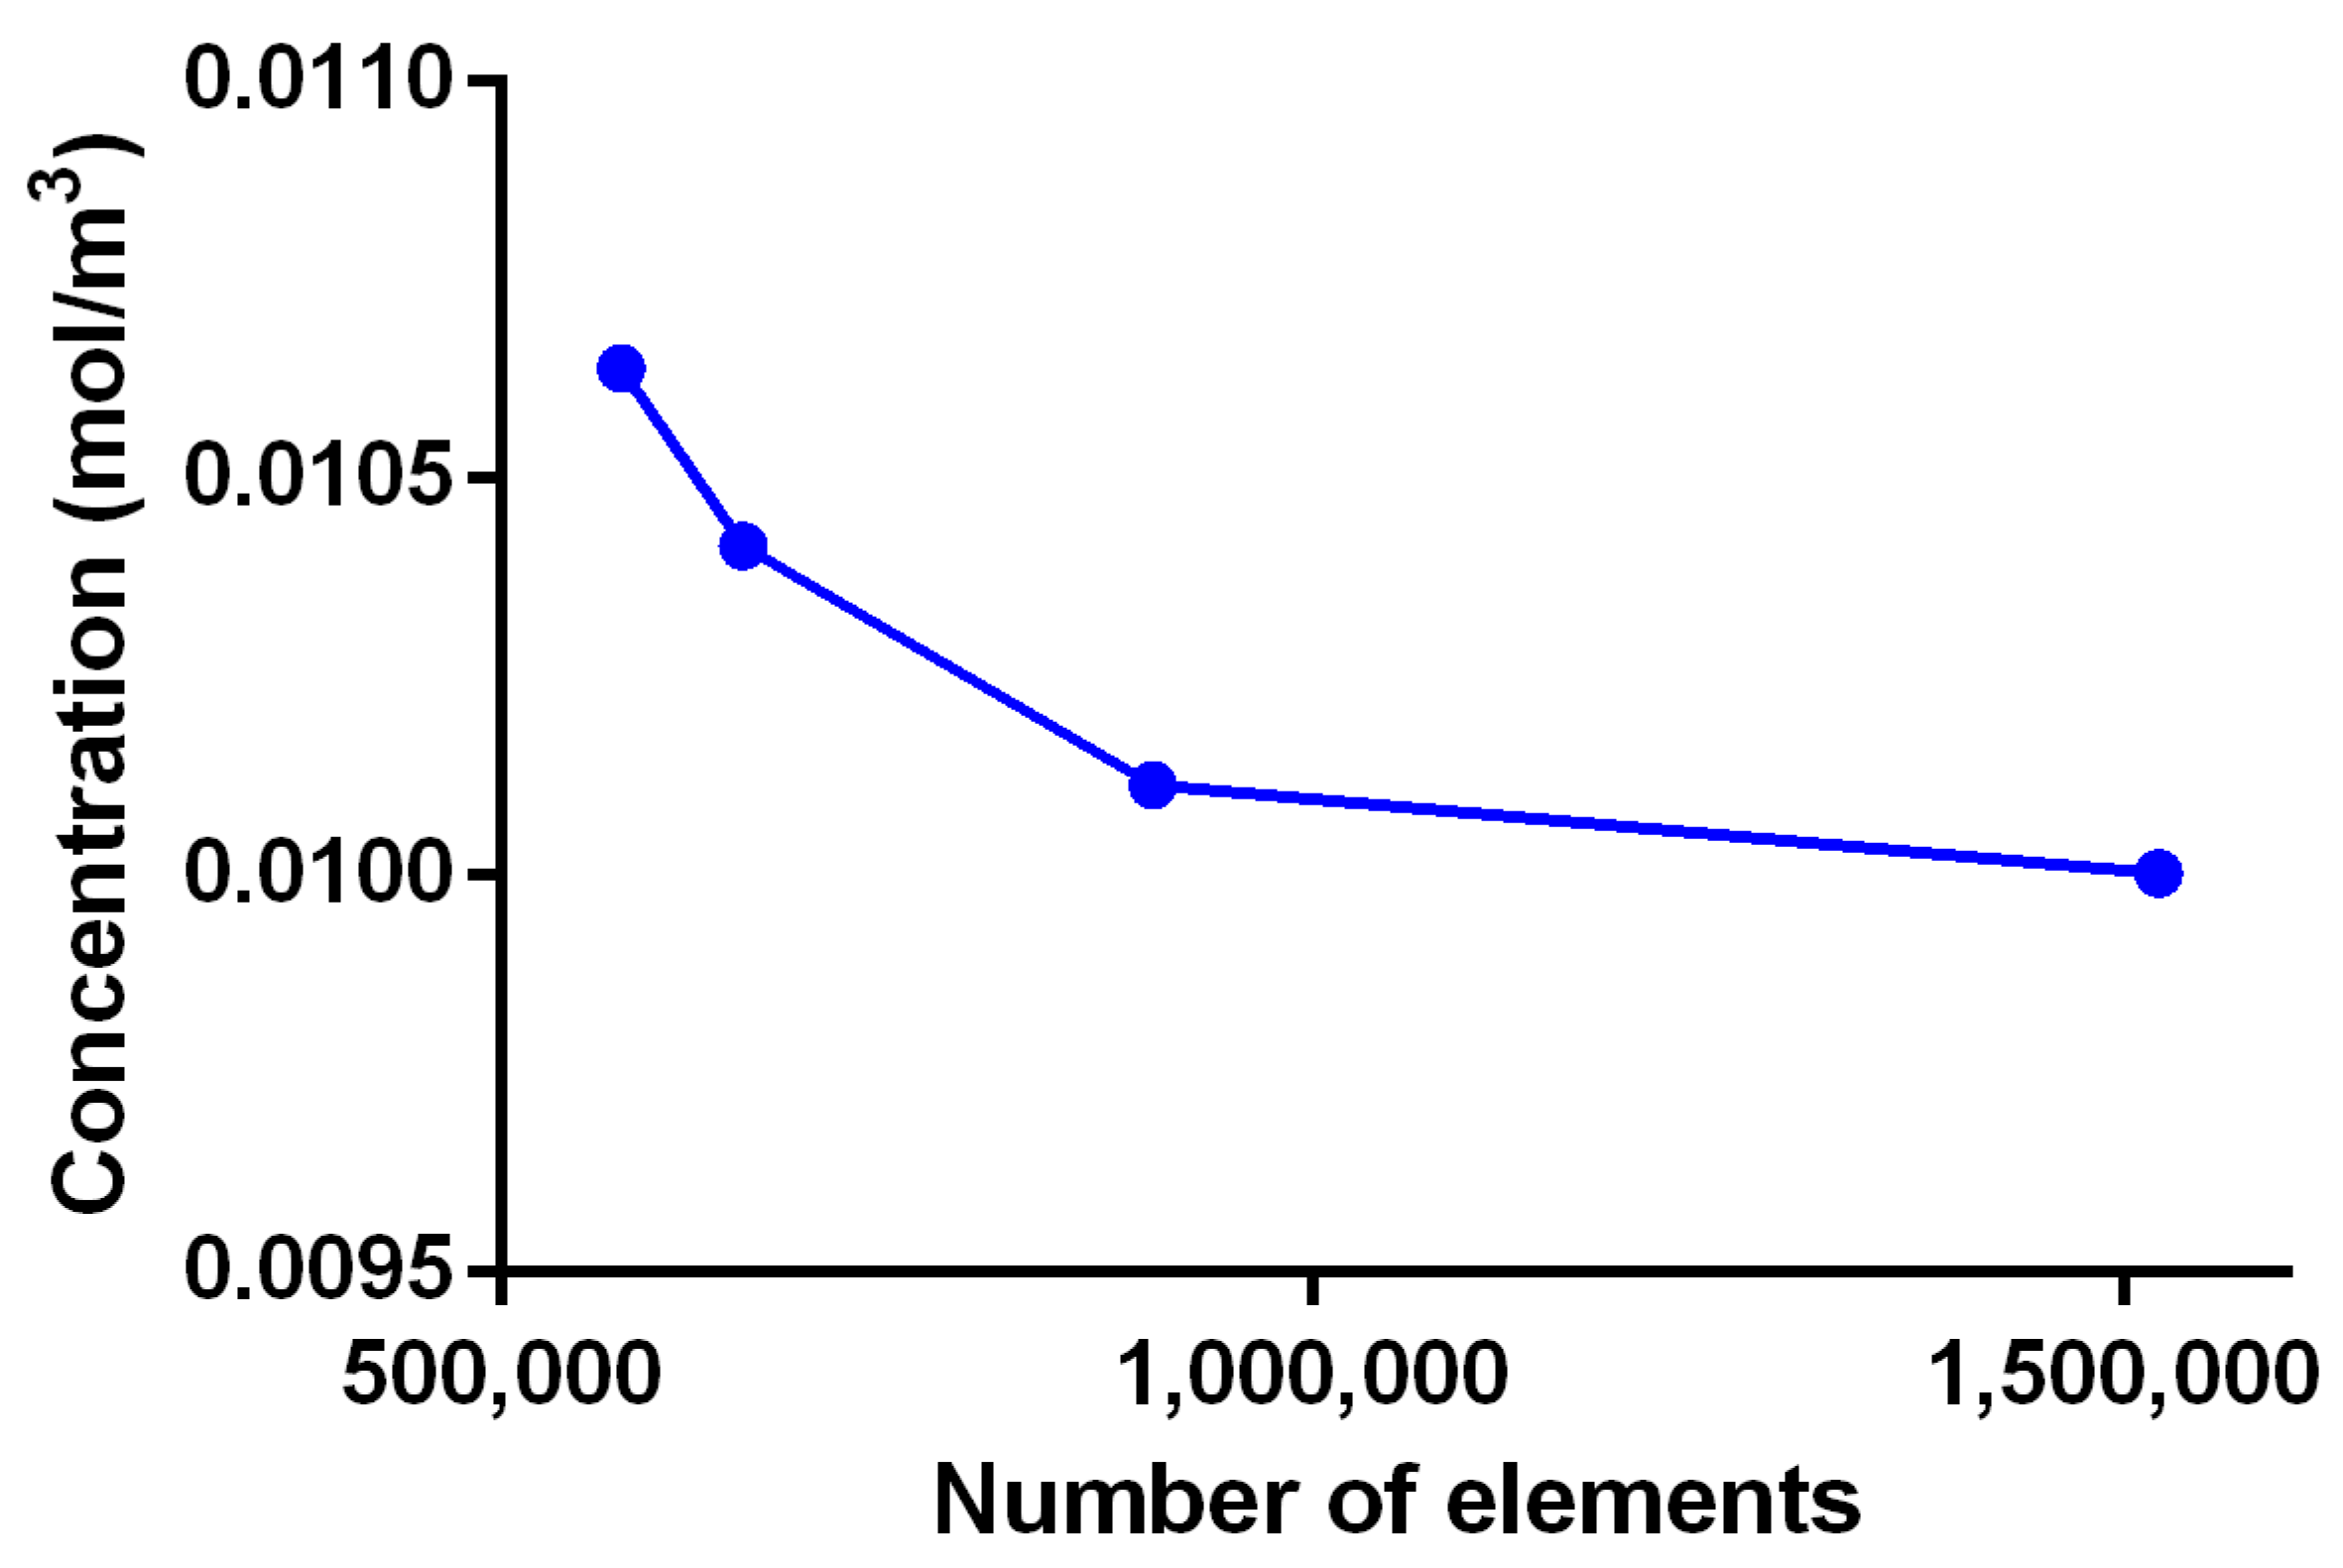
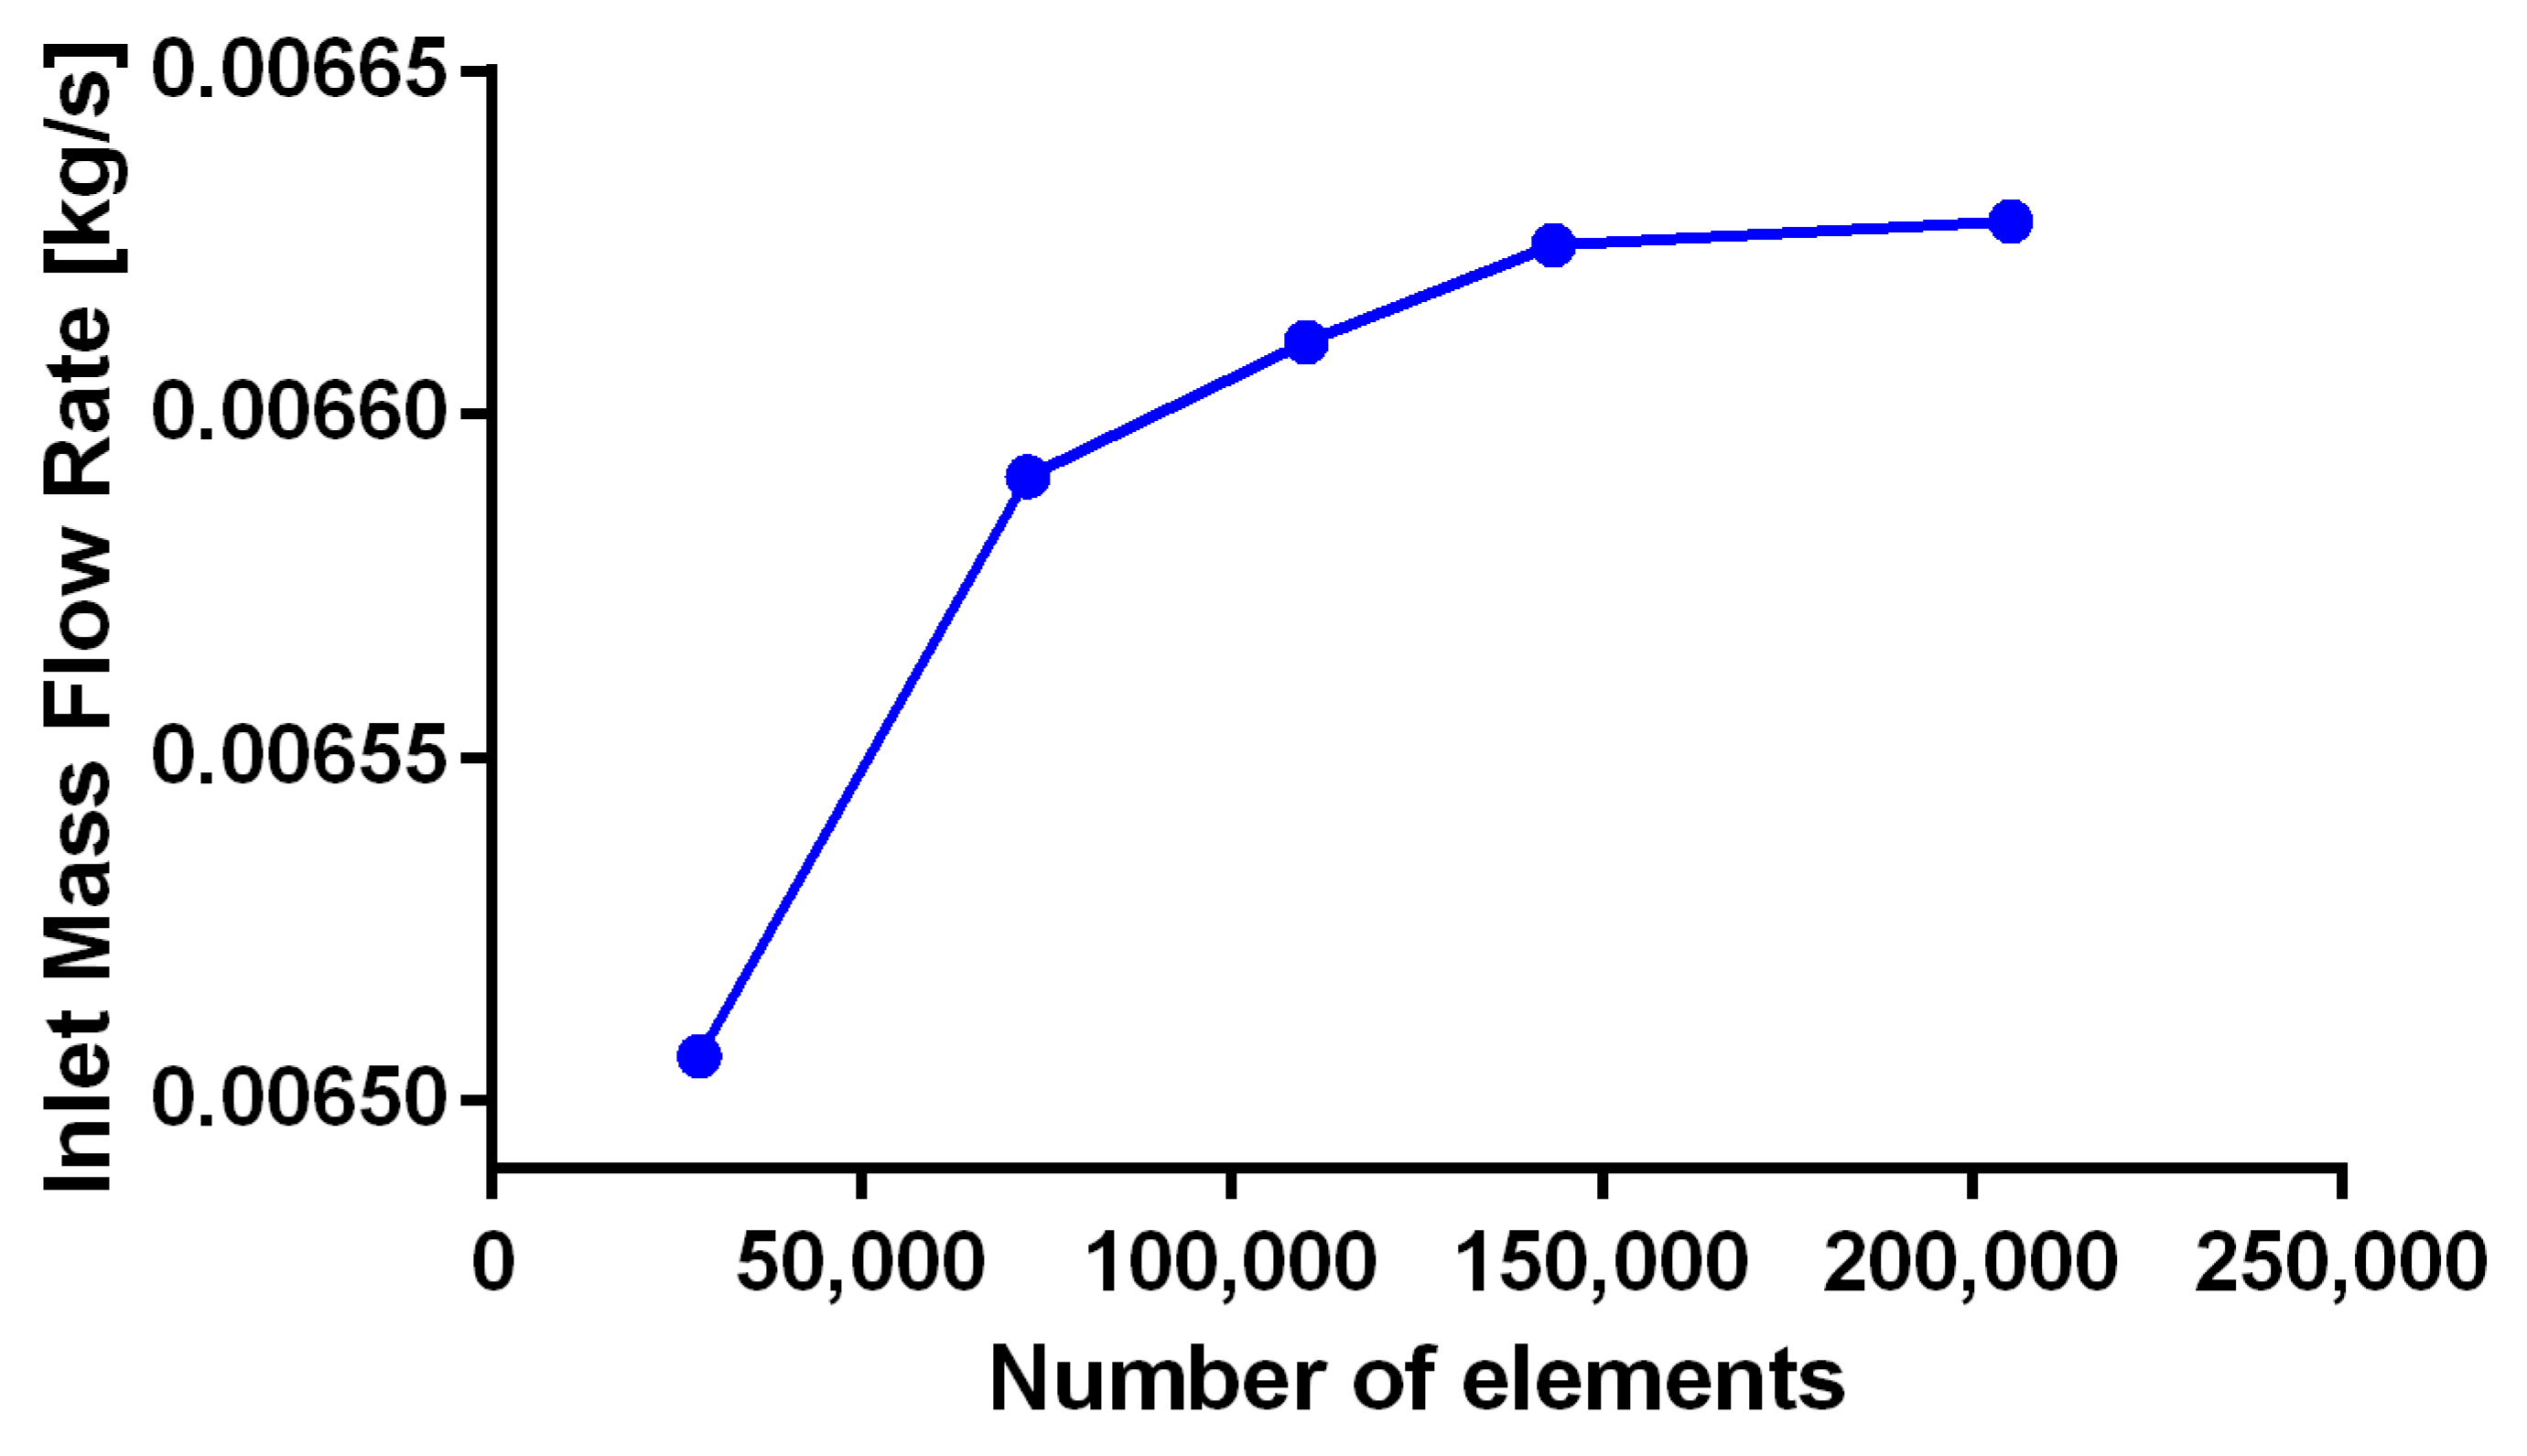
- Mesh convergence analysis


Appendix C
- COMSOL sensibility analysis and additional time steps


Appendix D
- Multiphysic model setup details
References
- Criqui, M.H.; Aboyans, V. Epidemiology of Peripheral Artery Disease. Circ. Res. 2015, 116, 1509–1526. [Google Scholar] [CrossRef]
- Tara, S.; Dean, E.W.; Rocco, K.A.; Udelsman, B.V.; Kurobe, H.; Shinoka, T.; Breuer, C.K. Vessel Regeneration and Bioengineering. In Regenerative Medicine Applications in Organ Transplantation; Elsevier: Amsterdam, The Netherlands, 2014; pp. 811–827. [Google Scholar]
- Manoj, A.; Bhuyan, M.; Raj Banik, S.; Ravi Sankar, M. 3D printing of nasopharyngeal swabs for COVID-19 diagnose: Past and current trends. Mater. Today Proc. 2021, 44, 1361–1368. [Google Scholar] [CrossRef] [PubMed]
- Goldman, S.; Zadina, K.; Moritz, T.; Ovitt, T.; Sethi, G.; Copeland, J.G.; Thottapurathu, L.; Krasnicka, B.; Ellis, N.; Anderson, R.J.; et al. Long-term patency of saphenous vein and left internal mammary artery grafts after coronary artery bypass surgery. J. Am. Coll. Cardiol. 2004, 44, 2149–2156. [Google Scholar] [CrossRef] [PubMed]
- van Dijk, D.; Spoor, M.; Hijman, R.; Nathoe, H.M.; Borst, C.; Jansen, E.W.L.; Grobbee, D.E.; de Jaegere, P.P.T.; Kalkman, C.J. Octopus Study Group, for the Cognitive and Cardiac Outcomes 5 Years After Off-Pump vs. On-Pump Coronary Artery Bypass Graft Surgery. JAMA 2007, 297, 701. [Google Scholar] [CrossRef] [PubMed]
- Jackson, M.R.; Belott, T.P.; Dickason, T.; Kaiser, W.J.; Modrall, J.G.; Valentine, R.J.; Clagett, G.P. The consequences of a failed femoropopliteal bypass grafting: Comparison of saphenous vein and PTFE grafts. J. Vasc. Surg. 2000, 32, 498–505. [Google Scholar] [CrossRef][Green Version]
- Van Det, R.J.; Vriens, B.H.R.; der Palen, J.; Geelkerken, R.H. Dacron or ePTFE for femoro-popliteal above-knee bypass grafting: Short-and long-term results of a multicentre randomised trial. Eur. J. Vasc. Endovasc. Surg. 2009, 37, 457–463. [Google Scholar] [CrossRef]
- Zilla, P.; Bezuidenhout, D.; Human, P. Prosthetic vascular grafts: Wrong models, wrong questions and no healing. Biomaterials 2007, 28, 5009–5027. [Google Scholar] [CrossRef]
- Latour, R.A. Biomaterials: Protein-surface interactions. Encycl. Biomater. Biomed. Eng. 2005, 1, 270–284. [Google Scholar]
- Buddhadasa, M.; Lerouge, S.; Girard-Lauriault, P.-L. Plasma polymer films to regulate fibrinogen adsorption: Effect of pressure and competition with human serum albumin. Plasma Process. Polym. 2018, 15, 1800040. [Google Scholar] [CrossRef]
- Xu, L.-C.; Bauer, J.W.; Siedlecki, C.A. Proteins, platelets, and blood coagulation at biomaterial interfaces. Colloids Surf. B Biointerfaces 2014, 124, 49–68. [Google Scholar] [CrossRef]
- Simsek, E.; Karapinar, K.; Bugra, O.; Ulus, A.T.; Sarigul, A. Effects of albumin and synthetic polypeptide-coated oxygenators on IL-1, IL-2, IL-6, and IL-10 in open heart surgery. Asian J. Surg. 2014, 37, 93–99. [Google Scholar] [CrossRef][Green Version]
- Salehi-Nik, N.; Amoabediny, G.; Pouran, B.; Tabesh, H.; Shokrgozar, M.A.; Haghighipour, N.; Khatibi, N.; Anisi, F.; Mottaghy, K.; Zandieh-Doulabi, B. Engineering parameters in bioreactor’s design: A critical aspect in tissue engineering. Biomed. Res. Int. 2013, 2013, 762132. [Google Scholar] [CrossRef] [PubMed]
- Pouran, B.; Amoabediny, G.; Saghafinia, M.S.; Abbas, M.P.H. Characterization of interfacial hydrodynamics in a single cell of shaken microtiter plate bioreactors applying computational fluid dynamics technique. Procedia Eng. 2012, 42, 924–930. [Google Scholar] [CrossRef][Green Version]
- Dur, O.; Coskun, S.T.; Coskun, K.O.; Frakes, D.; Kara, L.B.; Pekkan, K. Computer-aided patient-specific coronary artery graft design improvements using CFD coupled shape optimizer. Cardiovasc. Eng. Technol. 2011, 2, 35–47. [Google Scholar] [CrossRef] [PubMed]
- He, F.; Hua, L.; Gao, L. Effects of wall condition on flow distributions in arterial modeling: Comparison of rigid, dynamic, and compliant walls. J. Mech. Sci. Technol. 2016, 30, 1471–1475. [Google Scholar] [CrossRef]
- Lima, R.; Oliveira, M.S.N.; Ishikawa, T.; Kaji, H.; Tanaka, S.; Nishizawa, M.; Yamaguchi, T. Axisymmetric polydimethysiloxane microchannels for in vitro hemodynamic studies. Biofabrication 2009, 1, 35005. [Google Scholar] [CrossRef]
- Renkin, E.M. Handbook of Physiology: Section 2, The CARDIOVASCULAR System. Microcirculation: Pt. 2; American Physiological Soc.: Bethesda, MD, USA; New York, NY, USA, 1984; Volume 4. [Google Scholar]
- Balogh, P.; Bagchi, P. Direct numerical simulation of cellular-scale blood flow in 3D microvascular networks. Biophys. J. 2017, 113, 2815–2826. [Google Scholar] [CrossRef] [PubMed]
- Bianchi, E.; Molteni, R.; Pardi, R.; Dubini, G. Microfluidics for in vitro biomimetic shear stress-dependent leukocyte adhesion assays. J. Biomech. 2013, 46, 276–283. [Google Scholar] [CrossRef]
- Lei, H.; Karniadakis, G.E. Quantifying the rheological and hemodynamic characteristics of sickle cell anemia. Biophys. J. 2012, 102, 185–194. [Google Scholar] [CrossRef]
- Xie, X.; Eberhart, A.; Guidoin, R.; Marois, Y.; Douville, Y.; Zhang, Z. Five types of polyurethane vascular grafts in dogs: The importance of structural design and material selection. J. Biomater. Sci. Polym. Ed. 2010, 21, 1239–1264. [Google Scholar] [CrossRef] [PubMed]
- Barron, V.; Lyons, E.; Stenson-Cox, C.; McHugh, P.E.; Pandit, A. Bioreactors for cardiovascular cell and tissue growth: A review. Ann. Biomed. Eng. 2003, 31, 1017–1030. [Google Scholar] [CrossRef]
- Snowhill, P.B.; Foran, D.J.; Silver, F.H. A mechanical model of porcine vascular tissues-part I: Determination of macromolecular component arrangement and volume fractions. Cardiovasc. Eng. 2004, 4, 281–294. [Google Scholar] [CrossRef]
- Kim, H.-I.; Yu, J.E.; Lee, S.Y.; Sul, A.Y.; Jang, M.S.; Rashid, M.A.; Park, S.G.; Kim, S.J.; Park, C.-G.; Kim, J.H.; et al. The Effect of Composite Pig Islet-Human Endothelial Cell Grafts on the Instant Blood-Mediated Inflammatory Reaction. Cell Transplant. 2009, 18, 31–38. [Google Scholar] [CrossRef] [PubMed]
- Kollman, J.M.; Pandi, L.; Sawaya, M.R.; Riley, M.; Doolittle, R.F. Crystal structure of human fibrinogen. Biochemistry 2009, 48, 3877–3886. [Google Scholar] [CrossRef] [PubMed]
- Radke, D.; Jia, W.; Sharma, D.; Fena, K.; Wang, G.; Goldman, J.; Zhao, F. Tissue Engineering at the Blood-Contacting Surface: A Review of Challenges and Strategies in Vascular Graft Development. Adv. Healthc. Mater. 2018, 7, 1701461. [Google Scholar] [CrossRef]
- Riveros, A.; Cuellar, M.; Sánchez, P.F.; Muñoz-Camargo, C.; Cruz, J.C.; Sandoval, N.; Lopez Mejia, O.D.; Briceño, J.C. Design and Characterization of a Fluidic Device for the Evaluation of SIS-Based Vascular Grafts. Processes 2020, 8, 1198. [Google Scholar] [CrossRef]
- Santos, O.; Nylander, T.; Rizzo, G.; Müller-Steinhagen, H.; Trägårdh, C.; Paulsson, M. Study of Whey Protein Adsorption under Turbulent Flow; ECI Digital Archives, ECI Symposium Series; ECI Digital Archives: Santa Fe, NM, USA, 2003. [Google Scholar]
- Lionello, A.; Josserand, J.; Jensen, H.; Girault, H.H. Dynamic protein adsorption in microchannels by “stop-flow” and continuous flow. Lab Chip 2005, 5, 1096–1103. [Google Scholar] [CrossRef]
- Tang, L.; Eaton, J.W. Inflammatory responses to biomaterials. Am. J. Clin. Pathol. 1995, 103, 466–471. [Google Scholar] [CrossRef]
- Manzi, B.M.; Werner, M.; Ivanova, E.P.; Crawford, R.J.; Baulin, V.A. Simulations of protein adsorption on nanostructured surfaces. Sci. Rep. 2019, 9, 4694. [Google Scholar] [CrossRef]
- Richert, L.; Boukari, A.; Berner, S.; Dard, M.; Hemmerlé, J. Unbinding Process of Amelogenin and Fibrinogen Adsorbed on Different Solid Surfaces Using AFM. J. Biomater. Nanobiotechnol. 2011, 2, 244–249. [Google Scholar] [CrossRef]
- Dinnar, U. Cardiovascular Fluid Dynamics; CRC Press: Boca Raton, FL, USA, 2019. [Google Scholar]
- Induruwa, I.; Moroi, M.; Bonna, A.; Malcor, J.-D.; Howes, J.-M.; Warburton, E.A.; Farndale, R.W.; Jung, S.M. Platelet collagen receptor Glycoprotein VI-dimer recognizes fibrinogen and fibrin through their D-domains, contributing to platelet adhesion and activation during thrombus formation. J. Thromb. Haemost. 2018, 16, 389–404. [Google Scholar] [CrossRef]
- Horbett, T.A. Fibrinogen adsorption to biomaterials. J. Biomed. Mater. Res. Part A 2018, 106, 2777–2788. [Google Scholar] [CrossRef]
- Ma, W.; Ruys, A.J.; Zreiqat, H. Diamond-like carbon (DLC) as a biocompatible coating in orthopaedic and cardiac medicine. In Cellular Response to Biomaterials; Elsevier: Amsterdam, The Netherlands, 2009; pp. 391–426. [Google Scholar]
- Strang, A.C.; Knetsch, M.L.W.; Idu, M.M.; Bisoendial, R.J.; Kramer, G.; Speijer, D.; Koole, L.H.; Stroes, E.S.G.; Rotmans, J.I. Superior in vivo Compatibility of Hydrophilic Polymer Coated Prosthetic Vascular Grafts. J. Vasc. Access 2014, 15, 95–101. [Google Scholar] [CrossRef]
- Ren, X.; Feng, Y.; Guo, J.; Wang, H.; Li, Q.; Yang, J.; Hao, X.; Lv, J.; Ma, N.; Li, W. Surface modification and endothelialization of biomaterials as potential scaffolds for vascular tissue engineering applications. Chem. Soc. Rev. 2015, 44, 5680–5742. [Google Scholar] [CrossRef]
- Wissing, T.B.; van Haaften, E.E.; Koch, S.E.; Ippel, B.D.; Kurniawan, N.A.; Bouten, C.V.C.; Smits, A.I.P.M. Hemodynamic loads distinctively impact the secretory profile of biomaterial-activated macrophages—Implications for in situ vascular tissue engineering. Biomater. Sci. 2020, 8, 132–147. [Google Scholar] [CrossRef]
- van Haaften, E.E.; Wissing, T.B.; Rutten, M.C.M.; Bulsink, J.A.; Gashi, K.; van Kelle, M.A.J.; Smits, A.I.P.M.; Bouten, C.V.C.; Kurniawan, N.A. Decoupling the effect of shear stress and stretch on tissue growth and remodeling in a vascular graft. Tissue Eng. Part C Methods 2018, 24, 418–429. [Google Scholar] [CrossRef] [PubMed]
- Hartvig, R.A.; van de Weert, M.; Østergaard, J.; Jorgensen, L.; Jensen, H. Protein Adsorption at Charged Surfaces: The Role of Electrostatic Interactions and Interfacial Charge Regulation. Langmuir 2011, 27, 2634–2643. [Google Scholar] [CrossRef] [PubMed]
- Bernabeu, P.; Caprani, A. Influence of surface charge on adsorption of fibrinogen and/or albumin on a rotating disc electrode of platinum and carbon. Biomaterials 1990, 11, 258–264. [Google Scholar] [CrossRef]
- Nonckreman, C.J.; Fleith, S.; Rouxhet, P.G.; Dupont-Gillain, C.C. Competitive adsorption of fibrinogen and albumin and blood platelet adhesion on surfaces modified with nanoparticles and/or PEO. Colloids Surf. B Biointerfaces 2010, 77, 139–149. [Google Scholar] [CrossRef]
- Stamboroski, S.; Joshi, A.; Noeske, P.M.; Köppen, S.; Brüggemann, D. Principles of Fibrinogen Fiber Assembly In Vitro. Macromol. Biosci. 2021, 21, 2000412. [Google Scholar] [CrossRef] [PubMed]
- Brash, J.L.; Horbett, T.A.; Latour, R.A.; Tengvall, P. The blood compatibility challenge. Part 2: Protein adsorption phenomena governing blood reactivity. Acta Biomater. 2019, 94, 11–24. [Google Scholar] [CrossRef] [PubMed]
- Sidorov, S.A. Finite Element Modeling of Human Artery Tissue with a Nonlinear Multi-Mechanism Inelastic Material; University of Pittsburgh: Pittsburgh, PA, USA, 2007. [Google Scholar]
- Suárez, N.A.; Cuellar, M.; Rodriguez, M.A.; Medina, M.L.; Muñoz-Camargo, C.; Cruz, J.C.; Sandoval, N.F.; Briceño, J.C. ASAIO 2019 Annual Meeting Abstracts. ASAIO J. 2019, 65, 34. [Google Scholar] [CrossRef]
- Karimi, A.; Sera, T.; Kudo, S.; Navidbakhsh, M. Experimental verification of the healthy and atherosclerotic coronary arteries incompressibility via digital image correlation. Artery Res. 2016, 16, 1–7. [Google Scholar] [CrossRef]
- ANSYS Fluent User’s Guide 2019.0: Section 3.2. “Dynamic Mesh Theory”; ANSYS, Inc.: Canonsburg, PA, USA, 2019; p. 1531.
- COMSOL Software License Agreement 5.5 COMSOL Multiphysics 5.5, Protein Adsorption; COMSOL AB: Stockholm, Sweden, 2020.
- Sugio, S.; Kashima, A.; Mochizuki, S.; Noda, M.; Kobayashi, K. Crystal structure of human serum albumin at 2.5 Å resolution. Protein Eng. Des. Sel. 1999, 12, 439–446. [Google Scholar] [CrossRef]


| Parameter | Value | Units | Description |
|---|---|---|---|
| RArea | m2 | Surface reaction area | |
| Inlet_Flow | m3/s | Inlet flow rate | |
| kf | 9 | m3/(s mol) | Forward rate constant |
| kr | 1 | m3/(s mol) | Reverse rate constant |
| ki | L/s | Forward rate constant for irreversible reaction | |
| CFmax_inlet | 0.0118 | mol/m3 | Maximum concentration fibrinogen |
| CAmax_inlet | 0.753 | mol/m2 | Maximum concentration albumin |
| CS0surf | 9.90 × 10⁻⁶ | mol/m2 | Initial surface concentration S |
| CH2O | 55,600 | mol/m3 | Concentration of solvent (water) |
| G0 | mol/m2 | Initial site density of S | |
| MA | 66.5 | kg/mol | Molar mass Albumin |
| MF | 340 | kg/mol | Molar mass Fibrinogen |
| MS | 0.018 | kg/mol | Molar mass water |
| MH2O | 0.018 | kg/mol | Molar mass water |
| ρ H2O | 1000 | kg/m3 | Density water |
| ρ A | 70.69 | kg/m3 | Density Albumin |
| ρ F | 35.82 | kg/m3 | Density Fibrinogen |
| μ H2O | Pa∗s | Dynamic viscosity water | |
| Velocity | V(x,t) | m/s | From ANSYS velocity in the TEVG |
| MPS | 66.5 (340) | kg/mol | |
| MPSirr | 66.5 (340) | kg/mol | |
| Time step | 0.009 | s | Discretization time step for the simulations |
Publisher’s Note: MDPI stays neutral with regard to jurisdictional claims in published maps and institutional affiliations. |
© 2022 by the authors. Licensee MDPI, Basel, Switzerland. This article is an open access article distributed under the terms and conditions of the Creative Commons Attribution (CC BY) license (https://creativecommons.org/licenses/by/4.0/).
Share and Cite
Riveros, A.; Garcia-Brand, A.J.; Rodriguez-Soto, M.A.; Sandoval, N.; Muñoz-Camargo, C.; Cruz, J.C.; Briceño, J.C. Computational Characterization of Mechanical, Hemodynamic, and Surface Interaction Conditions: Role of Protein Adsorption on the Regenerative Response of TEVGs. Int. J. Mol. Sci. 2022, 23, 1130. https://doi.org/10.3390/ijms23031130
Riveros A, Garcia-Brand AJ, Rodriguez-Soto MA, Sandoval N, Muñoz-Camargo C, Cruz JC, Briceño JC. Computational Characterization of Mechanical, Hemodynamic, and Surface Interaction Conditions: Role of Protein Adsorption on the Regenerative Response of TEVGs. International Journal of Molecular Sciences. 2022; 23(3):1130. https://doi.org/10.3390/ijms23031130
Chicago/Turabian StyleRiveros, Alejandra, Andres J. Garcia-Brand, Maria A. Rodriguez-Soto, Nestor Sandoval, Carolina Muñoz-Camargo, Juan C. Cruz, and Juan C. Briceño. 2022. "Computational Characterization of Mechanical, Hemodynamic, and Surface Interaction Conditions: Role of Protein Adsorption on the Regenerative Response of TEVGs" International Journal of Molecular Sciences 23, no. 3: 1130. https://doi.org/10.3390/ijms23031130
APA StyleRiveros, A., Garcia-Brand, A. J., Rodriguez-Soto, M. A., Sandoval, N., Muñoz-Camargo, C., Cruz, J. C., & Briceño, J. C. (2022). Computational Characterization of Mechanical, Hemodynamic, and Surface Interaction Conditions: Role of Protein Adsorption on the Regenerative Response of TEVGs. International Journal of Molecular Sciences, 23(3), 1130. https://doi.org/10.3390/ijms23031130