Article

The Mayo Clinic Florida Microdosimetric Kinetic Model of Clonogenic Survival: Application to Various Repair-Competent Rodent and Human Cell Lines

Department of Radiation Oncology, Mayo Clinic, Jacksonville, FL 32224, USA
*
Author to whom correspondence should be addressed.
Int. J. Mol. Sci. 2022, 23(20), 12491; https://doi.org/10.3390/ijms232012491
Submission received: 6 September 2022 / Revised: 4 October 2022 / Accepted: 11 October 2022 / Published: 18 October 2022
(This article belongs to the Special Issue Feature Papers in Physical Chemistry and Chemical Physics 2022)

Abstract

:
The relative biological effectiveness (RBE) calculations used during the planning of ion therapy treatments are generally based on the microdosimetric kinetic model (MKM) and the local effect model (LEM). The Mayo Clinic Florida MKM (MCF MKM) was recently developed to overcome the limitations of previous MKMs in reproducing the biological data and to eliminate the need for ion-exposed in vitro data as input for the model calculations. Since we are considering to implement the MCF MKM in clinic, this article presents (a) an extensive benchmark of the MCF MKM predictions against corresponding in vitro clonogenic survival data for 4 rodent and 10 cell lines exposed to ions from 1H to 238U, and (b) a systematic comparison with published results of the latest version of the LEM (LEM IV). Additionally, we introduce a novel approach to derive an approximate value of the MCF MKM model parameters by knowing only the animal species and the mean number of chromosomes. The overall good agreement between MCF MKM predictions and in vitro data suggests the MCF MKM can be reliably used for the RBE calculations. In most cases, a reasonable agreement was found between the MCF MKM and the LEM IV.

1. Introduction

Cancer radiotherapy treatments with ions are optimized to account for their different relative biological effectiveness (RBE) with respect to conventional X-rays [1]. The modelled endpoint considered for treatment planning is the cellular clonogenic survival [2] due to its relevance for clinical tumor control calculations [3]. Among the biophysical models developed during the years [4,5,6,7,8,9,10,11,12,13,14,15] , mainly two approaches are currently in clinical use to calculate these RBE variations: the first version of the local effect model (LEM I [6]) based on amorphus track structure calculations and the modified microdosimetric kinetic model (modified MKM [9]) based on microdosimetry. It must be mentioned that phenomenological models such as the mixed beam model (MBM [7]) are in use in some carbon therapy facilities [16]. In the MBM [7], ion-specific empirical correlations between the average linear energy transfer (LET) and the linear and quadratic terms (α and ß) of the linear quadratic model (LQM [17,18]) are established by fitting the results of in vitro experiments and used for the biophysical calculations [7,19].
While amorphus track structure models such as the LEM [6] rely on the computation of the radial dose distribution around the ion track, microdosimetric models (for example the modified MKM [9]) are based on quantities such as the lineal energy which be simulated and experimentally measured with dedicated radiation detectors [20]. Consequently, treatment planning calculations with microdosimetric models possess the advantageous possibility of an experimental validation by means of independent physical measurements.
Despite some limitations of the LEM I [6] were reported [21,22,23], this is the only LEM version currently implemented in clinical practice. In order to improve the agreement between the model calculations and the biological data, subsequent corrections for the clustering of deoxyribonucleic acid (DNA) single strand breaks at the nanometer level and an improved description of the radial dose distribution were introduced in the LEM II [24] and further modified in the LEM III [25]. The fourth version of the LEM [26] is a major update of the LEM. While in the previous LEM versions [6,24,25] the radial dose distribution is used as the operational quantity for the biophysical modeling process, the LEM IV [26] includes an intermediate step in the calculation of the radiation induced damage. Here, the radial dose distribution is used to evaluate the local distribution of DNA double strand breaks (DSBs) in the cell nucleus. Afterwards, a measure of the DNA DSB clustering within subnuclear volumes (i.e., the cluster index [26]) is derived and then used to compute the cell survival. The various LEM parameters [27] were determined during the years by fitting a subset of in vitro data. Since it is generally assumed that these model parameters can be unchangingly applied to any cell line, the only input for the LEM calculations is the dose–response after photon irradiation [28].
The original version of the MKM [5], developed from the theory of dual radiation action [4], does not account for the experimentally observed decrease in the relative biological effectiveness (RBE) at high linear energy transfer (LET) due to overkill effect [29]. In the modified MKM [9], the overkill effect is included in the model formalism by means of a phenomenological quantity (the saturation-corrected dose-mean lineal energy [30]) evaluated in subnuclear structures of the cell nucleus named domains. However, it was shown that the modified MKM possesses limitations in reproducing the in vitro data high LET and low surviving fractions [9,11,31]. These deviations are due to a suboptimal implementation of the overkill effects in the modeling of the linear term (α) of the LQM [31] and to the model assumption of a radiation independent quadratic term (ß) of the LQM [9,11,31].
In view of the upcoming integrated proton-carbon ion therapy center at Mayo Clinic Florida (MCF, Jacksonville, Florida, United States of America [32]), a novel microdosimetric model named MCF MKM was recently developed [33]. Differently from previous versions of the MKM [5,8,9], the MCF MKM introduces novel expressions to calculate the exposure-specific values of α and ß by using whole spectral information. Additionally, the mean radius of the radiation-sensitive subnuclear domains is a priori calculated using a new methodology based on the population-mean amount of DNA content in the cell nucleus [33]. This is an important difference between the MCF MKM and the previous MKMs. In the latter case, the cell-specific parameters are generally assessed a posteriori by fitting a subset of the in vitro data in case of ion exposures, thus partially limiting the predictive power of these models. On the other hand, without using any in vitro ion-exposure data as input to the MCF MKM nor performing a posteriori tuning of the model parameters (mean radius of the cell nucleus Rn, mean radius subnuclear domains rd), the MCF MKM was successful in predicting average and experiment-specific RBE trends for the most commonly used mammalian cell line (Chinese hamster lung fibroblasts, V79 cell line) and the clinically relevant human salivary gland tumor cells (HSG cell line) for ions from 1H to 132Xe. A sensitivity test proved that the a priori determined MCF MKM parameters for these two cell lines were in good agreement with the ones obtained by fitting the in vitro data [33].
Considering a possible clinical implementation of the MCF MKM, it is of primordial importance to (a) validate the model predictions against a large dataset of in vitro clonogenic survival data for various cell lines and (b) compare the MCF MKM results with the results of the most recent version of clinically relevant models such as the LEM. Therefore, in this article we investigate the accuracy of the MCF MKM in systematically predicting the LQM terms and the RBE values for 4 rodent (Chinese hamster, mouse, rat) and 10 human repair-competent cell lines in case of exposures to ions from 1H to 238U. Since morphologic measurements of the cell nucleus (Rn) are not always available in the literature, this work also presents a phenomenological approach to derive an approximate value of both model parameters (mean radius of the cell nucleus Rn, mean radius subnuclear domains rd) by knowing the animal species and, for aneuploid cancer cells, the mean number of chromosomes. When possible, the MCF MKM prediction were compared with published results of the LEM IV [28].

2. Results and Discussion

In the following paragraphs, the linear and quadratic terms of the LQM (α and ß) and the RBE for a surviving fraction of 10% (RBE10%) predicted by the MCF MKM are compared with the experimental in vitro data from PIDE 3.2 [34] and published calculations [28] with the latest version of the local effect model (LEM IV [26]). Since the LEM IV calculations are experiment-specific, the LET-dependence of the calculated RBE values could show a non-monotonic behavior between subsequent points. The dashed lines for the LEM IV data series are meant as a guide to the eye only. The results are plotted as a function of the unrestricted LET in water for the different ions and cell lines included in this investigation. In vitro and in silico data for different isotopes of the same element (i.e., 1H and 2H ions) were pooled together since negligible differences were observed when the results are plotted as a function of the LET [35,36].
Though the MCF MKM can be used to compute the RBE also for other surviving fractions, the plots are limited to the RBE10% for better clarity in the comparison between the three data series (MCF MKM, in vitro, LEM IV). Nonetheless, examples of RBE calculations for other surviving fractions (50% and 1%) are given in Figures S1–S14 in the Supplementary Materials.
The PIDE in vitro database does not provide uncertainty intervals for the clonogenic survival data. This is due to the fact that most of the published biological studies do not include an uncertainty analysis and, in some cases, not even an indication of the statistical dispersion of the results. The RBE results for the clonogenic survival essay are affected by several sources of uncertainty, such as: the different operational protocols between different groups (as an example, the time between irradiation and plating is known to play a significant effect on the clonogenic survival [37]), cell line aging [29], cell misidentification or cross-contamination [38,39], the process of colony counting (15–30% [40]), the choice of the reference radiation (details on the photon energy spectrum, very important for filtered X-rays, are generally not listed [36]), the lack of standard procedures to calibrate biological irradiators [41,42], and the processing of fitting the in vitro data to obtain the survival curve (for the LQM this fitting process is significantly affected by the anti-correlation between α and ß [34]). All of above, together with a widespread incomplete report of physical parameters [43], is to be held responsible for the large scatter in the in vitro RBE data obtained in comparable conditions (i.e., the same cell line exposed to a similar radiation quality [34,36]) and thus the reproducibility crisis in radiobiological studies [44]. Consequently, since an accurate retrospective uncertainty analysis dealing with both stochastic and systematic error is currently not possible, the in vitro data are plotted without error bars.

2.1. Rodent Cell Lines

The results for mouse embryonic fibroblasts (C3H10T1/2 cell line) are shown in Figure 1 and Figure 2. Except for 1H ions where the LEM IV seems to predict higher α and RBE10% values, the results of the calculations with the two models are in good agreement between each other and with the in vitro data of Figure 1 (ions from 1H to 20Ne). It is worth remembering that the prediction of large ß values (i.e., the ones for the in vitro data around 4–500 keV/µm for 12C and 16O ions) is beyond the capabilities of both models. Furthermore, it should be noted that, here and in the following, the ß values predicted by the LEM show a sharper decrease with the increase of the LET with respect to the ß values calculated with the MCF MKM. In case of 28Si and heavier ions (Figure 2), the agreement between the data series is less striking. For 28Si and 40Ar ions, the α calculated with the LEM IV appear to be closer to the in vitro data than the MCF MKM results. Nonetheless, the MCF MKM seems to better reproduce the RBE10% values in case for 28Si and 56Fe ions. In case of 238U ions, both models reproduce reasonably well the in vitro data.
The MCF MKM and the LEM IV results appear to be in good agreement with the in vitro data for chinese hamster ovary cells (CHO and CHO-K1 cell lines) over the whole investigate ion-LET range (Figure 3). The only exception is the one data point for 40Ar ions. In this case, the MCF MKM predictions appear to be higher than the in vitro data. No LEM IV calculations for the CHO cell line were available for 40Ar ions. The somehow counterintuitive increase of the LEM-calculated ß term at very high LET is due to the current implementation of the DNA damage enhancement factor [28].
The MCF MKM predictions for transformed mouse epidermal cells (PDV cell line) are plotted in Figure 4 for 1H and 7Li ions. Except for the larger in vitro ß data point for 26 keV/µm protons (ß = 0.26 Gy−2, roughly 7 times higher than ßref = 0.037 Gy−2), the model calculations (α, ß and RBE) are in good agreement with the in vitro data for both 1H and 7Li ions. Due to the approach used in Equation (4), the MCF MKM always predicts a monotonic decrease of ß with the increase of the particle LET (i.e., ß/ßref ≤ 1).
The α values predicted by MCF MKM and the LEM IV for carbon-irradiated rat prostatic adenocarcinoma epithelial cells (RAT-1 cell line, Figure 4) are very similar and agree remarkably well with the corresponding in vitro data. Though the MCF MKM appears to overestimate the ß value around 160 keV/µm, this has a little effect on the calculated RBE10% since the α term is significantly larger than ß. As for α, the RBE10% calculated with both models are similar and in good agreement with the experimental data.
Figure 1. α, ß, and RBE10% for the C3H10T1/2 cell line in case of 1-2H, 3-4He, 12C, 16O, and 20Ne ions: MCF MKM predictions compared with published in vitro data from PIDE 3.2 [34] and published LEM IV results [28].
Ijms 23 12491 g001
Figure 2. α, ß, and RBE10% for the C3H10T1/2 cell line in case of 28Si, 40Ar, 56Fe and 238U ions: MCF MKM predictions compared with published in vitro data from PIDE 3.2 [34] and published LEM IV results [28].
Ijms 23 12491 g002
Figure 3. α, ß, and RBE10% for the CHO and the CHO-K1 cell lines in case of 12C, 16O, 20Ne, 40Ar, and 56Fe ions: MCF MKM predictions compared with published in vitro data from PIDE 3.2 [34] and published LEM IV results [28].
Ijms 23 12491 g003
Figure 4. α, ß, and RBE10% for the PDV and the RAT-1 cell lines in case of 1H (PDV cell line), 7Li (PDV cell line), and 12C (RAT-1 cell line) ions: MCF MKM predictions compared with published in vitro data from PIDE 3.2 [34] and published LEM IV results [28].
Ijms 23 12491 g004

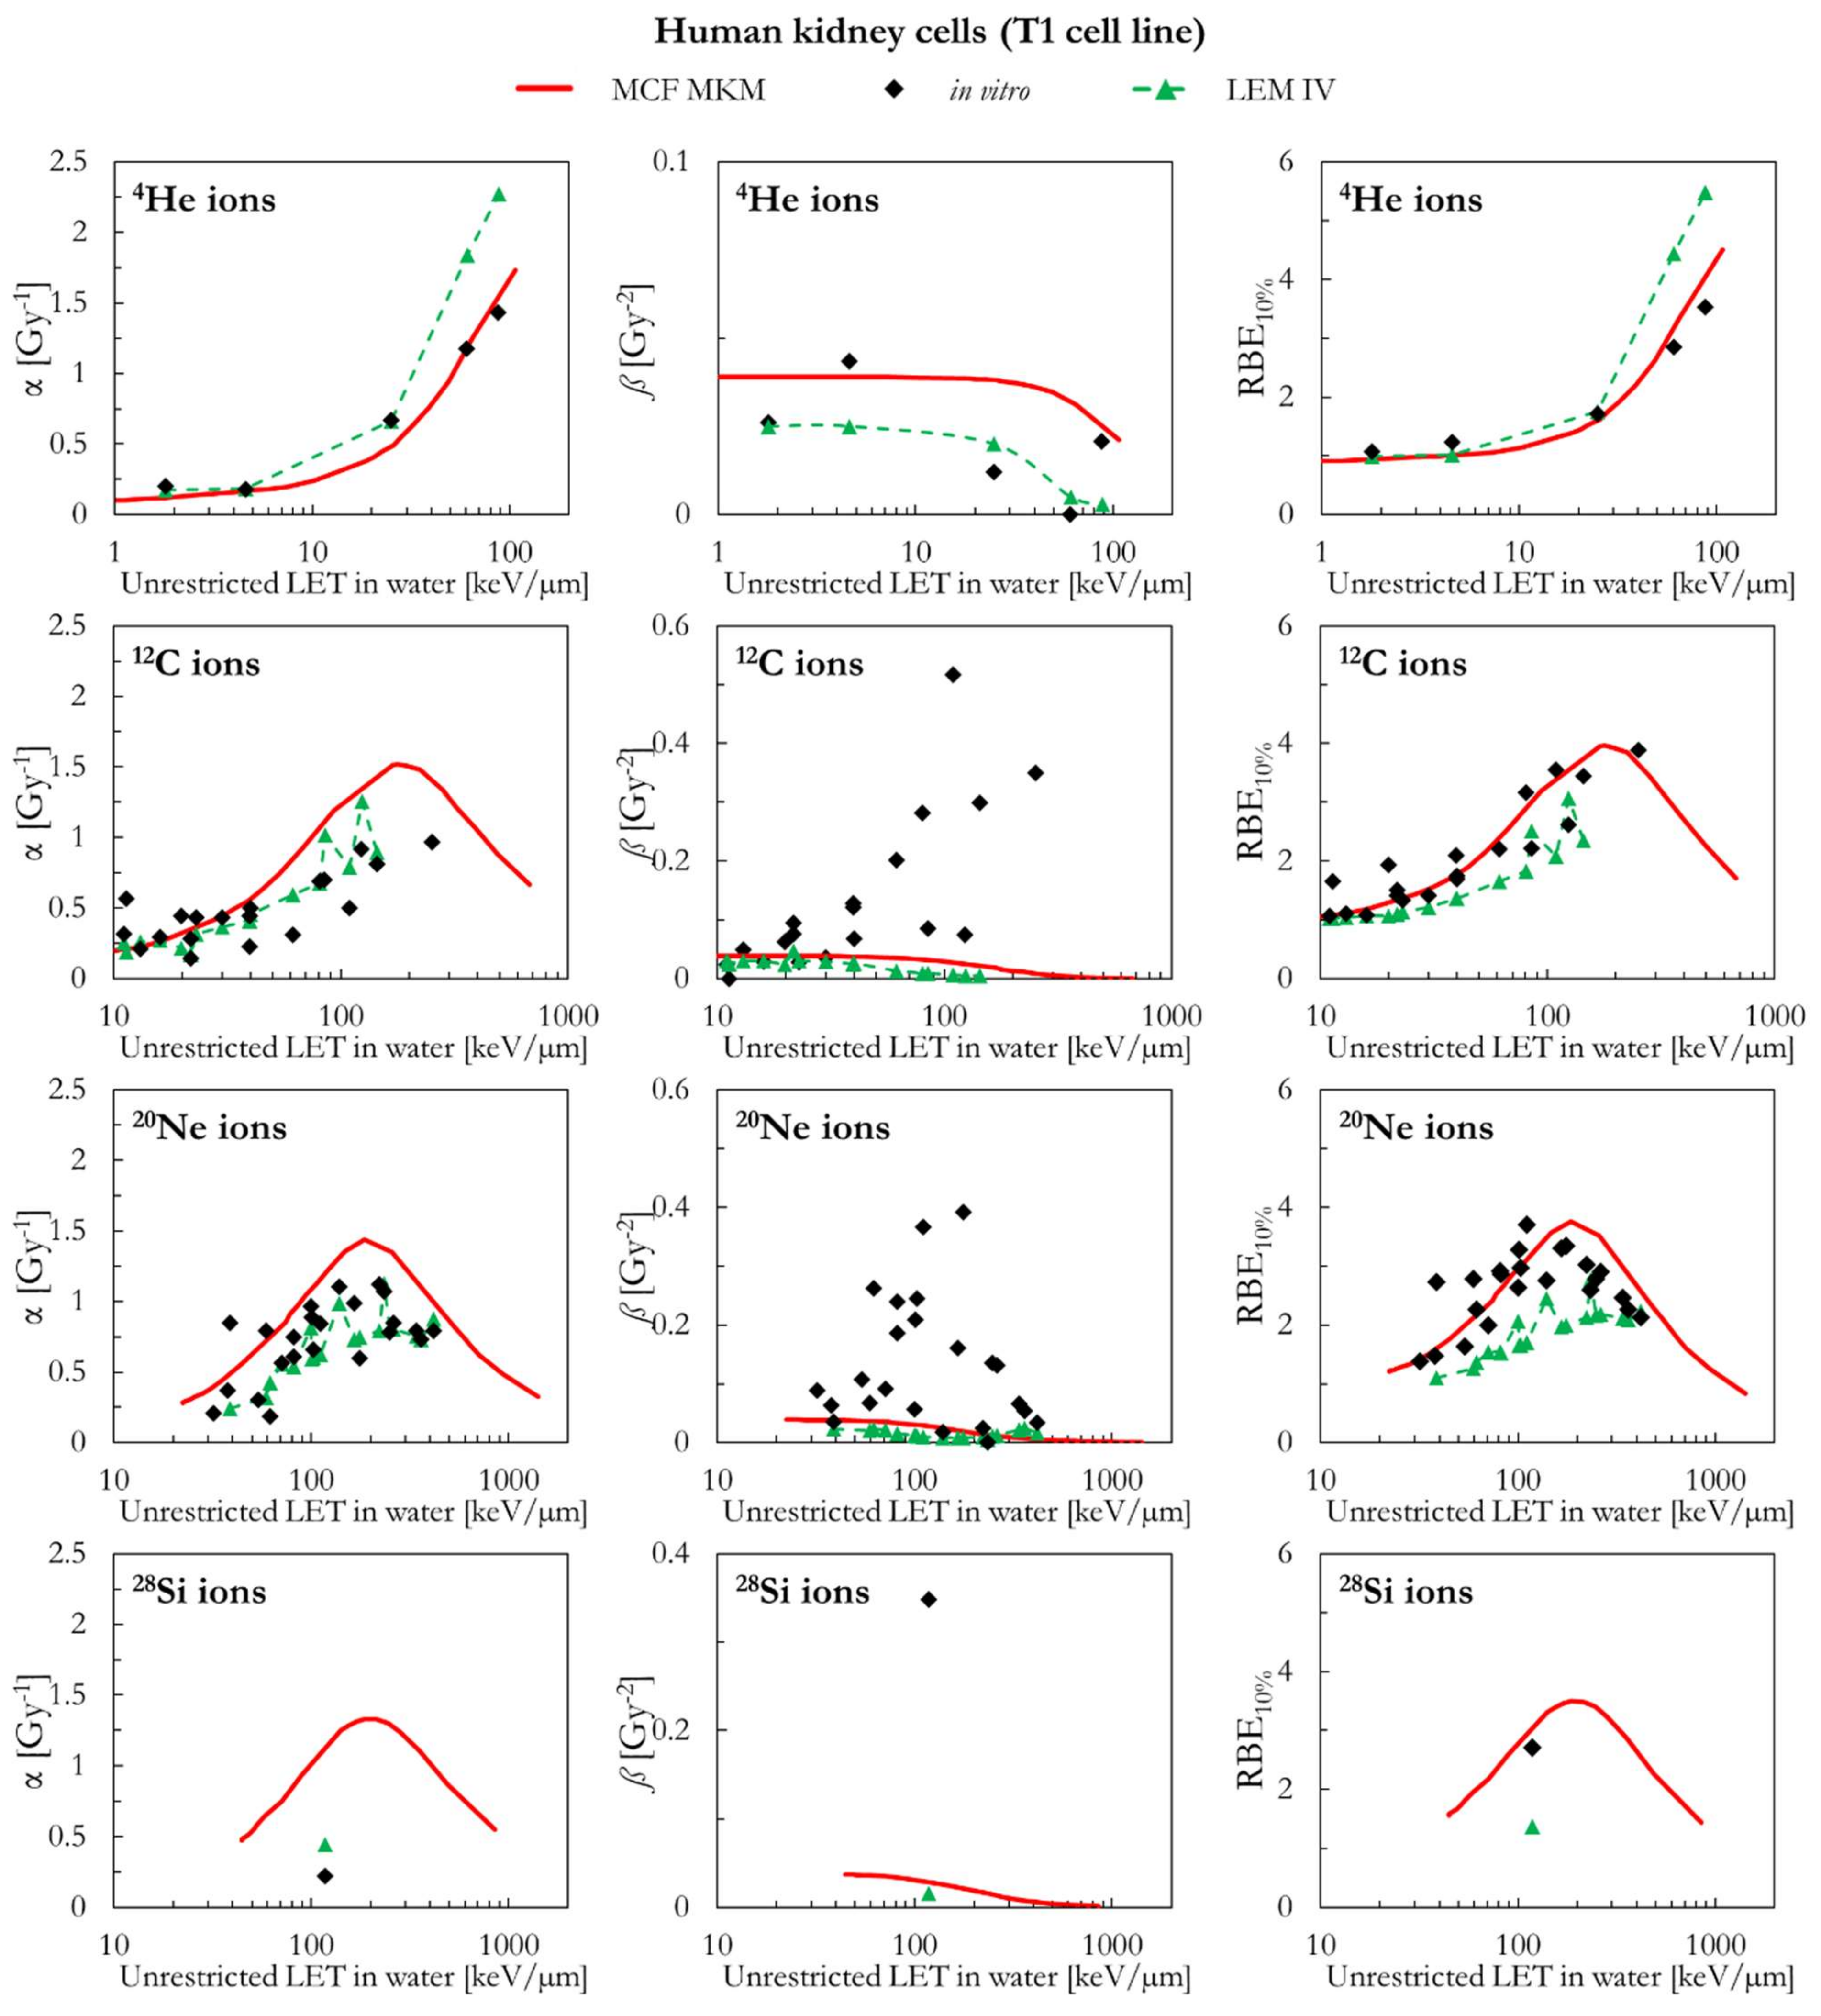
2.2. Human Cell Lines

The results of human cervical cancer cells (HeLa cell line) are plotted in Figure 5 as a function of the LET for 1H and 4He ions. Both models (MCF MKM and LEM IV) overestimate the in vitro α values for 1H ions. The overestimation is significantly larger for the LEM IV. By contrast, the proton ß values calculated by the two models agree well between each other but underestimate the in vitro ß data. This concomitant overestimation of α and underestimation of ß might be an artifact due to the anti-correlation between the two LQM terms during the fit of the in vitro data [34,45]. Nonetheless, the RBE10% values predicted by the MCF MKM are in good agreement with the corresponding in vitro results for 1H ions. By contrast, the LEM IV seems to overestimate the HeLa proton RBE10%. Though the results of the three data series (MCF MKM, LEM IV, in vitro) are in closer agreement, the discussion of the HeLa results for 4He ions follows the one for 1H ions and it is not repeated.
As for the HeLa cell line, the α and RBE10% calculated by the two models (MCF MKM and LEM IV) in case of proton-irradiated human fetal lung fibroblasts (HF19 cell line) are higher than the corresponding in vitro data (Figure 5). The overestimation is larger for the LEM IV. The in silico ß values for 1H ions are in good agreement between MCF MKM and LEM IV, but significantly higher than the in vitro ones. For 12C ions, the unclear trend of the in vitro data prevents any meaningful discussion on the biophysical calculations.
Figure 6 includes a comparison between the in silico and in vitro data for human leukemia cells (HL-60 cell line) for 12C, 28Si, and 56Fe ions. In all cases, the ß values by the MCF MKM and the LEM IV are significantly smaller than the in vitro data. Therefore, due the previously discussed anti-correlation, it is expected that the modelled α values are overestimated by the models. Except for a 12C data point at ~20 keV/µm, this seems the case for the MCF MKM in case of 12C and 56Fe ions. Nonetheless, the RBE10% is reasonably well described by both models for 12C and 56Fe ions. For 28Si ions, the MCF MKM appear to systematically overestimates the α and the RBE10% values. By contrast, the LEM IV well reproduces the α values for 28Si ions. Furthermore, the LEM IV underestimates the RBE10% for the 100 keV/µm 28Si ions, but well describes the in vitro data at higher LET (2–300 keV/µm 28Si ions).
The MCF MKM results for human mammary epithelial cells (M/10 cell line) are shown in Figure 6 together with the corresponding in vitro data for 12C ions. No LEM IV data were available. A good agreement between the calculated and the measured cell response is present over the whole LET range.
Figure 7 compares the in silico and in vitro results for human skin fibroblasts (NB1RGB cell line) in case of exposures to 12C, 20Ne, and 28Si ions. For 12C ions, the α and RBE10% values calculated with the MCF MKM and the LEM IV are reasonably similar and in good agreement with the in vitro data. The MCF MKM accurately describes the α and the RBE10% trends for 20Ne ions. The α and RBE10% values calculated by the MCF MKM for 28Si ions appear to underestimate the in vitro data. The LEM IV appears to systematically underestimate α and RBE10% for both 20Ne and 28Si ions. Once the dispersion in the in vitro ß values for 12C and 20Ne ions is considered, we conclude that both models describe this quantity reasonably well. On the other hand, though the ß values calculated by the MCF MKM and LEM IV for 28Si ions are somehow similar, both models significantly overestimate the experimental trend of ß.
The in silico and in vitro data for human laryngeal squamous cell carcinoma (SQ20B cell line) are compared in Figure 8. In case of 1H ions, the MCF MKM and the LEM IV seem to overestimate the in vitro α and RBE10% values. The overestimation is larger for the LEM IV. Except for the two highest-LET in vitro entries for 12C ions, the MCF MKM seems to well reproduce the in vitro α values. On the other hand, the LEM IV results appear to be smaller. However, the LEM IV seems to better describe the ß trend as a function of the LET for 12C ions. The in vitro RBE10% of 12C with LET < 100 keV/µm appears to be underestimated by both models, with the LEM IV showing the smaller RBE10% values. The MCF MKM seems to reproduce the in vitro α entry for 40Ar ions reasonably well. Though larger than the corresponding in vitro entry, both models predict a similar ß value for 40Ar ions. The MCF MKM and the LEM IV, respectively, overestimates and underestimates the RBE10% for 40Ar ions.
The results of human kidney cells (T1 cell line) are plotted in Figure 9 (4He, 12C, 20Ne, and 28Si ions) and Figure 10 (40Ar, 56Fe, and 238U ions). In case of 4He ions, the MCF MKM seems to accurately reproduce the in vitro data. By contrast, the LEM IV appears to overestimate the α and RBE10% in vitro data for 4He ions. For ions from 12C to 56Fe, the in vitro data are characterized by large values of ß (i.e., significantly higher than ßref) which are underestimated by both models. Therefore, due to the previously discussed anti-correlation between α and ß [34,45], it would be expected that the models overestimate the in vitro α data. Indeed, this is the case for the MCF MKM that predicts α values larger than the in vitro ones. Nonetheless, the RBE10% values computed with the MCF MKM are in satisfactory agreement with the in vitro results for these ions (12C to 56Fe). Interestingly, the α values calculated by the LEM IV for ions from 12C to 56Fe agree reasonably well with the in vitro data. However, the RBE10% predicted by the LEM IV are systematically smaller than the in vitro data (12C to 56Fe ions). In case of 238U ions, the results of both models are in reasonable agreement with the in vitro data.
As can be seen in Figure 11, the MCF MKM predictions for the carbon-irradiated human myeloid leukemia cells (TK1 cell line) are in good agreement with the in vitro data. In contrast, the α and RBE10% results of the LEM IV are systematically lower than the corresponding in vitro ones. The spread in the in vitro ß data prevents from drawing any conclusion on which model better describes this quantity for the TK1 cell line.
Figure 11 also includes the results of human glioblastoma cells (U-87 cell line) exposed to protons. Though the LET dependence of the LQM parameters seems to be best described by the LEM IV, the RBE10% values calculated by both models are similar and in good agreement with the in vitro data.
Finally, the MCF MKM predictions for human astrocytoma cells (U-251MG cell line) are compared to the carbon-exposed in vitro data in Figure 11. This cell line is characterized by an unusually low αref (=0.031 Gy−1), an unusually low αref/ßref ratio (=0.56 Gy), and relatively large in vitro values of α for the 12C ions exposures (>0.4 Gy−1). Therefore, the in vitro RBE for low dose exposures (RBEα = α/αref) shows very large values (up to 35, Figure S15 in the Supplementary Materials). Though some deviations between the in silico and the in vitro data are present especially for the entry at LET > 100 keV/µm, it is surprising that the MCF MKM was able to reasonably predict most of the results of this unusual data series.
Figure 5. α, ß, and RBE10% for the HeLa and the HF19 cell lines in case of 1H (HeLa and HF19 cell lines), 4He (HeLa cell line), and 12C (HF19 cell line) ions: MCF MKM predictions compared with published in vitro data from PIDE 3.2 [34] and published LEM IV results [28].
Ijms 23 12491 g005
Figure 6. α, ß, and RBE10% for the HL-60 and the M/10 cell lines in case of 12C (HL-60 and M/10 cell lines), 28Si (HL-60 cell line), and 56Fe (HL-60 cell lines) ions: MCF MKM predictions compared with published in vitro data from PIDE 3.2 [34] and published LEM IV results [28].
Ijms 23 12491 g006
Figure 7. α, ß, and RBE10% for the NB1RGB cell line in case of 12C, 20Ne, and 28Si ions: MCF MKM predictions compared with published in vitro data from PIDE 3.2 [34] and published LEM IV results [28].
Ijms 23 12491 g007
Figure 8. α, ß, and RBE10% for the SQ20B cell line in case of 1H, 12C, and 40Ar ions: MCF MKM predictions compared with published in vitro data from PIDE 3.2 [34] and published LEM IV results [28].
Ijms 23 12491 g008
Figure 9. α, ß, and RBE10% for the T1 cell line in case of 4He, 12C, 20Ne and 28Si ions: MCF MKM predictions compared with published in vitro data from PIDE 3.2 [34] and published LEM IV results [28].
Ijms 23 12491 g009
Figure 10. α, ß, and RBE10% for the T1 cell line in case of 40Ar, 56Fe, and 238U ions: MCF MKM predictions compared with published in vitro data from PIDE 3.2 [34] and published LEM IV results [28].
Ijms 23 12491 g010
Figure 11. α, ß, and RBE10% for the TK1, the U87, and the U251MG cell lines in case of 1H (U-87 cell line) and 12C (TK1 and U-251MG cell lines) ions: MCF MKM predictions compared with published in vitro data from PIDE 3.2 [34] and published LEM IV results [28].
Ijms 23 12491 g011

3. Materials and Methods

3.1. Relative Biological Effectiveness

The linear-quadratic model (LQM, Equation (1) [17,18]) was used to describe all clonogenic survival curves included in this article.
S = exp α D β D 2
S is the surviving fraction as a function of the absorbed dose D, α and ß are exposure- and cell- specific fitting parameters.
The RBE for the surviving fraction S (RBES) was calculated using Equation (2) [35]
R B E S = α + α 2 4   β ln S α ref + α ref 2 4   β ref ln S
where α, ß, αref and ßref are the linear and quadratic terms of the LQM for the radiation under investigation and the reference photon exposure respectively.

3.2. Clonogenic Survival Data

3.2.1. Particle Irradiation Data Ensemble

All in vitro clonogenic survival data were extracted from the Particle Irradiation Data Ensemble (PIDE [29]) version 3.2 (updated in November 2019 [34]). The database contains 1118 ion exposure entries for more than 100 cell lines. The data were collected from 115 papers published between 1966 and 2015. Corresponding survival curves for the reference photon exposures are also listed when available. All in vitro entries are for cell lines irradiated in normoxic conditions.
The following physical information are listed for each entry: particle type, energy, LET in water, beam type (monoenergetic or a spread out Bragg peak), cell line details (name, human or rodent, tumor or healthy), and the cell cycle phase. Two sets of linear-quadratic terms are included in PIDE: the result of the fit performed by the authors of the original publication and by the PIDE team. When possible, the second set of LQM terms was preferred due to the systematic fit procedure by the PIDE team [29,35]). Uncertainty intervals are not provided for the clonogenic survival data in PIDE.

3.2.2. Initial Filtering

For consistency with the in silico calculations performed with monoenergetics ions, we discarded PIDE entries for cell exposures within spread out Bragg peaks. To avoid partial cell irradiations and the large uncertainties associated with very-low energy exposures, we discarded entries in case of ions with energy <1 MeV/n. Afterwards, since this work deals with asynchronized repair-competent cell lines only, we included only asynchronized PIDE entries for which at least one of the two LQM sets (original fit and PIDE fit) includes positive αref and ßref values. Similarly, we included PIDE entries for which at least one of the two LQM sets has a non-negative value of ß for the ion exposure. These negative ß values are supposed to be due to the presence of subpopulations of cells with different radiation resistance [34]. However, this is currently beyond the predictive capability of the MCF MKM and will likely be topic of future investigation. We also excluded 9 entries for which the only available set of LQM terms for the ion exposures listed α = 0 and a large value of ß. This initial filtering of PIDE led to a database containing 629 entries: 296 for human cell lines and 333 for rodent cell lines.
The following paragraphs describe the process of in vitro data selection for both rodent and human cell lines. An overview on the cell lines included in this study (name of the cell line, type of cell, number of PIDE entries, ions used for the exposures) is given in Table 1.

3.2.3. Data Selection for Rodent Cell Lines

After the initial filtering, 333 PIDE entries were available for rodent cell lines. Since the results of Chinese hamster lung fibroblasts (V79 cell line) were topic of a previous investigation [33], the 211 PIDE entries for the V79 cell line were not included in this study.
85 of the remaining 122 PIDE entries were in case of repair-competent Chinese hamster ovary cells (CHO and CHO-K1 cell lines), Chinese hamster peritoneal fibroblasts (B14FAF28 cell line), and mouse embryo fibroblasts (C3H10T1/2 cell line). All the B14FAF28 entries in PIDE were extracted from a single study [46] and are in case of irradiations with heavy ions (40Ar and heavier ions) with energy less than 10 MeV/n. However, in case of ions heavier than 20Ne, it was only possible to accurately compute the microdosimetric spectra for ions of energy equal or greater than 10 MeV/n (see Section 3.3.2). Therefore, the in vitro data for the B14FAF28 cell line were not included in the analysis.
The remaining 37 rodent entries in PIDE were for 16 different cell lines. Cell lines with less than 3 entries for at least one ion were discarded. The remaining 14 PIDE entries were in case of rat intestinal epithelial fibroblasts (IEC-6 cell line), rat prostatic adenocarcinoma epithelial cells (R-3327-AT-1 cell line), epidermal cells of a newborn mice transformed with the carcinogenic dimethylbenzanthracene (PDV cell line), and squamous skin cancer cells obtained by injecting PDV cells in mice (PDV C57 cell line). Since the number of chromosomes and the radiosensitivity of the IEC-6 cell line were reported to significantly vary with the passage number [47], this cell line was not included in the analysis. Similarly, we excluded the PDV C57 cell line since we could not find karyotypic nor morphologic information. It was not possible to assume that the PDV C57 cells are similar to the ones of the parent PDV cell line because the former ones are significantly larger and with a more heterogenous morphology [48]. Since the R-3327-AT-1 cell line is named RAT-1 in PIDE and in the original publication [47], we use this abbreviation also in this article.

3.2.4. Data Selection for Human Cell Lines

At first, PIDE entries for the human salivary gland tumor cells (HSG cell line), glioblastoma cells (A-172 cell line), and foreskin fibroblasts (AG01522 cell line) were excluded since part of other MCF MKM studies (HSG cell line in [33]; A-172 and AG01522 cell lines in [45]). Clonogenic survival data for 10 human cell lines were included in this study: the 8 cell lines with most entries in PIDE (listed below), cervical cancer cells (HeLa cell line), and astrocytoma cells (U-251MG cell line). The HeLa cell line was selected since it is the oldest immortalized human cell line, it is commonly used for cancer research, and because morphologic and karyotypic information are available in the literature. The U-251MG cell line was chosen due to its clinical relevance, the unusually low αref/ßref ratio of ~0.6 Gy, and the availability of morphologic and karyotypic information in the literature. The 8 cell lines with most entries in PIDE were: kidney cells (T1 cell line), skin fibroblasts (NB1RGB cell line), laryngeal squamous cell carcinoma (SQ20B cell line), myeloid leukemia cells (TK1 cell line), leukemia cells (HL-60 cell line), fetal lung fibroblasts (HF19 cell line), mammary epithelial cells (M/10 cell line), and glioblastoma cells (U-87 cell line). Entries for U-87 MG cell line were not pooled together with the ones for the U-87 cell line because of their different radiosensitivity (i.e., αref/ßref = 1.9 Gy for the U-87 cell line [49]; αref/ßref = 6.8 Gy for the U-87 MG cell line [50]. This is likely due to the different origin of these two cell lines [39].

3.3. Biophysical Modeling

The MCF MKM [33] was used to predict the clonogenic survival curves. The linear and quadratic terms of the LQM (α and ß) are calculated using Equations (3) and (4) respectively.
α = α 0 1 + β 0 α 0   y ρ   π   r d 2     c y   d y   d y  
β = β 0 c y d y   d y   2
The correction factor c(y) accounts for the non-Poisson distribution of lethal lesions at high LET and is calculated with Equation (5).
c y = 1 exp α 0 1 + β 0 α 0   y ρ   π   r d 2     y ρ   π   R n 2   β 0   y ρ   π   R n 2 2   α 0 1 + β 0 α 0   y ρ   π   r d 2     y ρ   π   R n 2   + β 0   y ρ   π   R n 2 2
d(y) is the dose probability density of the lineal energy y, α0 and ß0 are the LQM terms in the limit of y0, R n is the mean radius of the cell nucleus, rd is the mean radius of the subnuclear domains, and ρ is the density (=1 g/cm3).
The equation used to assess α (Equation (3)) is an alternative implementation of the non-Poisson MKM [8]. While the non-Poisson MKM [8] is based on the calculation of the biological effect for the dose-mean lineal energy value of the microdosimetric spectrum, the MCF MKM calculates α as the dose-mean value of the biological effect over the microdosimetric spectrum [33]. In a somehow similar way as the clinical version of the LEM [51], the MCF MKM assumes that ß (LQM term describing the quadratic-dependence of the clonogenic survival with respect to dose) can be computed using a quadratic implementation (Equation (4)) of the correction factor c(y) (Equation (5)) used for the calculation of α [33].

3.3.1. Model Parameters

In addition to the simulated microdosimetric spectra (Section 3.3.2), the MCF MKM requires these parameters as input for the RBE calculations: the mean radius of the spherical cell nucleus (Rn), the mean radius of the spherical subnuclear domains (rd), the LQM terms for the reference photon exposure (αref and ßref), and the LQM terms in the limit of y00 and ß0). No in vitro ion-exposure data were used at any point for the assessment of these parameters. All the model parameters are representative of population-mean characteristics [33] and are described below. The numerical values of Rn, rd, αref and ßref used in the MCF MKM calculations are listed in Table 2.

Mean DNA Content of the Irradiated Population, Γ

At first, we introduce an additional parameter that is used for the assessment of rd and, in some cases, also of Rn: the mean DNA content of the irradiated population Γ . The latter quantity is calculated with Equation (6)
Γ = γ   p   ξ  
where   γ is the normal DNA content for one set of chromosomes (3050 Mbp for humans, 2750 Mbp for rats, 2700 Mbp for Chinese hamsters, and 2650 Mbp for mice [14]), p is the ploidy number, and ξ is a factor accounting for the cell cycle distribution of the irradiated population (ξ = 4/3 for asynchronized cells [33]).
The ploidy number p is equal to 2 for healthy cell lines and for diploid cancer cells. Though mutated chromosomes might contain an abnormal amount of DNA, an approximated value of p for aneuploid cancer cells can be calculated with Equation (7)
p = x x n
where x is the mean number of chromosomes in the aneuploid cell population and xn is the number of chromosomes in a normal set (23 for humans, 21 for rats, 11 for Chinese hamsters, and 20 for mice [14]).
In this work, the ploidy number p was set to 2 for the healthy cell lines (C3H10T1/2, CHO and CHO-K1, M/10, NB1RGB, and T1) and for the myeloid leukemia cells (TK1 cell line) which were reported to be pseudodiploid [52]. For the aneuploid cancer cell lines the ploidy number was calculated with Equation (7). The number of chromosomes in the aneuploid cell population x was extracted from literature and it is equal to: 78 for the HeLa cell line [53], 44 for the HL-60 cell line [54], 62 for the PDV cell line [55], 59 for the RAT-1 cell line [47], 39.4 for the U-87 cell line [56], and 54.6 for the U-251MG cell line [56]. Since we could not find karyotypic information for the SQ20B cell line, we derived a value of 39.3 chromosomes as the mean of the number of chromosomes for similar head and neck squamous cell carcinoma cells [56].

Mean Radius of the Cell Nucleus, Rn

Three approaches are used for the assessment of the mean radius of the cell nucleus Rn. Details of the morphological information from literature can be found in Table S1 in the Supplementary Materials.
(1) Preferably, the radius of the cell nucleus is extracted from literature as determined by means of morphologic measurements for cells presenting a spherical nucleus (i.e., after trypsinization). This is the approach used in our previous work [33] dealing with Chinese hamster lung fibroblasts (V79 cell line) and human salivary glands tumor cells (HSG cell line).
However, since this information is not always available, two additional strategies are used in this article.
(2) The mean radius of the spherical nucleus (Rn) can be assessed from the cross-sectional area of the nucleus measured in case of attached cells. Generally, Rn is calculated with Equation (8)
R n = A π
where A is the cross-sectional area of the nucleus. This approach implicitly assumes that the half-thickness of the nucleus is equal to the radius assessed with Equation (8). However, the nucleus of cells attached during the microscopic measurements is not spherical, but more similar to an oblate spheroid/ellipsoid. Published results indicate that the vertical semi-axis of the oblate spheroid/ellipsoid is roughly a third of the mean radius of the cross-sectional area of the nucleus [57,58,59,60]. Therefore, the volume of the spherical nucleus with radius equal to the one calculated with Equation (8) can be significantly larger than the one of the real (spheroid/ellipsoid-like) nucleus.
Thus, we introduce an alternative formula (Equation (9)) to calculate Rn as the radius of the sphere having the same volume of a spheroid with the equatorial radius equal to the one calculated with Equation (8) and the minor semi-axis equal to a third of the equatorial radius
R n = A π   3 3 0.693   A π  
where A is the cross-sectional area of the nucleus.
(3) If also no cross-sectional area measurements are available, we propose a novel phenomenological correlation between the mean DNA content of an asynchronized population Γ and the mean radius of the cell nucleus Rn for asynchronized cells. In this regard, Figure 12 shows the mean radius of the cell nucleus Rn plotted as a function of the mean DNA content of 22 different asynchronized cell lines (details on the published morphological data [9,57,58,61,62,63,64,65,66,67,68,69] can be found in Table S1 in the Supplementary Materials). A phenomenological correlation was established between the two quantities as described in Equation (10). It is discouraged to extrapolate this correlation outside the investigated range of Γ [Gbp].
R n = 3.5   µ m + 0.144   µ m G b p   · Γ

Mean Radius of the Subnuclear Domains, rn

The subnuclear domains in MKMs are meant to represent the dimension of subnuclear structures where the accumulation of radiation-induce damage (likely DNA DSBs) is thought to correlate with cell death [12,26,70]. Previous studies suggest that these subnuclear structures are likely to be giant loops of chromatin containing approximately 2 Mbp of DNA [70,71,72].
Therefore, under the simplifying assumption that the DNA is homogenously distributed within the cell nucleus, we hypothesize that the MCF MKM subnuclear domains represent the average volume of the cell nucleus containing 2 Mbp of DNA. Thus, the mean radius of the subnuclear domains (rd) can be assessed with Equation (11) [33]:
r d = R n λ Γ 3
where R n   is the average nuclear radius, λ is the amount of DNA in a chromatin substructure (2 Mbp), and Γ is the average DNA content of the irradiated cell population.

LQM Terms for the Reference Photon Exposure, αref and ßref

If all PIDE entries for a specific cell line share the same photon reference irradiation, then αref and ßref are simply the α and ß values for that reference photon survival curve. Alternatively, as done in previous studies [31,33], in silico calculations representative of the average cell line radiosensitivity were performed. This was done to efficiently tackle the dispersion of a cell-specific in vitro dataset presenting entries extracted from an heterogenous pool of different publications. The average values of αref and ßref were calculated with Equations (12) and (13):
α r e f = α r e f ,   i   n i n i
β r e f = β r e f ,   i   n i n i
where αref,i and ßref,i are the LQM terms for a reference photon exposure, and ni is the number of ion-exposure entries for that set of αref,i and ßref,i. This weighted sum was used to prevent photon experiments with few ion-exposure entries from biasing the calculation of the average αref and ßref. This approach was used for half of the cell lines included in this article, namely: CHO and CHO-K1, C3H10T1/2, HF19, NB1RGB, SQ20B, T1, and TK1.

LQM Terms in the Limit of y → 0, α0 and ß0

α0 and ß0 are determined by analyzing only photon in vitro data. Since the integral in Equation (5) is equal to ~1 for the reference photons, then ß0 = ßref.
Similarly, α0 can be calculated using Equation (14) [33]:
α 0 = α r e f   β 0   y ¯ D , r e f   ρ   π   r d 2
where y ¯ D , r e f   is the dose-mean lineal energy for the reference photon exposure.
The dose-mean lineal energy y ¯ D   is calculated as in Equation (15).
y ¯ D   =   y   d y   d y
Since it is unpractical nor feasible to perform experiment-specific calculations of y ¯ D , r e f   , representative simulated y ¯ D , r e f   values were used: 2.3 keV/µm for γ-rays (60Co and 137Cs) and energetic X-rays (6 MV), 4.3 keV/µm for less energetic X-rays (i.e., 200 kV X-rays) [33].

3.3.2. Radiation Transport Simulations

The computation of the microdosimetric spectra and the LET follows the methodology of our previous study with the MCF MKM [33] and only a summary is given here. The lineal energy distributions were assessed with the microdosimetric function [73,74] implemented in the Particle and Heavy Ion Transport code System [75] version 3.2.4. The function was used to compute microdosimetric distributions in homogeneous conditions for spherical targets randomly placed around the particle track over an infinitesimal layer of water. Monoenergetic beams of 1H, 4He, 7Li, 12C, 16O, 20Ne, 28Si, 40Ar, 56Fe, 238U ions were simulated. The energy of the ions was equal to 1, 2, 3, 4, 5, 6, 7, 8, 9, 10, 20, 30, 40, 50, 60, 70, 80, 90, 100, 200, 300, 400, 500, 600, 700, 800, 900, 1000 MeV/n. The lineal energy spectra for ions heavier than 20Ne with energy lower 10 MeV/n were disregarded because of the presence of an inappropriate peak (personal communication with Tatsuhiko Sato, PHITS team leader). A logarithmic binning from 10−2 to 107 keV/µm with 50 bins per decade was used to score the lineal energy spectra. The minimum energy deposition considered in the microdosimetric calculations was that for one event of one ionization only (10.9 eV [73]).
In order to facilitate the comparison between the in silico and in vitro data, the unrestricted LET in water was assessed using the ATIMA model (http://web-docs.gsi.de/∼weick/atima/ (accessed on 5 September 2022) implemented in PHITS for the beams used to assess the microdosimetric spectra. Since the monoenergetic simulations were performed over an infinitesimal target, the simulated track- and dose- mean LET values were equivalent. By contrast, the in vitro experimental exposures are performed with quasi-monoenergetic beams. Consequently, track- and dose- mean LET values could differ. The inclusion of secondary fragments in the mean LET calculation and the use of different methods (stopping power tables, different LET models) significantly influence the LET results. Since details on the LET calculations were not always included in the publications from which the in vitro data were extracted and because different articles used different methodologies to calculate and average the LET, all results of this study are plotted as a function of a generic “unrestricted LET in water”.

4. Conclusions

The systematic benchmark performed in this work (10 ions from 1H to 238U, 14 cell lines with an αref/ßref ratio ranging from ~0.6 to 30 Gy) suggests that the MCF MKM can accurately predict the in vitro clonogenic survival without requiring ion-irradiated in vitro data as input. This was possible thanks to several new strategies introduced to a priori determine the MCF MKM parameters by means of morphologic and karyotypic information.
Considering the differences between the modeling approaches (i.e., microdosimetry for the MCF MKM and amorphus track structure for the LEM IV) and the use of average radiosensitivity predictions for the MCF MKM (all LEM IV calculations are experiment specific), a reasonable agreement between the results of the models was found in most cases.
Future work with the MCF MKM is planned to include in the model dose-rate and fractionation effects, enhanced cell radioresistance due to hypoxia, and the transition of the survival curve to a constant slope at high doses. Additionally, we will investigate the possibility to extend the MCF MKM predictions to in vivo and patient data.

Supplementary Materials

The following supporting information can be downloaded at: https://www.mdpi.com/article/10.3390/ijms232012491/s1.

Author Contributions

Conceptualization, A.P., C.J.B. and K.M.F.; Data curation, A.P.; Formal analysis, A.P.; Funding acquisition, C.J.B. and K.M.F.; Methodology, A.P., C.J.B. and K.M.F.; Project administration, C.J.B. and K.M.F.; Software, A.P.; Supervision, C.J.B. and K.M.F.; Visualization, A.P.; Writing—original draft, A.P.; Writing—review & editing, A.P., C.J.B. and K.M.F.. All authors have read and agreed to the published version of the manuscript.

Funding

This research received no external funding.

Institutional Review Board Statement

Not applicable.

Informed Consent Statement

Not applicable.

Data Availability Statement

All MCF MKM results in this study are plotted of this article and in the Supplementary Materials. The in vitro data were extracted from the PIDE database [29,34]. The LEM IV data were extracted from the Supplementary Materials of [28].

Acknowledgments

Alessio Parisi is very thankful to Tatsuhiko Sato (Japan Atomic Energy Agency, Japan) for the fruitful discussion on the PHITS microdosimetric function and to Thomas Friedrich (GSI Helmholtzzentrum für Schwerionenforschung, Germany) for sharing a copy of the PIDE in vitro database.

Conflicts of Interest

The authors declare no conflict of interest.

Abbreviations

αlinear term of the linear-quadratic model of clonogenic survival
αrefα for the reference photon exposure
ßquadratic term of the linear-quadratic model of clonogenic survival
ßrefß for the reference photon exposure
DNAdeoxyribonucleic acid
DSBdouble strand break
LEMlocal effect model [6]
LEM IVfourth version of the local effect model [26]
LETlinear energy transfer
LQMlinear-quadratic model of clonogenic survival [17,18]
MBMmixed beam model [7]
MCFMayo Clinic Florida, Jacksonville, Florida, United States of America
MCF MKMMayo Clinic Florida microdosimetric kinetic model [33]
MKMmicrodosimetric kinetic model [5]
modified MKMmodified microdosimetric kinetic model [9]
non-Poisson MKMcorrected version of the original microdosimetric kinetic model to account for the non-Poisson distribution of lethal lesions [8]
PHITSParticle and Heavy Ion Transport code System [75]
PIDEParticle Irradiation Data Ensemble [29,34]
RBErelative biological effectiveness
RBESin vitro clonogenic cell survival RBE for the surviving fraction S
rdmean radius of the subnuclear domains
Rnmean radius of the cell nucleus

References

  1. Scholz, M. State-of-the-Art and Future Prospects of Ion Beam Therapy: Physical and Radiobiological Aspects. IEEE Trans. Radiat. Plasma Med. Sci. 2020, 4, 147–160. [Google Scholar] [CrossRef] [Green Version]
  2. Stewart, R.D.; Carlson, D.J.; Butkus, M.P.; Hawkins, R.; Friedrich, T.; Scholz, M. A comparison of mechanism-inspired models for particle relative biological effectiveness (RBE). Med. Phys. 2018, 45, e925–e952. [Google Scholar] [CrossRef] [PubMed] [Green Version]
  3. Paganetti, H. Relating the proton relative biological effectiveness to tumor control and normal tissue complication probabilities assuming interpatient variability in α/β. Acta Oncol. 2017, 56, 1379–1386. [Google Scholar] [CrossRef] [PubMed]
  4. Kellerer, A.M.; Rossi, H.H. A Generalized Formulation of Dual Radiation Action. Radiat. Res. 1978, 75, 471. [Google Scholar] [CrossRef] [Green Version]
  5. Hawkins, R.B. A Statistical Theory of Cell Killing by Radiation of Varying Linear Energy Transfer. Radiat. Res. 1994, 140, 366. [Google Scholar] [CrossRef]
  6. Scholz, M.; Kellerer, A.M.; Kraft-Weyrather, W.; Kraft, G. Computation of cell survival in heavy ion beams for therapy. Radiat. Environ. Biophys. 1997, 36, 59–66. [Google Scholar] [CrossRef]
  7. Kanai, T.; Endo, M.; Minohara, S.; Miyahara, N.; Koyama-Ito, H.; Tomura, H.; Matsufuji, N.; Futami, Y.; Fukumura, A.; Hiraoka, T.; et al. Biophysical characteristics of HIMAC clinical irradiation system for heavy-ion radiation therapy. Int. J. Radiat. Oncol. 1999, 44, 201–210. [Google Scholar] [CrossRef]
  8. Hawkins, R.B. A Microdosimetric-Kinetic Model for the Effect of Non-Poisson Distribution of Lethal Lesions on the Variation of RBE with LET. Radiat. Res. 2003, 160, 61–69. [Google Scholar] [CrossRef]
  9. Kase, Y.; Kanai, T.; Matsumoto, Y.; Furusawa, Y.; Okamoto, H.; Asaba, T.; Sakama, M.; Shinoda, H. Microdosimetric Measurements and Estimation of Human Cell Survival for Heavy-Ion Beams. Radiat. Res. 2006, 166, 629–638. [Google Scholar] [CrossRef]
  10. Carlson, D.J.; Stewart, R.D.; Semenenko, V.A.; Sandison, G.A. Combined use of Monte Carlo DNA damage simulations and deterministic repair models to examine putative mechanisms of cell killing. Radiat. Res. 2008, 169, 447–459. [Google Scholar] [CrossRef]
  11. Sato, T.; Furusawa, Y. Cell Survival Fraction Estimation Based on the Probability Densities of Domain and Cell Nucleus Specific Energies Using Improved Microdosimetric Kinetic Models. Radiat. Res. 2012, 178, 341–356. [Google Scholar] [CrossRef]
  12. Mairani, A.; Böhlen, T.T.; Dokic, I.; Cabal, G.; Brons, S.; Haberer, T. Modelling of cell killing due to sparsely ionizing radiation in normoxic and hypoxic conditions and an extension to high LET radiation. Int. J. Radiat. Biol. 2013, 89, 782–793. [Google Scholar] [CrossRef]
  13. Verkhovtsev, A.; Surdutovich, E.; Solov’yov, A.V. Multiscale approach predictions for biological outcomes in ion-beam cancer therapy. Sci. Rep. 2016, 6, 1–10. [Google Scholar]
  14. McMahon, S.J.; McNamara, A.L.; Schuemann, J.; Paganetti, H.; Prise, K.M. A general mechanistic model enables predictions of the biological effectiveness of different qualities of radiation. Sci. Rep. 2017, 7, 10790. [Google Scholar] [CrossRef] [Green Version]
  15. Wang, W.; Li, C.; Qiu, R.; Chen, Y.; Wu, Z.; Zhang, H.; Li, J. Modelling of cellular survival following radiation-induced DNA double-strand breaks. Sci. Rep. 2018, 8, 1–12. [Google Scholar] [CrossRef] [Green Version]
  16. Fujitaka, S.; Fujii, Y.; Nihongi, H.; Nakayama, S.; Takashina, M.; Hamatani, N.; Tsubouchi, T.; Yagi, M.; Minami, K.; Ogawa, K.; et al. Physical and biological beam modeling for carbon beam scanning at Osaka Heavy Ion Therapy Center. J. Appl. Clin. Med. Phys. 2021, 22, 77–92. [Google Scholar] [CrossRef]
  17. Fowler, J.F. The linear-quadratic formula and progress in fractionated radiotherapy. British J. Radiol. 1989, 62, 679–694. [Google Scholar] [CrossRef]
  18. McMahon, S.J. The linear quadratic model: Usage, interpretation and challenges. Phys. Med. Biol. 2018, 64, 01TR01. [Google Scholar] [CrossRef]
  19. Sakama, M.; Kanai, T.; Kase, Y.; Yusa, K.; Tashiro, M.; Torikai, K.; Shimada, H.; Yamada, S.; Ohno, T.; Nakano, T. Design of ridge filters for spread-out Bragg peaks with Monte Carlo simulation in carbon ion therapy. Phys. Med. Biol. 2012, 57, 6615–6633. [Google Scholar] [CrossRef]
  20. Agosteo, S. Detectors for measurement of microdosimetric quantities. Radiat. Meas. 2022, 156, 106807. [Google Scholar] [CrossRef]
  21. Mein, S.; Klein, C.; Kopp, B.; Magro, G.; Harrabi, S.; Karger, C.P.; Haberer, T.; Debus, J.; Abdollahi, A.; Dokic, I.; et al. Assessment of RBE-weighted dose models for carbon ion therapy toward modernization of clinical practice at HIT: In vitro, in vivo, and in patients. Int. J. Radiat. Oncol. Biol. Phys. 2020, 108, 779–791. [Google Scholar] [CrossRef]
  22. Eichkorn, T.; König, L.; Held, T.; Naumann, P.; Harrabi, S.; Ellerbrock, M.; Herfarth, K.; Haberer, T.; Debus, J. Carbon Ion Radiation Therapy: One Decade of Research and Clinical Experience at Heidelberg Ion Beam Therapy Center. Int. J. Radiat. Oncol. Biol. Phys. 2021, 111, 597–609. [Google Scholar] [CrossRef]
  23. Eichkorn, T.; Karger, C.P.; Brons, S.; Koerber, S.A.; Mielke, T.; Haberer, T.; Debus, J.; Herfarth, K. Results of a pro-spective randomized trial on long-term effectiveness of protons and carbon ions in prostate cancer: LEM I and α/β = 2 Gy overestimates the RBE. Radiother. Oncol. 2022, 173, 223–230. [Google Scholar] [CrossRef]
  24. Elsässer, T.; Scholz, M. Cluster Effects within the Local Effect Model. Radiat. Res. 2007, 167, 319–329. [Google Scholar] [CrossRef]
  25. Elsässer, T.; Krämer, M.; Scholz, M. Accuracy of the Local Effect Model for the Prediction of Biologic Effects of Carbon Ion Beams In Vitro and In Vivo. Int. J. Radiat. Oncol. Biol. Phys. 2008, 71, 866–872. [Google Scholar] [CrossRef]
  26. Elsässer, T.; Weyrather, W.K.; Friedrich, T.; Durante, M.; Iancu, G.; Krämer, M.; Kragl, G.; Brons, S.; Winter, M.; Weber, K.J.; et al. Quantification of the relative biological effectiveness for ion beam radiotherapy: Direct experimental comparison of proton and carbon ion beams and a novel approach for treatment planning. Int. J. Radiat. Oncol. Biol. Phys. 2010, 78, 1177–1183. [Google Scholar] [CrossRef]
  27. Friedrich, T.; Grün, R.; Scholz, U.; Elsässer, T.; Durante, M.; Scholz, M. Sensitivity analysis of the relative biological effectiveness predicted by the local effect model. Phys. Med. Biol. 2013, 58, 6827–6849. [Google Scholar] [CrossRef]
  28. Pfuhl, T.; Friedrich, T.; Scholz, M. Comprehensive comparison of local effect model IV predictions with the particle irradiation data ensemble. Med. Phys. 2022, 49, 714–726. [Google Scholar] [CrossRef]
  29. Friedrich, T.; Scholz, U.; Elsässer, T.; Durante, M.; Scholz, M. Systematic analysis of RBE and related quantities using a database of cell survival experiments with ion beam irradiation. J. Radiat. Res. 2013, 54, 494–514. [Google Scholar] [CrossRef] [Green Version]
  30. Kellerer, A.M.; Rossi, H.H. The theory of dual radiation action. Curr. Top. Radiat. Res. Q. 1974, 8, 85–158. [Google Scholar]
  31. Parisi, A.; Furutani, K.M.; Beltran, C.J. On the calculation of the relative biological effectiveness of ion radiation therapy using a biological weighting function, the microdosimetric kinetic model (MKM) and subsequent corrections (non-Poisson MKM and modified MKM). Phys. Med. Biol. 2022, 67, 095014. [Google Scholar] [CrossRef]
  32. Beltran, C.; Amos, R.A.; Rong, Y. We are ready for clinical implementation of Carbon Ion Radiotherapy in the United States. J. Appl. Clin. Med. Phys. 2020, 21, 6–9. [Google Scholar] [CrossRef] [PubMed]
  33. Parisi, A.; Beltran, C.J.; Furutani, K.M. The Mayo Clinic Florida microdosimetric kinetic model of clonogenic survival: Formalism and first benchmark against in vitro and in silico data. Phys. Med. Biol. 2022, 67, 185013. [Google Scholar] [CrossRef] [PubMed]
  34. Friedrich, T.; Pfuhl, T.; Scholz, M. Update of the particle irradiation data ensemble (PIDE) for cell survival. J. Radiat. Res. 2021, 62, 645–655. [Google Scholar] [CrossRef] [PubMed]
  35. Parisi, A.; Sato, T.; Matsuya, Y.; Kase, Y.; Magrin, G.; Verona, C.; Tran, L.; Rosenfeld, A.; Bianchi, A.; Olko, P.; et al. Development of a new microdosimetric biological weighting function for the RBE10 assessment in case of the V79 cell line exposed to ions from 1H to 238U. Phys. Med. Biol. 2020, 65, 235010. [Google Scholar] [CrossRef] [PubMed]
  36. Parisi, A.; Struelens, L.; Vanhavere, F. Comparison between the results of a recently-developed biological weighting function (V79-RBE10 BWF) and the in vitro clonogenic survival RBE10 of other repair-competent asynchronized normoxic mammalian cell lines and ions not used for the development of the model. Phys. Med. Biol. 2021, 66, 235006. [Google Scholar] [CrossRef]
  37. McMahon, S.J.; Schuemann, J.; Paganetti, H.; Prise, K. Mechanistic Modelling of DNA Repair and Cellular Survival Following Radiation-Induced DNA Damage. Sci. Rep. 2016, 6, 33290. [Google Scholar] [CrossRef] [Green Version]
  38. Capes-Davis, A.; Theodosopoulos, G.; Atkin, I.; Drexler, H.G.; Kohara, A.; MacLeod, R.A.; Masters, J.R.; Nakamura, Y.; Reid, Y.A.; Reddel, R.; et al. Check your cultures! A list of cross-contaminated or misidentified cell lines. Int. J. Cancer 2010, 127, 1–8. [Google Scholar] [CrossRef]
  39. Allen, M.; Bjerke, M.; Edlund, H.; Nelander, S.; Westermark, B. Origin of the U87MG glioma cell line: Good news and bad news. Sci. Transl. Med. 2016, 8, 354re3. [Google Scholar] [CrossRef]
  40. Guan, F.; Bronk, L.; Titt, U.; Lin, S.H.; Mirkovic, D.; Kerr, M.D.; Zhu, X.R.; Dinh, J.; Sobieski, M.; Stephan, C.; et al. Spatial mapping of the biologic effectiveness of scanned particle beams: Towards biologically optimized particle therapy. Sci. Rep. 2015, 5, 9850. [Google Scholar] [CrossRef] [Green Version]
  41. Seed, T.M.; Xiao, S.; Manley, N.R.; Nikolich-Zugich, J.; Pugh, J.; Brink, M.V.D.; Hirabayashi, Y.; Yasutomo, K.; Iwama, A.; Koyasu, S.; et al. An interlaboratory comparison of dosimetry for a multi-institutional radiobiological research project: Observations, problems, solutions and lessons learned. Int. J. Radiat. Biol. 2015, 92, 59–70. [Google Scholar] [CrossRef]
  42. Trompier, F.; Baumann, M.; Barrios, L.; Gregoire, E.; Abend, M.; Ainsbury, E.; Barnard, S.; Barquinero, J.F.; Bautista, J.A.; Brzozowska, B.; et al. Investigation of the influence of calibration practices on cytogenetic laboratory performance for dose estimation. Int. J. Radiat. Biol. 2017, 93, 118–126. [Google Scholar] [CrossRef]
  43. Durante, M.; Paganetti, H.; Pompos, A.; Kry, S.F.; Wu, X.; Grosshans, D.R. Report of a National Cancer Institute special panel: Characterization of the physical parameters of particle beams for biological research. Med. Phys. 2019, 46, e37–e52. [Google Scholar] [CrossRef] [Green Version]
  44. Draeger, E.; Sawant, A.; Johnstone, C.; Koger, B.; Becker, S.; Vujaskovic, Z.; Jackson, I.-L.; Poirier, Y. A Dose of Reality: How 20 Years of Incomplete Physics and Dosimetry Reporting in Radiobiology Studies May Have Contributed to the Reproducibility Crisis. Int. J. Radiat. Oncol. Biol. Phys. 2020, 106, 243–252. [Google Scholar] [CrossRef]
  45. Parisi, A.; Beltran, C.J.; Furutani, K.M. The effect of fitting the reference photon dose-response on the clonogenic survival RBE calculated with the Mayo Clinic Florida MKM. Radiat. Prot. Dosim. 2022, in press. [Google Scholar]
  46. Wulf, H.; Kraft-Weyrather, W.; Miltenburger, H.G.; Blakely, E.A.; Tobias, C.A.; Kraft, G. Heavy-Ion Effects on Mammalian Cells: Inactivation Measurements with Different Cell Lines. Radiat. Res. 1985, 104, S122. [Google Scholar] [CrossRef]
  47. Von Neubeck, C. Radiobiological Experiments for Carbon Ion Prostate Cancer Therapy: Interplay of Normal and Tumor Cells in Co-Culture and Measurement of the Oxygen Enhancement Ratio. Ph.D. Thesis, Technische Universität Darmstadt, Germany, 2009. [Google Scholar]
  48. Quintanilla, M.; Haddow, S.; Jones, D.; Jaffe, D.; Bowden, G.; Balmain, A. Comparison of ras activation during epidermal carcinogenesis in vitro and in vivo. Carcinogenesis 1991, 12, 1875–1881. [Google Scholar] [CrossRef]
  49. Chaudhary, P.; Marshall, T.I.; Perozziello, F.M.; Manti, L.; Currell, F.J.; Hanton, F.; McMahon, S.J.; Kavanagh, J.N.; Cirrone, G.A.P.; Romano, F.; et al. Relative Biological Effectiveness Variation Along Monoenergetic and Modulated Bragg Peaks of a 62-MeV Therapeutic Proton Beam: A Preclinical Assessment. Int. J. Radiat. Oncol. Biol. Phys. 2014, 90, 27–35. [Google Scholar] [CrossRef] [Green Version]
  50. Tsuboi, K.; Moritake, T.; Tsuchida, Y.; Tokuuye, K.; Matsumura, A.; Ando, K. Cell Cycle Checkpoint and Apoptosis Induction in Glioblastoma Cells and Fibroblasts Irradiated with Carbon Beam. J. Radiat. Res. 2007, 48, 317–325. [Google Scholar] [CrossRef] [Green Version]
  51. Krämer, M.; Scholz, M. Rapid calculation of biological effects in ion radiotherapy. Phys. Med. Biol. 2006, 51, 1959–1970. [Google Scholar] [CrossRef]
  52. Ohno, H.; Doi, S.; Fukuhara, S.; Yamasowa, M.; Kannagi, M.; Ishikura, H.; Nishikori, M.; Uchino, H. Establishment of a new myeloid leukemia cell line (TK-1), and isolation of cells having a translocation involving a band 17q23. Int. J. Cancer 1986, 37, 761–767. [Google Scholar] [CrossRef] [PubMed]
  53. Macville, M.; Schröck, E.; Padilla-Nash, H.; Keck, C.; Ghadimi, B.M.; Zimonjic, D.; Popescu, N.; Ried, T. Compre-hensive and definitive molecular cytogenetic characterization of HeLa cells by spectral karyotyping. Cancer Res. 1999, 59, 141–150. [Google Scholar] [PubMed]
  54. Liang, J.C.; Ning, Y.; Wang, R.-Y.; Padilla-Nash, H.M.; Schröck, E.; Soenksen, D.; Nagarajan, L.; Ried, T. Spectral Karyotypic Study of the HL-60 Cell Line: Detection of Complex Rearrangements Involving Chromosomes 5, 7, and 16 and Delineation of Critical Region of Deletion on 5q31.1. Cancer Genet. Cytogenet. 1999, 113, 105–109. [Google Scholar] [CrossRef]
  55. Fusenig, N.; Dzarlieva-Petrusevska, R.T.; Breitkreutz, D. Phenotypic and cytogenetic characteristics of different stages during spontaneous transformation of mouse keratinocytes in vitro. Carcinog. Compr. Surv. 1985, 9, 293–326. [Google Scholar]
  56. Oesten, H.; von Neubeck, C.; Jakob, A.; Enghardt, W.; Krause, M.; McMahon, S.J.; Grassberger, C.; Paganetti, H.; Lühr, A. Predicting In Vitro Cancer Cell Survival Based on Measurable Cell Characteristics. Radiat. Res. 2019, 191, 532–544. [Google Scholar] [CrossRef]
  57. Lammerding, J. Mechanics of the nucleus. Compr. Physiol. 2011, 1, 783. [Google Scholar]
  58. Tracy, B.L.; Stevens, D.L.; Goodhead, D.T.; Hill, M.A. Variation in RBE for Survival of V79-4 Cells as a Function of Alpha-Particle (Helium Ion) Energy. Radiat. Res. 2015, 184, 33–45. [Google Scholar] [CrossRef] [Green Version]
  59. Kashani, A.S.; Packirisamy, M. Cellular deformation characterization of human breast cancer cells under hydro-dynamic forces. AIMS Biophys. 2017, 4, 400–414. [Google Scholar] [CrossRef]
  60. Sakata, D.; Lampe, N.; Karamitros, M.; Kyriakou, I.; Belov, O.; Bernal, M.A.; Bolst, D.; Bordage, M.-C.; Breton, V.; Brown, J.M.; et al. Evaluation of early radiation DNA damage in a fractal cell nucleus model using Geant4-DNA. Phys. Med. 2019, 62, 152–157. [Google Scholar] [CrossRef] [Green Version]
  61. Weyrather, W.K.; Ritter, S.; Scholz, M.; Kraft, G. RBE for carbon track-segment irradiation in cell lines of differing repair capacity. Int. J. Radiat. Biol. 1999, 75, 1357–1364. [Google Scholar]
  62. Konishi, T.; Takeyasu, A.; Yasuda, N.; Natsume, T.; Nakajima, H.; Matsumoto, K.; Asuka, T.; Sato, Y.; Furusawa, Y.; Hieda, K. Number of Fe ion traversals through a cell nucleus for mammalian cell inactivation near the Bragg peak. J. Radiat. Res. 2005, 46, 415–424. [Google Scholar] [CrossRef] [Green Version]
  63. Gacsi, M.; Nagy, G.; Pinter, G.; Basnakian, A.G.; Banfalvi, G. Condensation of interphase chromatin in nuclei of synchronized Chinese hamster ovary (CHO-K1) cells. DNA Cell Biol. 2005, 24, 43–53. [Google Scholar] [CrossRef]
  64. Monier, K.; Armas, J.C.G.; Etteldorf, S.; Ghazal, P.; Sullivan, K.F. Annexation of the interchromosomal space during viral infection. Nat. Cell Biol. 2000, 2, 661–665. [Google Scholar] [CrossRef]
  65. Suzuki, M.; Kase, Y.; Yamaguchi, H.; Kanai, T.; Ando, K. Relative biological effectiveness for cell-killing effect on various human cell lines irradiated with heavy-ion medical accelerator in Chiba (HIMAC) carbon-ion beams. Int. J. Radiat. Oncol. Biol. Phys. 2000, 48, 241–250. [Google Scholar] [CrossRef]
  66. Azzam, E.I.; De Toledo, S.M.; Gooding, T.; Little, J.B. Intercellular communication is involved in the bystander regulation of gene expression in human cells exposed to very low fluences of alpha particles. Radiat. Res. 1998, 150, 497–504. [Google Scholar] [CrossRef]
  67. Chaudhary, P.; Marshall, T.I.; Currell, F.J.; Kacperek, A.; Schettino, G.; Prise, K.M. Variations in the processing of DNA double-strand breaks along 60-MeV therapeutic proton beams. Int. J. Radiat. Oncol. Biol. Phys. 2016, 95, 86–94. [Google Scholar] [CrossRef]
  68. Kassis, A.I.; Fayad, F.; Kinsey, B.M.; Sastry, K.S.; Adelstein, S.J. Radiotoxicity of an 125I-labeled DNA intercalator in mammalian cells. Radiat. Res. 1989, 118, 283–294. [Google Scholar] [CrossRef]
  69. Howell, R.W.; Rao, D.V.; Hou, D.Y.; Narra, V.R.; Sastry, K.S. The question of relative biological effectiveness and quality factor for Auger emitters incorporated into proliferating mammalian cells. Radiat. Res. 1991, 128, 282–292. [Google Scholar] [CrossRef]
  70. Friedrich, T.; Durante, M.; Scholz, M. Modeling Cell Survival after Photon Irradiation Based on Double-Strand Break Clustering in Megabase Pair Chromatin Loops. Radiat. Res. 2012, 178, 385–394. [Google Scholar] [CrossRef]
  71. Yokota, H.; Van Den Engh, G.; Hearst, J.E.; Sachs, R.K.; Trask, B.J. Evidence for the organization of chromatin in megabase pair-sized loops arranged along a random walk path in the human G0/G1 interphase nucleus. J. Cell Biol. 1995, 130, 1239–1249. [Google Scholar] [CrossRef] [Green Version]
  72. Rogakou, E.P.; Pilch, D.R.; Orr, A.H.; Ivanova, V.S.; Bonner, W.M. DNA Double-stranded Breaks Induce Histone H2AX Phosphorylation on Serine 139. J. Biol. Chem. 1998, 273, 5858–5868. [Google Scholar] [CrossRef] [Green Version]
  73. Sato, T.; Watanabe, R.; Niita, K. Development of a calculation method for estimating specific energy distribution in complex radiation fields. Radiat. Prot. Dosim. 2006, 122, 41–45. [Google Scholar] [CrossRef]
  74. Sato, T.; Watanabe, R.; Sihver, L.; Niita, K. Applications of the microdosimetric function implemented in the mac-roscopic particle transport simulation code PHITS. Int. J. Radiat. Biol. 2012, 88, 143–150. [Google Scholar] [CrossRef]
  75. Sato, T.; Iwamoto, Y.; Hashimoto, S.; Ogawa, T.; Furuta, T.; Abe, S.-I.; Kai, T.; Tsai, P.-E.; Matsuda, N.; Iwase, H.; et al. Features of Particle and Heavy Ion Transport code System (PHITS) version 3.02. J. Nucl. Sci. Technol. 2018, 55, 684–690. [Google Scholar] [CrossRef]
Figure 12. Phenomenological correlation (red line) between the mean nuclear radius and the mean DNA content of asynchronized cells (black diamonds). More details can be found in Table S1 in the Supplementary Materials.
Ijms 23 12491 g012
Table 1. Details on the in vitro clonogenic survival data included in this article.
Cell Line AbbreviationSpeciesType of CellsNumber of EntriesIons
C3H10T1/2mouseembryonic fibroblasts201H, 2H, 3He, 4He, 12C, 16O, 20Ne, 28Si, 40Ar, 56Fe, 238U
CHO, CHO-K1Chinese hamsterovary epithelial cells3812C, 16O, 20Ne, 40Ar, 56Fe
HeLahumancervical cancer cells41H, 4He
HF19humanfetal lung fibroblasts61H, 12C
HL-60humanleukemia cells712C, 28Si, 56Fe
M/10humanmammary epithelial cells612C
NB1RGBhumanskin fibroblasts2912C, 20Ne, 28Si
PDVmousetransformed epidermal cells41H, 7Li
RAT-1ratprostatic adenocarcinoma epithelial cells312C
SQ20Bhumanlaryngeal squamous cell carcinoma111H, 12C, 40Ar
T1humankidney cells634He, 12C, 20Ne, 28Si, 40Ar, 56Fe, 238U
TK1humanmyeloid leukemia cells1012C
U-87humanglioblastoma cells61H
U-251MGhumanastrocytoma cells412C
Table 2. Cell-specific parameters used for the MCF MKM predictions. * = mean values calculated with Equations (12) and (13) for αref and ßref respectively. ** = calculated with the phenomenological correlation between the mean DNA content and the mean radius of the cell nucleus (Equation (10)). The cell-specific mean radius of the subnuclear domains was calculated with Equation (11).
Cell Line Abbreviationα for the Reference Photon Exposure, α r e f
[Gy−1]
β for the Reference Photon Exposure, β r e f
[Gy−2]
α r e f / β r e f
[Gy]
Mean Radius of the Cell Nucleus, Rn
[µm]
Mean Radius of the Subnuclear Domains, rd
[µm]
C3H10T1/20.173 *0.389 *4.444.00.26
CHO, CHO-K10.226 *0.0231 *9.784.20.27
HeLa0.5360.027819.35.60.29
HF190.557 *0.0189 *29.54.7 **0.29
HL-600.3150.05585.644.6 **0.29
M/100.30.0684.414.7 **0.29
NB1RGB0.476 *0.0458 *10.45.10.32
PDV0.130.0373.515.1 **0.29
RAT-10.2010.02667.535.0 **0.29
SQ20B0.122 *0.0238 *5.124.5 **0.30
T10.159 *0.0391 *4.064.7 **0.29
TK10.107 *0.0384 *2.794.7 **0.29
U-870.1060.05571.914.5 **0.30
U-251MG0.0310.05510.5634.9 **0.29
Publisher’s Note: MDPI stays neutral with regard to jurisdictional claims in published maps and institutional affiliations.

