Article

Identification of Novel Fusion Transcripts in High Grade Serous Ovarian Cancer

by
Andreea Newtson
1,*,
Henry Reyes
2,
Eric J. Devor
3,4,
Michael J. Goodheart
1,3 and
Jesus Gonzalez Bosquet
1,3
1
Department of Obstetrics and Gynecology, Division of Gynecologic Oncology, University of Iowa Hospitals and Clinics, Iowa City, IA 52242, USA
2
Department of Obstetrics and Gynecology, University of Buffalo, Buffalo, NY 14260, USA
3
Holden Comprehensive Cancer Center, University of Iowa Hospitals and Clinics, Iowa City, IA 52242, USA
4
Department of Obstetrics and Gynecology, University of Iowa Hospitals and Clinics, Iowa City, IA 52242, USA
*
Author to whom correspondence should be addressed.
Int. J. Mol. Sci. 2021, 22(9), 4791; https://doi.org/10.3390/ijms22094791
Submission received: 28 March 2021 / Revised: 27 April 2021 / Accepted: 28 April 2021 / Published: 30 April 2021
(This article belongs to the Section Molecular Oncology)

Abstract

:
Fusion genes are structural chromosomal rearrangements resulting in the exchange of DNA sequences between genes. This results in the formation of a new combined gene. They have been implicated in carcinogenesis in a number of different cancers, though they have been understudied in high grade serous ovarian cancer. This study used high throughput tools to compare the transcriptome of high grade serous ovarian cancer and normal fallopian tubes in the interest of identifying unique fusion transcripts within each group. Indeed, we found that there were significantly more fusion transcripts in the cancer samples relative to the normal fallopian tubes. Following this, the role of fusion transcripts in chemo-response and overall survival was investigated. This led to the identification of fusion transcripts significantly associated with overall survival. Validation was performed with different analytical platforms and different algorithms to find fusion transcripts.

1. Introduction

Though much effort has been invested in defining the biology and natural history of ovarian cancer, standard treatment and prognosis has not changed much since the addition of platinum based chemotherapy [1]. A notable exception is a subset of ovarian cancer patients with deficiencies in DNA repair who have enjoyed new targeted therapies with significant gains in progression free survival [2,3,4,5]. However, for as many as 50% of patients, the biology of their disease is not completely clear and has not yet been targetable [6]. The Cancer Genome Atlas (TCGA) made great strides in defining the genomic profile of high grade serous ovarian cancers. However, beyond and/or because of a high preponderance of TP53 mutations and homologous recombination deficiency, the genomic profile was marked by disarray, especially in contrast with other cancer types, such as glioblastoma multiforme [6]. As such, it is necessary to expand the repertoire of examined genomic features in high grade serous ovarian cancer. Fusion genes represent an understudied genomic feature of high grade serous ovarian cancer.
A fusion gene is a structural chromosomal rearrangement resulting in the exchange of DNA sequences between genes. This results in the formation of a new combined gene. Fusion genes have been implicated in carcinogenesis since the early 1980s. At that time, banding techniques allowed for chromosomal analysis of tumors, which led to the discovery of BCR-ABL1 as a recurrent structural chromosomal rearrangement implicated in chronic myeloid leukemia (CML) [7]. This then allowed for an exceptionally successful targeted therapy, Imatanib. Until recently, fusion gene identification was biased towards interchromosomal rearrangements due to (1) the difficulty of culturing cells at a specific phase in the cell cycle and (2) differentiating genomic “noise” from pathogenetically important aberrations. However, modern high-throughput tools allow investigators to perform genomic analyses with enough granularity to identify significantly more fusion genes in cancers, including solid tumors. Deep sequencing technology permits even greater granularity, such that subtle intrachromosomal rearrangements can now be identified [7], and constantly advancing bioinformatic techniques aid investigators in differentiating “noise” from pathogenic rearrangements [8]. Examples of fusion genes discovered with the help of modern genomics include: the TMPRSS2-ERG in prostate cancer [9], RET-CCDC6 in thyroid carcinoma [10], and EML4-ALK in non-small cell lung cancer (NSCLC) [11]. Remarkably, fusion genes such as NTRK fusion genes have also been identified as driver mutations in a variety of different adult and pediatric cancers, and “tumor agnostic” therapies targeting these fusion genes have resulted in impressive treatment responses in phase I and II clinical trials [12].
Similar work has started with ovarian cancer. Indeed, genetic rearrangement has been identified as a mechanism of tumor suppressor inactivation in ovarian cancer. Genomic rearrangement may result in the formation of fusion genes [13]. Investigators have recently begun utilizing deep sequencing to improve upon previous work done using guided techniques [13,14,15]. This work has led to the identification of gene fusions in NRG1 and ABCB1, the latter of which was specifically identified in pre-treated and drug-resistant specimens. This work suggests that fusion genes do play some role in the pathogenesis high grade serous ovarian cancer, recurrence, and/or adaptive drug resistance [15,16]. Because the most significant morbidity of ovarian cancer lies in drug-resistant recurrences following heavy pre-treatment, analyzing tumor genomics in the context of clinical outcomes, such as survival and chemo-response is crucial. As such, most ovarian cancer fusion gene work has focused on this subset of poor-prognosis, heavily pre-treated, and chemo-resistant ovarian cancer patients, but some clues may lie within treatment-naïve primary presentations. Indeed, there may even be some clues within pathologically normal fallopian tubes themselves.
Our hypothesis is that fusion genes are part of the genomic rearrangements which occur in ovarian cancer. This study aims to assess differences between fusion transcripts’ presence in primary high-grade serous ovarian cancer (HGSC) and normal fallopian tube samples. We then determine whether these fusion transcripts are associated with clinical outcomes, specifically survival and response to chemotherapy. In this manuscript, “fusion transcript” refers to the sum formation of two partner transcripts.

2. Results

2.1. Fusion Transcript Differences between Fallopian Tube and HGSC Samples

A total of 597 fusion transcripts were identified within all samples (Figure 1). Supplementary Table S1 details all fusion transcripts observed in tubal and HGSC samples, as well as their position in chromosomal references. We found more fusion transcripts in HGSC samples (Figure 1E). On average, there were 6.59 fusion transcripts present in each cancer sample and 3.08 in tubal samples (chi-square p < 0.001). Figure 1A shows both components of the fused transcript in a circular chromosomal representation. In the univariate analysis, there were 3 fusion transcripts with significant different frequencies between fallopian tube and HGSC samples: AL391840.3—SH3BGRL2, AL445985.1—SPATA13, and PFKFB3—LNC02649 (Figure 1B). These were all intrachromosomal rearrangements, and the fusion transcripts in the normal fallopian tubes were significantly shorter than those found in HGSC samples. Supplementary Table S2. AL391840.3—SH3BGRL2 is found on chromosome 6, AL445985.1—SPATA13 is found on chromosome 13, and PFKFB3—LNC02649 is found on chromosome 10. Notably, all these fusion transcripts were found less frequently in HGSC samples than in tubes (Figure 1C). In a multivariate analysis, AL391840.3—SH3BGRL2 was the only fusion transcript independently associated with HGSC (Figure 1D).

2.2. Prediction Model of HGSC Using Fusion Transcript Data

The fusion transcript HGSC prediction model included 5 different fusion transcripts. The performance of that model, measured in AUC, was 95%, with a 95% CI of 92%, 98% (Figure 2). All identified fusion transcripts in the model were decreased in cancer samples relative to normal tube (Figure 2C).

2.3. Association of Fusion Transcripts with Overall Survival

In the univariate analysis of baseline clinical variables, Charlson Comorbidity Index, disease in the upper abdomen diagnosed by imaging studies, and treatment with neoadjuvant chemotherapy were significantly associated with survival (Table 1). In the multivariate analysis, neoadjuvant chemotherapy was the only variable independently associated with survival (p-value = 0.015, Figure 3A).
In the univariate analysis of fusion transcripts associated with survival, 44 fusion transcripts found within the ovarian cancer cohort were found to be statistically significant at p-value < 0.05 (Supplementary Table S3, Appendix A). Of the significant fusion transcripts in the univariate analysis, 10 remained independently significant in the survival multivariate analysis with Cox proportional Hazard ratio (Figure 3B, Appendix A).
In the integrative multivariate model that combined independently significant clinical and fusion transcripts variables, all variables remained significantly associated with survival (Figure 3C). Of the fusion transcripts found to be significantly associated with overall survival, the direction of association was towards worse overall survival. Notably, there were two fusion transcripts with a huge association: ZBTB8OS—AC090627.1 was found to be over 1000 times more associated with worse survival, and fusion transcripts ARL17A—KANSL1 was over 400 times more associated with worse survival. ZBTB8OS—AC090627.1 is an inter-chromosomal fusion transcript between chromosomes 1 and 17, and ARL17A—KANSL1 is an intra-chromosomal fusion transcript on chromosome 17.

2.4. Association of Fusion Transcripts with Chemo-Response

Clinical variables associated with chemo-response included: age, Charlson Comorbidity index, residual disease after surgery (optimal versus suboptimal debulking), and receipt of neoadjuvant chemotherapy. In the multivariate analysis, three variables were found to be independently significant: age, residual disease after surgery, and receipt of neoadjuvant chemotherapy (Figure 4A,B). No fusion transcript was significantly associated with chemo-response. The number of fusion transcripts was not significantly different between responders and non-responders (Figure 4C).

2.5. Validation of Fusion Transcript Detection with FusionCatcher, DNA Sequencing

As a negative control for the method of detection, we extracted DNA from normal tubes, performed DNA sequencing, and applied the STAR-Fusion method to the fastq files. As expected, we did not find any fusion gene on any of the normal samples.
To validate the fusion transcript detection, we repeated the analysis with FusionCatcher, a different method with a different algorithm, to detect fusion transcripts and chimeras. Out of the 44 fusion transcripts found to be significant in the univariate analysis (see Association of fusion transcripts with overall survival section), we detected 31 fusion genes with FusionCatcher with accuracy detections over 95% and AUC average of 97% (Table 2). Four out of the 10 fusion transcripts which remained independently significant in the multivariate analysis of survival were also accurately detected (AUC of 89%). A new multivariate analysis of survival was performed with these 4 validated fusion transcripts using FusionCatcher. All were significant in the same direction of the initial analysis (in the direction of worse survival). Two of the transcripts were significant in the validation of the multivariate analysis of survival (p < 0.05): FAM98B--FRMD5 and NRIP1--AJ009632.2. The other two transcripts were close to significance, ARL17A--KANSL1 and CC2D1A--CPNE8, p = 0.054 and p = 0.074, respectively (Supplementary Table S4).

2.6. RT-PCR Validation

Four fusion transcripts identified using STAR-Fusion and FusionInspector were all confirmed to be present when RT-PCR was performed on the original samples (Figure 5). We chose to validate these fusion transcripts with RT-PCR because we wanted to include some which were validated with the independent analytical platform, FusionCatcher (FAM98B--FRMD5, CC2D1A--CPNE8), and other fusion transcripts which were not (AUTS2---INO80C and AC004475.1--PRPF6).

3. Discussion

The TCGA allowed investigators to examine the genomic underpinnings of ovarian cancer, and such analyses have helped identify a molecular subset of patients (HRD) which benefit from targeted therapy (PARP inhibitors). However, this only represents about 50% of patients. For the other 50% of patients, tumor susceptibilities and prognostic biomarkers are still undiscovered. Fusion genes represent one stone which has been left underexplored in the study of ovarian cancer genomics.
Fusion genes have provided clarity in the pathogenesis, prognosis, and treatment of other cancers, and technological advances in deep sequencing have allowed researchers to discover the presence of pathogenic fusion genes within a variety of carcinomas—prostate, lung, sarcoma, and even targetable tumor agnostic driver mutations. In ovarian cancer, fusion genes have been linked to drug resistance [16], potentially targetable mutations [15], and associations with rare ovarian tumor types [17]. We used similar techniques to try to identify fusion transcripts within HGSC using whole transcriptome sequencing.
We first sequenced the transcriptome of normal fallopian tubes and primary HGSC. We identified the fusion transcripts present within both tissue types using STAR-Fusion and validated these fusion transcripts with FusionInspector. We found that three fusion transcripts were present more frequently in normal fallopian tubes than in HGSC. Possible explanations for these “normal” fusion transcripts are (1) the fusion transcripts are protective against carcinogenesis or (2) the “normal” fusion transcripts are a marker of relative genomic stability compared with HGSC. In terms of functional analysis, the gene SH3BGRL2 has been hypothesized to be a tumor suppressor in renal cell carcinoma [18] and serve a role in the migration and invasion of breast cancer [19]. The function of AL391840.3 is not yet known. These fusion transcripts were not found in the analysis of fallopian tube DNA, indicating that these findings represent post-transcriptional modifications. Further analyses are needed to evaluate whether there is a functional meaning to these fusion transcripts, or if they are germline level events rather than occurring at the somatic level.
We then used these fusion transcripts to construct a prediction model which aims to identify a fusion transcript’s origin—normal fallopian tube versus HGSC. Such a prediction model would potentially be useful for testing serum cell free genomic testing as a non-invasive diagnostic test of ovarian cancer, or so called “liquid biopsy.” The model performs relatively well with an AUC of 95%. Though, such a model would be difficult to apply in the clinical setting because it relies on the absence of fusion transcripts to differentiate the carcinoma from the normal tissue, which may lack specificity. Lack of specificity, indeed, plagues many non-surgical ovarian cancer diagnostics.
We did not identify any specific fusion transcripts associated with chemo-response, suggesting that they may not represent driver mutations which determine response to treatment. This contrasts with Christie et al.’s work [16], though their analysis was conducted in a heavily pre-treated population, and our samples were primarily obtained from chemotherapy naïve patients (with the exception of those who received neoadjuvant chemotherapy). Thus, our study of drug resistance mechanisms is limited by our study population. A significant number of fusion transcripts were found within our non-responders, suggesting that they may be involved in chemoresistance some way, which would support the findings in Christie et al. Though, a significant number of fusion transcripts were also found within our chemo-responsive samples, indicating that fusion transcripts are diffusely present within ovarian cancer. Patch et al. found that genomic rearrangement and breakage are often found in chemo-resistant ovarian cancers, and fusion transcripts are one such consequence of these rearrangement and breakage events. However, we did not identify the specific fusion events Patch et al. identified as implicated in chemoresistance—those involving ABCB1. Though, in contrast with Patch et al.’s work, our samples were obtained from surgeries as part of primary treatment, rather than recurrent disease [13]. Perhaps we could have identified fusions involving ABCB1 had we analyzed tumor samples obtained at the time of recurrence, rather than primarily evaluating the original tumor. It may be that these fusion transcripts are selected for over the course of multiple treatment lines.
Ten fusion transcripts were associated with significantly worse survival. Two, in particular, had striking hazard ratios for worse survival-- ZBTB8OS—AC090627.1 and ARL17A—KANSL1. Given that these fusion transcripts exist within a large group of fusion transcripts (over 300), it is possible that these were “passenger” mutations which confer some particular survival advantage to the cancer, resulting in a poor prognosis for the patient. These two fusion transcripts may therefore be markers of a particularly aggressive iteration of ovarian cancer. From a functional perspective, ZBTB80S is a component of the tRNA splicing complex required to facilitate the enzymatic turnover of the catalytic subunit for RNA-splicing ligase [20]. Though the exact function of AC090627.1 is not known, it has been identified as a partner fusion gene within breast cancer [8]. It encodes a long non-coding RNA [21]. The ARL17A—KANSL1 fusion transcript has been identified in both normal and thymus and T cell lymphoblastic lymphoma tumor samples and is thought to be involved in tumor maintenance, rather than pathogenesis [22]. Indeed, Zhou and colleagues identified this specific fusion gene within multiple different cancer types among patients of European ancestry origin, suggesting that this fusion gene may represent a genetic predisposition for cancer within this patient group. Previous study of the ARL17A—KANSL1 fusion shows some loss of functional domains, and since the unfused version of these genes are involved with histone acetyltransferase KAT8 and p53, the fused versions are hypothesized to interfere with these functions. This may represent a fusion gene which predisposes patients to carcinogenesis, analogous to mutations in BRCA [23]. By itself, the gene ARL17A encodes a GTP-binding protein which is suspected to be involved in protein trafficking and may modulate vesicle budding and uncoating within the Golgi apparatus [24]. KANSL1 is involved with histone acetylation [25]. The two fusion transcripts found to be significantly associated with overall survival using FusionCatcher were FAM98B--FRMD5 and NRIP1--AJ009632.2. FAM98B is a protein coding gene which counts tRNA processing and gene expression as its related pathways [26], and it has been associated with colon cancer progression [27]. FRMD5 is also a protein coding gene which is involved in cell migration and has been linked to lung cancer progression [28,29]. NRIP1 encodes a protein which is involved in transcriptional activation by steroid receptors, including the estrogen receptor [26], which plays a significant role in the development of normal fallopian tubes. Mutations in NRIP1 have been linked to breast cancer in genome wide association studies [30,31]. AJ009632.2 is a long non-coding RNA whose function is not yet known, but a variant of this long non-coding RNA has been linked to Parkinson’s disease in a genome wide association study [32].
We validated our fusion detection analysis (STAR-Fusion) with an independent method (FusionCatcher) and found that most of significant transcripts associated with survival were also detected with the new method. Some of those poor prognosis transcripts found to be significant in the Star-Fusion analysis trended towards poor prognosis in the FusionCatcher analysis. They remained either significant or close to significant in the repeat multivariate analysis. Then, we selected four fusion transcripts from the multivariate overall survival analysis which were found using STAR-Fusion and FusionInspector: two were identified using FusionCatcher and two were identified using Star-Fusion. RT-PCR was then performed on these four fusion transcripts, and all were identified within the original patient samples, confirming their true presence within the original transcriptome (rather than an artifact). The validation analysis underscores the complexity of fusion transcript detection and analysis. Discovery of fusion transcripts through computational tools is a developing technology that is evolving constantly [33,34,35]. There is a need for continued development of and standardization of fusion detection tools, candidate fusion prioritization algorithms, and dedicated fusion databases to improve detection accuracy and sensitivity [35]. Moreover, mechanistic analysis are needed to evaluate whether there is a functional meaning from these fusion transcripts, if they reflect the genetic instability of tumors with more aggressive phenotype, or if they are germline-level events rather than occurring just at the somatic level. Continued investigation may also reveal that these or other transcripts provide not just prognostic information but also targetable events, as they are with BCR-ABL1 [7] and NTRK fusions [12].
This study is limited by its retrospective nature and small sample size of normal fallopian tubes. Though the fusion gene software is validated, many others exist. Indeed, we did not identify previously described recurrent fusion transcripts in high grade serous ovarian cancer, such as ESRRA-TEX40 [36] or CDKN2D-WDFY2 [37], which could be due to the slightly different ways by which each study identified its fusion transcripts. Thus, as we advance our methods of analyzing next generation sequencing data, it is imperative that we continue looking to old samples to gain new insights.
To further explore these results, we would need a mechanistic approach to identify the actual interaction between fusion transcripts and molecular components of the cellular machinery. This would help define the genomic and cellular mechanisms by which ovarian cancer shortens patients’ lives and doing so may reveal targetable opportunities for intervention—before the patients present with recurrent malignant bowel obstructions, pleural effusions, and the various other clinical conditions by which our patients ultimately succumb to their disease. Indeed, there is no one singular way by which ovarian cancer leads to mortality, so there are likely a multitude of cellular processes to discover, some of which we suggest originates from fusion events. Moreover, though we are presuming that these fusion events are produced at the transcriptional level, it is possible that there are events at the DNA level that occur due to the genomic instability of cancer cells [38]. The combination of both—alteration of tumoral DNA and transcriptional—will give us a more complete picture of the actual fusion events. Differentiating between the two would require both germline and somatic transcriptome analysis of ovarian cancer patients.
Ultimately, fusion genes represent a relatively underexplored genomic feature of ovarian cancer. Deep sequencing and unguided techniques have resulted in fruitful discoveries within other cancer types, which has better informed prognosis and resulted in targeted therapy. As the HRD story shows us, improved understanding of tumor biology and pathogenic subsets of cancer can yield significant clinical advances for both targeted therapy and prognosis. The high preponderance of fusion transcripts in high grade serous ovarian cancer relative to normal fallopian tube tissue makes it clear that fusion genes have some role in carcinogenesis. With the discovery of targetable driver fusion genes such as those involving NTRK leading to effective and well tolerated “tumor agnostic” therapies [12], the potential for new treatment opportunities is great. Indeed, fusion genes may represent the next frontier for ovarian cancer.

4. Materials and Methods

This is a retrospective case-control study that used clinical and genomic information to identify fusion transcripts in primary HGSC and normal fallopian tube samples. To assess clinical outcomes, we classified HGSC patients as responders or non-responders to chemotherapy. Responders were those with a progression-free survival of at least 6 months after the first platinum-based treatment. Non-responders were those who had evidence of disease within 6 months of their platinum-based treatment (platinum-resistant) or experienced disease progression during treatment (platinum-refractory). Overall survival was defined as the time from treatment completion to death. Patients who were alive at the end of their follow-up were treated as censored observations.

4.1. Patient Inclusion Criteria

We identified ovarian cancer patients with high grade serous histology from available flash-frozen tumor tissues stored at the University of Iowa Hospitals and Clinics Department of Obstetrics and Gynecology Gynecologic Oncology Bank (IRB, ID#200209010) that is part of the Women’s Health Tissue Repository (IRB, ID#200910784). Ovarian cancer patients with clinical and pathological data were included. Patients without RNA of sufficient quality (see below) for RNA-sequencing (RNA-seq) analysis were excluded from the study. Of the 187 patients identified in the original HGSC panel, 112 tumor tissues with sufficient RNA yield and quality were available for analysis.
We additionally analyzed 12 fallopian tube samples from women undergoing salpingectomies for contraceptive indications or as part of a hysterectomy for chronic pelvic pain, pelvic organ prolapse, abnormal uterine bleeding, fibroids, or dermoid cyst. The analyzed tissue came from the junction of the ampullary and fimbriated end of fallopian tubes. For the benign fallopian tubes, a separate approval was given by the University of Iowa Institutional Review Board (IRB, ID#201202714) in coordination with the University of Iowa Tissue Procurement Core Facility. All tissues were obtained from adult patients under informed consent in accordance with the University of Iowa IRB guidelines.

4.2. Clinical Data

Clinical and pathological data were collected from the medical record with IRB approval from the University of Iowa (UI) (IRB ID# 201804817).
Clinical variables previously observed to be associated with chemo-response were included in the data collection [39]. Only baseline clinical and pathological characteristics which can be obtained before starting initial chemotherapy were included. Differences between clinical variables in responders versus non-responders were assessed by logistic regression. p-values ≤ 0.05 were considered statistically significant. There were 103 HGSC patient with accompanying clinical data included in the survival analysis (Table 1); 88 of those patients have complete information about response to treatment and were included in the chemo-response analysis (Supplementary Table S5).

4.3. RNA Purification and Whole Transcriptome Sequencing

Total cellular RNA was purified from primary tumor tissue using the mirVana (Thermo Fisher, Waltham, MA, USA) RNA purification kit following the manufacturers’ instructions. Yield and quality of purified cellular RNA was assessed using a Trinean DropSense 16 spectrophotometer and an Agilent Model 2100 bioanalyzer. Samples with an RNA integrity number (RIN) [40] greater than or equal to 7.0 were selected for RNA sequencing. Genomic DNAs from frozen normal tubal tissue were purified using the DNeasy Blood and Tissue Kit according to manufacturer’s (QIAGEN GmbH, Hilden, Germany) recommendations.
Equal mass total RNA (500 ng) from each qualifying tumor was fragmented, converted to cDNA, and ligated to bar-coded sequencing adaptors using Illumina TriSeq stranded total RNA and DNA library preparation (Illumina, San Diego, CA, USA). Molar concentrations of the indexed libraries were confirmed on the Agilent Model 2100 bioanalyzer, and libraries were then combined into equimolar pools for sequencing. The concentration of the pools was confirmed using the Illumina Library Quantification Kit (KAPA Biosystems, Wilmington, MA, USA). Sequencing was then carried out on the Illumina HiSeq 4000 genome sequencing platform using 150 bp paired-end Sequencing By Synthesis (SBS) chemistry. All library preparation and sequencing were performed in the Genome Facility of the University of Iowa Institute of Human Genetics (IIHG).
For quality control of our RNA-Seq experiments, we looked at the number of reads per sample and number of unmapped transcripts (average read/sample over 27 million). Unmapped transcripts resulted from: (1) transcripts being too short for successful mapping (less than 200 bp) and represented an average 21% of all transcripts; (2) 0% of transcripts had too many mismatches, and (3) 0.2% for other causes. None of the samples had a number of mapped reads below the 10-million threshold.

4.4. DNA Extraction from Normal Fallopian Tubes

Genomic DNA from fresh frozen normal fallopian tubes were purified using the DNeasy Blood and Tissue Kit according to manufacturer recommendations. Yield and purity were assessed using a NanoDrop Model 2000 spectrophotometer with a 260 nm/280 nm absorbance ration of ~1.8 with minimal to no degradation seen using horizontal gel electrophoresis. Following purification, the samples were bisulfite-converted using the EZ-96 Deep-Well Format DNA Methylation Kit following the Illumina Infinium® Methylation Assay alternate incubation instructions. Of the 20 collected fallopian tubes, 12 met the quality standards.

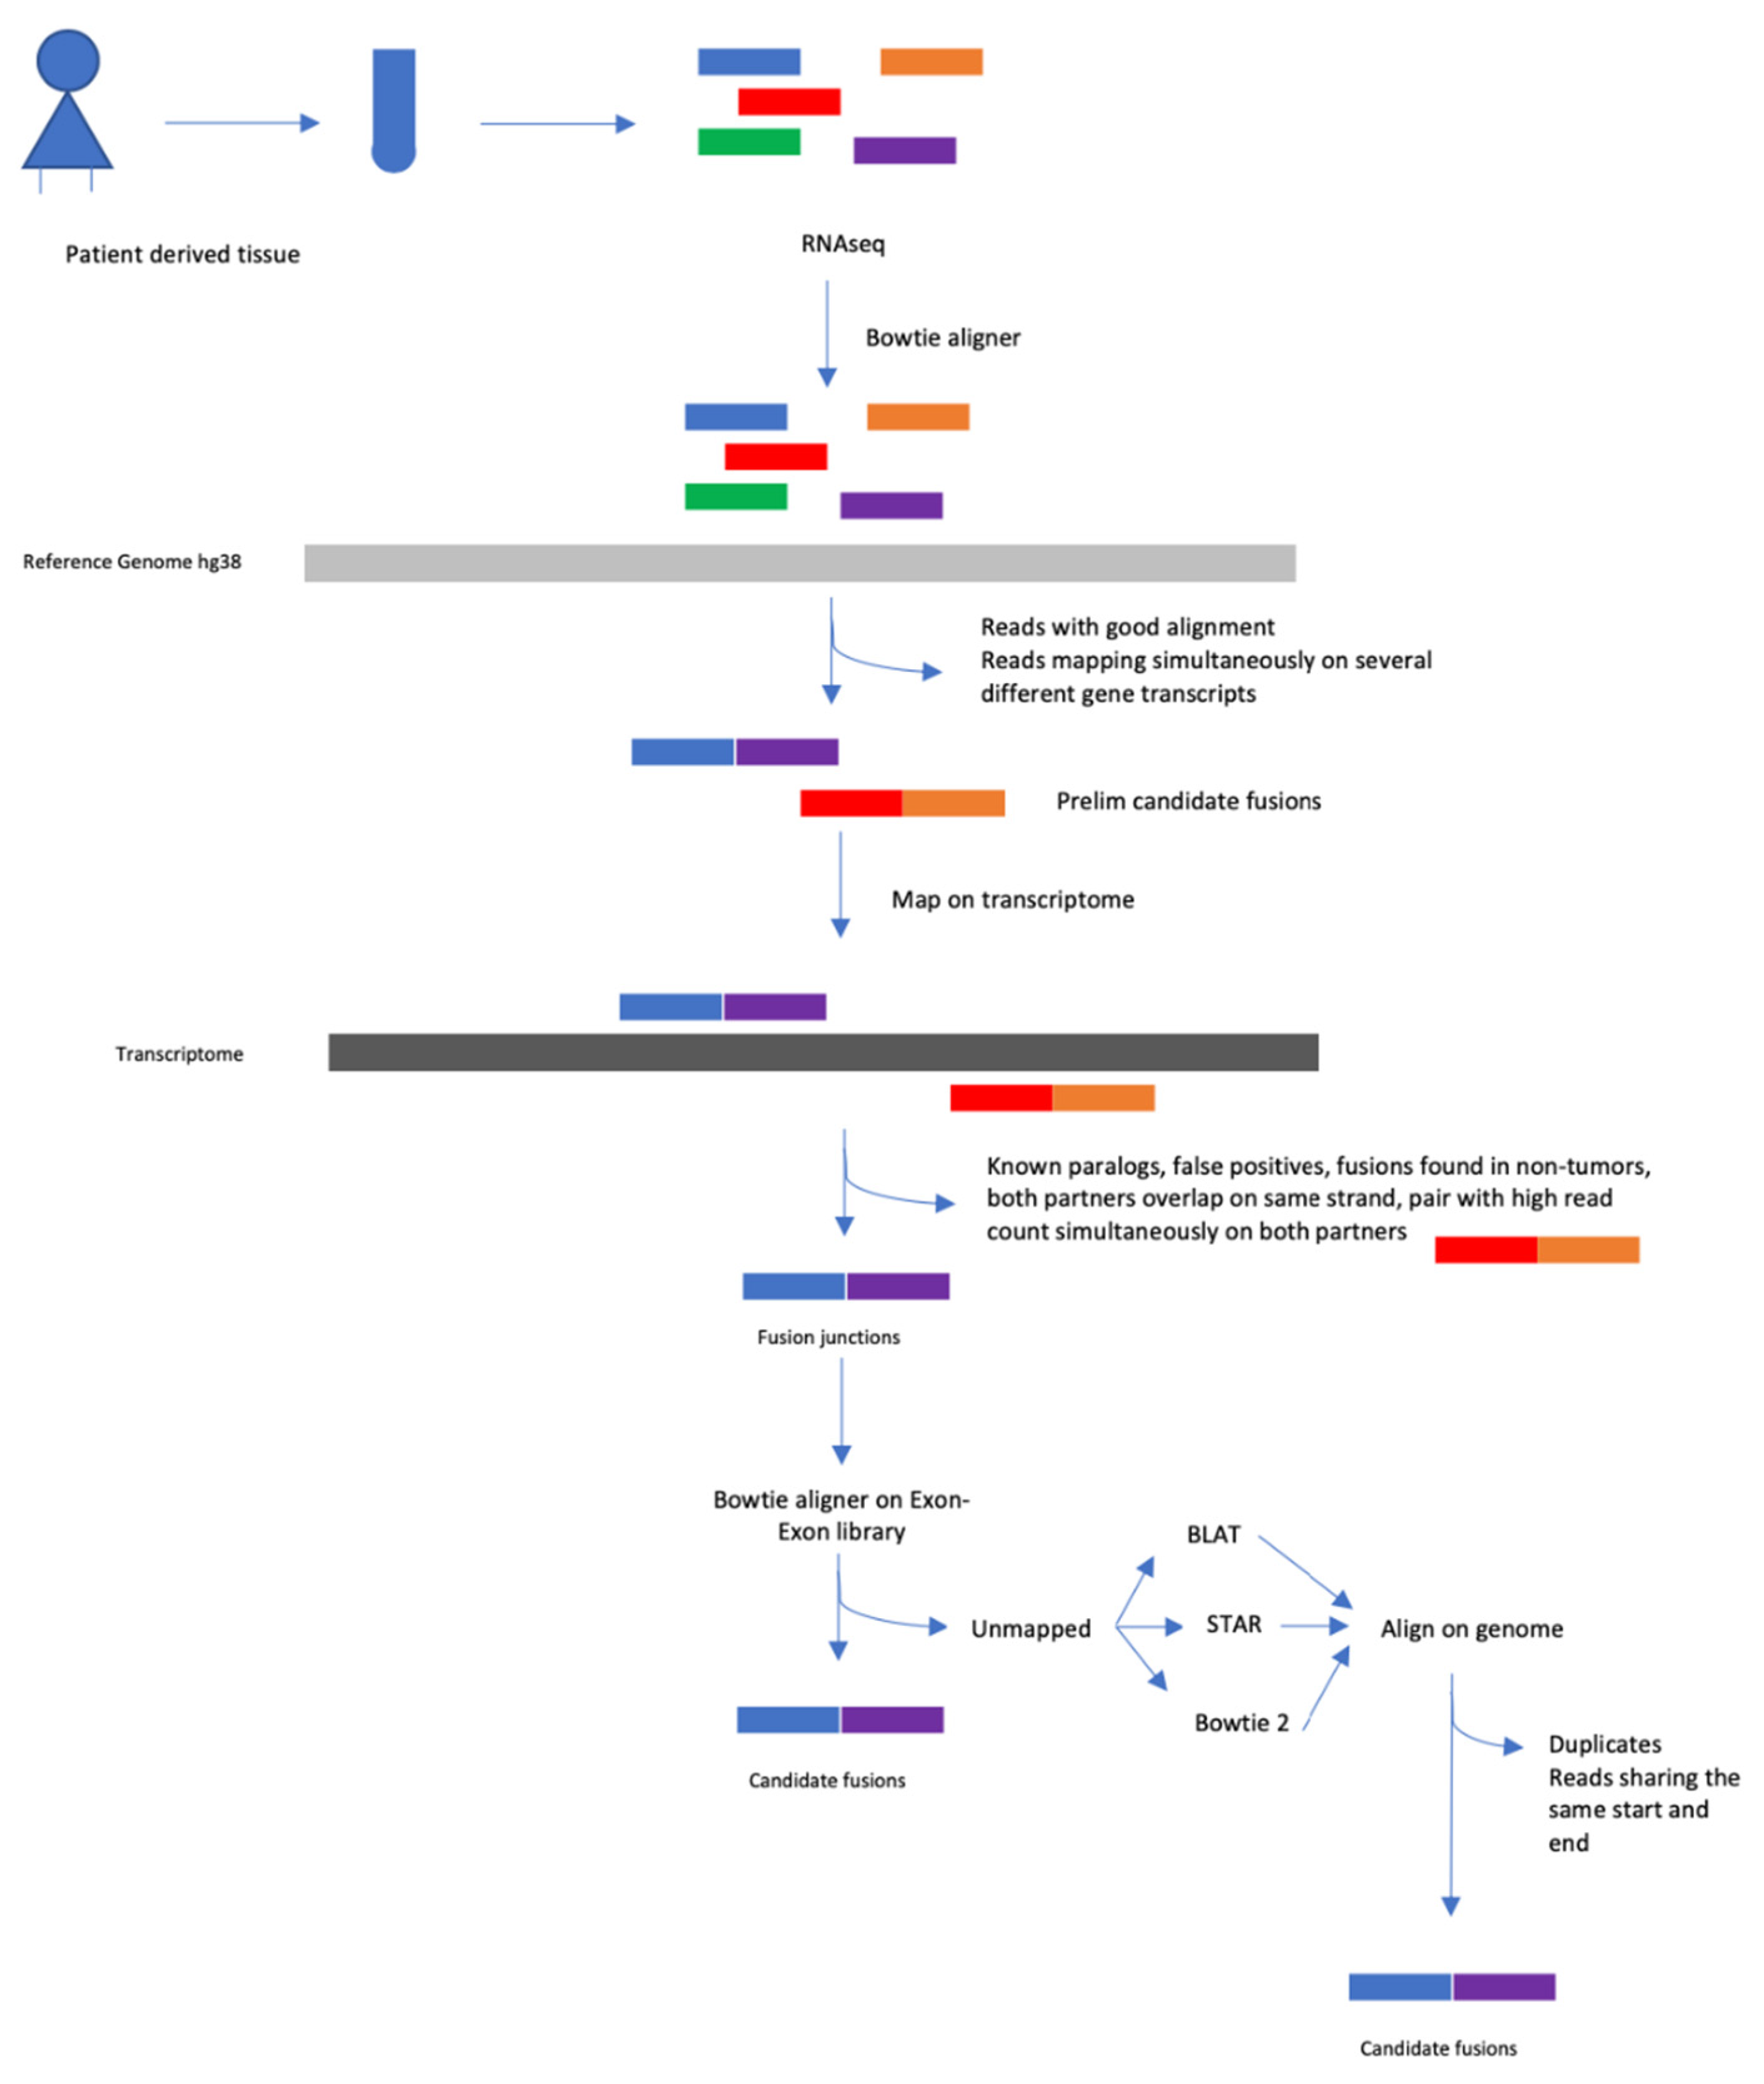
4.5. Fusion Transcript Detection

We used the STAR-Fusion pipeline to align and map paired-end RNA-seq data from HGSC and normal tube samples. This suite requires several genomic resources that included: the reference genome (human genome version hg38), reference transcript structure annotations, and results from an all-vs-all BLAST+ search of reference transcript sequences [41].
Aligning RNA-Seq reads to the genome to capture split and discordant reads was done with STAR as an extension of the standard mapping procedure. First, the maximum mappable prefix algorithm was used to find the “seeds”, or read sequences, exactly matching to the genome. Then, genomic alignment windows were selected by clustering the anchor seeds. In each genomic window, a local alignment of the read sequence was performed. If the best alignment among all windows did not cover the entire read, chimeric detection was performed by finding the next best scoring window that covered the remainder of the read sequence. The STAR-Fusion mapping parameters are based upon the best practices for STAR [42], as well as parameters optimized to capture fusion transcripts, as described above [43]. Next, STAR-Fusion determines the most likely correct fusions, filtering out unlikely candidates from the initial predictions. More details can be found in Haas et al.’s publication [33]. Finally, we used FusionInspector, a component of the STAR-Fusion suite, that performs in silico validations of the fusion transcripts discoveries by performing a supervised analysis of fusion predictions [44] (Appendix A).

4.6. Statistical Analysis

A table with all fusion transcripts and their annotation was constructed for all HGSC and tubal samples (Supplementary Table S1). Logistic regression was used to assess differences in fusion transcripts frequencies between HGSC and tubal samples. Fusion transcripts with statistical differences of p < 0.05 were introduced in a multivariate analysis to assess which fusion transcripts were independently significant between HGSC and tubal samples. To assess the association of survival with fusion transcripts, a survival analysis was performed using Cox proportional hazard ratios. A multivariate analysis of survival was built by introducing significant variables in the univariate analysis (p < 0.05) in a Cox Proportional Hazard ratio multivariate model.
We additionally built a prediction model with fusion transcript data to determine which patients would have ovarian cancer (HGSC) versus those with normal fallopian tubes. To create this model, we used the lasso regression method, as implemented in the glmnet R package [45]. In our experience, lasso consistently lowers number of co-variates and computes area under the curve (AUC) with reliability and minimum errors, as compared to other prediction methods [46]. We evaluated the performance of our model using the AUC and its 95% confidence interval (CI). AUC was estimated with 1000 replicates of 10-fold cross-validation to avoid over-fitting of the model (internal validation) [47]. Bias-corrected and accelerated bootstrap CIs were computed for resulting AUCs. A value of 0.5 indicates a lack of model predictive performance, and 1.0 indicates perfect predictive performance, or the best model. For an alpha error of 0.05, a total sample size of 117 or more would be needed to create regression models of prediction with a power (1-Beta error) over 71% [48].

4.7. Validation of Fusion Transcript Detection with FusionCatcher

To validate the detection of fusion transcripts, we used another novel method, FusionCatcher [49,50], which has been also used to detect novel and known fusion transcripts in samples from patients with cancer. As above, data was aligned to the reference human genome version 38 (hg 38). Then, we performed C-statistics to determine the accuracy and AUC of our initial analysis for those fusion transcripts found to be significant in the. association analysis.
As a negative control for our analysis, we performed STAR-Fusion with FusionInspector validation in DNA from the normal tubal samples. We would expect not to find any fusion genes in normal tissue.

4.8. RT-PCR Validation of Fusion Transcripts

4.8.1. RNA Purification

Whole cell RNA was purified from the appropriate tumors using the mirVana RNA purification kit according to manufacturer’s instructions (Thermo Fisher). Yield and purity were assessed in the University of Iowa Institute of Human Genetics (IIHG) using a Trinean DropSense 16 and an Agilent Model 2100 Bioanalyzer.

4.8.2. RT-PCR

The 500 ng of whole cell RNA from each tumor was reverse transcribed using the SuperScript III kit (Invitrogen). RT-PCR was performed on a BioRad T100 thermal cycler. Tumor cDNA was matched with the appropriate primers as shown below. * Tm is estimated in OligoAnalyzer (IDT) at 1.5 mM MgCl2.
Fusion TranscriptPCR Primer SequencesTm *
CC2D1A-CPNE8For: ATGCACAAGAGGAAAGGAC
Rev: GCAGGTGATGGCTTGATT
59.3 °C
59.7 °C
FAM98B-FRMD5For: GTGCTGGACACACTGGAG
Rev: TGCCGGGAAAGCAACAT
61.5 °C
61.6 °C
AC004475.1-PRPF6For: GCAGCAGATGTACGACATGA
Rev: CTTCAGGTTCTTCCAGCTCAA
61.7 °C
61.7 °C
AUTS2-INO80CFor: CGGCAGAAGAGGACATCATT
Rev: CAGGTTCTTCCCAGGTTCTGTT
63.8 °C
61.5 °C
Primers were designed using the appropriate fusion transcript sequence in PrimerQuest at Integrated DNA Technologies (idtdna.com). All primers were also manufactured by IDT. PCR amplifications were carried out for 35 cycles using an annealing temperature of 58.0 °C. In all cases, a negative control RNA was used consisting of whole cell RNA from a benign fallopian tube patient.
RT-PCR reactions were run on a 1.6% horizontal agarose gel. The gel was stained with ethidium bromide and visualized under uV irradiation on a Life Technologies E-Gel Imager (Thermo Fisher).

4.8.3. Sequence Verification

RT-PCR amplicons were purified using the QIAGEN QIAquick PCR Purification kit following manufacturer’s instructions (QIAGEN). Each amplicon was then sequenced on an Applied Biosystems Model 3730 × l capillary sequencer in the University of Iowa Institute of Human Genetics (IIHG) using the PCR primers as sequencing primers. Sequence output was then visualized in Finch TV software and validated by BLAST in ENSEMBL [21]. The RT-PCR amplicons were validated by direct Sanger sequencing.

5. Conclusions

In summary, we identified novel fusion transcripts that seem to be associated with HGSC and confer poorer survival to some of the patient with the disease. Further investigations will be needed to clarify the mechanisms of action of these transcripts and how they interact with survival. Some of these processes may be even targetable in future research.

Supplementary Materials

The following are available online at https://www.mdpi.com/article/10.3390/ijms22094791/s1.

Author Contributions

Conceptualization, J.G.B., E.J.D. and A.N.; methodology, E.J.D.; validation including RT-PCR, E.J.D. and J.G.B.; formal analysis, J.G.B.; investigation, A.N. and E.J.D.; resources, J.G.B., E.J.D. and M.J.G.; data curation, E.J.D. and H.R.; writing—original draft preparation, A.N. and J.G.B.; writing—review and editing, A.N., H.R., J.G.B. and E.J.D.; visualization, J.G.B.; supervision, J.G.B. and E.J.D.; project administration, J.G.B. and E.J.D.; funding acquisition, J.G.B., E.J.D. and M.J.G. All authors have read and agreed to the published version of the manuscript.

Funding

This work was supported in part by the NIH grant R01 CA99908 and R01 CA184101 to Kimberly K. Leslie, and the basic research fund from the Department of Obstetrics & Gynecology at the University of Iowa. It was also supported in part by the American Association of Obstetricians and Gynecologists Foundation (AAOGF) Bridge Funding Award.

Institutional Review Board Statement

The study was conducted according to the guidelines of the Declaration of Helsinki, and approved by the Institutional Review Board (or Ethics Committee) of the University of Iowa (IRB ID#200209010, approved 19 September 2005; IRB ID#201804817, approved 9 May 2018; IRB ID#201809807, approved 10 April 2019).

Informed Consent Statement

Informed consent was obtained from all subjects involved in the study.

Data Availability Statement

Clinical data is not publicly available due to patient privacy. Datasets with RNA-seq can be browsed by their accession number: GSE156699. The validation part of this study was performed in silico, with de-identified publicly available data. All data from TCGA is available at their website: https://portal.gdc.cancer.gov/ (accessed on 1 January 2019). Software utilized by this study is also publicly available at Bioconductor website: http://bioconductor.org/ (accessed on 1 January 2019).

Acknowledgments

The authors would like to thank the Genomics Division of the University of Iowa Institute of Human Genetics for their assistance with this project, specifically Mary Boes and Garry Hauser (core facilities of the IIHG are funded in part by NIH/NCI P30CA086862). We are grateful as well to Donna Santillan, director of the Department of Obstetrics & Gynecology Women’s Health Tissue Repository and Gynecologic Malignancy Bank, for assistance in assembling the Iowa endometrial and ovarian tumor cohorts. Also, we would like to thank ‘TCGA Research Network’ for generating, curating, and providing high quality biological and clinical data. We acknowledge Jeremy Newtson for providing technical assistance.

Conflicts of Interest

The authors declare no conflict of interest.

Appendix A

Figure A1. Concept map of STAR-Fusion alignment tool, followed by FusionInspector validation as it was used in this study. RNAseq reads were mapped onto Reference Genome hg38, then to reference chromosomes to create proposed fusions, after which sequence similar pairs and promiscuous partners were excluded. Afterwards, Fusion was used to create fusion contigs from the STAR-Fusion results, which were then aligned to Reference Genome hgs38.
Ijms 22 04791 g0a1
Figure A2. Concept map of FusionCatcher validation as it was used in this study. Bowtie aligner was used first to align RNAseq reads to Reference Genome hg38. Reads with good alignment and reads mapping simultaneously onto different gene transcripts were excluded to create a list of preliminary candidate fusions. These candidates were mapped onto the transcriptome, after which known paralogs, false positives, non-tumor fusions, partners overlapping on the same strand, and pairs in which both partners simultaneously have high read counts were excluded. The remaining fusion junctions were aligned onto an Exon-Exon library using Bowtie aligner to determine candidate fusions, and the unmapped junctions were aligned onto hg38 using BLAT, STAR, and Bowtie 2. Duplicates and reads sharing the same start and end sequences were excluded as artifact. This created another set of candidate fusions.
Ijms 22 04791 g0a2
Figure A3. Pie chart representing type of transcript products [26] of fusion partners found to be significant in the univariate survival analysis. lncRNA = long non coding RNA, ncRNA = non coding RNA, SRP = signal recognition particle.
Ijms 22 04791 g0a3
Table A1. Detail regarding fusion transcripts found to be significant in the multivariate survival analysis. Listed are the product types of each partner transcript (protein, lncRNA, SRP, or novel transcript [39]. and predicted effects of fusion based on output from STAR-Fusion. lncRNA = long non coding RNA, SRP = signal recognition particle.
Fusion TranscriptProductPredicted Effect
AC004475.1--PRPF6Protein codingInframe
Protein coding
AC007952.4--RN7SL2lncRNAUnknown
SBP
AF235103.3--ZNF250lncRNAUnknown
Protein coding
ARL17A--KANSL1Protein codingUnknown
Protein coding
AUTS2--INO80CProtein codingInframe
Protein coding
CC2D1A--CPNE8Protein codingInframe
Protein coding
FAM98B--FRMD5Protein codingFrameshift
Protein coding
NRIP--AJ009632.2Protein codingUnknown
lncRNA
Z68871.1--LINC00630lncRNAUnknown
lncRNA
ZBTB8OS--AC090627.1Protein codingUnknown
Novel transcript

References

  1. Vaughan, S.; Coward, J.I.; Bast, R.C.; Berchuck, A.; Berek, J.S.; Brenton, J.D.; Coukos, G.; Crum, C.C.; Drapkin, R.; Etemadmoghadam, D.; et al. Rethinking ovarian cancer: Recommendations for improving outcomes. Nat. Rev. Cancer 2011, 11, 719–725. [Google Scholar] [CrossRef] [PubMed] [Green Version]
  2. Moore, K.; Colombo, N.; Scambia, G.; Kim, B.-G.; Oaknin, A.; Friedlander, M.; Lisyanskaya, A.; Floquet, A.; Leary, A.; Sonke, G.S.; et al. Maintenance Olaparib in Patients with Newly Diagnosed Advanced Ovarian Cancer. N. Engl. J. Med. 2018, 379, 2495–2505. [Google Scholar] [CrossRef]
  3. Ray-Coquard, I.; Pautier, P.; Pignata, S.; Pérol, D.; González-Martín, A.; Berger, R.; Fujiwara, K.; Vergote, I.; Colombo, N.; Mäenpää, J.; et al. Olaparib plus Bevacizumab as First-Line Maintenance in Ovarian Cancer. N. Engl. J. Med. 2019, 381, 2416–2428. [Google Scholar] [CrossRef] [PubMed]
  4. González-Martín, A.; Pothuri, B.; Vergote, I.; Depont Christensen, R.; Graybill, W.; Mirza, M.R.; McCormick, C.; Lorusso, D.; Hoskins, P.; Freyer, G.; et al. Niraparib in Patients with Newly Diagnosed Advanced Ovarian Cancer. N. Engl. J. Med. 2019, 381, 2391–2402. [Google Scholar] [CrossRef] [PubMed] [Green Version]
  5. Coleman, R.L.; Fleming, G.F.; Brady, M.F.; Swisher, E.M.; Steffensen, K.D.; Friedlander, M.; Okamoto, A.; Moore, K.N.; Efrat Ben-Baruch, N.; Werner, T.L.; et al. Veliparib with First-Line Chemotherapy and as Maintenance Therapy in Ovarian Cancer. N. Engl. J. Med. 2019, 381, 2403–2415. [Google Scholar] [CrossRef]
  6. Network, T.C.G.A.R. Integrated genomic analyses of ovarian carcinoma. Nature 2011, 474, 609–615. [Google Scholar] [CrossRef]
  7. Mertens, F.; Johansson, B.; Fioretos, T.; Mitelman, F. The emerging complexity of gene fusions in cancer. Nat. Rev. Cancer 2015, 15, 371–381. [Google Scholar] [CrossRef] [PubMed]
  8. Kangaspeska, S.; Hultsch, S.; Edgren, H.; Nicorici, D.; Murumägi, A.; Kallioniemi, O. Reanalysis of RNA-Sequencing Data Reveals Several Additional Fusion Genes with Multiple Isoforms. PLoS ONE 2012, 7, e48745. [Google Scholar] [CrossRef]
  9. Soller, M.J.; Isaksson, M.; Elfving, P.; Soller, W.; Lundgren, R.; Panagopoulos, I. Confirmation of the high frequency of the TMPRSS2/ERG fusion gene in prostate cancer. Genes Chromosomes Cancer 2006, 45, 717–719. [Google Scholar] [CrossRef]
  10. Santoro, M.; Moccia, M.; Federico, G.; Carlomagno, F. RET Gene Fusions in Malignancies of the Thyroid and Other Tissues. Genes (Basel) 2020, 11, 424. [Google Scholar] [CrossRef] [Green Version]
  11. Mano, H. Non-solid oncogenes in solid tumors: EML4-ALK fusion genes in lung cancer. Cancer Sci. 2008, 99, 2349–2355. [Google Scholar] [CrossRef] [PubMed]
  12. Cocco, E.; Scaltriti, M.; Drilon, A. NTRK fusion-positive cancers and TRK inhibitor therapy. Nat. Rev. Clin. Oncol. 2018, 15, 731–747. [Google Scholar] [CrossRef] [PubMed]
  13. Patch, A.-M.; Christie, E.L.; Etemadmoghadam, D.; Garsed, D.W.; George, J.; Fereday, S.; Nones, K.; Cowin, P.; Alsop, K.; Bailey, P.J.; et al. Whole–genome characterization of chemoresistant ovarian cancer. Nature 2015, 521, 489–494. [Google Scholar] [CrossRef] [PubMed]
  14. Smebye, M.L.; Agostini, A.; Johannessen, B.; Thorsen, J.; Davidson, B.; Tropé, C.G.; Heim, S.; Skotheim, R.I.; Micci, F. Involvement of DPP9 in gene fusions in serous ovarian carcinoma. BMC Cancer 2017, 17, 642. [Google Scholar] [CrossRef] [PubMed]
  15. Jonna, S.; Feldman, R.A.; Swensen, J.; Gatalica, Z.; Korn, W.M.; Borghaei, H.; Ma, P.C.; Nieva, J.J.; Spira, A.I.; Vanderwalde, A.M.; et al. Detection of NRG1 Gene Fusions in Solid Tumors. Clin. Cancer Res. 2019, 25, 4966–4972. [Google Scholar] [CrossRef] [Green Version]
  16. Christie, E.L.; Pattnaik, S.; Beach, J.; Copeland, A.; Rashoo, N.; Fereday, S.; Hendley, J.; Alsop, K.; Brady, S.L.; Lamb, G.; et al. Multiple ABCB1 transcriptional fusions in drug resistant high-grade serous ovarian and breast cancer. Nat. Commun. 2019, 10, 1295. [Google Scholar] [CrossRef] [PubMed] [Green Version]
  17. Earp, M.A.; Raghavan, R.; Li, Q.; Dai, J.; Winham, S.J.; Cunningham, J.M.; Natanzon, Y.; Kalli, K.R.; Hou, X.; Weroha, S.J.; et al. Characterization of fusion genes in common and rare epithelial ovarian cancer histologic subtypes. Oncotarget 2017, 8, 46891–46899. [Google Scholar] [CrossRef]
  18. Yin, L.; Li, W.; Xu, A.; Shi, H.; Wang, K.; Yang, H.; Wang, R.; Peng, B. SH3BGRL2 inhibits growth and metastasis in clear cell renal cell carcinoma via activating hippo/TEAD1-Twist1 pathway. EBioMedicine 2020, 51, 102596. [Google Scholar] [CrossRef] [Green Version]
  19. Li, D.-D.; Deng, L.; Hu, S.-Y.; Zhang, F.-L.; Li, D.-Q. SH3BGRL2 exerts a dual function in breast cancer growth and metastasis and is regulated by TGF-β1. Am. J. Cancer Res. 2020, 10, 1238–1254. [Google Scholar]
  20. Popow, J.; Jurkin, J.; Schleiffer, A.; Martinez, J. Analysis of orthologous groups reveals archease and DDX1 as tRNA splicing factors. Nature 2014, 511, 104–107. [Google Scholar] [CrossRef] [Green Version]
  21. Yates, A.D.; Achuthan, P.; Akanni, W.; Allen, J.; Allen, J.; Alvarez-Jarreta, J.; Amode, M.R.; Armean, I.M.; Azov, A.G.; Bennett, R.; et al. Ensembl 2020. Nucleic Acids Res. 2019, 48, D682–D688. [Google Scholar] [CrossRef] [PubMed]
  22. López-Nieva, P.; Fernández-Navarro, P.; Graña-Castro, O.; Andrés-León, E.; Santos, J.; Villa-Morales, M.; Cobos-Fernández, M.Á.; González-Sánchez, L.; Malumbres, M.; Salazar-Roa, M.; et al. Detection of novel fusion-transcripts by RNA-Seq in T-cell lymphoblastic lymphoma. Sci. Rep. 2019, 9, 5179. [Google Scholar] [CrossRef] [PubMed]
  23. Zhou, J.X.; Yang, X.; Ning, S.; Wang, L.; Wang, K.; Zhang, Y.; Yuan, F.; Li, F.; Zhuo, D.D.; Tang, L.; et al. Identification of KANSARL as the first cancer predisposition fusion gene specific to the population of European ancestry origin. Oncotarget 2017, 8, 50594–50607. [Google Scholar] [CrossRef] [PubMed] [Green Version]
  24. Gerhard, D.S.; Wagner, L.; Feingold, E.A.; Shenmen, C.M.; Grouse, L.H.; Schuler, G.; Klein, S.L.; Old, S.; Rasooly, R.; Good, P.; et al. The Status, Quality, and Expansion of the NIH Full-Length cDNA Project: The Mammalian Gene Collection (MGC). Genome Res. 2004, 14, 2121–2127. [Google Scholar] [CrossRef] [Green Version]
  25. Smith, E.R.; Cayrou, C.; Huang, R.; Lane, W.S.; Cote, J.; Lucchesi, J.C. A Human Protein Complex Homologous to the Drosophila MSL Complex Is Responsible for the Majority of Histone H4 Acetylation at Lysine 16. Mol. Cell. Biol. 2005, 25, 9175–9188. [Google Scholar] [CrossRef] [Green Version]
  26. Stelzer, G.; Rosen, N.; Plaschkes, I.; Zimmerman, S.; Twik, M.; Fishilevich, S.; Stein, T.I.; Nudel, R.; Lieder, I.; Mazor, Y.; et al. The GeneCards Suite: From Gene Data Mining to Disease Genome Sequence Analyses. Curr. Protoc. Bioinform. 2016, 54, 1.30.31–1.30.33. [Google Scholar] [CrossRef] [PubMed]
  27. Akter, K.A.; Mansour, M.A.; Hyodo, T.; Senga, T. FAM98A associates with DDX1-C14orf166-FAM98B in a novel complex involved in colorectal cancer progression. Int. J. Biochem. Cell Biol. 2017, 84, 1–13. [Google Scholar] [CrossRef]
  28. Hu, J.; Niu, M.; Li, X.; Lu, D.; Cui, J.; Xu, W.; Li, G.; Zhan, J.; Zhang, H. FERM domain-containing protein FRMD5 regulates cell motility via binding to integrin β5 subunit and ROCK1. FEBS Lett. 2014, 588, 4348–4356. [Google Scholar] [CrossRef] [PubMed] [Green Version]
  29. Wang, T.; Pei, X.; Zhan, J.; Hu, J.; Yu, Y.; Zhang, H. FERM-containing protein FRMD5 is a p120-catenin interacting protein that regulates tumor progression. FEBS Lett. 2012, 586, 3044–3050. [Google Scholar] [CrossRef] [PubMed] [Green Version]
  30. Rashkin, S.R.; Graff, R.E.; Kachuri, L.; Thai, K.K.; Alexeeff, S.E.; Blatchins, M.A.; Cavazos, T.B.; Corley, D.A.; Emami, N.C.; Hoffman, J.D.; et al. Pan-cancer study detects genetic risk variants and shared genetic basis in two large cohorts. Nat. Commun. 2020, 11, 4423. [Google Scholar] [CrossRef]
  31. Michailidou, K.; Lindström, S.; Dennis, J.; Beesley, J.; Hui, S.; Kar, S.; Lemaçon, A.; Soucy, P.; Glubb, D.; Rostamianfar, A.; et al. Association analysis identifies 65 new breast cancer risk loci. Nature 2017, 551, 92–94. [Google Scholar] [CrossRef] [PubMed] [Green Version]
  32. Do, C.B.; Tung, J.Y.; Dorfman, E.; Kiefer, A.K.; Drabant, E.M.; Francke, U.; Mountain, J.L.; Goldman, S.M.; Tanner, C.M.; Langston, J.W.; et al. Web-based genome-wide association study identifies two novel loci and a substantial genetic component for Parkinson’s disease. PLoS Genet. 2011, 7, e1002141. [Google Scholar] [CrossRef] [Green Version]
  33. Haas, B.J.; Dobin, A.; Stransky, N.; Li, B.; Yang, X.; Tickle, T.; Bankapur, A.; Ganote, C.; Doak, T.G.; Pochet, N.; et al. STAR-Fusion: Fast and Accurate Fusion Transcript Detection from RNA-Seq. BioRxiv 2017. [Google Scholar] [CrossRef] [Green Version]
  34. Wang, Q.; Xia, J.; Jia, P.; Pao, W.; Zhao, Z. Application of next generation sequencing to human gene fusion detection: Computational tools, features and perspectives. Brief. Bioinform. 2013, 14, 506–519. [Google Scholar] [CrossRef] [PubMed] [Green Version]
  35. Latysheva, N.S.; Babu, M.M. Discovering and understanding oncogenic gene fusions through data intensive computational approaches. Nucleic Acids Res. 2016, 44, 4487–4503. [Google Scholar] [CrossRef] [Green Version]
  36. Salzman, J.; Marinelli, R.J.; Wang, P.L.; Green, A.E.; Nielsen, J.S.; Nelson, B.H.; Drescher, C.W.; Brown, P.O. ESRRA-C11orf20 is a recurrent gene fusion in serous ovarian carcinoma. PLoS Biol. 2011, 9, e1001156. [Google Scholar] [CrossRef] [Green Version]
  37. Kannan, K.; Coarfa, C.; Rajapakshe, K.; Hawkins, S.M.; Matzuk, M.M.; Milosavljevic, A.; Yen, L. CDKN2D-WDFY2 is a cancer-specific fusion gene recurrent in high-grade serous ovarian carcinoma. PLoS Genet. 2014, 10, e1004216. [Google Scholar] [CrossRef] [PubMed] [Green Version]
  38. Hanahan, D.; Weinberg, R.A. Hallmarks of cancer: The next generation. Cell 2011, 144, 646–674. [Google Scholar] [CrossRef] [PubMed] [Green Version]
  39. Newtson, A.M.; Devor, E.J.; Gonzalez Bosquet, J. Prediction of Epithelial Ovarian Cancer Outcomes With Integration of Genomic Data. Clin. Obstet. Gynecol. 2020, 63, 92–108. [Google Scholar] [CrossRef] [PubMed]
  40. Schroeder, A.; Mueller, O.; Stocker, S.; Salowsky, R.; Leiber, M.; Gassmann, M.; Lightfoot, S.; Menzel, W.; Granzow, M.; Ragg, T. The RIN: An RNA integrity number for assigning integrity values to RNA measurements. BMC Mol. Biol. 2006, 7, 3. [Google Scholar] [CrossRef] [Green Version]
  41. Camacho, C.; Coulouris, G.; Avagyan, V.; Ma, N.; Papadopoulos, J.; Bealer, K.; Madden, T.L. BLAST+: Architecture and applications. BMC Bioinform. 2009, 10, 421. [Google Scholar] [CrossRef] [Green Version]
  42. Dobin, A.; Gingeras, T.R. Mapping RNA-seq Reads with STAR. Curr. Protoc. Bioinform. 2015, 15, 11.14.11–11.14.19. [Google Scholar] [CrossRef] [Green Version]
  43. Stransky, N.; Cerami, E.; Schalm, S.; Kim, J.L.; Lengauer, C. The landscape of kinase fusions in cancer. Nat. Commun. 2014, 5, 4846. [Google Scholar] [CrossRef] [PubMed] [Green Version]
  44. Haas, B.J.; Dobin, A.; Li, B.; Stransky, N.; Pochet, N.; Regev, A. Accuracy assessment of fusion transcript detection via read-mapping and de novo fusion transcript assembly-based methods. Genome Biol. 2019, 20, 1–16. [Google Scholar] [CrossRef] [PubMed] [Green Version]
  45. Friedman, J.; Hastie, T.; Tibshirani, R. Regularization Paths for Generalized Linear Models via Coordinate Descent. J. Stat. Softw. 2010, 33, 1–22. [Google Scholar] [CrossRef] [Green Version]
  46. Gonzalez Bosquet, J.; Newtson, A.M.; Chung, R.K.; Thiel, K.W.; Ginader, T.; Goodheart, M.J.; Leslie, K.K.; Smith, B.J. Prediction of chemo-response in serous ovarian cancer. Mol. Cancer 2016, 15, 66. [Google Scholar] [CrossRef] [PubMed] [Green Version]
  47. Simon, R. Roadmap for developing and validating therapeutically relevant genomic classifiers. J. Clin. Oncol. 2005, 23, 7332–7341. [Google Scholar] [CrossRef] [PubMed] [Green Version]
  48. Faul, F.; Erdfelder, E.; Buchner, A.; Lang, A.G. Statistical power analyses using G*Power 3.1: Tests for correlation and regression analyses. Behav. Res. Methods 2009, 41, 1149–1160. [Google Scholar] [CrossRef] [Green Version]
  49. Olsen, T.K.; Panagopoulos, I.; Gorunova, L.; Micci, F.; Andersen, K.; Kilen Andersen, H.; Meling, T.R.; Due-Tonnessen, B.; Scheie, D.; Heim, S.; et al. Novel fusion genes and chimeric transcripts in ependymal tumors. Genes Chromosomes Cancer 2016, 55, 944–953. [Google Scholar] [CrossRef] [PubMed]
  50. Liu, S.; Tsai, W.H.; Ding, Y.; Chen, R.; Fang, Z.; Huo, Z.; Kim, S.; Ma, T.; Chang, T.Y.; Priedigkeit, N.M.; et al. Comprehensive evaluation of fusion transcript detection algorithms and a meta-caller to combine top performing methods in paired-end RNA-seq data. Nucleic Acids Res. 2016, 44, e47. [Google Scholar] [CrossRef]
Figure 1. Fusion transcript differences between HGSC and normal fallopian tubes. (A). Circular chromosome representation of both components of the fused transcript; red: fusion of two transcripts within a chromosome (intrachromosomic); blue: fusion of two transcripts within a chromosome (interchromosomic). Due to space limitation, only unique fusion transcripts are depicted, and we omitted duplicated fusion transcripts. All names are not represented, but all connections are. (B) Fusion transcripts with different frequency between HGSC and tubal samples. Odds Ratio, p-value and location of the break are represented. (C) Frequencies of the 3 significant fusion transcripts in HGSC and tubal samples. The horizontal axis represents the frequency of these fusion transcripts in HGSC and tubal samples. Notably, these significant fusion transcripts are decreased in HGSC. Odds ratio, p value, and standard error for each transcript included. (D) Multivariate analysis comparing frequencies of fusion transcripts between HGSC and tubal samples: only AL391840.3—SH3BGRL2 remained significant. (E) Heatmap representing HGSC and tubal samples (columns) with more differences in fusion transcript expression (p ≤ 0.1) in the analysis. In rows, presence (blue) or absence (grey) of fusion transcripts. The right of the panel contains two bar plots with the percentage of samples expressing these transcripts: blue represents HGSC samples, red represent normal tubes. Notice the scale of both bar plots: the percentage of these fusion transcripts found in HGSC samples (blue) is below 10%, while the percentage of these transcripts found in tubal samples (red) is over 15% more than half of the time.
Ijms 22 04791 g001
Figure 2. Prediction of HGSC with fusion transcripts from HGSC and tubal samples. (A) Model including all fusion transcripts. The best models are located in between the vertical dotted lines. Those will include between 2 and 25 fusion transcripts. The vertical axis represents the resulting AUC of the model with their 95% CI. The lower axis is the log of the λ, value used to optimize model construction. As detailed in methods, we performed 1000 bootstrap replicates to find the most adequate λ. (B) The best model with 5 fusion transcripts had an AUC of 95% with a 95% CI of 92%, 98%. (C) Fusion transcripts included in the model with their OR (HGSC vs. tube).
Ijms 22 04791 g002
Figure 3. Association of fusion transcripts with survival. (A) In the multivariate analysis of survival for clinical variables, only neoadjuvant chemotherapy was significant. Representation of Kaplan–Meier survival curves between HGSC patients who received neoadjuvant chemotherapy vs. those that did not. p-value of the differences and median survivals are also shown (B) Circular chromosome representation of both components of the fused transcript; red: fusion of two transcripts within a chromosome (intrachromosomic); blue: fusion of two transcripts within a chromosome (interchromosomic). The width of the connecting line is in proportion of the number of reads observed for that particular fusion transcript: 37 reads observed in the patient with CC2D1A--CPNE8 fusion and 15 for NRIP1--AJ009632.2. (C) Forest plot of the integrative multivariate model of survival that combined both independent significant clinical variables and fusion transcripts. All significant variables increased the risk of death by disease. N: number of HGSC patients with fusion transcripts; Median: median survival in months; HR: Hazard Ratio; CI: Confidence interval.
Ijms 22 04791 g003
Figure 4. Association of fusion transcripts with chemo-response. (A) In the multivariate analysis, chemo-response was significantly associated with age, optimal surgery, and neoadjuvant chemotherapy. (B) Optimal cytoreduction is associated with better response to chemotherapy. The other two (age and neoadjuvant therapy) are associated with worse response to chemotherapy. (C) Heatmap representing responder and non-responder samples (columns) with more differences in fusion transcript expression (top 20) in the analysis. In rows, presence (blue) or absence (grey) of fusion transcripts. The right of the panel contains two bar plots with the percentage of samples expressing these transcripts: blue represents responder samples, yellow represent non-responder. The scale of both bar plots are similar. There is no difference of fusion transcripts between samples from responders vs. non-responder patients (chi-square p-value = 0.626).
Ijms 22 04791 g004
Figure 5. RT-PCR validation of fusion transcripts. (A) RT-PCR was performed on four fusion transcripts found to be significantly associated with overall survival in the multivariate analysis using STAR-Fusion/FusionInspector and FusionCatcher. FT1 represents CC2D1A--CPNE8, FT2 represents FAM98B--FRMD5, FT3 represents AC004475.1--PRPF6, and FT4 represents AUTS2--INO80C. Letter “M” represents the marker, which is the Invitrogen Track-it 100bp Ladder. (B) Chromatograms from direct sequencing of RT-PCR amplicons of four fusion transcripts shown in part A; FT2 is FAM98B--FRMD5, FT1 is CC2D1A--CPNE8, FT4 is AUTS2--INO80C, FT3 is AC004475.1--PRPF6.
Ijms 22 04791 g005
Table 1. Validation of fusion transcript detection with FusionCatcher: These fusion transcripts found to be significant in the univariate analysis of survival were also observed with FusionCatcher. C statistics were performed to assess degree of concordance between both method, STAR-Fusion and FusionCatcher, for the 31 fusion transcripts detected with FusionCatcher alone. AUC: area under the curve; NPV: negative predictive value; PPV: positive predictive value.
FusionCatcherAUCSpecificityAccuracyNPVPPV
AP3D1--ARHGDIA110.9980.9981
ARHGAP1--CKAP5110.9980.9981
ARL17A--KANSL10.550.220.3210.8440.175
BTBD10--TEAD1110.9980.9981
CC2D1A--CPNE8110.9980.9981
CHTOP--PCAT1110.9980.9981
DOT1L--GCGR110.9980.9981
FAM20C--AC093627.4110.9980.9981
FAM98B--FRMD5110.9980.9981
FBXO34--SORCS3110.9980.9981
GRIN2A--C16ORF72110.9980.9981
INPP5B--PLEKHO1110.9980.9981
LUC7L--AXIN1110.9980.9981
MAGED2--ZFAT110.9980.9981
MECOM--AC116337.3110.9980.9981
NFE2L1--PNPO110.9980.9981
NFKBIB--TEAD1110.9980.9981
NRIP1--AJ009632.2110.9980.9981
PACS1--HAUS3110.9980.9981
PCAT1--C1ORF210110.9980.9981
PGM2L1--POLD3110.9980.9981
PSPC1--ZMYM50.500.200.2310.9480.052
RB1CC1--LINC02091110.9980.9981
SMARCA4--ZNF700110.9980.9981
TMCC1--CD96110.9980.9981
TOGARAM1--FANCM110.9980.9981
TRAPPC3--MAP7D1110.9980.9981
TRMT1--CPA4110.9980.9981
UBA2--RAD51B110.9980.9981
UBE2F--LRRFIP1110.9980.9981
ZNF609--SNX1110.9980.9981
Table 2. Patient characteristics and association with survival: 103 patients with HGSC had complete clinical and outcome information for the survival analysis. * Statistically significant (later included in the multivariate analysis).
HGSC PatientsHR95% CIp-Value
N = 103
Age(mean) 59.81.010.99, 1.030.164
BMI(mean) 27.21.000.97, 1.030.764
Preop CA-125(mean) 2413.61.000.99, 1.000.488
Charlson Comorbidity Index1–3171.141.01, 1.310.044 *
4–664
>618
FIGO Stage232.720, N/A0.995
368
425
Disease in Upper abdomen (Other than Omentum) by ImagingYesLarge Bowel (N = 4)631.601.02, 2.500.039 *
Porta—Hepatis (N = 4)
Mesenteric Mets (N = 4)
Other (N = 26)
No40
Disease in the Chest by ImagingYesChest (N = 5)71.110.44, 2.790.813
Pleural effusion (N = 5)
No96
Grade2211.300.82, 2.070.270
367
Residual disease after surgeryMicroscopic200.590.32, 1.090.093
Macroscopic82
Optimal (<1 cm)661.110.71, 1.730.639
Suboptimal (>1 cm)36
Removal of Pelvic LNYes171.830.27, 1.090.088
No86
Removal of Para-Aortic LNYes100.410.15, 1.110.080
No93
Surgery of large bowelYes291.430.91, 2.260.123
No74
Surgical complexity score **Low521.580.56, 4.430.381
Intermediate47
High4
Neoadjuvant ChemotherapyYes132.111.16, 3.830.015 *
No88
Number of Cycles delivered< 6150.960.87, 1.070.476
≥687
Dose Dense ChemotherapyYes30.600.15, 2.460.480
* Statistically significant (p-value < 0.05). ** Modification of Mayo complexity index: we did not have an entry of peritoneal or abdominal stripping; and rectosigmoidectomies with anastomosis were considered in our data collection as large bowel resections with anastomosis.
Publisher’s Note: MDPI stays neutral with regard to jurisdictional claims in published maps and institutional affiliations.

