
Altered Profile of E1-S Transporters in Endometrial Cancer: Lower Protein Levels of ABCG2 and OSTβ and Up-Regulation of SLCO1B3 Expression

 , ,
, , 

Abstract
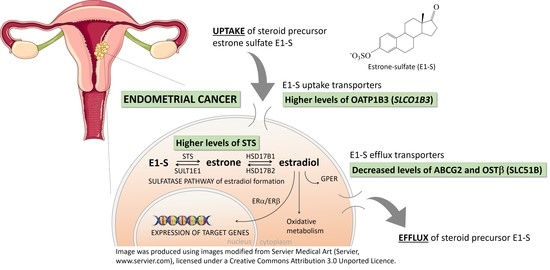
1. Introduction
2. Results
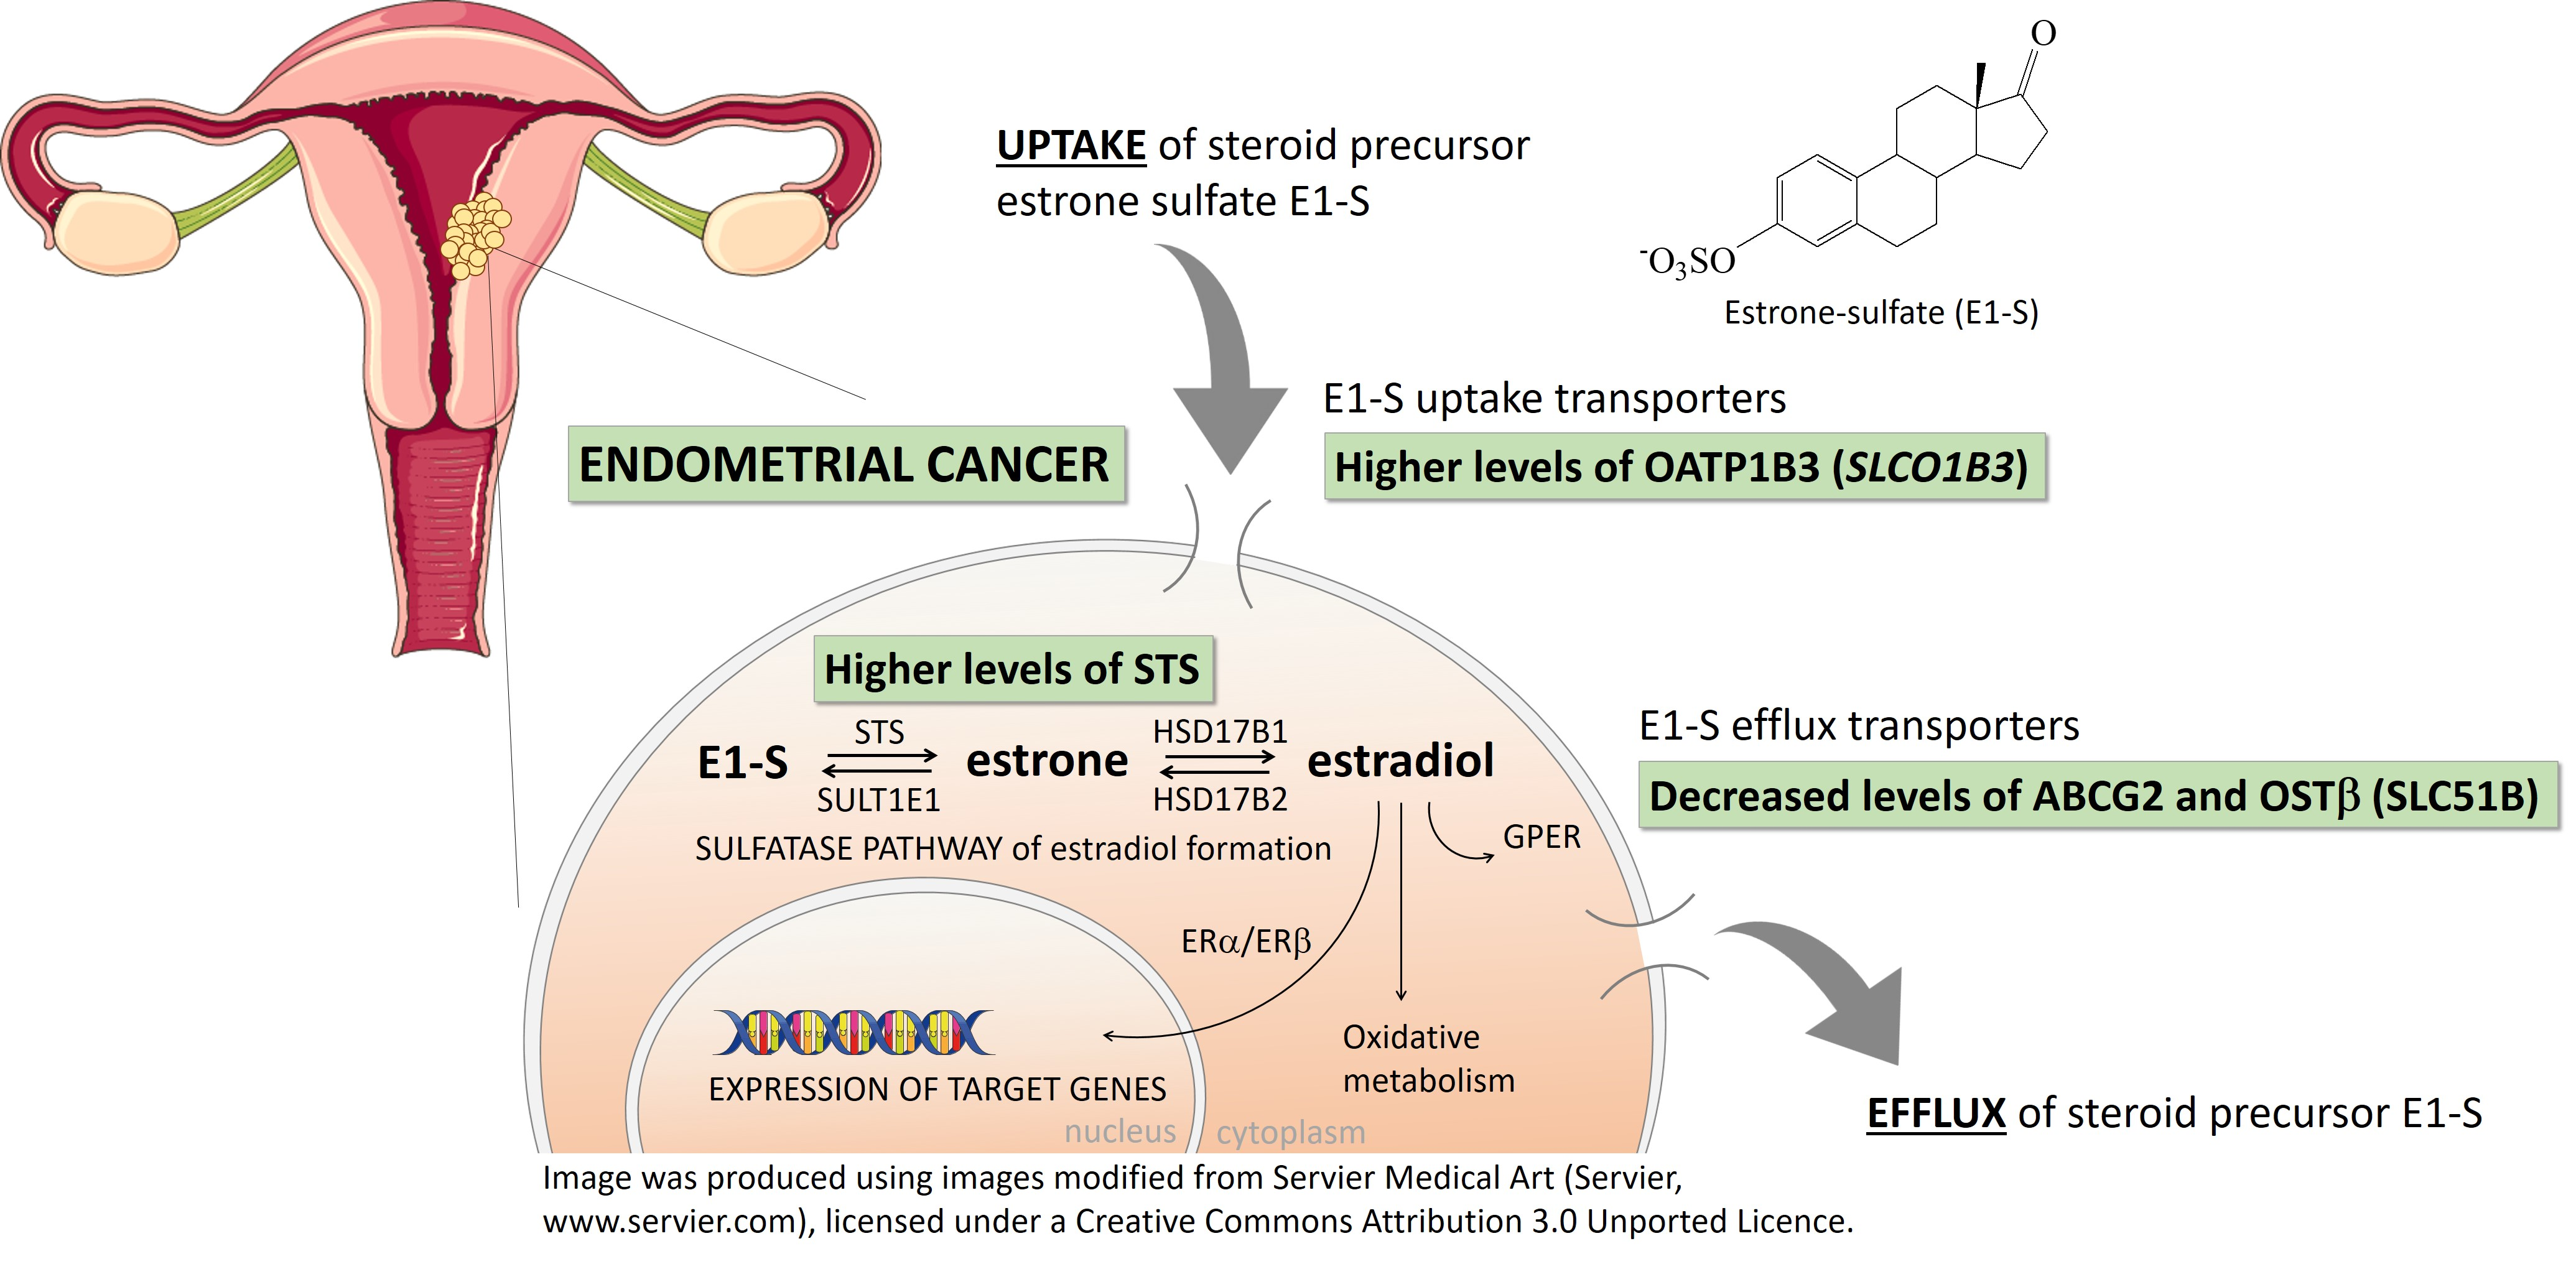
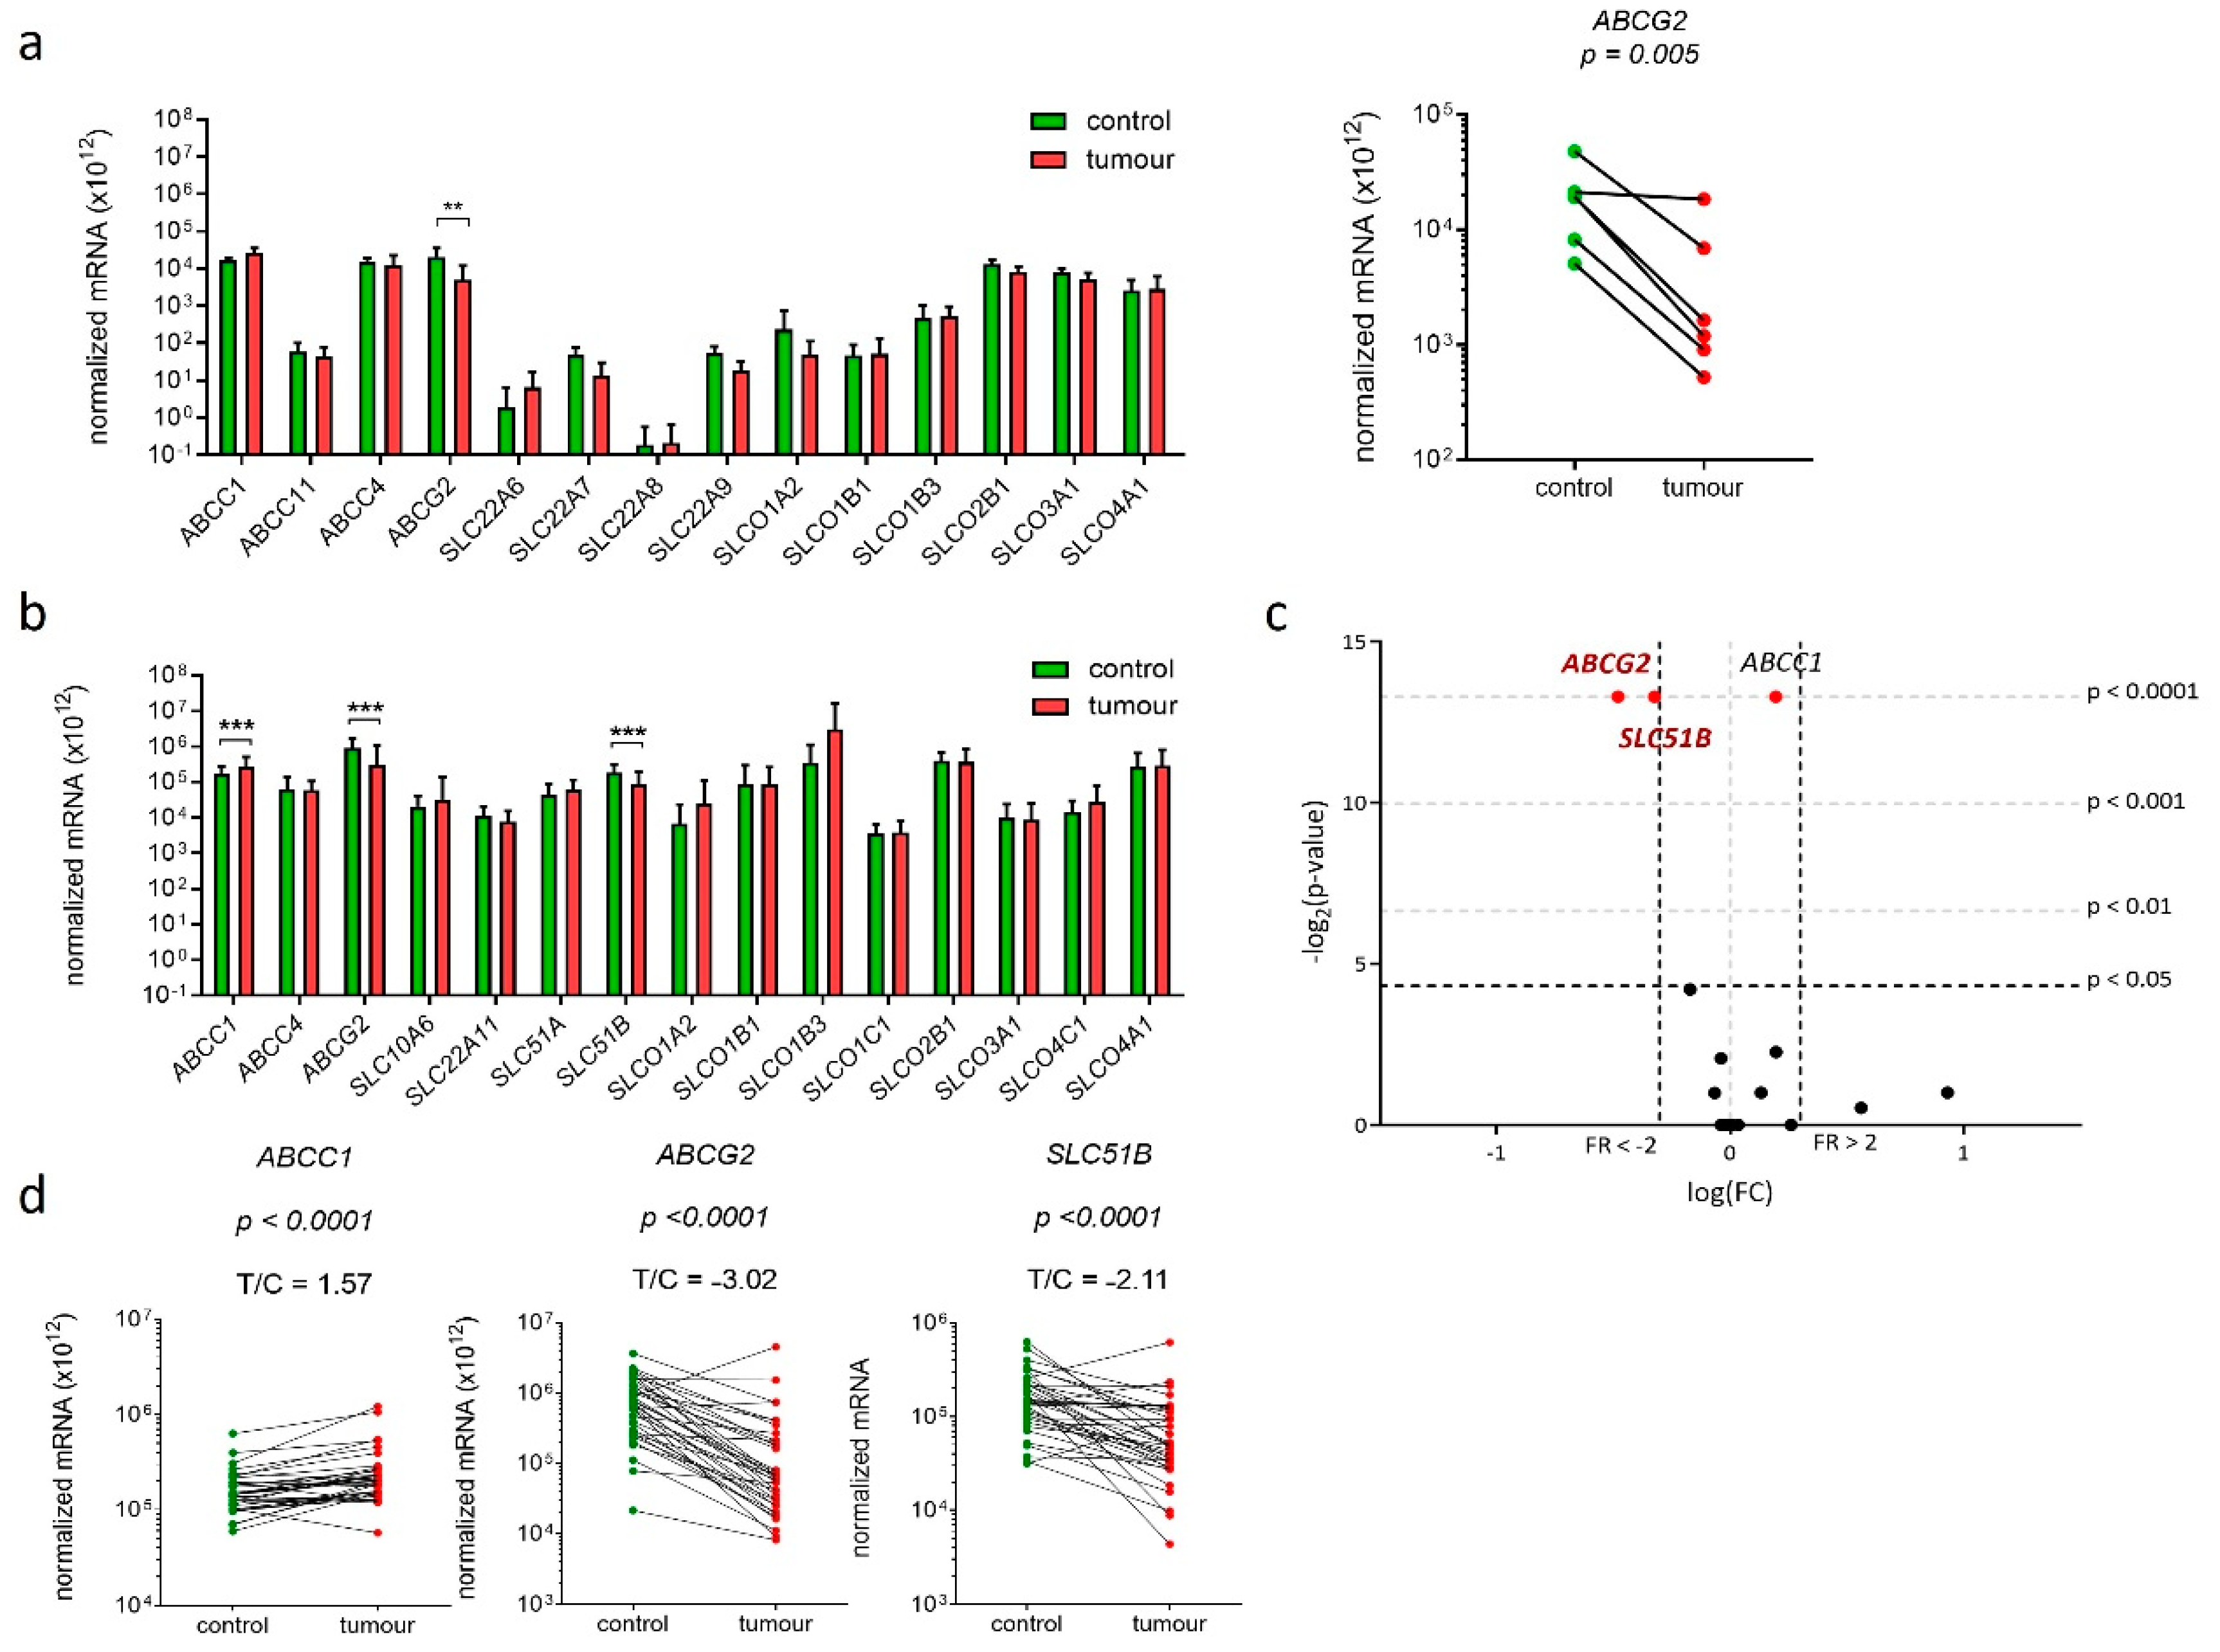
2.1. Fourteen Genes Encoding E1-S Transporters Are Differentially Expressed in Model Cell Lines Ishikawa and HEC-1-A
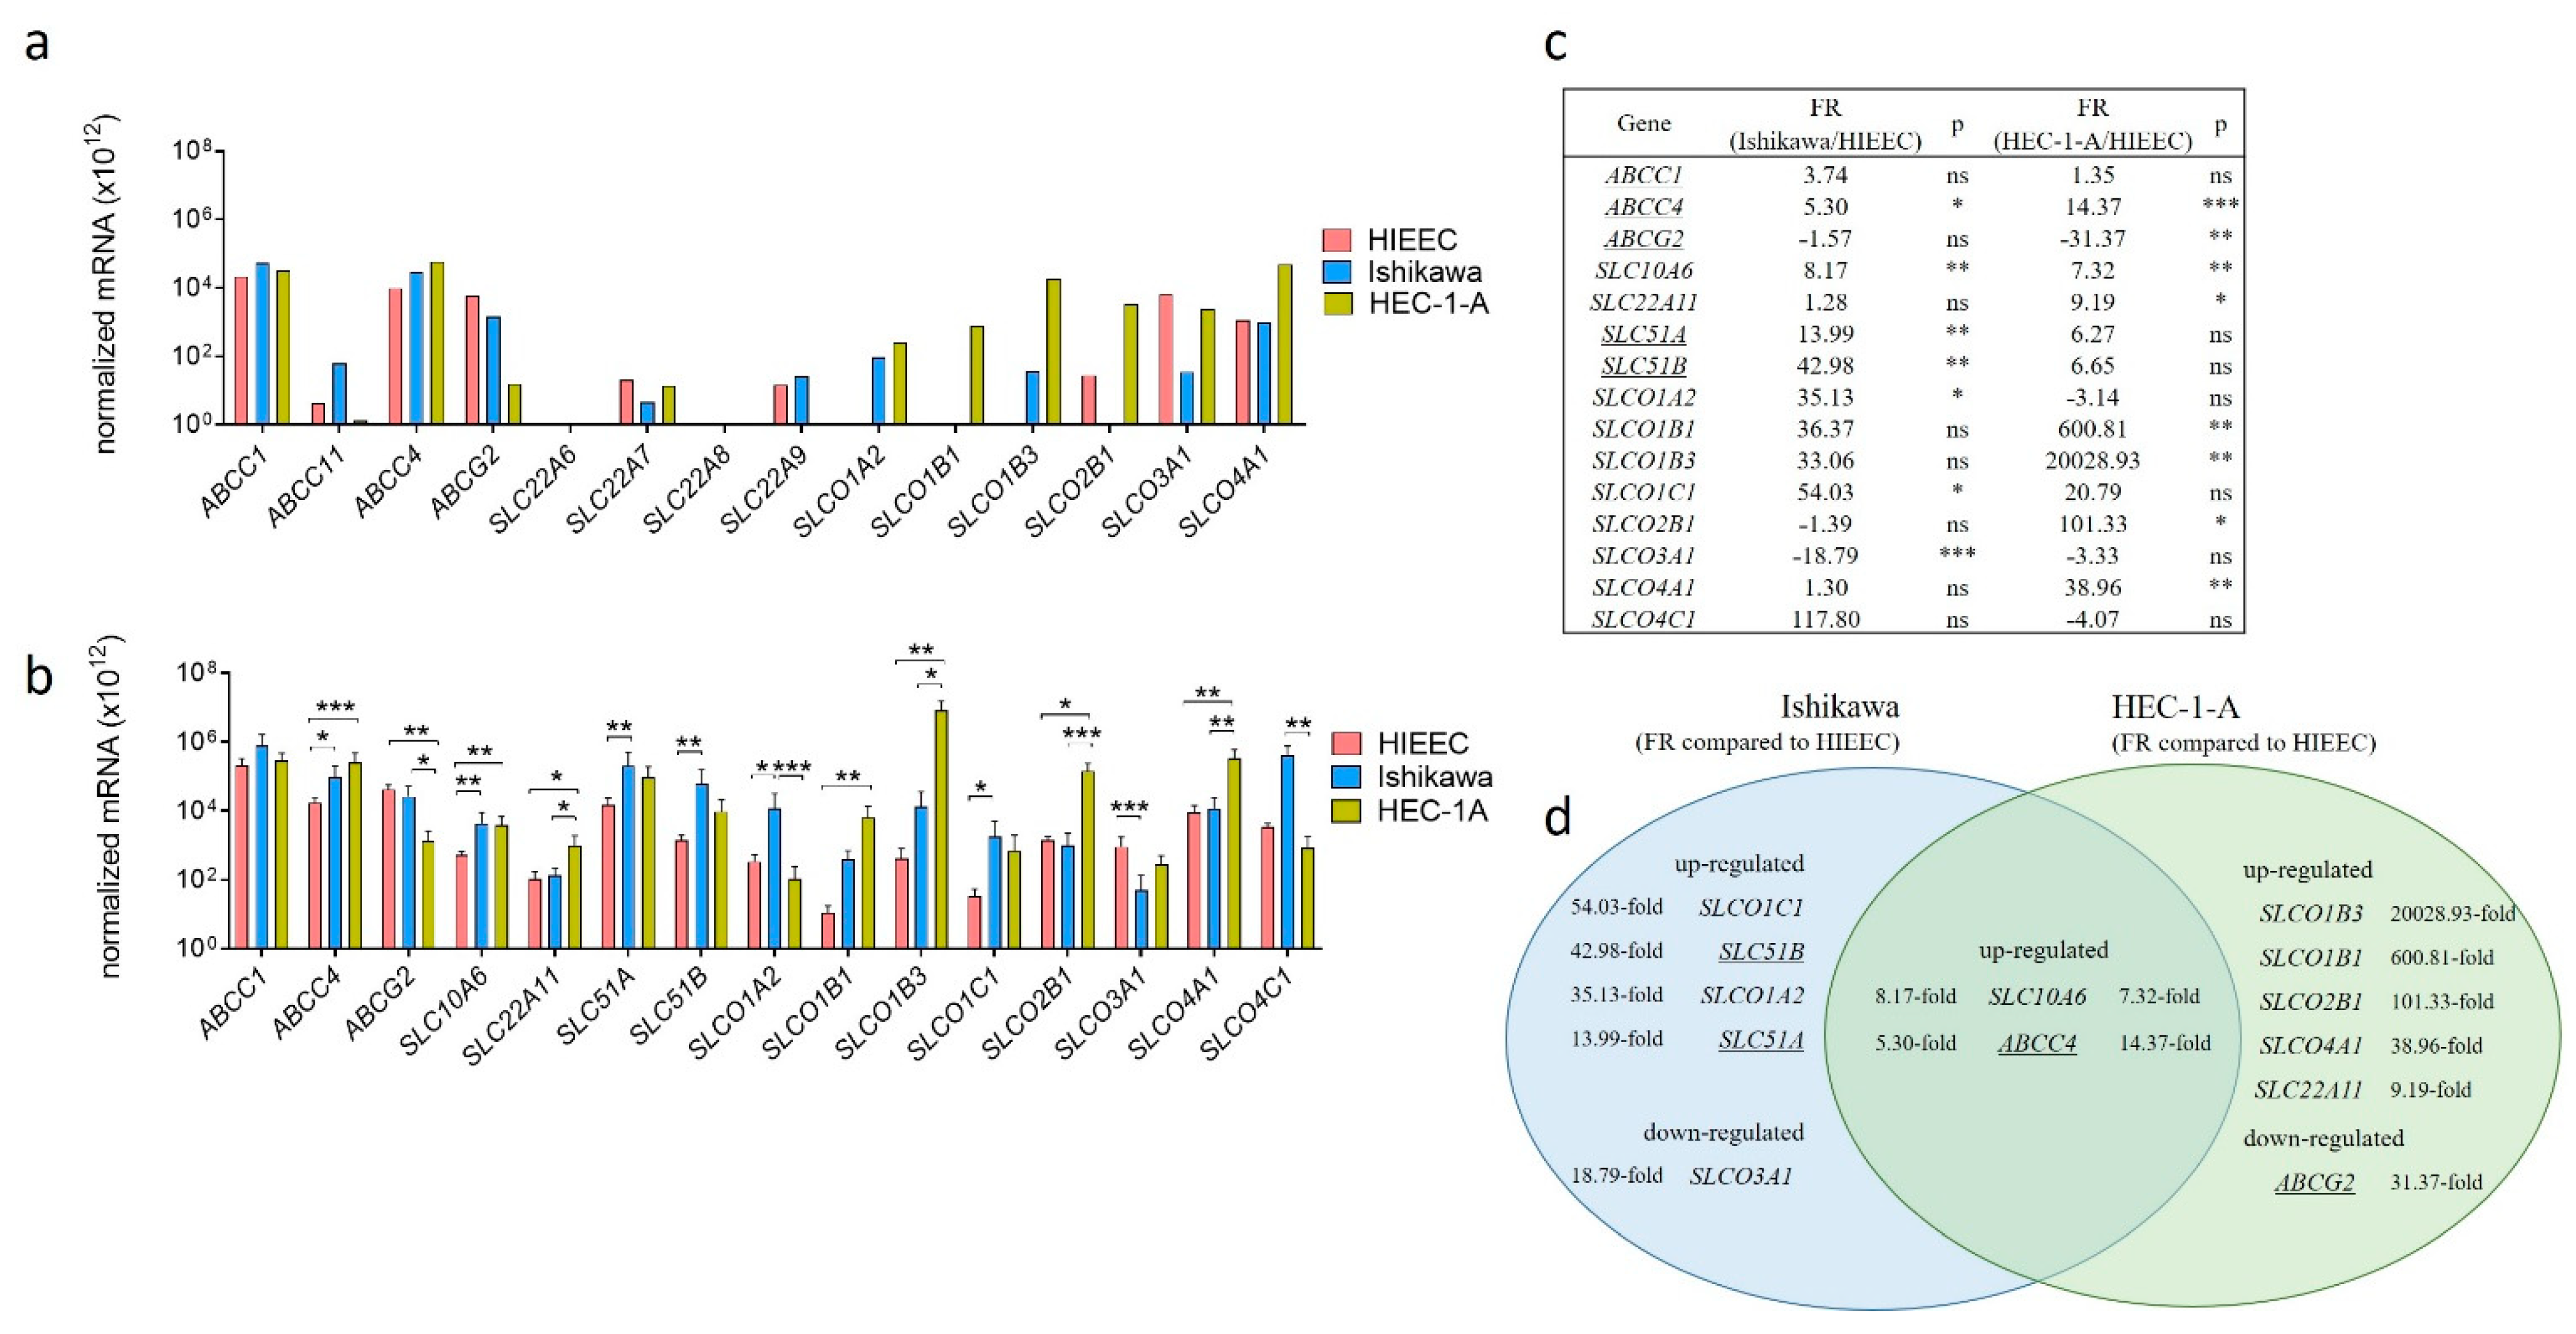
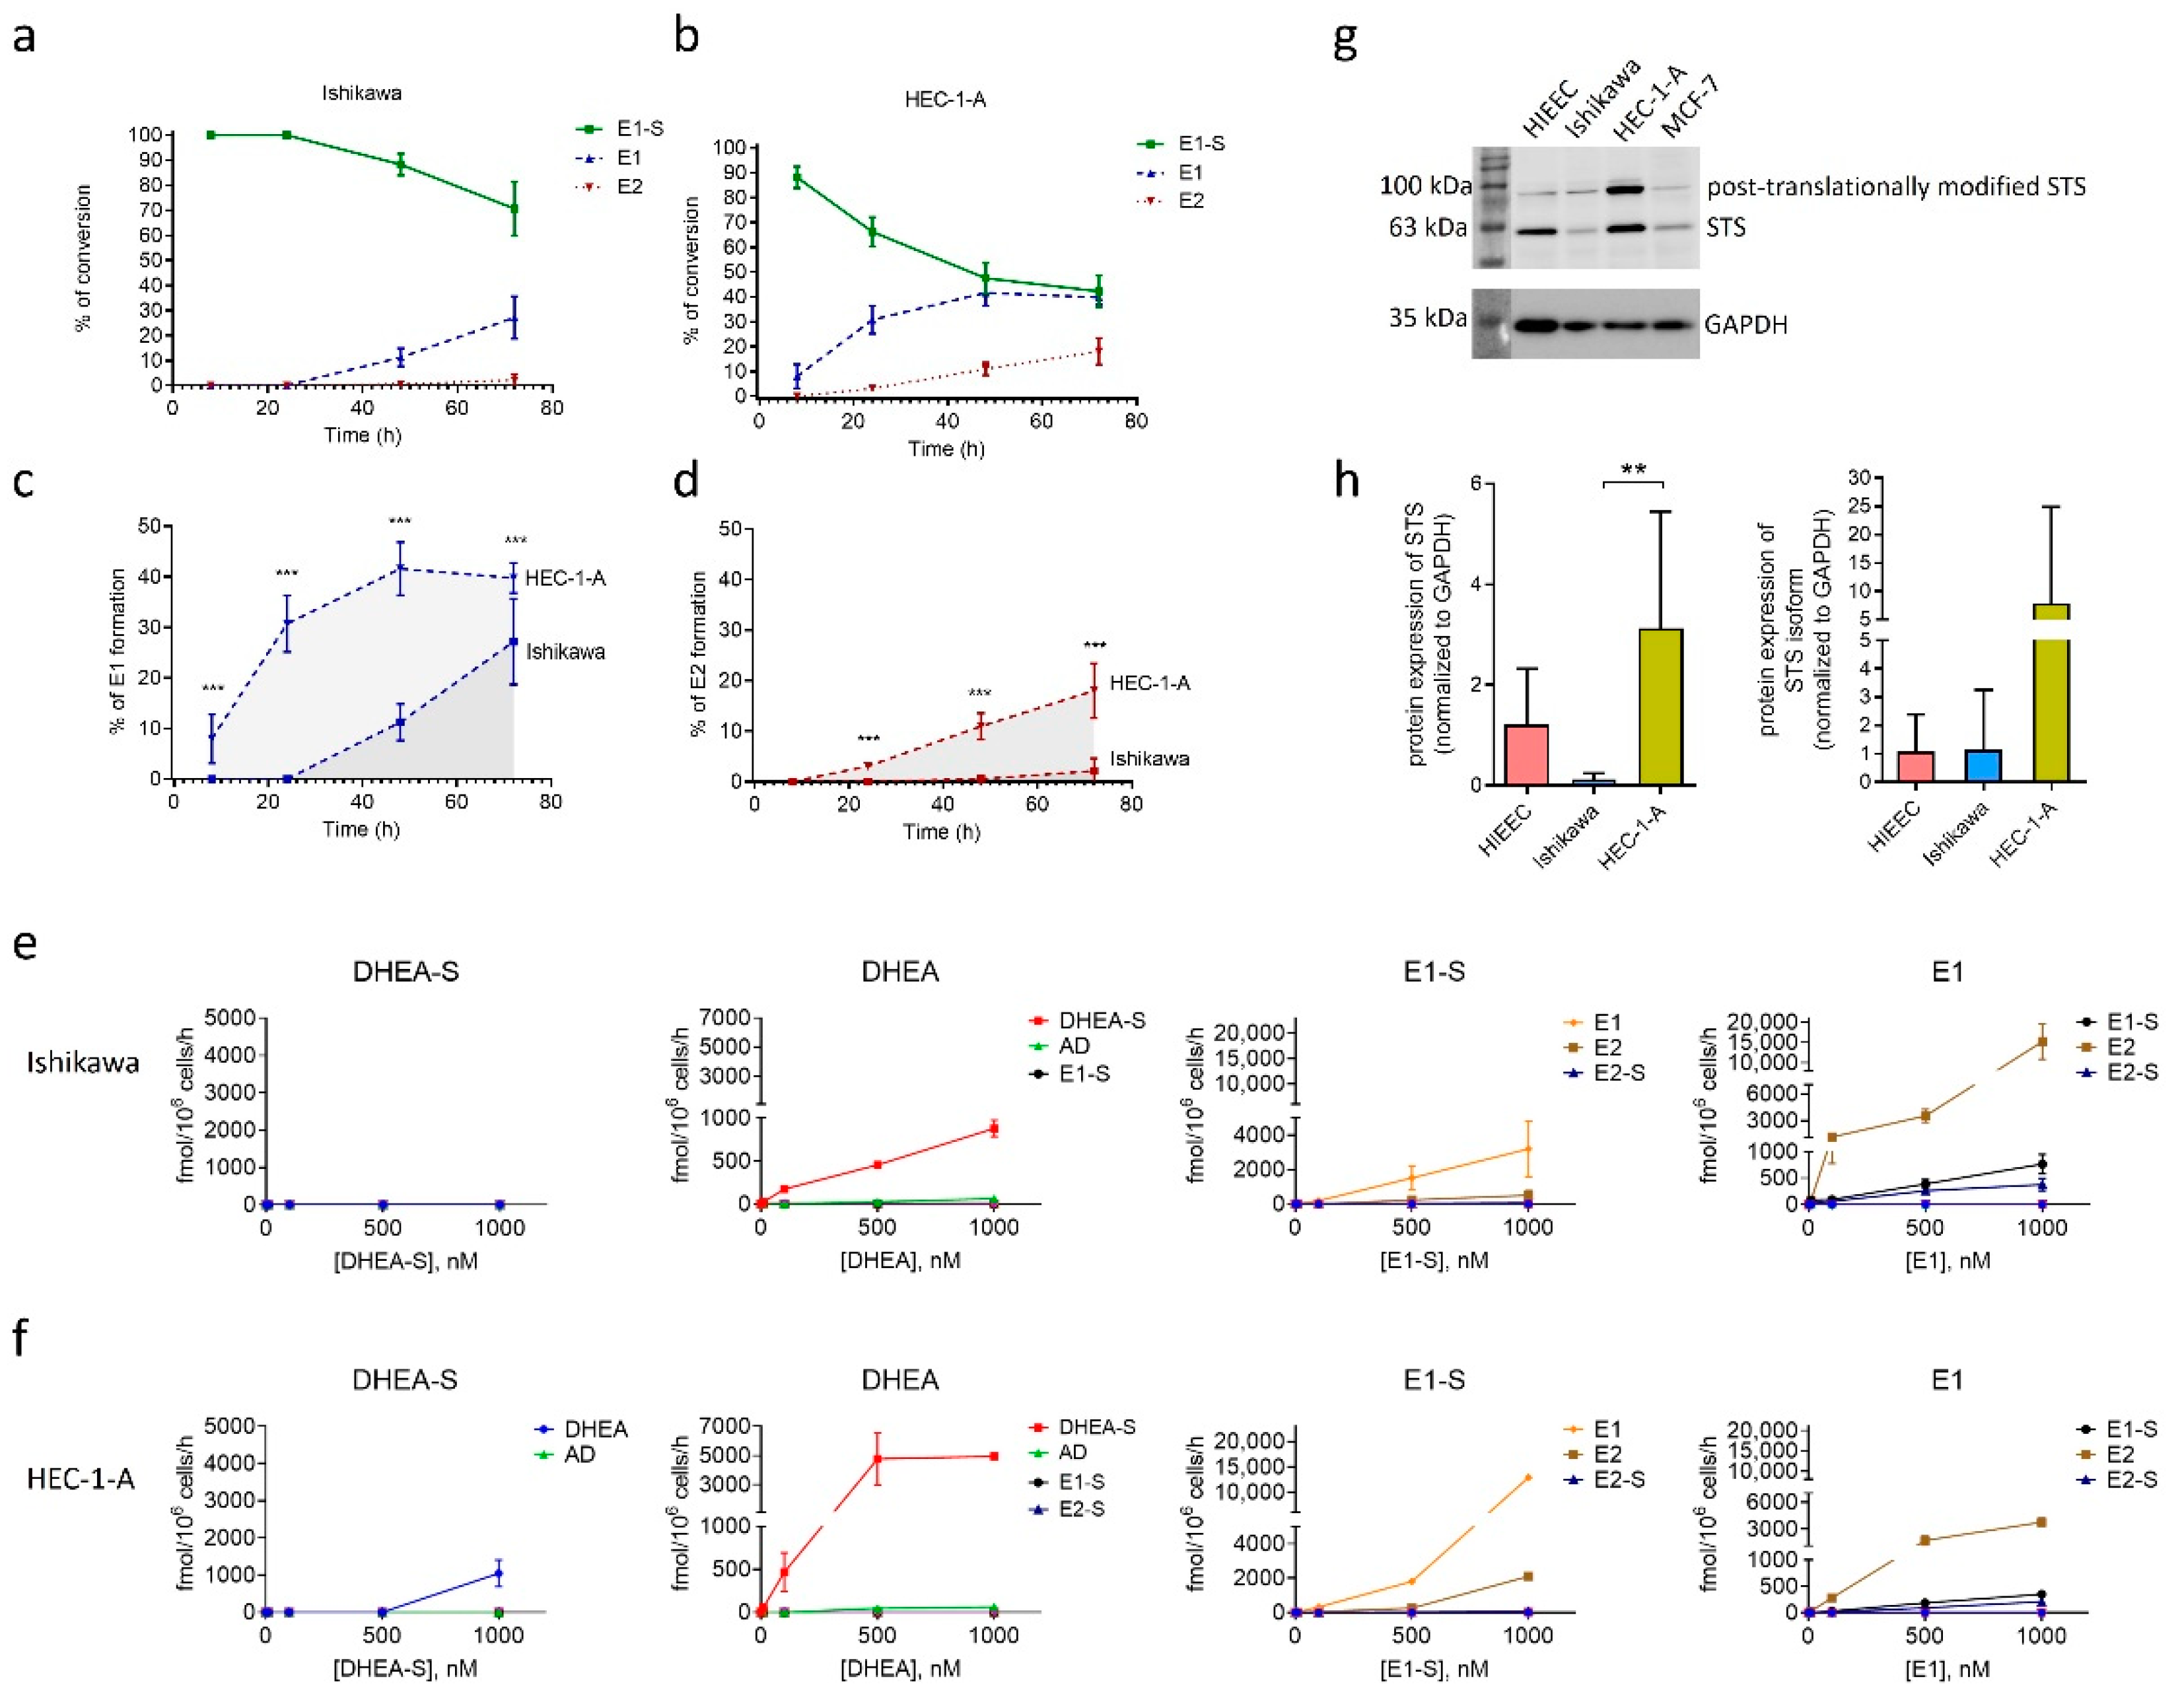
2.2. Levels of OATP1B3 Are Higher in HEC-1-A Compared to Ishikawa
2.3. Model Cell Line HEC-1-A Efficiently Metabolizes E1-S
2.4. Model Cell Lines HIEEC, Ishikawa and HEC-1-A Differ in Protein Levels of STS
2.5. Model Cell Lines Ishikawa and HEC-1-A Differ in E1-S Uptake
2.6. Silencing of SLCO1B3, SLCO1B1 and SLCO2B1 Affects the Uptake of E1-S in HEC-1-A
2.7. Three Genes Encoding E1-S Transporters Are Differentially Expressed in EC Tissue
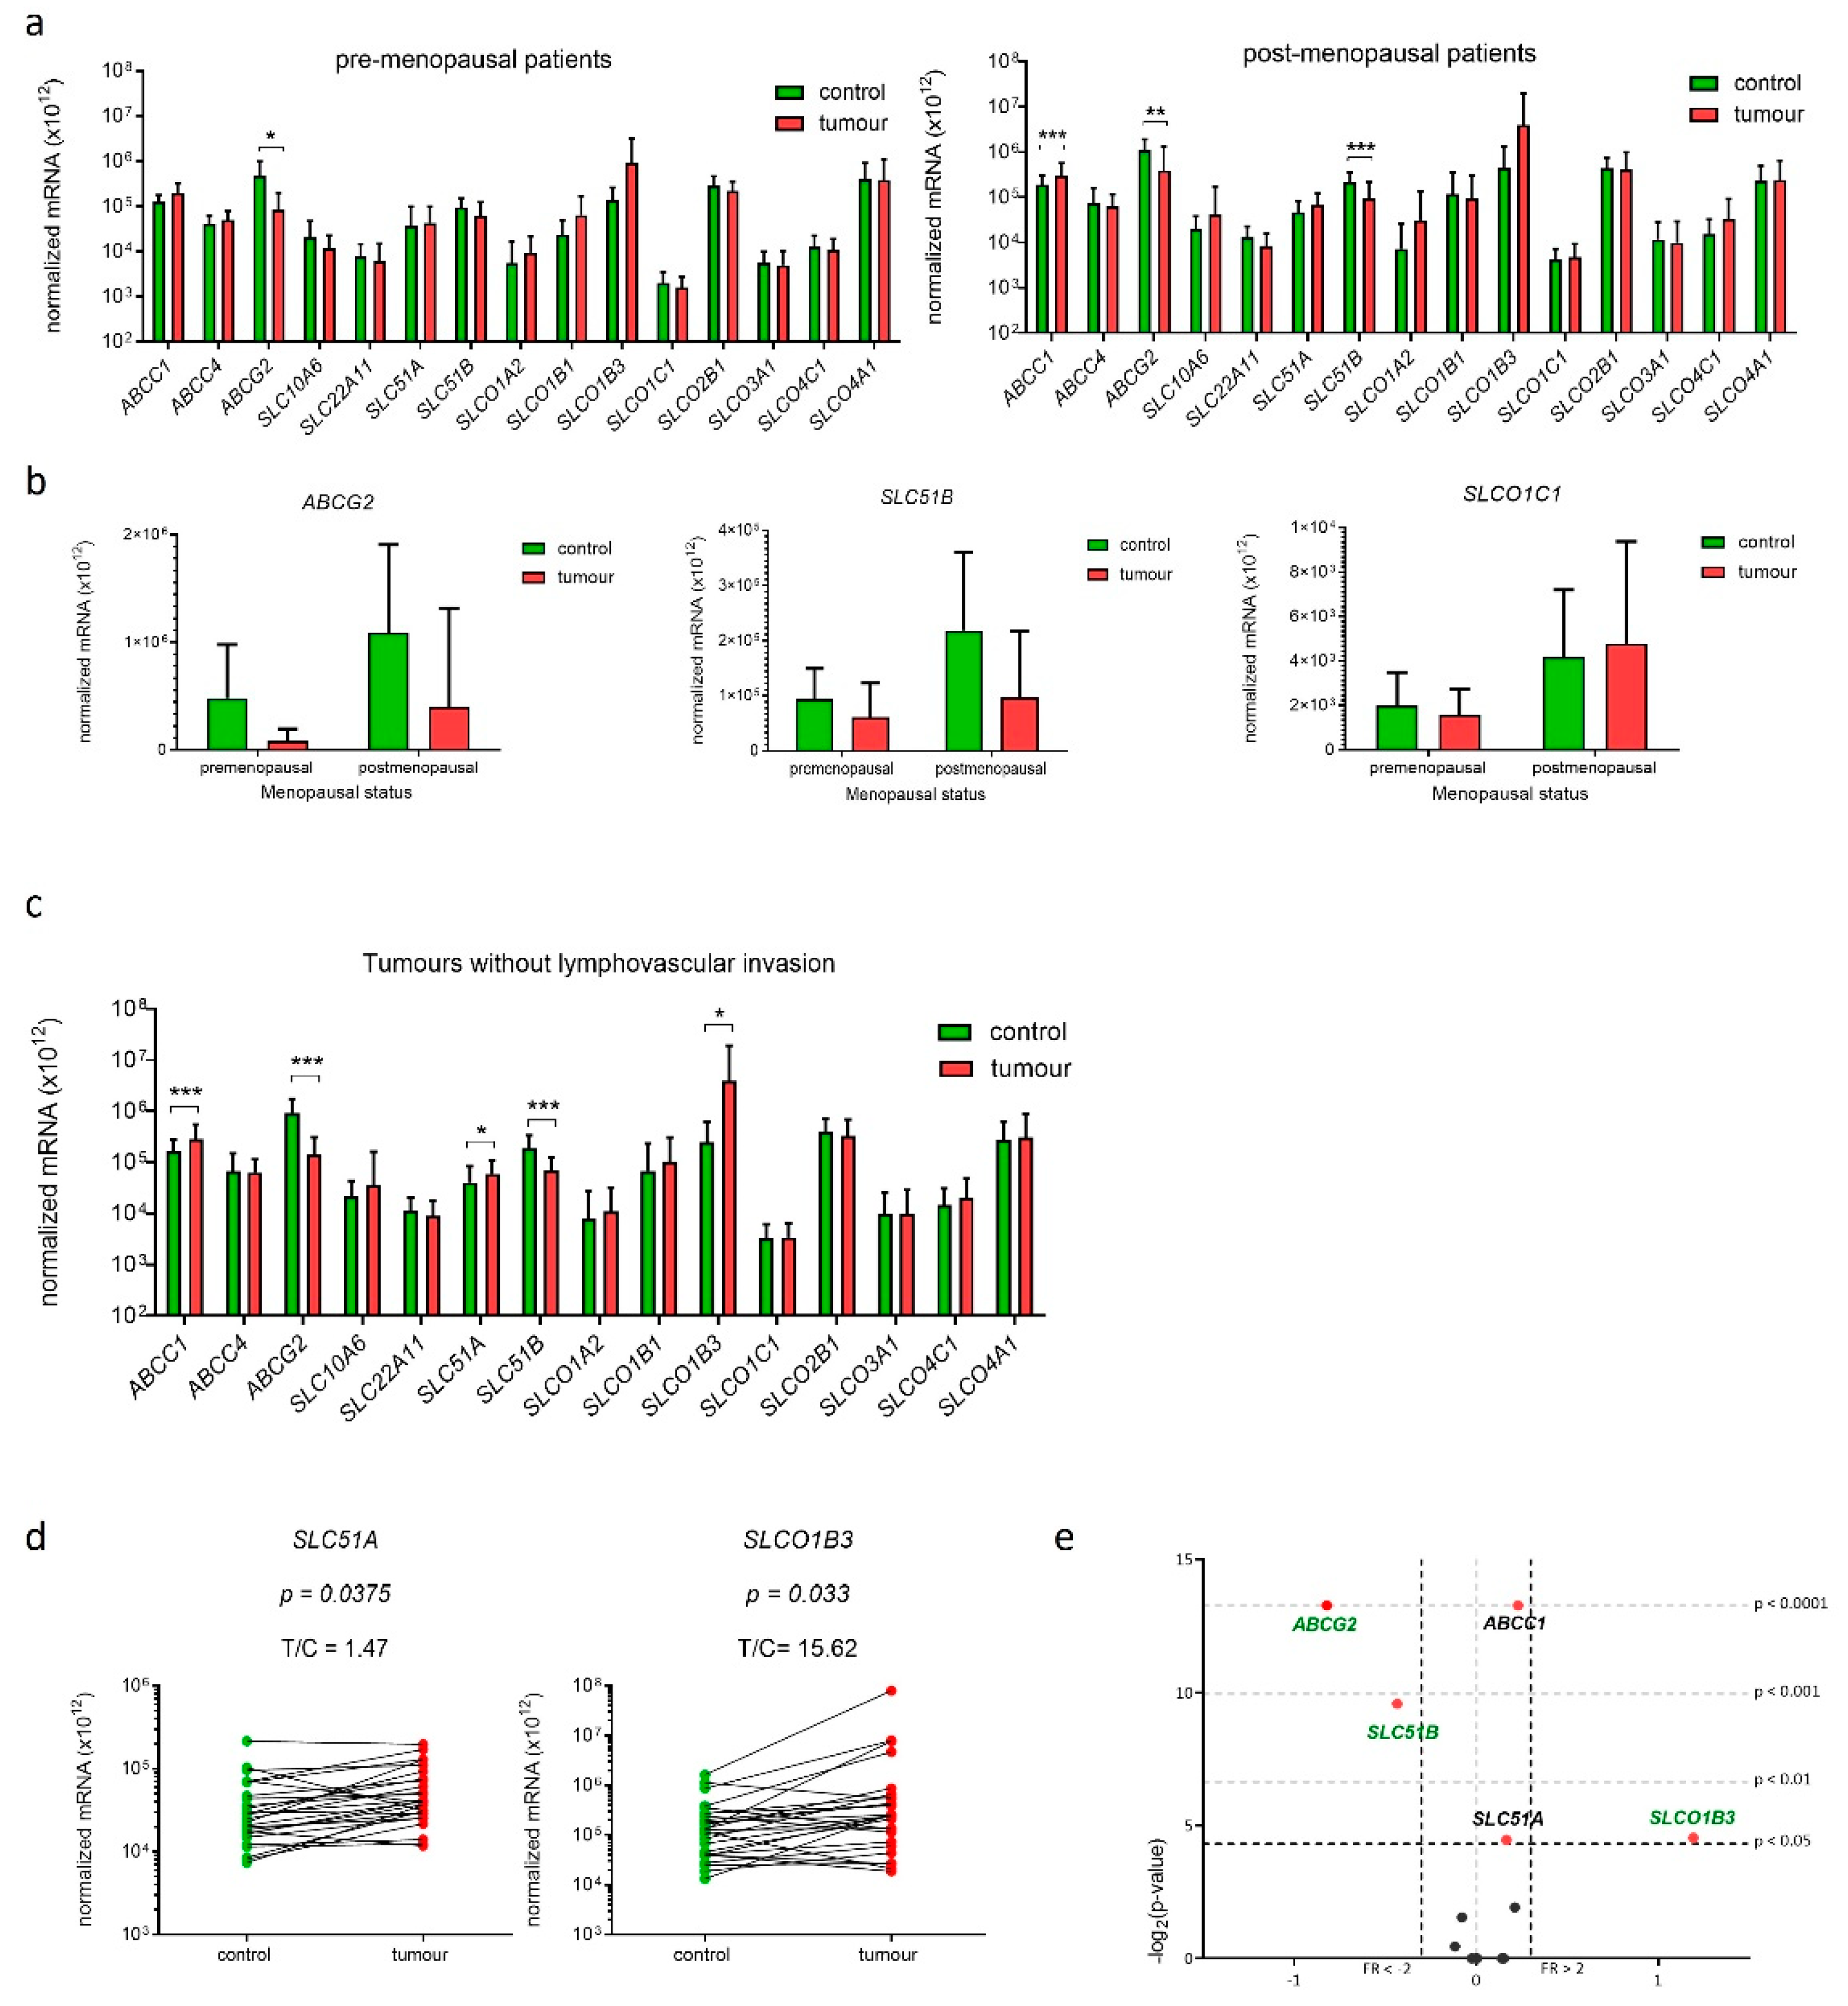
2.8. Genes Encoding E1-S Transporters Are Differentially Expressed in EC Tissue Samples from Postmenopausal Patients
2.9. Gene SLCO1B3 Is Up-Regulated in EC Tissue Samples from Patients without Lymphovascular Invasion
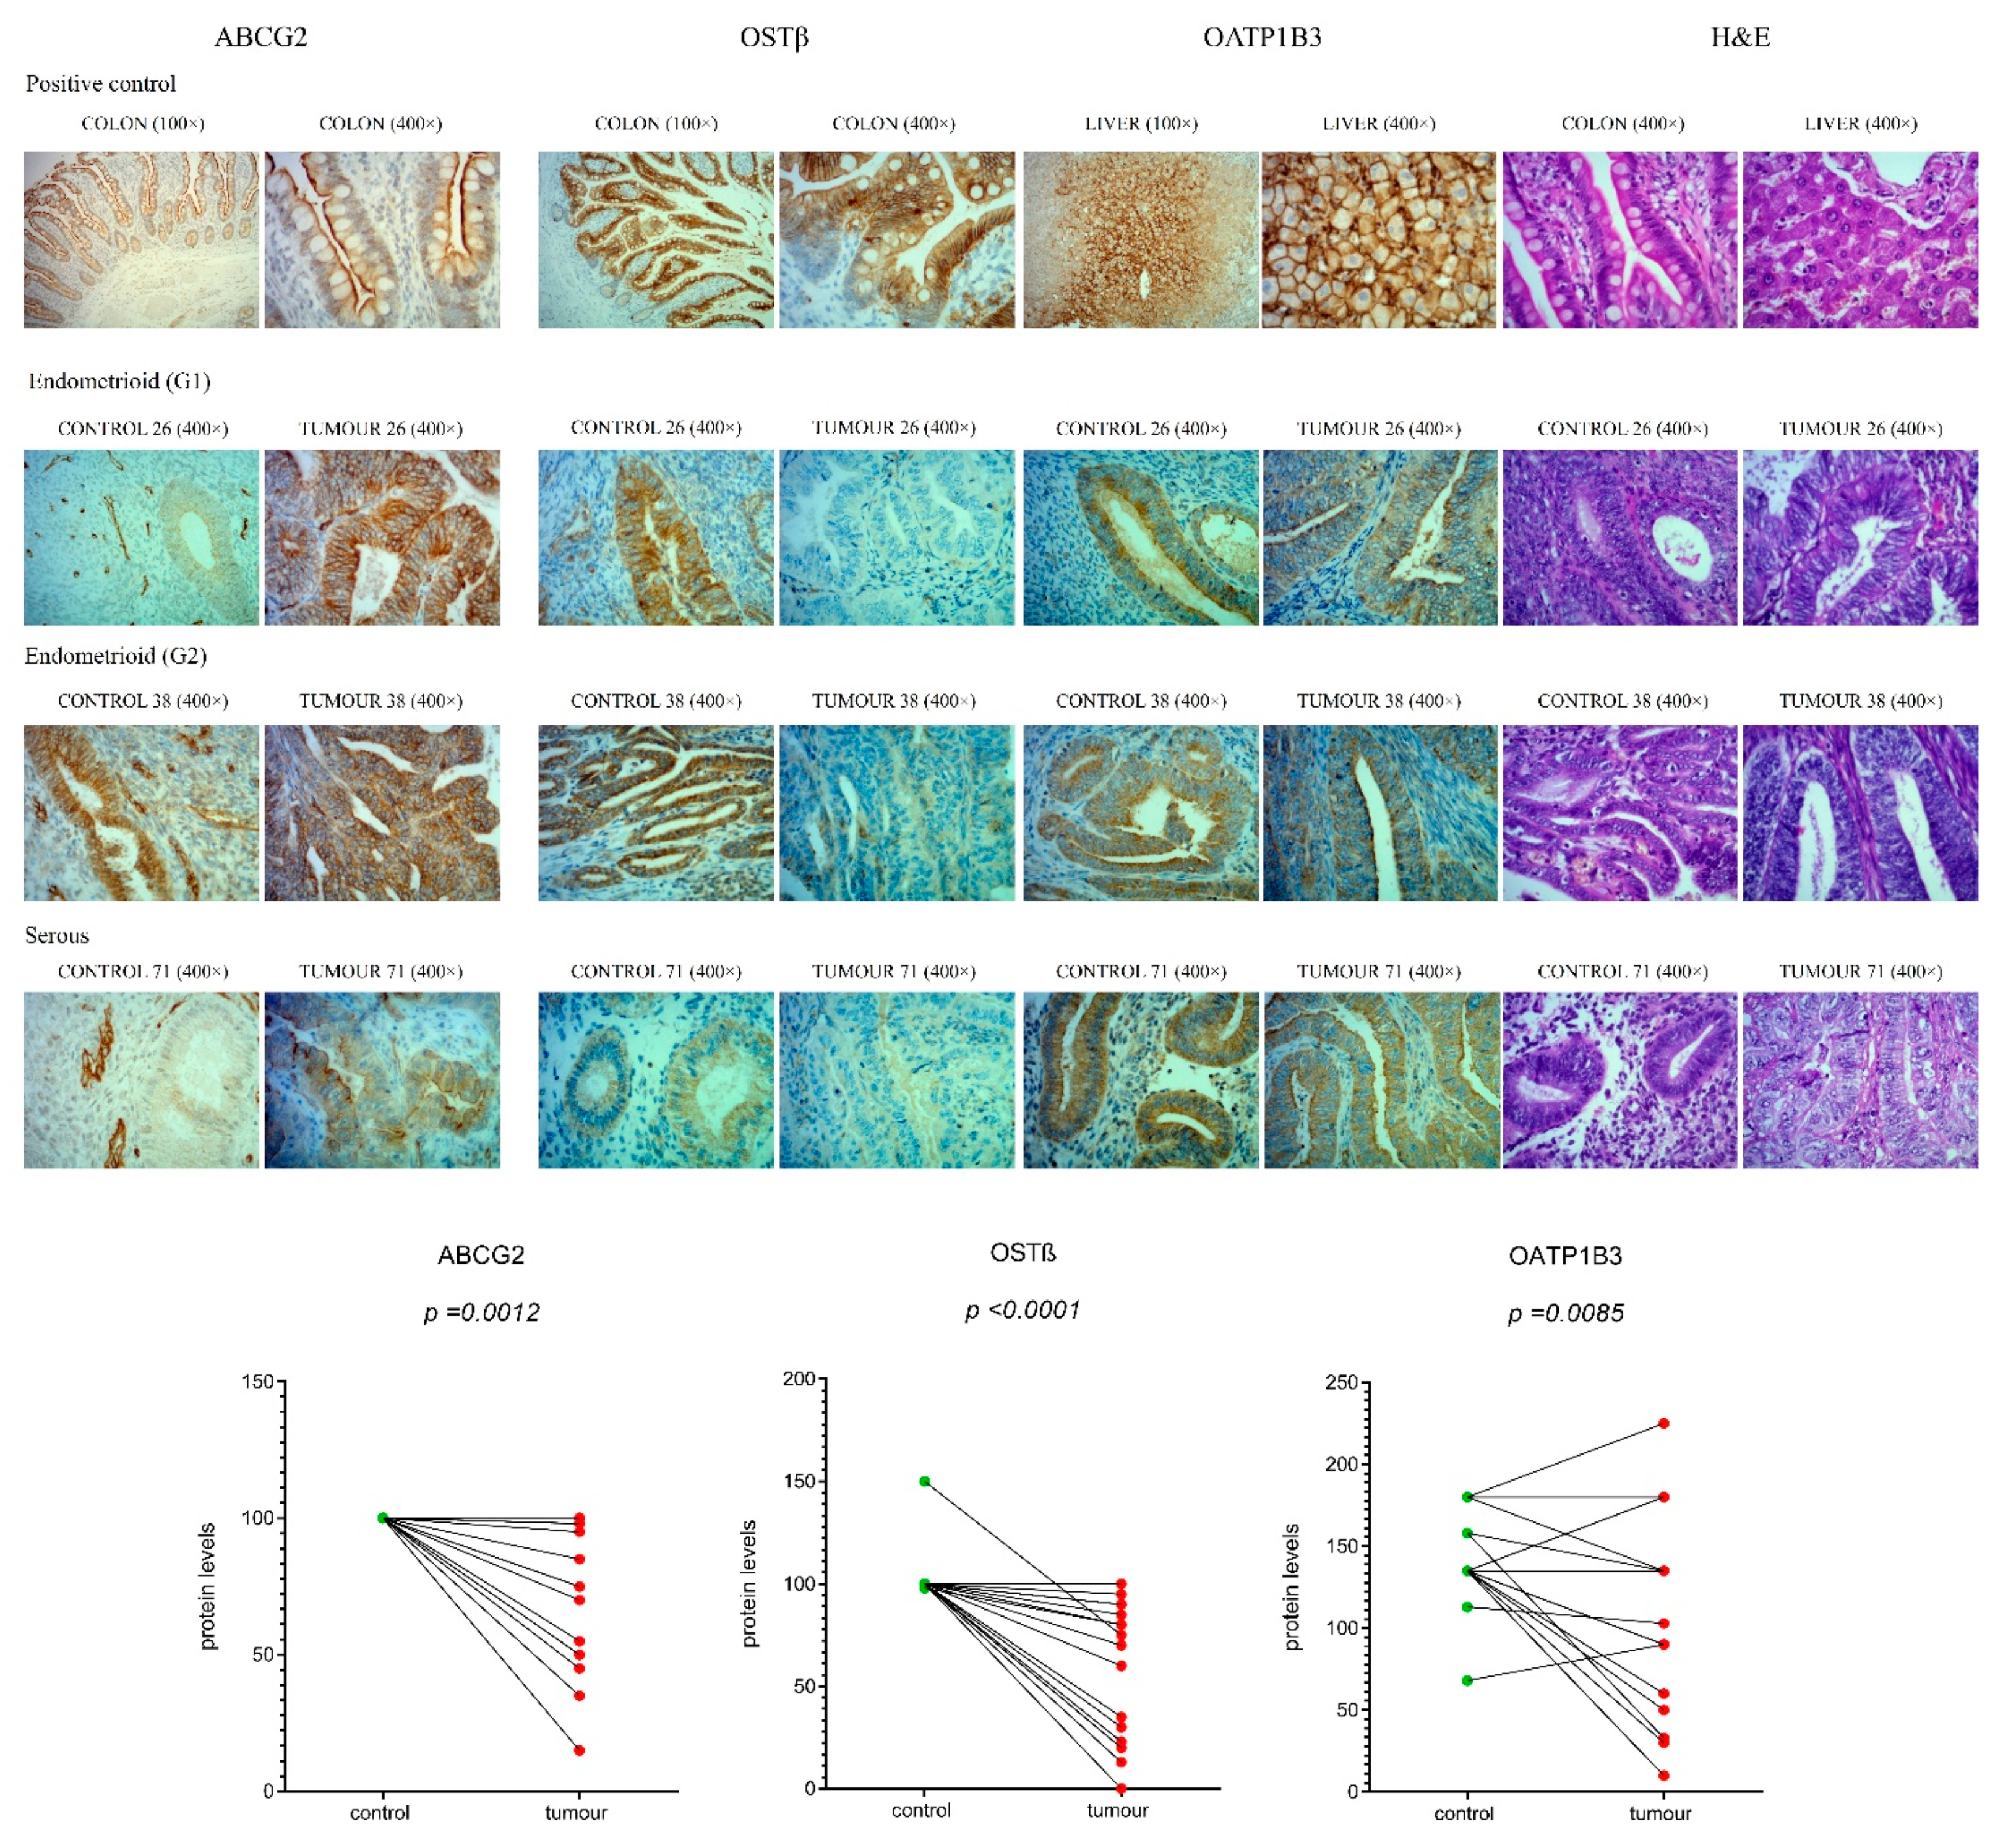
2.10. Protein Levels of Efflux Transporters ABCG2, OSTβ and OATP1B3 Are Significantly Lower in EC Tissue Compared to Adjacent Control Tissue
3. Discussion
4. Materials and Methods
4.1. Model Cell Lines
4.2. Endometrial Tissue
4.3. RNA Isolation and Reverse Transcription
4.4. Quantitative PCR
4.5. Western Blotting
4.6. Immunocytochemistry
4.7. Immunofluorescence Quantification
4.8. E1-S Metabolism Studies
4.9. LC-HRMS Assay for Steroid Quantification
4.10. E1-S Transport Experiments
4.11. Gene Silencing Using Small-Interfering (si)RNAs
4.12. Immunohistochemistry
4.13. Statistical Analysis
5. Conclusions
Supplementary Materials
Author Contributions
Funding
Institutional Review Board Statement
Informed Consent Statement
Data Availability Statement
Acknowledgments
Conflicts of Interest
References
- Ferlay, J.; Soerjomataram, I.; Ervik, M.; Dikshit, R.; Eser, S.; Mathers, C.; Rebelo, M.; Parkin, D.M.; Forman, D.; Bray, F. GLOBOCAN 2012 v1.0, Cancer Incidence and Mortality Worldwide: IARC CancerBase No.11; International Agency for Research on Cancer: Lyon, France, 2013. [Google Scholar]
- Colombo, N.; Creutzberg, C.L.; Amant, F.; Bosse, T.; González-Martín, A.; Ledermann, J.; Marth, C.; A Nout, R.; Querleu, D.; Mirza, M.R.; et al. ESMO-ESGO-ESTRO Consensus Conference on Endometrial Cancer: Diagnosis, Treatment and Follow-up. Int. J. Gynecol. Cancer 2016, 26, 2–30. [Google Scholar] [CrossRef]
- Morice, P.; Leary, A.; Creutzberg, C.; Abu-Rustum, N.; Darai, E. Endometrial cancer. Lancet 2015, 387, 1094–1108. [Google Scholar] [CrossRef]
- Murali, R.; Soslow, R.A.; Weigelt, B. Classification of endometrial carcinoma: More than two types. Lancet Oncol. 2014, 15, e268–e278. [Google Scholar] [CrossRef]
- Henderson, B.E.; Feigelson, H.S. Hormonal carcinogenesis. Carcinogenesis 2000, 21, 427–433. [Google Scholar] [CrossRef] [PubMed]
- Akhmedkhanov, A.; Zeleniuch-Jacquotte, A.; Toniolo, P. Role of exogenous and endogenous hormones in endometrial cancer: Review of the evidence and research perspectives. Ann. N. Y. Acad. Sci. 2001, 943, 296–315. [Google Scholar] [CrossRef] [PubMed]
- Inoue, M. Current molecular aspects of the carcinogenesis of the uterine endometrium. Int. J. Gynecol. Cancer 2001, 11, 339–348. [Google Scholar] [CrossRef] [PubMed]
- Samarnthai, N.; Vinyuvat, S. Metanephric stromal tumor with unusual heterologous adipose differentiation: A case report and literature review. J. Med. Assoc. Thai. 2013, 96, 7–1621. [Google Scholar]
- Berstein, L.M.; Tchernobrovkina, A.E.; Gamajunova, V.B.; Kovalevskij, A.J.; Vasilyev, D.A.; Chepik, O.F.; Turkevitch, E.A.; Tsyrlina, E.V.; Maximov, S.J.; Ashrafian, L.A.; et al. Tumor estrogen content and clinico-morphological and endocrine features of endometrial cancer. J. Cancer Res. Clin. Oncol. 2003, 129, 245–249. [Google Scholar] [CrossRef]
- Wan, J.; Gao, Y.; Zeng, K.; Yin, Y.; Zhao, M.; Wei, J.; Chen, Q. The levels of the sex hormones are not different between type 1 and type 2 endometrial cancer. Sci. Rep. 2016, 6, 39744. [Google Scholar] [CrossRef]
- Kandoth, C.; The Cancer Genome Atlas Research Network. Integrated genomic characterization of endometrial carcinoma. Nature 2013, 497, 67–73. [Google Scholar]
- Suarez, A.A.; Felix, A.S.; Cohn, D.E. Bokhman Redux: Endometrial cancer “types” in the 21st century. Gynecol. Oncol. 2017, 144, 243–249. [Google Scholar] [CrossRef]
- Rižner, T.L.; Thalhammer, T.; Özvegy-Laczka, C. The Importance of Steroid Uptake and Intracrine Action in Endometrial and Ovarian Cancers. Front. Pharmacol. 2017, 8, 346. [Google Scholar] [CrossRef]
- Rižner, T.L. The Important Roles of Steroid Sulfatase and Sulfotransferases in Gynecological Diseases. Front. Pharmacol. 2016, 7, 30. [Google Scholar] [CrossRef]
- Sinreih, M.; Knific, T.; Anko, M.; Hevir, N.; Vouk, K.; Jerin, A.; Grazio, S.F.; Rižner, T.L. The Significance of the Sulfatase Pathway for Local Estrogen Formation in Endometrial Cancer. Front. Pharmacol. 2017, 8, 368. [Google Scholar] [CrossRef]
- Lépine, J.; Knific, T.; Anko, M.; Hevir, N.; Vouk, K.; Jerin, A.; Grazio, S.F.; Rižner, T.L. Circulating estrogens in endometrial cancer cases and their relationship with tissular expression of key estrogen biosynthesis and metabolic pathways. J. Clin. Endocrinol. Metab. 2010, 95, 98–2689. [Google Scholar] [CrossRef] [PubMed]
- Morrissey, K.M.; Wen, C.C.; Johns, S.J.; Zhang, L.; Huang, S.-M.; Giacomini, K.M. The UCSF-FDA TransPortal: A public drug transporter database. Clin. Pharmacol. Ther. 2012, 92, 6–545. [Google Scholar] [CrossRef] [PubMed]
- Roth, M.; Obaidat, A.; Hagenbuch, B. OATPs, OATs and OCTs: The organic anion and cation transporters of the SLCO and SLC22A gene superfamilies. Br. J. Pharmacol. 2012, 165, 87–1260. [Google Scholar] [CrossRef]
- Hagenbuch, B.; Stieger, B. The SLCO (former SLC21) superfamily of transporters. Mol. Aspects Med. 2013, 34, 396–412. [Google Scholar] [CrossRef]
- Grosser, G.; Bennien, J.; Sánchez-Guijo, A.; Bakhaus, K.; Döring, B.; Hartmann, M.; Wudy, S.A.; Geyer, J. Transport of steroid 3-sulfates and steroid 17-sulfates by the sodium-dependent organic anion transporter SOAT (SLC10A6). J. Steroid Biochem. Mol. Biol. 2017. [Google Scholar] [CrossRef] [PubMed]
- Claro da Silva, T.; Polli, J.E.; Swaan, P.W. The solute carrier family 10 (SLC10): Beyond bile acid transport. Mol. Aspects Med. 2013, 34, 252–269. [Google Scholar] [CrossRef]
- Ween, M.P.; Armstrong, M.; Oehler, M.; Ricciardelli, C. The role of ABC transporters in ovarian cancer progression and chemoresistance. Crit. Rev. Oncol. Hematol. 2015, 96, 56–220. [Google Scholar] [CrossRef] [PubMed]
- Dawson, P.A.; Hubbert, M.; Haywood, J.; Cradock, A.L.; Zerangue, N.; Christian, W.V.; Ballatori, N. The heteromeric organic solute transporter alpha-beta, Ostalpha-Ostbeta, is an ileal basolateral bile acid transporter. J. Biol. Chem. 2005, 280, 8–6960. [Google Scholar] [CrossRef] [PubMed]
- Ballatori, N.; Christian, W.V.; Wheeler, S.G.; Hammond, C.L. The heteromeric organic solute transporter, OSTα-OSTβ/SLC51: A transporter for steroid-derived molecules. Mol. Aspects Med. 2013, 34, 92–683. [Google Scholar] [CrossRef] [PubMed]
- Geisler, J. Breast cancer tissue estrogens and their manipulation with aromatase inhibitors and inactivators. J. Steroid Biochem. Mol. Biol. 2003, 86, 245–253. [Google Scholar] [CrossRef]
- Pasqualini, J.R.; Chetrite, G.; Blacker, C.; Feinstein, M.C.; Delalonde, L.; Talbi, M.; Maloche, C. Concentrations of estrone, estradiol, and estrone sulfate and evaluation of sulfatase and aromatase activities in pre- and postmenopausal breast cancer patients. J. Clin. Endocrinol. Metab. 1996, 81, 4–1460. [Google Scholar]
- Banerjee, N.; Fonge, H.; Mikhail, A.; Reilly, R.M.; Bendayan, R.; Allen, C. Estrone-3-sulphate, a potential novel ligand for targeting breast cancers. PLoS ONE 2013, 8, e64069. [Google Scholar] [CrossRef]
- Ogane, N.; Yasuda, M.; Kameda, Y.; Yokose, T.; Kato, H.; Itoh, A.; Nishino, S.; Hashimoto, Y.; Kamoshida, S. Prognostic value of organic anion transporting polypeptide 1B3 and copper transporter 1 expression in endometrial cancer patients treated with paclitaxel and carboplatin. Biomed. Res. 2013, 34, 51–143. [Google Scholar] [CrossRef][Green Version]
- Svoboda, M.; Wlcek, K.; Taferner, B.; Hering, S.; Stieger, B.; Tong, D.; Zeillinger, R.; Thalhammer, T.; Jäger, W. Expression of organic anion-transporting polypeptides 1B1 and 1B3 in ovarian cancer cells: Relevance for paclitaxel transport. Biomed. Pharmacother 2011, 65, 26–417. [Google Scholar] [CrossRef]
- Lancaster, C.S.; Sprowl, J.A.; Walker, A.L.; Hu, S.; Gibson, A.A.; Sparreboom, A. Modulation of OATP1B-type transporter function alters cellular uptake and disposition of platinum chemotherapeutics. Mol. Cancer Ther. 2013, 12, 44–1537. [Google Scholar] [CrossRef]
- Ishikawa, T.; Nakagawa, H. Human ABC transporter ABCG2 in cancer chemotherapy and pharmacogenomics. J. Exp. Ther. Oncol. 2009, 8, 5–24. [Google Scholar]
- Nakamura, M.; Zhang, X.; Mizumoto, Y.; Maida, Y.; Bono, Y.; Takakura, M.; Kyo, S. Molecular characterization of CD133+ cancer stem-like cells in endometrial cancer. Int. J. Oncol. 2014, 44, 77–669. [Google Scholar] [CrossRef]
- Hevir-Kene, N.; Rižner, T.L. The endometrial cancer cell lines Ishikawa and HEC-1A, and the control cell line HIEEC, differ in expression of estrogen biosynthetic and metabolic genes, and in androstenedione and estrone-sulfate metabolism. Chem. Biol. Interact. 2015, 234, 19–309. [Google Scholar] [CrossRef]
- Kríz, L.; Bicíková, M.; Hampl, R. Roles of steroid sulfatase in brain and other tissues. Physiol. Res. 2008, 57, 68–657. [Google Scholar]
- Karlgren, M.; Vildhede, A.; Norinder, U.; Wisniewski, J.R.; Kimoto, E.; Lai, Y.; Haglund, U.; Artursson, P. Classification of Inhibitors of Hepatic Organic Anion Transporting Polypeptides (OATPs): Influence of Protein Expression on Drug–Drug Interactions. J. Med. Chem. 2012, 55, 63–4740. [Google Scholar] [CrossRef]
- Konig, J.; Cui, Y.; Nies, A.T.; Keppler, D. Localization and genomic organization of a new hepatocellular organic anion transporting polypeptide. J. Biol. Chem. 2000, 275, 8–23161. [Google Scholar] [CrossRef] [PubMed]
- Dibbelt, L.; Kuss, E. Human Placental Steryl-Sulfatase. Enzyme Purification, Production of Antisera, and Immunoblotting Reactions with Normal and Sulfatase-Deficient Placentas. Biol. Chem. Hoppe-Seyler 1986, 367, 1223–1230. [Google Scholar] [CrossRef]
- Dibbelt, L.; Herzog, V.; Kuss, E. Human Placental Sterylsulfatase: Immunocytochemical and Biochemical Localization. Biol. Chem. Hoppe Seyler 1989, 370, 1093–1102. [Google Scholar] [CrossRef]
- Cederbye, C.N.; Palshof, J.A.; Hansen, T.P.; Duun-Henriksen, A.K.; Linnemann, D.; Stenvang, J.; Nielsen, R.L.; Brünner, N.; Viuff, B.M. Antibody validation and scoring guidelines for ABCG2 immunohistochemical staining in formalin-fixed paraffin-embedded colon cancer tissue. Sci. Rep. 2016, 6, 26997. [Google Scholar] [CrossRef] [PubMed]
- Sanderson, P.A.; Critchley, H.O.; Williams, A.R.; Arends, M.J.; Saunders, P.T. New concepts for an old problem: The diagnosis of endometrial hyperplasia. Hum. Reprod. Updat. 2016, 23, 232–254. [Google Scholar] [CrossRef] [PubMed]
- Labrie, F. Extragonadal synthesis of sex steroids: Intracrinology. Ann. Endocrinol. 2003, 64, 95–107. [Google Scholar]
- Audet-Walsh, É.; Lépine, J.; Grégoire, J.; Plante, M.; Caron, P.; Têtu, B.; Ayotte, P.; Brisson, J.; Villeneuve, L.; Bélanger, A.; et al. Profiling of Endogenous Estrogens, Their Precursors, and Metabolites in Endometrial Cancer Patients: Association with Risk and Relationship to Clinical Characteristics. J. Clin. Endocrinol. Metab. 2011, 96, E330–E339. [Google Scholar] [CrossRef]
- Bhatia, P.; Bernier, M.; Sanghvi, M.; Moaddel, R.; Schwarting, R.; Ramamoorthy, A.; Wainer, I.W. Breast cancer resistance protein (BCRP/ABCG2) localises to the nucleus in glioblastoma multiforme cells. Xenobiotica 2012, 42, 748–755. [Google Scholar] [CrossRef]
- Liang, S.-C.; Yang, C.-Y.; Tseng, J.-Y.; Wang, H.-L.; Tung, C.-Y.; Liu, H.-W.; Chen, C.-Y.; Yeh, Y.-C.; Chou, T.-Y.; Yang, M.-H.; et al. ABCG2 Localizes to the Nucleus and Modulates CDH1 Expression in Lung Cancer Cells. Neoplasia 2015, 17, 265–278. [Google Scholar] [CrossRef]
- Ballatori, N. Pleiotropic functions of the organic solute transporter Ostα-Ostβ. Dig. Dis. 2011, 29, 7–13. [Google Scholar] [CrossRef] [PubMed]
- Seward, D.J.; Koh, A.S.; Boyer, J.L.; Ballatori, N.; Loris, R.; Marianovsky, I.; Lah, J.; Laeremans, T.; Engelberg-Kulka, H.; Glaser, G.; et al. Functional Complementation between a Novel Mammalian Polygenic Transport Complex and an Evolutionarily Ancient Organic Solute Transporter, OSTα-OSTβ. J. Biol. Chem. 2003, 278, 27473–27482. [Google Scholar] [CrossRef] [PubMed]
- Hu, X.; Han, T.; Bian, Y.; Tong, H.; Wen, X.; Li, Y.; Wan, X. Knockdown of SLCO4C1 inhibits cell proliferation and metastasis in endometrial cancer through inactivating the PI3K/Akt signaling pathway. Oncol. Rep. 2020, 43. [Google Scholar] [CrossRef] [PubMed]
- Cho, E.; Montgomery, R.B.; Mostaghel, E.A. Minireview: SLCO and ABC Transporters: A Role for Steroid Transport in Prostate Cancer Progression. Endocrinology 2014, 155, 4124–4132. [Google Scholar] [CrossRef]
- Kadioglu, O.; Saeed, M.E.M.; Munder, M.; Spuller, A.; Greten, H.J.; Efferth, T. Effect of ABC transporter expression and mutational status on survival rates of cancer patients. Biomed. Pharmacother. 2020, 131. [Google Scholar] [CrossRef] [PubMed]
- Rižner, T.L.; Adamski, J. It is high time to discontinue use of misidentified and contaminated cells: Guidelines for description and authentication of cell lines. J. Steroid Biochem. Mol. Biol. 2018, 182, 1–3. [Google Scholar] [CrossRef]
- Rižner, T.L.; Sasano, H.; Choi, M.H.; Odermatt, A.; Adamski, J. Recommendations for description and validation of antibodies for research use. J. Steroid Biochem. Mol. Biol. 2016, 156, 40–42. [Google Scholar] [CrossRef] [PubMed]
- Chapdelaine, P.; Kang, J.; Boucher-Kovalik, S.; Caron, N.; Tremblay, J.P.; Fortier, M.A. Decidualization and maintenance of a functional prostaglandin system in human endometrial cell lines following transformation with SV40 large T antigen. Mol. Hum. Reprod. 2006, 12, 309–319. [Google Scholar] [CrossRef]
- Sinreih, M.; Anko, M.; Zukunft, S.; Adamski, J.; Rižner, T.L. Important roles of the AKR1C2 and SRD5A1 enzymes in progesterone metabolism in endometrial cancer model cell lines. Chem. Interact. 2015, 234, 297–308. [Google Scholar] [CrossRef]
- Bustin, S.A.; Benes, V.; Garson, J.A.; Hellemans, J.; Huggett, J.; Kubista, M.; Mueller, R.; Nolan, T.; Pfaffl, M.W.; Shipley, G.L.; et al. The MIQE Guidelines: Minimum Information for Publication of Quantitative Real-Time PCR Experiments. Clin. Chem. 2009, 55, 611–622. [Google Scholar] [CrossRef] [PubMed]
- Schneider, C.A.; Rasband, W.S.; Eliceiri, K.W. NIH Image to ImageJ: 25 years of image analysis. Nat. Methods 2012, 9, 671–675. [Google Scholar] [CrossRef] [PubMed]
- Poschner, S.; Zehl, M.; Maier-Salamon, A.; Jäger, W. Simultaneous quantification of estrogens, their precursors and conjugated metabolites in human breast cancer cells by LC–HRMS without derivatization. J. Pharm. Biomed. Anal. 2017, 138, 344–350. [Google Scholar] [CrossRef] [PubMed]
- Patik, I.; Kovacsics, D.; Német, O.; Gera, M.; Várady, G.; Stieger, B.; Hagenbuch, B.; Szakács, G.; Özvegy-Laczka, C. Functional expression of the 11 human Organic Anion Transporting Polypeptides in insect cells reveals that sodium fluorescein is a general OATP substrate. Biochem. Pharmacol. 2015, 98, 649–658. [Google Scholar] [CrossRef]


| Genes | Proteins | KM (μM) * |
|---|---|---|
| ABC | ||
| ABCC1 | ABCC1/MRP1 | 0.7–4.2 |
| ABCC4 | ABCC4/MRP4 | nd |
| ABCC11 | ABCC11/MRP8 | nd |
| ABCG2 | ABCG2/BCRP | 6.8–16.6 |
| SLC21 = SLCO | ||
| SLCO1A2 | OATP1A2 | 7–59 |
| SLCO1B1 | OATP1B1 | 0.1–45 |
| SLCO1B3 | OATP1B3 | 5–58 |
| SLCO2B1 | OATP2B1 | 1.6–21 |
| SLCO1C1 | OATP1C1 | nd |
| SLCO3A1 | OATP3A1 | nd |
| SLCO4A1 | OATP4A1 | nd |
| SLCO4C1 | OATP4C1 | 27 |
| SLC22 | ||
| SLC22A6 | OAT1 | nd |
| SLC22A7 | OAT2 | nd |
| SLC22A8 | OAT3 | 2.2–21 |
| SLC22A11 | OAT4 | 1–22 |
| SLC22A9 | OAT7 | 8.7 |
| SLC10 | ||
| SLC10A6 | SOAT | nd |
| SLC51 | ||
| SLC51A | OSTα | 320 |
| SLC51B | OSTβ | 320 |
| Antigen, Type of Antibodies | Manufacturer, Catalogue ID, Batch ID, Name of the Source | Antigen Sequence | Species Raised, Monoclonal, Polyclonal, Antigen Purified | Positive and Negative Controls | Method Where Antibodies Were Used |
|---|---|---|---|---|---|
| anti-STS | Provided by Dr. Schuler [37,38]. | whole protein | rabbit, polyclonal | HepG2 (positive), MCF-7 (negative) | Western blot |
| anti-OSTβ rabbit, polyclonal | HPA008533, lot A105958; Sigma Aldrich, St. Louis, MO, USA | VLHLDEAKDHNSLNNLRETLLSEKPNLAQVELELKERDVLSVFLPDV | rabbit, polyclonal, affinity purified | colon (positive) liver (negative) | IHC |
| anti-ABCG2 | ab3380, lot GR308999-5, clone number BXP-21; Abcam, Cambridge, UK | 126 amino acids, 271–396 GeneBank accession #AF098951] | mouse monoclonal | colon (positive) liver (negative) [39] | IHC |
| anti-OATP1B3 | HPA004943, lot E104368; Sigma Aldrich, St. Louis, MO, USA | QGKDTKASDNERKVMDEANLEFLNNGEHFVPSAGTDSKTCNLDMQDNAAAG | rabbit, polyclonal, affinity purified | WB: HEPG2 (positive) MCF7 (negative) IHC: liver tissue (positive), cardiac muscle (negative) | IHC |
| Sample | Age | Menopausal Status | Histological Type/Grade | Limfovascular Invasion (LVI) | FIGO Stage | Depth of Miometrial Invasion | Gradus HG/LG | Gene Expression qPCR | Protein Levels IHC |
|---|---|---|---|---|---|---|---|---|---|
| 2 | 52 | NA | G1 * | yes | IA | <50% | L | no | yes § |
| 3 | 65 | postmenopausal | G1 * | no | IA | <50% | L | no | yes |
| 5 | 39 | premenopausal | dedifferentiated | yes | IB | >50% | H | yes | no |
| 6 | 76 | postmenopausal | serous | yes | IIIC | >50% | H | no | yes § |
| 7 | 50 | premenopausal | G1 * | no | IB | Not present | L | yes | yes § |
| 8 | 83 | postmenopausal | dedifferentiated | no | IB | >50% | H | yes | no |
| 9 | 41 | premenopausal | G1 * | no | IA | <50% | L | yes | yes |
| 10 | 53 | postmenopausal | G1 * | no | IA | not present | L | yes | yes |
| 11 | 60 | postmenopausal | G2 * | yes | IB | >50% | L | no | yes § |
| 13 | 64 | postmenopausal | G1 * | NA | IV | <50% | L | yes | yes § |
| 14 | 73 | postmenopausal | G1 * | no | IB | >50% | L | yes | yes § |
| 15 | 64 | postmenopausal | G2 * | yes | IB | >50% | L | no | yes § |
| 16 | 69 | postmenopausal | G1 * | no | IA | <50% | L | yes | yes § |
| 18 | 79 | postmenopausal | G1 * | no | IB | >50% | L | yes | yes § |
| 19 | 74 | postmenopausal | G1 * | no | IA | <50% | L | yes | yes |
| 20 | 76 | postmenopausal | G1 * | no | IA | <50% | L | yes | yes § |
| 21 | 53 | premenopausal | G2 * | no | IA | not present | L | yes | yes § |
| 22 | 36 | premenopausal | G1 * | no | IA | not present | L | no | yes § |
| 23 | 45 | premenopausal | G1 * | no | IA | not present | L | yes | yes § |
| 24 | 69 | postmenopausal | G2 * | yes | IB | >50% | L | yes | yes § |
| 25 | 54 | premenopausal | G3 * | no | IA | <50% | H | yes | yes |
| 26 | 72 | postmenopausal | G1 * | no | IA | <50% | L | yes | yes |
| 30 | 54 | premenopausal | G1 * | no | IA | not present | L | yes | yes § |
| 31 | 69 | postmenopausal | G3 * | yes | IB | >50% | H | no | yes § |
| 33 | 77 | postmenopausal | G3 * | no | IB | >50% | H | yes | yes § |
| 34 | 57 | postmenopausal | mucinous, G1 * | no | IA | <50% | L | yes | yes § |
| 35 | 61 | postmenopausal | G1 * | no | IA | not present | L | no | yes |
| 38 | 78 | postmenopausal | G2 * | yes | IA | <50% | L | no | yes |
| 39 | 63 | postmenopausal | G1 * | yes | IA | <50% | L | no | yes § |
| 40 | 71 | postmenopausal | serous | no | IA | <50% | H | yes | yes § |
| 44 | 73 | postmenopausal | serous | yes | IB | >50% | H | yes | yes § |
| 46 | 50 | premenopausal | G2 * | no | IIIA | <50% | L | no | yes |
| 47 | 27 | premenopausal | dedifferentiated | no | IA | <50% | H | yes | yes |
| 48 | 59 | postmenopausal | serous | yes | IB | >50% | H | no | yes § |
| 49 | 70 | postmenopausal | G1 * | no | IA | <50% | L | yes | yes |
| 50 | 73 | postmenopausal | G1 * | no | IA | <50% | L | yes | yes § |
| 51 | 75 | postmenopausal | G2 * | yes | IA | <50% | L | yes | yes § |
| 52 | 75 | postmenopausal | G2 * | yes | IA | <50% | L | yes | yes § |
| 53 | 50 | postmenopausal | G3 * | yes | IA | <50% | H | yes | yes § |
| 54 | 71 | postmenopausal | G1 * | no | IA | <50% | L | yes | yes |
| 55 | 75 | postmenopausal | serous | yes | IIIC | >50% | H | no | yes § |
| 56 | 55 | postmenopausal | G1 * | no | IA | not present | L | yes | yes |
| 57 | 43 | premenopausal | G1 * | no | IA | not present | L | yes | yes |
| 58 | 68 | postmenopausal | G2 * | no | IA | <50% | L | no | yes § |
| 60 | 55 | postmenopausal | G1 * | no | IA | not present | L | no | yes § |
| 61 | 83 | postmenopausal | G1 * | no | IA | not present | L | no | yes |
| 62 | 59 | postmenopausal | G1 * | no | IA | not present | L | yes | yes |
| 63 | 66 | postmenopausal | G1 * | no | IA | <50% | L | yes | yes |
| 64 | 66 | postmenopausal | G1 * | no | IA | <50% | L | no | yes |
| 65 | 80 | postmenopausal | carcinosarcoma | yes | IB | >50% | H | yes | yes § |
| 66 | 72 | postmenopausal | G1 * | no | IA | <50% | L | yes | yes § |
| 68 | 45 | premenopausal | G1 * | no | II | <50% | L | yes | yes § |
| 69 | 72 | postmenopausal | G1 * | no | IA | <50% | L | no | yes § |
| 70 | 55 | postmenopausal | G3 * | NA | IB | >50% | H | no | yes |
| 71 | 48 | premenopausal | serous | no | IA | <50% | H | yes | yes |
| Gene | Forward Primers | Reverse Primers |
|---|---|---|
| ABCC1 | 5′-GGACTCAGGAGCACACGAAA-3′ | 5′-ACGGCGATCCCTTGTGAAAT-3′ |
| ABCC4 | 5′-AACTGCAACTTTCACGGATG-3′ | 5′-AATGACTTTTCCCAGGCGTA-3′ |
| ABCG2 | 5′-GGGTTTGGAACTGTGGGTAG-3′ | 5′-AGATGATTCTGACGCACACC-3′ |
| SLC10A6 | 5′-TATGACAACCTGTTCCACCG-3′ | 5′-GAATGGTCAGGCACACAAGG-3′ |
| SLC22A11 | 5′-CTCACCTTCATCCTCCCCTG-3′ | 5′-CCATTGTCCAGCATGTGTGT-3′ |
| SLC51A | 5′-GCCCTTTCCAATACGCCTTC-3′ | 5′-TCTGCTGGGTCATAGATGCC-3′ |
| SLC51B | 5′-GTGCTGTCAGTTTTCCTTCCG-3′ | 5′-TCATGTGTCTGGCTTAGGATGG-3′ |
| SLCO1A2 | 5′-GTTGGCATCATTCTGTGCAAATGTT-3′ | 5′-AACGAGTGTCAGTGGGAGTTATGAT-3′ |
| SLCO1B3 | 5′-TCCAGTCATTGGCTTTGCAC-3′ | 5′-TCCAACCCAACGAGAGTCCT-3′ |
| SLCO1C1 | 5′-CACACAGACTACCAAACACCC-3′ | 5′-TCACCATGCCGAACAGAGAA-3′ |
| SLCO2B1 | 5′-AGAGCCCTGTGTTCCATTCT-3′ | 5′-CTCTTGCTCCAGAAATGGCC-3′ |
| SLCO3A1 | 5′-CTACGACAATGTGGTCTAC-3′ | 5′-TTTTGATGTAGCGTTTATAG-3′ |
| SLCO4C1 | 5′-CCAGGAGCCCCAGAAGTC-3′ | 5′-AACTCGGACAGCGACAGTG-3′ |
| SLCO4A1 | 5′-ATGCACCAGTTGAAGGACAG-3′ | 5′-AACAAGGTGGCAGCTTCTGAG-3′ |
| SLCO1B1 | 5′-CAAATTCTCATGTTTTACTG-3′ | 5′-GATTATTTCCATCATAGGTC-3′ |
Publisher’s Note: MDPI stays neutral with regard to jurisdictional claims in published maps and institutional affiliations. |
© 2021 by the authors. Licensee MDPI, Basel, Switzerland. This article is an open access article distributed under the terms and conditions of the Creative Commons Attribution (CC BY) license (https://creativecommons.org/licenses/by/4.0/).
Share and Cite
Pavlič, R.; Vidic, S.; Anko, M.; Knific, T.; Büdefeld, T.; Marton, K.; Sinreih, M.; Poschner, S.; Jäger, W.; Frković-Grazio, S.; et al. Altered Profile of E1-S Transporters in Endometrial Cancer: Lower Protein Levels of ABCG2 and OSTβ and Up-Regulation of SLCO1B3 Expression. Int. J. Mol. Sci. 2021, 22, 3819. https://doi.org/10.3390/ijms22083819
Pavlič R, Vidic S, Anko M, Knific T, Büdefeld T, Marton K, Sinreih M, Poschner S, Jäger W, Frković-Grazio S, et al. Altered Profile of E1-S Transporters in Endometrial Cancer: Lower Protein Levels of ABCG2 and OSTβ and Up-Regulation of SLCO1B3 Expression. International Journal of Molecular Sciences. 2021; 22(8):3819. https://doi.org/10.3390/ijms22083819
Chicago/Turabian StylePavlič, Renata, Suzana Vidic, Maja Anko, Tamara Knific, Tomaž Büdefeld, Kristina Marton, Maša Sinreih, Stefan Poschner, Walter Jäger, Snježana Frković-Grazio, and et al. 2021. "Altered Profile of E1-S Transporters in Endometrial Cancer: Lower Protein Levels of ABCG2 and OSTβ and Up-Regulation of SLCO1B3 Expression" International Journal of Molecular Sciences 22, no. 8: 3819. https://doi.org/10.3390/ijms22083819
APA StylePavlič, R., Vidic, S., Anko, M., Knific, T., Büdefeld, T., Marton, K., Sinreih, M., Poschner, S., Jäger, W., Frković-Grazio, S., & Rižner, T. L. (2021). Altered Profile of E1-S Transporters in Endometrial Cancer: Lower Protein Levels of ABCG2 and OSTβ and Up-Regulation of SLCO1B3 Expression. International Journal of Molecular Sciences, 22(8), 3819. https://doi.org/10.3390/ijms22083819