
Identification of Candidate Genes for Root Traits Using Genotype–Phenotype Association Analysis of Near-Isogenic Lines in Hexaploid Wheat (Triticum aestivum L.)

 ,
,  ,
,  , and
, and 
Abstract
1. Introduction
2. Results
2.1. Phenotypic Variation and Correlation of Root Traits
2.2. SNPs and Candidate Genes
3. Discussion
3.1. NIL Pairs Show Different Phenotypic Performances
3.2. Targeted Genomic Regions of NILs Overlap Previously Reported QTL for Root Traits and Other Yield-Related Traits
3.3. Putative Candidate Genes Controlling Wheat Root Traits
4. Materials and Methods
4.1. Plant Material
4.2. Phenotyping for Root Traits
4.3. Trait Measurements
4.4. Statistics
4.5. 90K SNP Genotyping and Candidate Gene Identification
Supplementary Materials
Author Contributions
Funding
Institutional Review Board Statement
Informed Consent Statement
Data Availability Statement
Acknowledgments
Conflicts of Interest
Abbreviations
| GR | genomic region |
| RL | total root length |
| RD | rooting depth |
| RM | root dry mass |
| RSR | root/shoot ratio |
| RSA1 | root surface area (>0.25 mm diameter class) |
| RSA2 | root surface area (<0.25 mm diameter class) |
| RDia | root diameter |
| RDCL1 | root diameter class length (<0.25 mm) |
| RDCL2 | root diameter class length (>0.25 mm) |
| SRL | specific root length |
| NNR | nodal root number per plant |
| SH | shoot height |
| NLP | leaf number per plant |
| HIF | heterogeneous inbred family |
| SSD | single seed descent |
| Mb | mega base pairs |
| Kb | kilo base pairs |
References
- Voss-Fels, K.P.; Qian, L.; Parra-Londono, S.; Uptmoor, R.; Frisch, M.; Keeble-Gagnère, G.; Appels, R.; Snowdon, R.J. Linkage drag constrains the roots of modern wheat. Plant Cell Environ. 2017, 40, 717–725. [Google Scholar] [CrossRef] [PubMed]
- Manschadi, A.M.; Christopher, J.; de Voil, P.; Hammer, G.L. The role of root architectural traits in adaptation of wheat to water-limited environments. Funct. Plant Biol. 2006, 33, 823–837. [Google Scholar] [CrossRef]
- Wang, Y.; Thorup-Kristensen, K.; Jensen, L.S.; Magid, J. Vigorous root growth is a better indicator of early nutrient uptake than root hair traits in spring wheat grown under low fertility. Front. Plant Sci. 2016, 7, 865. [Google Scholar] [CrossRef] [PubMed]
- Mammadov, J.; Aggarwal, R.; Buyyarapu, R.; Kumpatla, S. SNP markers and their impact on plant breeding. Int. J. Plant Genom. 2012, 2012, 728398. [Google Scholar] [CrossRef] [PubMed]
- Rimbert, H.; Darrier, B.; Navarro, J.; Kitt, J.; Choulet, F.; Leveugle, M.; Duarte, J.; Riviere, N.; Eversole, K.; International Wheat Genome Sequencing, C.; et al. High throughput SNP discovery and genotyping in hexaploid wheat. PLoS ONE 2018, 13, e0186329. [Google Scholar] [CrossRef]
- Wang, S.; Wong, D.; Forrest, K.; Allen, A.; Chao, S.; Huang, B.E.; Maccaferri, M.; Salvi, S.; Milner, S.G.; Cattivelli, L.; et al. Characterization of polyploid wheat genomic diversity using a high-density 90,000 single nucleotide polymorphism array. Plant Biotechnol. J. 2014, 12, 787–796. [Google Scholar] [CrossRef]
- Li, F.; Wen, W.; Liu, J.; Zhang, Y.; Cao, S.; He, Z.; Rasheed, A.; Jin, H.; Zhang, C.; Yan, J. Genetic architecture of grain yield in bread wheat based on genome-wide association studies. BMC Plant Biol. 2019, 19, 168. [Google Scholar] [CrossRef]
- Liu, J.; Xu, Z.; Fan, X.; Zhou, Q.; Cao, J.; Wang, F.; Ji, G.; Yang, L.; Feng, B.; Wang, T. A genome-wide association study of wheat spike related traits in China. Front. Plant Sci. 2018, 9, 1584. [Google Scholar] [CrossRef]
- Rufo, R.; Salvi, S.; Royo, C.; Soriano, J.M. Exploring the genetic architecture of root-related traits in mediterranean bread wheat landraces by genome-wide association analysis. Agronomy 2020, 10, 613. [Google Scholar] [CrossRef]
- Liu, P.; Jin, Y.; Liu, J.; Liu, C.; Yao, H.; Luo, F.; Guo, Z.; Xia, X.; He, Z. Genome-wide association mapping of root system architecture traits in common wheat (Triticum aestivum L.). Euphytica 2019, 215, 121. [Google Scholar] [CrossRef]
- Wei, K.; Li, Y. Functional genomics of the protein kinase superfamily from wheat. Mol. Breed. 2019, 39, 141. [Google Scholar] [CrossRef]
- Voss-Fels, K.P.; Robinson, H.; Mudge, S.R.; Richard, C.; Newman, S.; Wittkop, B.; Stahl, A.; Friedt, W.; Frisch, M.; Gabur, I. VERNALIZATION1 modulates root system architecture in wheat and barley. Mol. Plant 2018, 11, 226–229. [Google Scholar] [CrossRef] [PubMed]
- Beyer, S.; Daba, S.; Tyagi, P.; Bockelman, H.; Brown-Guedira, G.; Mohammadi, M. Loci and candidate genes controlling root traits in wheat seedlings-a wheat root GWAS. Funct. Integr. Genom. 2019, 19, 91–107. [Google Scholar] [CrossRef] [PubMed]
- Sasaki, T.; Ryan, P.R.; Delhaize, E.; Hebb, D.M.; Ogihara, Y.; Kawaura, K.; Noda, K.; Kojima, T.; Toyoda, A.; Matsumoto, H. Sequence upstream of the wheat (Triticum aestivum L.) ALMT1 gene and its relationship to aluminum resistance. Plant Cell Physiol. 2006, 47, 1343–1354. [Google Scholar] [CrossRef]
- Appels, R.; Eversole, K.; Stein, N.; Feuillet, C.; Keller, B.; Rogers, J.; Pozniak, C.J.; Choulet, F.; Distelfeld, A.; Poland, J.; et al. Shifting the limits in wheat research and breeding using a fully annotated reference genome. Science 2018, 361, 7191. [Google Scholar]
- Chen, Y.; Palta, J.; Prasad, P.V.V.; Siddique, K.H.M. Phenotypic variability in bread wheat root systems at the early vegetative stage. BMC Plant Biol. 2020, 20, 185. [Google Scholar] [CrossRef]
- Mia, M.S.; Liu, H.; Wang, X.; Yan, G. Multiple near-isogenic lines targeting a QTL hotspot of drought tolerance showed contrasting performance under post-anthesis water stress. Front. Plant Sci. 2019, 10, 271. [Google Scholar] [CrossRef]
- Pinto, R.S.; Reynolds, M.P.; Mathews, K.L.; McIntyre, C.L.; Olivares-Villegas, J.J.; Chapman, S.C. Heat and drought adaptive QTL in a wheat population designed to minimize confounding agronomic effects. Theor. Appl. Genet. 2010, 121, 1001–1021. [Google Scholar] [CrossRef] [PubMed]
- Wang, X.; Liu, H.; Liu, G.; Mia, M.S.; Siddique, K.H.M.; Yan, G. Phenotypic and genotypic characterization of near-isogenic lines targeting a major 4BL QTL responsible for pre-harvest sprouting in wheat. BMC Plant Biol. 2019, 19, 348. [Google Scholar] [CrossRef] [PubMed]
- Lu, L.; Liu, H.; Wu, Y.; Yan, G. Development and characterization of near-isogenic lines revealing candidate genes for a major 7AL QTL responsible for heat tolerance in wheat. Front. Plant Sci. 2020, 11, 1316. [Google Scholar] [CrossRef]
- Kadam, S.; Singh, K.; Shukla, S.; Goel, S.; Vikram, P.; Pawar, V.; Gaikwad, K.; Khanna-Chopra, R.; Singh, N. Genomic associations for drought tolerance on the short arm of wheat chromosome 4B. Funct. Integr. Genom. 2012, 12, 447–464. [Google Scholar] [CrossRef]
- Mori, M.; Uchino, N.; Chono, M.; Kato, K.; Miura, H. Mapping QTLs for grain dormancy on wheat chromosome 3A and the group 4 chromosomes, and their combined effect. Theor. Appl. Genet. 2005, 110, 1315–1323. [Google Scholar] [CrossRef] [PubMed]
- Talukder, S.K.; Babar, M.A.; Vijayalakshmi, K.; Poland, J.; Prasad, P.V.V.; Bowden, R.; Fritz, A. Mapping QTL for the traits associated with heat tolerance in wheat (Triticum aestivum L.). BMC Genet. 2014, 15, 97. [Google Scholar] [CrossRef] [PubMed]
- Kozak, M.; Krzanowski, W.; Tartanus, M. Use of the correlation coefficient in agricultural sciences: Problems, pitfalls and how to deal with them. An. Acad. Bras. Ciências 2012, 84, 1147–1156. [Google Scholar] [CrossRef]
- Xu, L.; Liu, H.; Kilian, A.; Bhoite, R.; Liu, G.; Si, P.; Wang, J.; Zhou, W.; Yan, G. QTL mapping using a high-density genetic map to identify candidate genes associated with metribuzin tolerance in hexaploid wheat (Triticum aestivum L.). Front. Plant Sci. 2020, 11, 1440. [Google Scholar] [CrossRef] [PubMed]
- Ren, Y.; Qian, Y.; Xu, Y.; Zou, C.; Liu, D.; Zhao, X.; Zhang, A.; Tong, Y. Characterization of QTLs for root traits of wheat grown under different nitrogen and phosphorus supply levels. Front. Plant Sci. 2017, 8, 2096. [Google Scholar] [CrossRef]
- Soriano, J.M.; Alvaro, F. Discovering consensus genomic regions in wheat for root-related traits by QTL meta-analysis. Sci. Rep. 2019, 9, 10537. [Google Scholar] [CrossRef]
- Li, T.; Ma, J.; Zou, Y.; Chen, G.; Ding, P.; Zhang, H.; Yang, C.; Mu, Y.; Tang, H.; Liu, Y. Quantitative trait loci for seedling root traits and the relationships between root and agronomic traits in common wheat. Genome 2020, 63, 27–36. [Google Scholar] [CrossRef]
- Guan, P.; Lu, L.; Jia, L.; Kabir, M.R.; Zhang, J.; Lan, T.; Zhao, Y.; Xin, M.; Hu, Z.; Yao, Y. Global QTL analysis identifies genomic regions on chromosomes 4A and 4B harboring stable loci for yield-related traits across different environments in wheat (Triticum aestivum L.). Front. Plant Sci. 2018, 9, 52. [Google Scholar] [CrossRef]
- Zhang, Y.; Liu, H.; Yan, G. Characterization of near-isogenic lines confirmed QTL and revealed candidate genes for plant height and yield-related traits in common wheat. Mol. Breed. 2021, 41, 1–17. [Google Scholar] [CrossRef]
- Gao, F.; Wen, W.; Liu, J.; Rasheed, A.; Yin, G.; Xia, X.; Wu, X.; He, Z. Genome-wide linkage mapping of QTL for yield components, plant height and yield-related physiological traits in the chinese wheat cross Zhou 8425B/Chinese Spring. Front. Plant Sci. 2015, 6, 1099. [Google Scholar] [CrossRef]
- Liu, G.; Jia, L.; Lu, L.; Qin, D.; Zhang, J.; Guan, P.; Ni, Z.; Yao, Y.; Sun, Q.; Peng, H. Mapping QTLs of yield-related traits using RIL population derived from common wheat and Tibetan semi-wild wheat. Theor. Appl. Genet. 2014, 127, 2415–2432. [Google Scholar] [CrossRef] [PubMed]
- Badakhshan, H.; Mohammadi, S.; Zad, S.A.; Moghaddam, M.; Kamali, M.J.; Khodarahmi, M. Quantitative trait loci in bread wheat (Triticum aestivum L.) associated with resistance to stripe rust. Biotechnol. Biotechnol. Equip. 2008, 22, 901–906. [Google Scholar] [CrossRef]
- Yang, M.; Wang, C.-R.; Hassan, M.; Wu, Y.-Y.; Xia, X.; Shi, S.-B.; Xiao, Y.; Zhonghu, H. QTL mapping of seedling biomass and root traits under different nitrogen conditions in bread wheat (Triticum aestivum L.). J. Integr. Agric. 2020, 19, 2–14. [Google Scholar] [CrossRef]
- Zheng, X.; Liu, C.; Qiao, L.; Zhao, J.; Han, R.; Wang, X.; Ge, C.; Zhang, W.; Zhang, S.; Qiao, L.; et al. The MYB transcription factor TaPHR3-A1 is involved in phosphate signaling and governs yield-related traits in bread wheat. J. Exp. Bot. 2020, 71, 5808–5822. [Google Scholar] [CrossRef]
- Maccaferri, M.; Sanguineti, M.C.; Corneti, S.; Ortega, J.L.; Salem, M.B.; Bort, J.; DeAmbrogio, E.; del Moral, L.F.; Demontis, A.; El-Ahmed, A.; et al. Quantitative trait loci for grain yield and adaptation of durum wheat (Triticum durum Desf.) across a wide range of water availability. Genetics 2008, 178, 489–511. [Google Scholar] [CrossRef]
- Li, Y.; Li, P.; Wang, Y.; Dong, R.; Yu, H.; Hou, B. Genome-wide identification and phylogenetic analysis of Family-1 UDP glycosyltransferases in maize (Zea mays). Planta 2014, 239, 1265–1279. [Google Scholar] [CrossRef]
- Wang, J.; Ma, X.-M.; Kojima, M.; Sakakibara, H.; Hou, B.-K. N-glucosyltransferase UGT76C2 is involved in cytokinin homeostasis and cytokinin response in Arabidopsis thaliana. Plant Cell Physiol. 2011, 52, 2200–2213. [Google Scholar] [CrossRef]
- Liu, Q.; Chen, T.-T.; Xiao, D.-W.; Zhao, S.-M.; Lin, J.-S.; Wang, T.; Li, Y.-J.; Hou, B.-K. OsIAGT1 is a glucosyltransferase gene involved in the glucose conjugation of auxins in rice. Rice 2019, 12, 1–13. [Google Scholar] [CrossRef]
- Sharma, S.; Kumar, R.; Mendu, V.; Singh, K.; Upadhyay, S.K. Genomic dissection and expression profiling revealed functional divergence in Triticum aestivum leucine rich repeat receptor like kinases (TaLRRKs). Front. Plant Sci. 2016, 7, 1374. [Google Scholar] [CrossRef]
- Bettembourg, M.; Dal-Soglio, M.; Bureau, C.; Vernet, A.; Dardoux, A.; Portefaix, M.; Bes, M.; Meynard, D.; Mieulet, D.; Cayrol, B. Root cone angle is enlarged in docs1 LRR-RLK mutants in rice. Rice 2017, 10, 1–8. [Google Scholar] [CrossRef]
- Wu, W.; Wu, Y.; Gao, Y.; Li, M.; Yin, H.; Lv, M.; Zhao, J.; Li, J.; He, K. Somatic embryogenesis receptor-like kinase 5 in the ecotype Landsberg erecta of Arabidopsis is a functional RD LRR-RLK in regulating brassinosteroid signaling and cell death control. Front. Plant Sci. 2015, 6, 852. [Google Scholar] [CrossRef]
- Lee, Y.; Bak, G.; Choi, Y.; Chuang, W.-I.; Cho, H.-T.; Lee, Y. Roles of phosphatidylinositol 3-kinase in root hair growth. Plant Physiol. 2008, 147, 624–635. [Google Scholar] [CrossRef]
- Heucken, N.; Ivanov, R. The retromer, sorting nexins and the plant endomembrane protein trafficking. J. Cell Sci. 2018, 131, 1–9. [Google Scholar] [CrossRef]
- Wang, R.; Zhao, P.; Kong, N.; Lu, R.; Pei, Y.; Huang, C.; Ma, H.; Chen, Q. Genome-wide identification and characterization of the potato bHLH transcription factor family. Genes 2018, 9, 54. [Google Scholar] [CrossRef]
- Strygina, K.V.; Khlestkina, E.K. Structural and functional divergence of the Mpc1 genes in wheat and barley. BMC Evol. Biol. 2019, 19, 45. [Google Scholar] [CrossRef]
- Goossens, J.; Mertens, J.; Goossens, A. Role and functioning of bHLH transcription factors in jasmonate signalling. J. Exp. Bot. 2017, 68, 1333–1347. [Google Scholar] [CrossRef] [PubMed]
- Fernández-Calvo, P.; Chini, A.; Fernández-Barbero, G.; Chico, J.-M.; Gimenez-Ibanez, S.; Geerinck, J.; Eeckhout, D.; Schweizer, F.; Godoy, M.; Franco-Zorrilla, J.M. The Arabidopsis bHLH transcription factors MYC3 and MYC4 are targets of JAZ repressors and act additively with MYC2 in the activation of jasmonate responses. Plant Cell 2011, 23, 701–715. [Google Scholar] [CrossRef] [PubMed]
- Strygina, K.V.; Khlestkina, E.K. Myc-like transcriptional factors in wheat: Structural and functional organization of the subfamily I members. BMC Plant Biol. 2019, 19, 59–69. [Google Scholar] [CrossRef] [PubMed]
- Yu, Y.; Ni, Z.; Chen, Q.; Qu, Y. The wheat salinity-induced R2R3-MYB transcription factor TaSIM confers salt stress tolerance in Arabidopsis thaliana. Biochem. Biophys. Res. Commun. 2017, 491, 642–648. [Google Scholar] [CrossRef]
- Wang, N.; Zhang, W.; Qin, M.; Li, S.; Qiao, M.; Liu, Z.; Xiang, F. Drought tolerance conferred in soybean (Glycine max. L) by GmMYB84, a novel R2R3-MYB transcription factor. Plant Cell Physiol. 2017, 58, 1764–1776. [Google Scholar] [CrossRef]
- Dai, X.; Wang, Y.; Yang, A.; Zhang, W.-H. OsMYB2P-1, an R2R3 MYB transcription factor, is involved in the regulation of phosphate-starvation responses and root architecture in rice. Plant Physiol. 2012, 159, 169–183. [Google Scholar] [CrossRef] [PubMed]
- Pesch, M.; Schultheiß, I.; Digiuni, S.; Uhrig, J.F.; Hülskamp, M. Mutual control of intracellular localisation of the patterning proteins AtMYC1, GL1 and TRY/CPC in Arabidopsis. Development 2013, 140, 3456–3467. [Google Scholar] [CrossRef] [PubMed][Green Version]
- Dossa, K.; Mmadi, M.A.; Zhou, R.; Liu, A.; Yang, Y.; Diouf, D.; You, J.; Zhang, X. Ectopic expression of the sesame MYB transcription factor SiMYB305 promotes root growth and modulates ABA-mediated tolerance to drought and salt stresses in Arabidopsis. AoB Plants 2020, 12, plz081. [Google Scholar] [CrossRef] [PubMed]
- Mei, Y.; Jia, W.-J.; Chu, Y.-J.; Xue, H.-W. Arabidopsis phosphatidylinositol monophosphate 5-kinase 2 is involved in root gravitropism through regulation of polar auxin transport by affecting the cycling of PIN proteins. Cell Res. 2012, 22, 581–597. [Google Scholar] [CrossRef]
- An, J.; Li, Q.; Yang, J.; Zhang, G.; Zhao, Z.; Wu, Y.; Wang, Y.; Wang, W. Wheat F-box protein TaFBA1 positively regulates plant drought tolerance but negatively regulates stomatal closure. Front. Plant Sci. 2019, 10, 1242. [Google Scholar] [CrossRef]
- Zhou, S.; Sun, X.; Yin, S.; Kong, X.; Zhou, S.; Xu, Y.; Luo, Y.; Wang, W. The role of the F-box gene TaFBA1 from wheat (Triticum aestivum L.) in drought tolerance. Plant Physiol. Biochem. 2014, 84, 213–223. [Google Scholar] [CrossRef] [PubMed]
- Zhou, S.M.; Kong, X.Z.; Kang, H.H.; Sun, X.D.; Wang, W. The involvement of wheat F-box protein gene TaFBA1 in the oxidative stress tolerance of plants. PLoS ONE 2015, 10, e0122117. [Google Scholar] [CrossRef]
- Li, Q.; Wang, W.; Wang, W.; Zhang, G.; Liu, Y.; Wang, Y.; Wang, W. Wheat F-box protein gene TaFBA1 is involved in plant tolerance to heat stress. Front. Plant Sci. 2018, 9, 521. [Google Scholar] [CrossRef]
- Rao, V.; Vijaybhaskar, V. F-box protein At1g08710 negatively regulates root length and imparts drought stress tolerance in Arabidopsis thaliana. bioRxiv 2020. [Google Scholar] [CrossRef]
- Yu, Y.; Wang, P.; Bai, Y.; Wang, Y.; Wan, H.; Liu, C.; Ni, Z. The soybean F-box protein GmFBX176 regulates ABA-mediated responses to drought and salt stress. Environ. Exp. Bot. 2020, 176, 104056. [Google Scholar] [CrossRef]
- Yan, Y.-S.; Chen, X.-Y.; Yang, K.; Sun, Z.-X.; Fu, Y.-P.; Zhang, Y.-M.; Fang, R.-X. Overexpression of an F-box protein gene reduces abiotic stress tolerance and promotes root growth in rice. Mol. Plant 2011, 4, 190–197. [Google Scholar] [CrossRef]
- D’Alessandro, S.; Golin, S.; Zanin, S.; Cendron, L.; Zottini, M.; Ruzzene, M. Phosphorylation of p23-1 cochaperone by protein kinase CK2 affects root development in Arabidopsis. Sci. Rep. 2019, 9, 1–10. [Google Scholar] [CrossRef]
- Gamuyao, R.; Chin, J.H.; Pariasca-Tanaka, J.; Pesaresi, P.; Catausan, S.; Dalid, C.; Slamet-Loedin, I.; Tecson-Mendoza, E.M.; Wissuwa, M.; Heuer, S. The protein kinase Pstol1 from traditional rice confers tolerance of phosphorus deficiency. Nature 2012, 488, 535–539. [Google Scholar] [CrossRef] [PubMed]
- Xiong, L.; Yang, Y. Disease resistance and abiotic stress tolerance in rice are inversely modulated by an abscisic acid–inducible mitogen-activated protein kinase. Plant Cell 2003, 15, 745–759. [Google Scholar] [CrossRef]
- Wang, W.-S.; Zhu, J.; Zhang, K.-X.; Lü, Y.-T.; Xu, H.-H. A mutation of casein kinase 2 α4 subunit affects multiple developmental processes in Arabidopsis. Plant Cell Rep. 2016, 35, 1071–1080. [Google Scholar] [CrossRef]
- Wang, Y.; Suo, H.; Zheng, Y.; Liu, K.; Zhuang, C.; Kahle, K.T.; Ma, H.; Yan, X. The soybean root-specific protein kinase GmWNK1 regulates stress-responsive ABA signaling on the root system architecture. Plant J. 2010, 64, 230–242. [Google Scholar] [CrossRef]
- Du, H.; Wu, N.; Fu, J.; Wang, S.; Li, X.; Xiao, J.; Xiong, L. A GH3 family member, OsGH3-2, modulates auxin and abscisic acid levels and differentially affects drought and cold tolerance in rice. J. Exp. Bot. 2012, 63, 6467–6480. [Google Scholar] [CrossRef] [PubMed]
- Fu, J.; Yu, H.; Li, X.; Xiao, J.; Wang, S. Rice GH3 gene family: Regulators of growth and development. Plant Signal. Behav. 2011, 6, 570–574. [Google Scholar] [CrossRef] [PubMed]
- Manzano, C.; Ramirez-Parra, E.; Casimiro, I.; Otero, S.; Desvoyes, B.; De Rybel, B.; Beeckman, T.; Casero, P.; Gutierrez, C.; del Pozo, J.C. Auxin and epigenetic regulation of SKP2B, an F-box that represses lateral root formation. Plant Physiol. 2012, 160, 749–762. [Google Scholar] [CrossRef] [PubMed]
- Wang, T.; Li, C.; Wu, Z.; Jia, Y.; Wang, H.; Sun, S.; Mao, C.; Wang, X. Abscisic acid regulates auxin homeostasis in rice root tips to promote root hair elongation. Front. Plant Sci. 2017, 8, 1121. [Google Scholar] [CrossRef] [PubMed]
- Wang, Y.; Suo, H.; Zhuang, C.; Ma, H.; Yan, X. Overexpression of the soybean GmWNK1 altered the sensitivity to salt and osmotic stress in Arabidopsis. J. Plant Physiol. 2011, 168, 2260–2267. [Google Scholar] [CrossRef]
- Mao, X.; Zhang, H.; Tian, S.; Chang, X.; Jing, R. TaSnRK2.4, an SNF1-type serine/threonine protein kinase of wheat (Triticum aestivum L.), confers enhanced multistress tolerance in Arabidopsis. J. Exp. Bot. 2010, 61, 683–696. [Google Scholar] [CrossRef]
- Deng, X.; Hu, W.; Wei, S.; Zhou, S.; Zhang, F.; Han, J.; Chen, L.; Li, Y.; Feng, J.; Fang, B. TaCIPK29, a CBL-interacting protein kinase gene from wheat, confers salt stress tolerance in transgenic tobacco. PLoS ONE 2013, 8, e69881. [Google Scholar] [CrossRef]
- Hao, L.; Wen, Y.; Zhao, Y.; Lu, W.; Xiao, K. Wheat mitogen-activated protein kinase gene TaMPK4 improves plant tolerance to multiple stresses through modifying root growth, ROS metabolism, and nutrient acquisitions. Plant Cell Rep. 2015, 34, 2081–2097. [Google Scholar] [CrossRef] [PubMed]
- Chen, Y.L.; Dunbabin, V.M.; Diggle, A.J.; Siddique, K.H.M.; Rengel, Z. Development of a novel semi-hydroponic phenotyping system for studying root architecture. Funct. Plant Biol. 2011, 38, 355–363. [Google Scholar] [CrossRef]
- Zadoks, J.C.; Chang, T.T.; Konzak, C.F. A decimal code for the growth stages of cereals. Weed Res. 1974, 14, 415–421. [Google Scholar] [CrossRef]
- Chen, Y.; Zhou, T.; Siddique, K.H. Method for Characterization of Root Traits in Chickpea Germplasm for Legume Genomics and Breeding. In Legume Genomics. Methods in Molecular Biology; Springer Humana: New York, NY, USA, 2020; Volume 2107, pp. 269–275. [Google Scholar] [CrossRef]
- Makhoul, M.; Rambla, C.; Voss-Fels, K.; Hickey, L.; Snowdon, R.; Obermeier, C. Overcoming polyploidy pitfalls: A user guide for effective SNP conversion into KASP markers in wheat. Theor. Appl. Genet. 2020, 133, 2413–2430. [Google Scholar] [CrossRef]
- Brodie, A.; Azaria, J.R.; Ofran, Y. How far from the SNP may the causative genes be? Nucleic Acids Res. 2016, 44, 6046–6054. [Google Scholar] [CrossRef] [PubMed]


| Pair No. | NIL Names | Original NIL Name | Parents # | Targeted Traits to Develop NIL | Targeted QTL Name | Chromosomes | Marker Intervals of Target QTL † | Physical Positions (Mb) of Target QTL | References |
|---|---|---|---|---|---|---|---|---|---|
| 1 | NIL1a | qDSI.4B.1-1 | Dharwar Dry × C306 | Drought tolerance | qDSI.4B.1 | 4BS | gwm368-barc20 | 59.61–75.74 | [17,21] |
| NIL1b | qDSI.4B.1-1 | ||||||||
| 2 | NIL2a | qDSI.4B.1-2 | |||||||
| NIL2b | qDSI.4B.1-2 | ||||||||
| 3 | NIL3a | qDSI.4B.1-3 | |||||||
| NIL3b | qDSI.4B.1-3 | ||||||||
| 4 | NIL4a | qDSI.4B.1-4 | |||||||
| NIL4b | qDSI.4B.1-4 | ||||||||
| 5 | NIL5a | BD NIL-1 | Babax × Dharwar Dry | Drought tolerance | qDT.4A.1 | 4AS | Xgwm397-Xwmc491 | 0.14–94.02 | [18] |
| NIL5b | BD NIL-1 | ||||||||
| 6 | NIL6a | BD NIL-3 | |||||||
| NIL6b | BD NIL-3 | ||||||||
| 7 | NIL7a | BD NIL-4 | |||||||
| NIL7b | BD NIL-4 | ||||||||
| 8 | NIL8a | NIL-PHSR4BL-6R | Chara × DN5637B*8 | Preharvest sprouting resistance | QPhs.ocs-4B.1 | 4BL | Xgwm495-Xgwm375 | 482.82–568.56 | [19,22] |
| NIL8b | NIL-PHSR4BL-6S | ||||||||
| 9 | NIL9a | NIL 9 (+) | Cascades × W156 | Heat tolerance | QHtscc.ksu-7A | 7AL | Xbarc49-Xbarc121 | 155.05–611.84 | [20,23] |
| NIL9b | NIL 9 (−) | ||||||||
| 10 | NIL10a | NIL 10 (+) | |||||||
| NIL10b | NIL 10 (-) |
| NIL Pairs | Root Traits | Shoot Traits | |||||||||||
|---|---|---|---|---|---|---|---|---|---|---|---|---|---|
| RL (cm) | RM (g) | RD (cm) | RSR | RSA1 (cm2) | RSA2 (cm2) | Rdia (mm) | RDCL1 (mm) | RDCL2 (mm) | SRL (cm g−1) | NNR | SH (cm) | NLP | |
| 1 | 1890.00 ± 248.70 | 0.15 ± 0.02 | 54.00 ± 16.84 | 0.46 ± 0.05 | 51.87 ± 10.79 | 12.35 ± 1.80 | 0.40 ± 0.05 | 306.13 ± 51.31 | 337.25 ± 61.04 | 12,653.00 ± 1379.00 | 5.00 ± 1.52 | 34.73 ± 3.42 | 7.00 ± 0.27 * |
| 2571.00 ± 889.51 | 0.20 ± 0.05 | 75.43 ± 16.44 | 0.44 ± 0.02 | 37.81 ± 2.77 | 12.73 ± 3.95 | 0.48 ± 0.08 | 294.94 ± 88.37 | 240.67 ± 31.44 | 11,506.00 ± 1701.00 | 4.00 ± 0.72 | 34.97 ± 4.89 | 9.00 ± 0.27 | |
| 2 | 3407.00 ± 948.04 | 0.29 ± 0.08 | 86.57 ± 15.80 | 0.371 ± 0.04 | 31.60 ± 4.68 | 17.41 ± 2.44 | 0.34 ± 0.01 | 436.00 ± 56.58 | 213.79 ± 34.34 | 11,757.00 ± 163.44 | 6.00 ± 1.44 | 34.63 ± 2.07 | 12.00 ± 1.63 |
| 6505.00 ± 657.71 | 0.41 ± 0.05 | 110.90 ± 15.80 | 0.43 ± 0.01 | 47.40 ± 11.32 | 23.69 ± 1.73 | 0.36 ± 0.02 | 607.75 ± 29.76 * | 299.24 ± 67.96 | 15,954.00 ± 727.89 * | 7.00 ± 0.54 | 44.63 ± 1.74 * | 12.00 ± 1.25 | |
| 3 | 3392.00 ± 924.69 | 0.23 ± 0.05 | 82.5 ± 14.99 | 0.46 ± 0.05 * | 49.64 ± 2.30 | 17.82 ± 2.33 | 0.37 ± 0.01 | 421.35 ± 59.61 | 324.45 ± 5.20 | 14,082.00 ± 937.50 | 5.00 ± 0.47 | 28.47 ± 3.61 | 8.00 ± 1.19 |
| 2770.00 ± 45.03 | 0.14 ± 0.04 | 66.13 ± 14.93 | 0.20 ± 0.04 | 58.70 ± 10.17 | 13.62 ± 2.87 | 0.39 ± 0.03 | 324.24 ± 70.50 | 372.32 ± 53.80 | 25,085.00 ± 7532.00 | 5.00 ± 0.98 | 39.20 ± 3.84 | 8.00 ± 0.54 | |
| 4 | 6668.00 ± 987.52 | 0.39 ± 0.04 | 106.87 ± 15.82 | 0.41 ± 0.01 | 68.35 ± 6.71 * | 32.48 ± 3.36 * | 0.35 ± 0.01 | 688.57 ± 40.15 * | 473.52 ± 43.44 * | 16,860.00 ± 1175.00 | 6.00 ± 0.47 | 50.27 ± 1.55 | 10.00 ± 0.72 |
| 4639.00 ± 188.52 | 0.29 ± 0.01 | 92.87.13 ± 14.59 | 0.39 ± 0.02 | 46.21 ± 5.18 | 20.89 ± 1.12 | 0.33 ± 0.01 | 503.65 ± 33.73 | 316.00 ± 41.25 | 16,336.00 ± 1229.00 | 5.00 ± 0.27 | 51.40 ± 1.16 | 9.00 ± 0.72 | |
| 5 | 3516.00 ± 432.68 | 0.24 ± 0.05 | 51.37 ± 14.85 | 0.40 ± 0.01 * | 84.19 ± 12.02 | 26.23 ± 3.66 | 0.40 ± 0.01 | 626.27 ± 93.21 | 680.17 ± 154.77 | 15,753.00 ± 1840.00 | 4.00 ± 0.72 | 36.50 ± 1.78 | 12.00 ± 0.27 |
| 2283.00 ± 321.92 | 0.12 ± 0.02 | 50.03 ± 15.29 | 0.32 ± 0.01 | 65.67 ± 10.37 | 18.83 ± 3.52 | 0.38 ± 0.03 | 414.93 ± 88.54 | 460.85 ± 72.67 | 19,807.00 ± 1074.00 | 3.00 ± 0.27 | 36.53 ± 2.69 | 10.00 ± 1.19 | |
| 6 | 6850.00 ± 1230.32 * | 0.38 ± 0.08 * | 79.20 ± 15.01 | 0.85 ± 0.29 | 48.24 ± 3.03 | 33.71 ± 3.46 * | 0.35 ± 0.03 | 838.56 ± 92.89 * | 341.37 ± 26.16 | 18,281.00 ± 868.08 | 6.00 ± 1.44 | 38.80 ± 1.27 | 12.00 ± 0 * |
| 2383.00 ± 349.25 | 0.10 ± 0.01 | 45.13 ± 15.13 | 0.31 ± 0.01 | 57.40 ± 7.92 | 16.86 ± 2.34 | 0.41 ± 0.01 | 360.57 ± 51.17 | 433.71 ± 69.77 | 24,781.00 ± 690.00 * | 2.00 ± 0.47 | 36.10 ± 1.21 | 9.00 ± 0.82 | |
| 7 | 4042.00 ± 1284.63 | 0.20 ± 0.05 | 49.77 ± 15.43 | 0.45 ± 0.06 | 73.12 ± 22.21 | 23.48 ± 6.02 | 0.38 ± 0.01 | 537.60 ± 115.42 | 498.18 ± 148.72 | 18,556.00 ± 2003.00 | 3.00 ± 0.54 | 35.20 ± 3.59 | 11.00 ± 2.60 |
| 3683.00 ± 183.32 | 0.25 ± 0.03 | 47.67 ± 15.87 | 0.49 ± 0.02 | 82.49 ± 12.10 | 22.64 ± 0.58 | 0.42 ± 0.04 | 529.10 ± 49.73 | 585.02 ± 93.87 | 15,004.00 ± 1463.00 | 3.00 ± 0.47 | 36.23 ± 0.98 | 11.00 ± 1.70 | |
| 8 | 5436.00 ± 221.17 | 0.26 ± 0.01 | 95.07 ± 15.87 | 0.47 ± 0.01 | 46.80 ± 14.10 | 27.95 ± 5.15 | 0.33 ± 0.01 | 657.88 ± 98.61 | 334.18 ± 111.49 | 20,826.00 ± 2672.00 | 5.00 ± 0.27 | 32.60 ± 1.18 | 13.00 ± 0.72 |
| 7379.00 ± 498.55 | 0.24 ± 0.02 | 74.90 ± 16.96 | 0.42 ± 0.06 | 67.35 ± 8.80 | 38.10 ± 2.93 | 0.35 ± 0.02 | 789.38 ± 63.83 | 612.30 ± 46.61 | 31,113.00 ± 1872.00 | 4.00 ± 0.72 | 37.83 ± 3.30 | 14.00 ± 1.52 | |
| 9 | 3181.00 ± 845.11 | 0.14 ± 0.02 | 87.67 ± 15.51 | 0.58 ± 0.21 | 38.38 ± 7.40 | 19.27 ± 1.73 | 0.34 ± 0.01 | 439.01 ± 26.44 * | 292.08 ± 55.41 | 24,687.00 ± 3682.00 | 2.00 ± 0.54 | 32.30 ± 2.75 | 9.00 ± 0.47 |
| 1404.00± 773.75 | 0.06 ± 0.01 | 44.43 ± 16.81 | 0.28 ± 0.03 | 34.78 ± 14.22 | 10.93 ± 2.69 | 0.37 ± 0.03 | 255.65 ± 48.74 | 257.46 ± 106.02 | 23,379.00 ± 2924.00 | 1.00 ± 0.47 | 28.97 ± 4.41 | 7.00 ± 1.70 | |
| 10 | 3331.00 ± 289.13 * | 0.16 ± 0.04 | 59.20 ± 16.38 | 0.34 ± 0.05 | 62.45 ± 2.04 | 21.17 ± 2.75 | 0.43 ± 0.03 * | 450.23 ± 58.75 | 466.33 ± 08.23 * | 23,364.00 ± 4085.00 | 3.00 ± 0.27 | 41.90 ± 6.80 | 10.00 ± 0.72 |
| 5008.00 ± 498.33 | 0.29 ± 0.05 | 95.63 ± 0.00 | 0.47 ± 0.05 | 41.86 ± 7.33 | 27.18 ± 3.63 | 0.31 ± 0.02 | 680.67 ± 87.33 | 289.04 ± 55.34 | 18,221.00 ± 1564.00 | 5.00 ± 0.27 * | 39.57 ± 1.26 | 13.00 ± 0.72 | |
| NIL Pairs | Traits with Significant Differences between Isolines | SNP | Candidate Gene | Gene Function | Marker–Gene Distance |
|---|---|---|---|---|---|
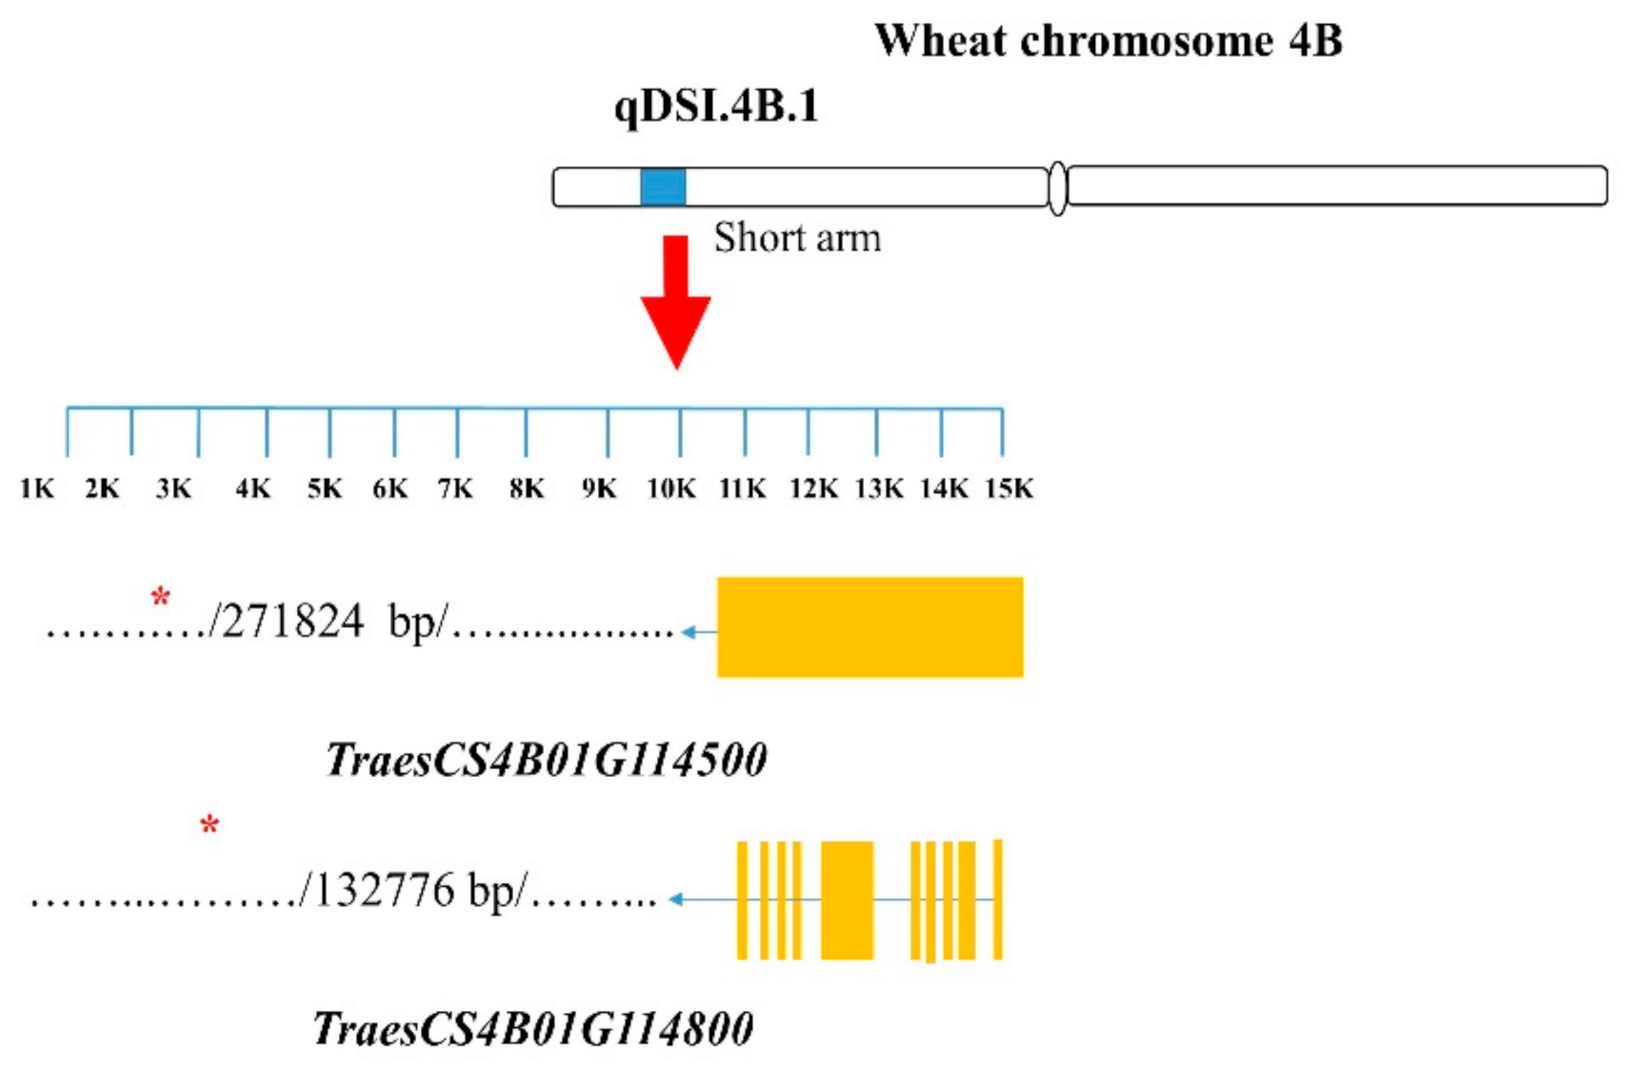
| 1–4 | RSR, RSA1, RSA2, RDCL1, RDCL2, SRL, SH, and NLP | Excalibur_c869_2091 | TraesCS4B01G114500 | Phox-associated domain, sorting nexin isoform 3 | 271.82 kb away |
| TraesCS4B01G114800 | bHLH-MYC and R2R3-MYB transcription factors N-terminal | 132.78 kb away | |||
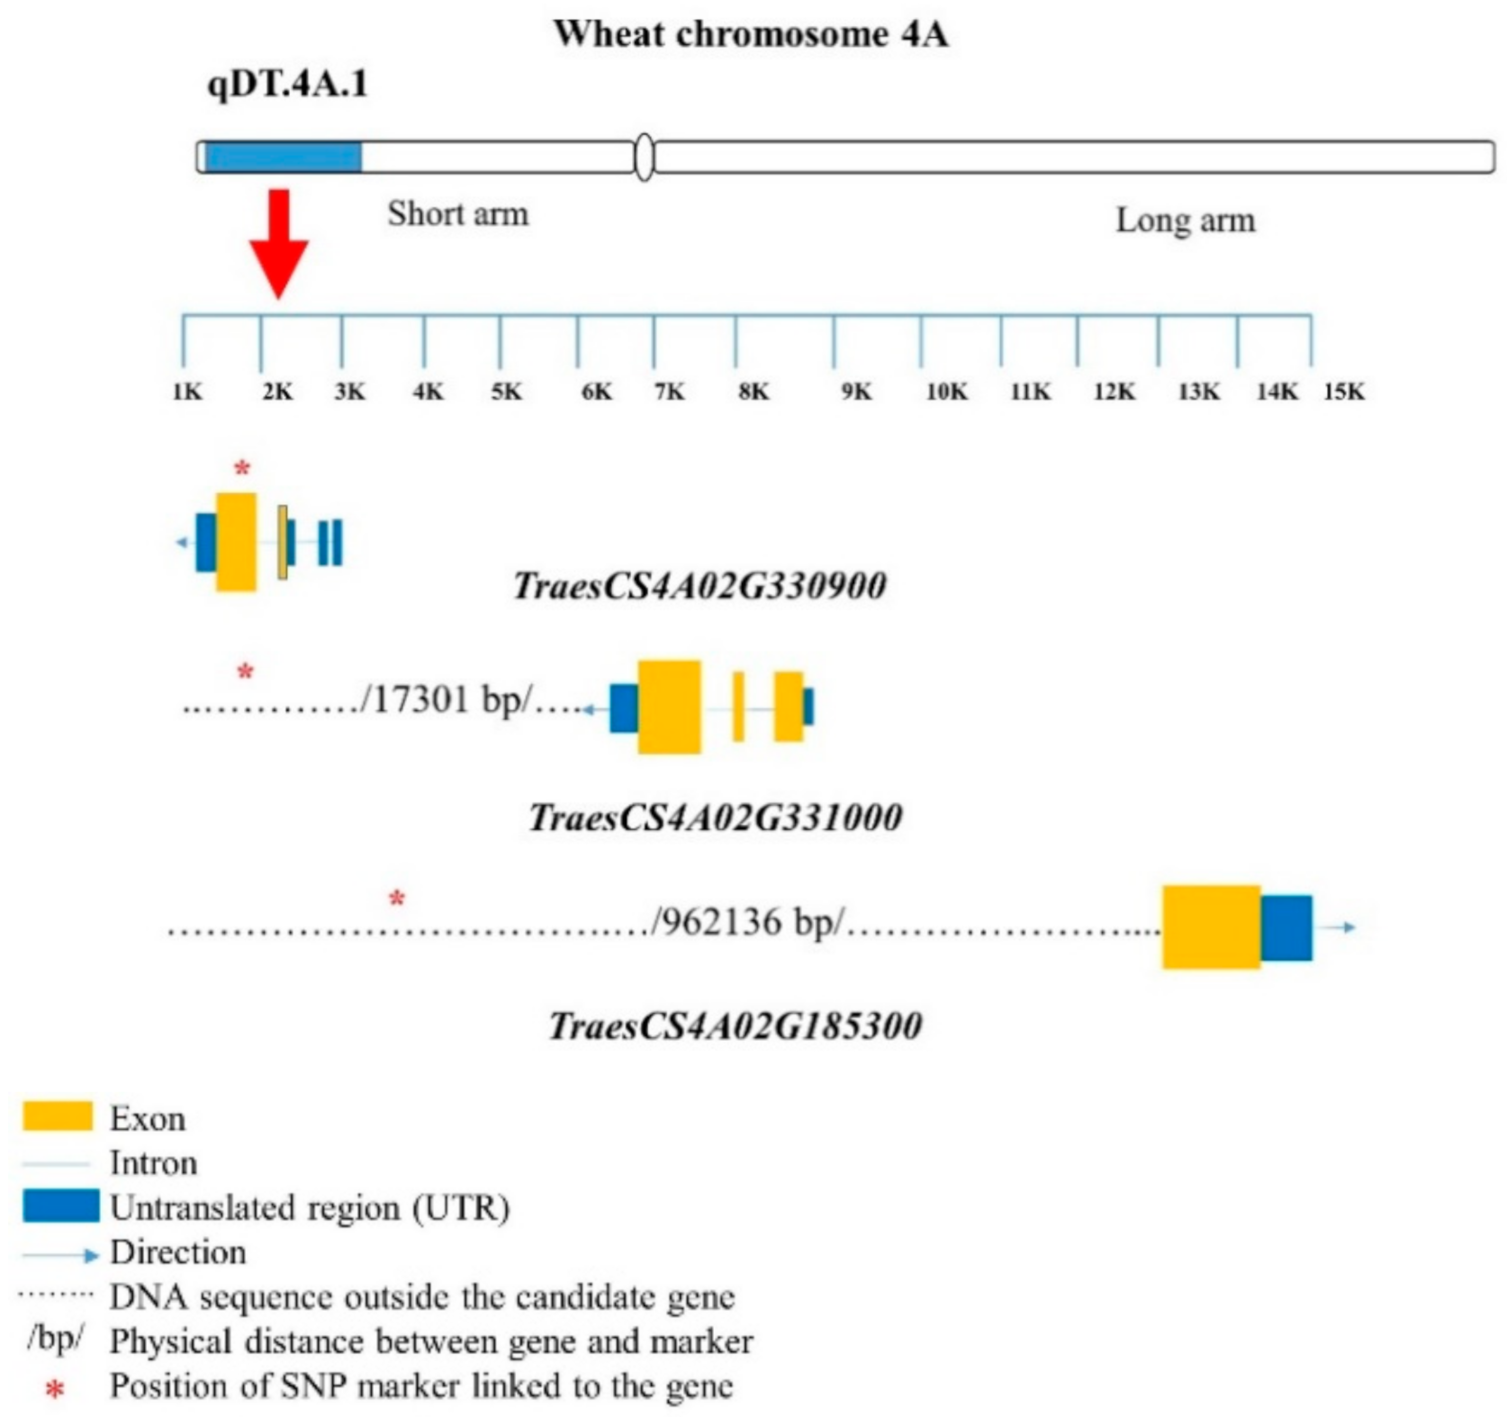
| 5–7 | RL, RM, RSR, RSA2, RDCL1, SRL, and NLP | BobWhite_c22126_94 | TraesCS4A02G163700 | Inositol-1-monophosphatase family protein | 1064.77 kb away |
| BobWhite_c27287_232 | TraesCS4A02G330900 | LRR-RLK | 7.78 kb away | ||
| TraesCS4A02G331000 | F-box family protein | 17.30 kb away | |||
| BS00098868_51 | TraesCS4A02G215800 | 202.63 kb away | |||
| TraesCS4A02G215700 | 214.39 kb away | ||||
| BS00094406_51 | TraesCS4A02G185300 | UDP-glucoronosyl and/or UDP-glucosyl transferase | 962.14 kb away | ||
| CAP12_c3789_390 | TraesCS4A02G442700 | 11.58 kb away | |||
| RAC875_c51781_771 | 10.29 kb away | ||||
| Tdurum_contig12899_342 | TraesCS4A02G323500 | Protein kinase; serine–threonine/tyrosine- protein kinase | 5.86 kb away | ||
| TraesCS4A02G323400 | 10.11 kb away | ||||
| Jagger_c9935_144 | TraesCS4A02G000300 | 90.30 kb away | |||
| Excalibur_c94546_61 | TraesCS7A02G101000 | GH3 family, GH3 auxin-responsive promoter | 31.67 kb away | ||
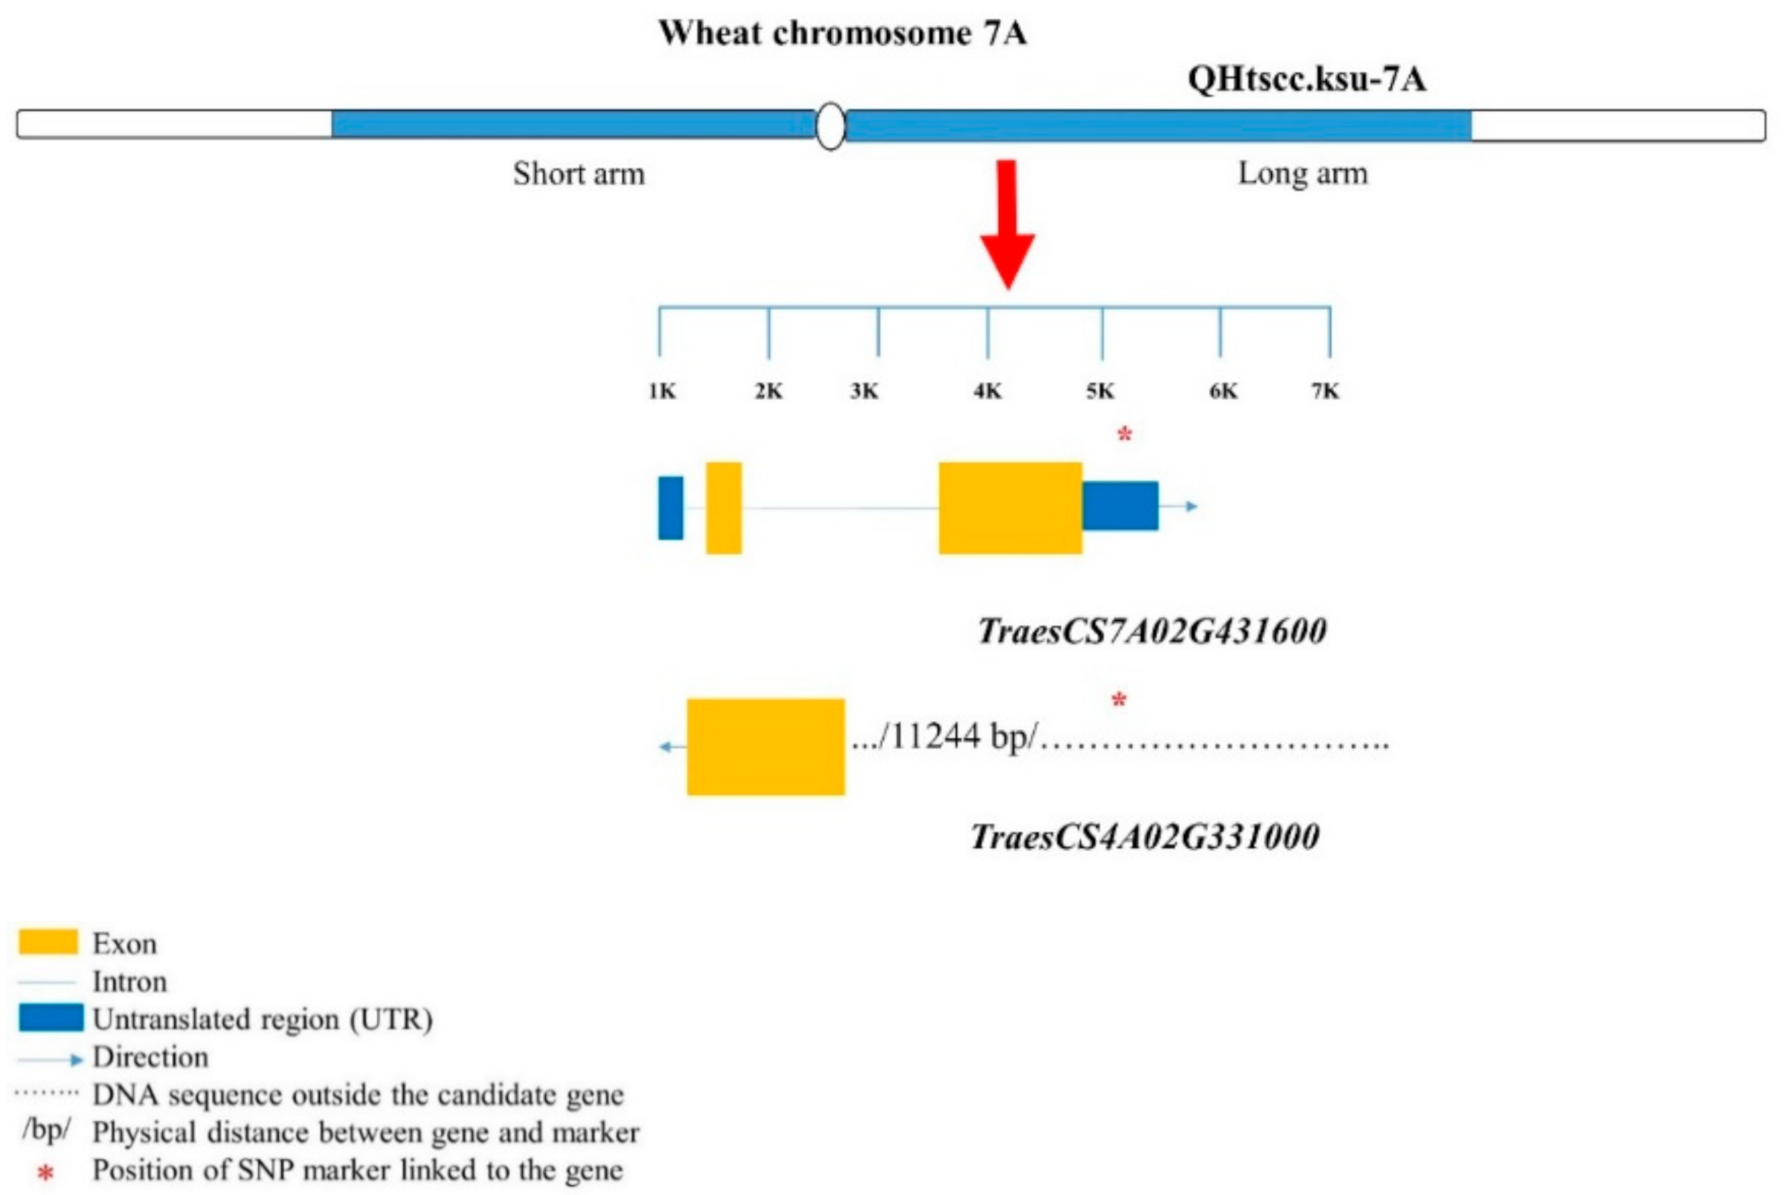
| 9–10 | RL, Rdia, RDCL1, RDCL2, and NNR | CAP8_c3496_118 | TraesCS7A02G431600 | F-box domain | Overlapped in UTR |
| TraesCS7A02G431500 | Protein kinase; serine–threonine/tyrosine- protein kinase | 11.24 kb away |
| Protein Name | Gene Name | Reported Root Trait | References |
|---|---|---|---|
| Phox-associated | TraesCS4B01G114500 | Root growth | [43,44] |
| domain, sorting nexin | development and root | ||
| isoform 3 | hair growth in Arabidopsis | ||
| bHLH-MYC and R2R3-MYB transcription factors N-terminal | TraesCS4B01G114800 | Root growth elongation; root hair growth in Arabidopsis, rice; abiotic stress tolerance in wheat | [46,47,48,49,50,51,52,54] |
| Inositol-1-monophosphatase family protein | TraesCS4A02G163700 | Rooting depth initiation and elongation in Arabidopsis | [55] |
| LRR-RLK | TraesCS4A02G330900 | Root length and root hair growth in Arabidopsis | [41,42] |
| F-box family protein | TraesCS4A02G331000 TraesCS4A02G215800 TraesCS4A02G215700 TraesCS7A02G431600 | Root length in Arabidopsis, rice, and soybean; abiotic stress tolerance in different crops | [27,56,57,58,59,60,61,62] |
| UDP-glucoronosyl and/or UDP-glucosyl transferase | TraesCS4A02G185300 TraesCS4A02G442700 | Root length and root mass in rice and canola | [38,39] |
| Protein kinase; serine–threonine/tyrosine- protein kinase | TraesCS4B01G207500 TraesCS4B01G299900 TraesCS4B01G210600 TraesCS4B01G130700 TraesCS4B01G238700 TraesCS7A02G431500 | Root length, root number, root growth in Arabidopsis, rice, and soybean; nutrient stress tolerance | [63,64,65,66,67] |
| GH3 family, GH3 auxin-responsive promoter | TraesCS7A02G101000 | Root growth, development, root length in rice, Arabidopsis; abiotic stress tolerance | [68,69] |
Publisher’s Note: MDPI stays neutral with regard to jurisdictional claims in published maps and institutional affiliations. |
© 2021 by the authors. Licensee MDPI, Basel, Switzerland. This article is an open access article distributed under the terms and conditions of the Creative Commons Attribution (CC BY) license (http://creativecommons.org/licenses/by/4.0/).
Share and Cite
Halder, T.; Liu, H.; Chen, Y.; Yan, G.; Siddique, K.H.M. Identification of Candidate Genes for Root Traits Using Genotype–Phenotype Association Analysis of Near-Isogenic Lines in Hexaploid Wheat (Triticum aestivum L.). Int. J. Mol. Sci. 2021, 22, 3579. https://doi.org/10.3390/ijms22073579
Halder T, Liu H, Chen Y, Yan G, Siddique KHM. Identification of Candidate Genes for Root Traits Using Genotype–Phenotype Association Analysis of Near-Isogenic Lines in Hexaploid Wheat (Triticum aestivum L.). International Journal of Molecular Sciences. 2021; 22(7):3579. https://doi.org/10.3390/ijms22073579
Chicago/Turabian StyleHalder, Tanushree, Hui Liu, Yinglong Chen, Guijun Yan, and Kadambot H. M. Siddique. 2021. "Identification of Candidate Genes for Root Traits Using Genotype–Phenotype Association Analysis of Near-Isogenic Lines in Hexaploid Wheat (Triticum aestivum L.)" International Journal of Molecular Sciences 22, no. 7: 3579. https://doi.org/10.3390/ijms22073579
APA StyleHalder, T., Liu, H., Chen, Y., Yan, G., & Siddique, K. H. M. (2021). Identification of Candidate Genes for Root Traits Using Genotype–Phenotype Association Analysis of Near-Isogenic Lines in Hexaploid Wheat (Triticum aestivum L.). International Journal of Molecular Sciences, 22(7), 3579. https://doi.org/10.3390/ijms22073579