Abstract
Exposure to metallic nanoparticles (NPs) can result in inadvertent NP accumulation in body tissues. While their subsequent cellular interactions can lead to unintended consequences and are generally regarded as detrimental for health, they can on occasion mediate biologically beneficial effects. Among NPs, cerium oxide nanoparticles (CeO2 NP) possess strong antioxidant properties and have shown to alleviate certain pathological conditions. Herein, we show that the presence of cubic 25 nm CeO2 NP was able to reduce TGF-β-mediated activation in the cultured hepatic stellate cell line LX2 by reducing oxidative stress levels and TGF-β-mediated signalling. These cells displayed reduced classical liver fibrosis phenotypes, such as diminished fibrogenesis, altered matrix degradation, decreased cell motility, modified contractability and potentially lowered autophagy. These findings demonstrate that CeO2 NP may be able to ameliorate hepatic fibrosis and suggest a possible therapeutic pathway for an otherwise difficult-to-treat condition.
1. Introduction
Chronic liver diseases arising from differing aetiologies often follow a defined pathway of initial fatty liver development together with increased liver fibrosis, leading to increased inflammation (hepatitis), exaggerated fibrosis (cirrhosis), and potentially hepatocellular carcinoma and liver failure. Liver fibrosis is therefore a crucial convergent point leading to several liver pathologies and represents an important opportunity to arrest or mitigate these syndromes.
Hepatic fibrosis is mediated primarily through hepatic stellate cells (HSCs). Upon hepatic injury, a complicated signalling cascade involving multiple cell types, such as hepatocytes, Kupffer cells and sinusoidal endothelial cells, results in the release of activation signals, such as tumour necrosis factor alpha (TNF-α) and transforming growth factor beta (TGF-β) [1,2]. Receipt of these signals transforms quiescent HSCs into activated myofibroblasts, which gain motility and migrate to wound sites to begin extruding extracellular matrix (ECM) materials as part of the wound-healing response. Curbing HSC activation is thus considered a prime target for liver fibrosis intervention. While numerous strategies have been proposed, there has not been any solution successfully brought to market thus far [3,4].
Metallic nanoparticles (NPs) have become increasingly ubiquitous in our environments. These tiny particles can assert disproportionately greater biological effects compared to their bulk analogues due to their cumulatively larger surface area [5,6]. Their small size allows them to easily enter the body primarily through ingestion and inhalation, and once inside, are able to penetrate into visceral tissues [6]. Numerous papers have highlighted the dangers of NP accumulation within organs; yet, at the same time, other studies have identified potentially beneficial outcomes from NP presence in specific tissues [5]. It may be that whether a NP has a net positive or negative effect depends on multiple factors, including the identity and composition of the specific NP, its size and shape and the cell types that it interacts with [5].
Cerium oxide is commonly used in manufacturing processes for producing items, such as vehicle catalytic converters, fuel cells and biomedical devices. Chemically, cerium oxide nanoparticles (CeO2 NP) have shown strong antioxidant effects due to their specific elemental properties, which allow for the alleviation of some pathologies [7]. Cerium ions on the surface of CeO2 NP are able to oscillate between two valence states (Ce3+ and Ce4+). The Ce3+ ions can couple with reactive oxygen or nitrogen species to reduce them to peroxides and nitrates, while itself oxidizing into the Ce4+ valence state, similar to the functions of the superoxide dismutase enzyme (Sod) [8,9]. The subsequent reduction from Ce4+ back to Ce3+ can oxidise hydrogen peroxide into molecular oxygen, thus mimicking the action of the catalase enzyme [9]. Such redox cycling results in the lowering of cellular ROS/RNS and hydrogen peroxide levels. In addition, CeO2 NP have also demonstrated several other forms of activity remarkably similar to other biological enzymes [10]. Numerous studies have pointed out that their strong redox properties confer protective effects against a host of conditions, such as neurological conditions [11,12], ischemic stroke [13] and retinal diseases [14], amongst others (recently reviewed in [15]).
The liver is the primary site of accumulation for NPs exposed via the oral route, and CeO2 NP have been observed to accumulate and persist in hepatic tissues. One study examining CeO2 NP accumulation in rats that were exposed via inhalation assays found that CeO2 NP were able to penetrate the lung barrier and access interior tissues, and even so, the liver showed the second highest tissue CeO2 NP concentration after the lungs [16]. Yokel and colleagues tested several high dosages of CeO2 NP and showed highest accumulation in the liver and the spleen [17]. Numerous other papers have found the liver to be one of the primary sites of CeO2 NP accumulation in vivo [18,19,20,21,22].
Coupling this natural accumulation with the strong redox potential of CeO2 does present some latent potential as therapeutics against liver pathologies. Firstly, CeO2 NP have been shown to alleviate effects of xenobiotic-induced liver injuries, including diethylnitrosamine, acetaminophen and doxorubicin [23,24,25,26]. Secondly, several studies have reported using CeO2 NP to treat non-alcoholic fatty liver disease (NAFLD) through exploiting the high redox capacities of CeO2 NP to counter characteristically elevated reactive oxygen species (ROS) levels in NAFLD. CeO2 NP treatments were found to reduce NAFLD markers, such as steatosis, inflammation, portal hypertension, hepatic lipid droplet size and content, fatty acid concentrations and compositions and the expression of NAFLD-signalling pathways [27,28,29]. Furthermore, CeO2 NP have also been found to have therapeutic benefit for hepatocellular carcinoma [30].
However, the evidence for CeO2 NP being effective against hepatic fibrosis is less clear. CeO2 NP (spherical, 4–20 nm) tested on rats with carbon tetrachloride (CCl4) induced hepatic fibrosis [27]. These rats displayed reduced steatosis and portal hypertension, but significantly only showed reduced smooth muscle actin (α-SMA) expression while collagen-I (Col-I) expression remained unchanged. Hirst and coworkers also investigated CeO2 NP (3–5 nm) and CCl4-induced liver fibrosis in mice and found that CeO2 NP reduced oxidative stress damage markers to levels comparable to N-acetylcysteine [19]. Other NP types, such as TiO2 NP, silicon dioxide NP [31], zinc oxide NP [32] and selenium NP [33], have previously been shown to inhibit liver fibrosis, demonstrating that NPs are indeed capable of attenuating the fibrotic liver phenotype.
We therefore sought to investigate liver fibrosis in the human cultured HSC cell line LX2 to confirm if CeO2 NP treatment was able to reduce fibrosis symptoms in vitro. Our results show that cubic 25 nm CeO2 NP were able to significantly suppress fibrosis in TGF-β-activated LX2 cells through the reduction of oxidative stress and TGF-β signalling, thus leading to a reduction in HSC activation and ultimately hepatic fibrosis. This suggests a possible role for CeO2 NP for treating liver fibrosis.
2. Results
2.1. Characterizing Cerium Oxide Nanoparticles Used in This Study
The CeO2 NP used in this study were first characterised using transmission electron microscopy (TEM), dynamic light scattering (DLS) and zeta potential (ζ potential) measurement (Figure 1). TEM images confirmed the CeO2 NP to be cubic-shaped and approximately 25 nm in diameter (Figure 1a). Dynamic light scattering found that the hydrodynamic size of CeO2 NP in water and Dulbecco’s Modified Eagle’s Medium (DMEM) was approximately 120 nm and 160 nm in diameter, respectively (Figure 1b,c). Crucially, their DLS sizes showed little change in size when measured at 30-min intervals over 90 min in both water and 1% fetal bovine serum (FBS) DMEM (Figure 1b,c). Finally, CeO2 NP resuspended in water showed negative ζ potential charges over time (−23.3 mV after 90 min) (Figure 1d), while CeO2 NP in 1% FBS DMEM showed higher negative ζ potential than those resuspended in water (−6.63 mV after 90 min) (Figure 1e).
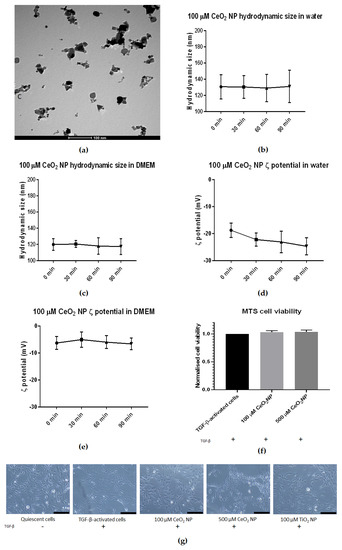
Figure 1.
Characterisation of CeO2 NP used in this study. (a) TEM analysis revealed CeO2 NP to be cubic-shaped and approximately 25 nm in diameter. (b) DLS analysis revealed CeO2 NP hydrodynamic size in water to be stable over 90 min at approximately 130 nm (n = 3). (c) CeO2 NP hydrodynamic size in 1% DMEM showed a slightly smaller size at approximately 120 nm and was also stable over 90 min (n = 3). (d) CeO2 NP in water showed a downward trend in ζ potential (n = 3). (e) CeO2 NP ζ potential in 1% DMEM showed more stable ζ potential (n = 3). (f) 100 µM and 500 µM CeO2 NP showed similar cell viability as TGF-β-treated control cells when measured using MTS assay (n = 3). (g) Light microscope images taken at 10× magnification of quiescent cells, TGF-β-activated cells, 100 µM CeO2 NP, 500 µM CeO2 NP and TiO2 NP-treated cells (n = 3). Scale bar represents 200 µm. Error bars represent standard error of the mean (SEM); one-way analysis of variance (ANOVA) was used to calculate significance.
We next performed cell viability assays to prove that CeO2 NP were not toxic to LX2 cells at 100 and 500 µM concentrations. We used 3-(4,5-dimethylthiazol-2-yl)-5-(3-carboxymethoxyphenyl)-2-(4-sulfophenyl)-2H-tetrazolium] (MTS) assays to assess the viability of TGF-β-activated cells after 24 h of co-incubation with 100 and 500 µM CeO2 NP (Figure 1f). Cell viability was not significantly different compared to TGF-β-activated controls, demonstrating that CeO2 NP presence was not detrimental for the cells at the concentrations used.
Lastly, light microscope images at 10× magnification were taken of LX2 cells after 24 h of incubation under different treatment conditions (quiescent cells, TGF-β-activated cells, TGF-β-activated cells with 100 µM CeO2 NP, TGF-β-activated cells with 500 µM CeO2 NP and TGF-β-activated cells with 100 µM titanium dioxide nanoparticles (TiO2 NP)). The morphology of NP/TGF-β-treated cells showed no obvious difference compared to TGF-β-activated cells, suggesting that these NPs did not exert any detrimental effects on cell morphology.
2.2. Cerium Oxide Nanoparticles Are Able to Reduce Fibrogenesis Marker Expression
To determine if CeO2 NP are able to reduce fibrosis, we first examined the expression of fibrotic marker genes collagen-I and smooth muscle actin using real-time PCR (RT-PCR) and immunoblotting in TGF-β-activated cells, with or without CeO2 NP (Figure 2). Expression was normalised to TGF-β-activated controls to detect if CeO2 NP exposure reduced Col-I or α-SMA expression.
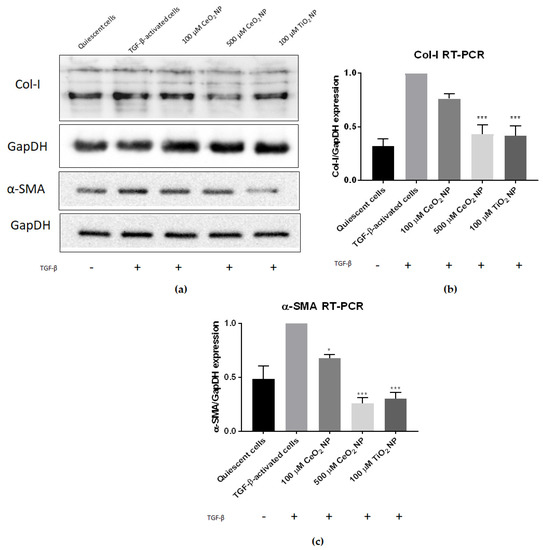
Figure 2.
CeO2 NP reduce fibrogenesis in TGF-β-activated cells. (a) Immunoblot analysis showed a dose-dependent reduction in both Col-I and α-SMA protein expression (n = 4). (b) RT-PCR analysis found Col-I expression in 500 µM CeO2 NP and TiO2 NP-treated cells to be significantly reduced (n = 3). (c) RT-PCR analysis found α-SMA expression in 100 µM CeO2 NP, 500 µM CeO2 NP and TiO2 NP-treated cells to be significantly reduced (n = 3). Error bars represent SEM; ANOVA was used to calculate significance. * p < 0.05, *** p < 0.001.
It can be seen that treating TGF-β-activated LX2 cells with CeO2 NP significantly reduced Col-I and α-SMA expression (Figure 2). Immunoblot images showed reduced Col-I and α-SMA protein expression (Figure 2a), demonstrating that CeO2 NP treatment reduced fibrogenesis marker expression. RT-PCR analysis of Col-I mRNA expression showed that 100 µM CeO2 NP (equivalent to 17.2 µg/mL) and 500 µM CeO2 NP (equivalent to 86.1 µg/mL) reduced Col-I by 24% percent and 67% percent respectively compared to TGF-β-activated controls (Figure 2b). Similarly, 100 µM and 500 µM CeO2 NP treatment showed significant reduction of α-SMA transcript expression (32% and 74% respectively) (Figure 2c). Titanium dioxide nanoparticles (TiO2 NP) have previously been shown to possess antifibrotic capacities [31] and k9were used as an experimental positive control in this study. Agreeably, 100 µM TiO2 NP (equivalent to 0.799 µg/mL) were able to significantly reduce Col-I and α-SMA expression in our experiments. Noticeably, only 500 µM CeO2 NP were able to reduce Col-I (67% vs. 69% reduction when measured using RT-PCR) and α-SMA expression (74% vs. 69% reduction when measured using RT-PCR) to levels comparable to 100 µM TiO2 NP.
2.3. CeO2 NP Affect Other Classical Hallmarks of Hepatic Fibrosis
We next set out to determine if other characteristics of fibrosis are also reduced in CeO2 NP-treated cells. In addition to increased fibrogenesis, activated stellate cells display other characteristics, such as increased chemotaxis movement, elevated contractility and altered matrix remodelling [1]. Accordingly, TGF-β-activated LX2 cells were treated with CeO2 NP for 24 h before being tested for their degree of motility using a transwell assay. Figure 3a shows the total number of migrated cells counted/chamber, normalised to TGF-β-activated controls. TGF-β-activated cells retained their strong cell motility phenotype, but in contrast 100 µM, 500 µM CeO2 NP and TiO2 NP-treated cells showed significantly reduced cell motility, indicating that these cells were less motile compared to TGF-β controls.
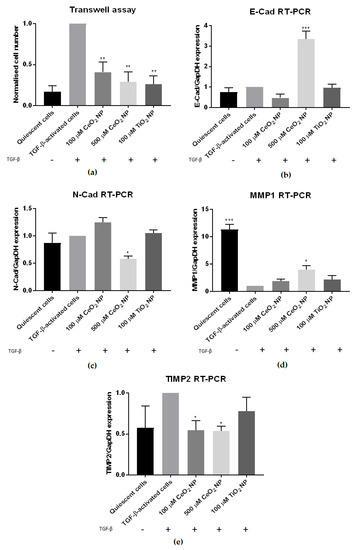
Figure 3.
CeO2 NP-treated cells show reduced hepatic fibrosis hallmarks. (a) Transwell assay examining the cell motility of CeO2 NP-treated cells showed significantly reduced motility in 100 µM, 500 µM and TiO2-treated cells. (n = 3) (b) The 500 µM CeO2 NP-treated cells showed significantly elevated E-cad mRNA expression. (n = 3) (c) The 500 µM CeO2 NP-treated cells also had significantly reduced N-cad mRNA expression. (n = 3) (d) RT-PCR analysis showed significantly higher MMP1 expression in 500 µM CeO2 NP-treated cells. (n = 3) (e) TIMP2 mRNA expression was significantly downregulated in 100 µM CeO2 NP and 500 µM CeO2 NP-treated cells. (n = 4). Error bars represent SEM; ANOVA was used to calculate significance. * p < 0.05, ** p < 0.01, *** p < 0.001.
We went on to examine contractility by means of epithelial-mesenchymal biomarkers in CeO2 NP-treated cells. N-cadherin (N-cad) and E-cadherin (E-cad) expression was measured in CeO2 NP-treated cells using RT-PCR. At 500 µM, CeO2 NP significantly upregulated E-cad expression and downregulated N-cad expression (Figure 3b,c).
We next sought to investigate if matrix remodelling was altered in CeO2 NP-treated cells through using RT-PCR to examine the expression of matrix metalloproteinase 1 (MMP1) and tissue inhibitor of matrix metalloproteinase 2 (TIMP2). MMP1 was significantly upregulated in 500 µM CeO2 NP-treated cells (Figure 3d), while TIMP2 was significantly downregulated in both 100 µM CeO2 NP and 500 µM CeO2 NP-treated cells (Figure 3e).
We investigated reactive oxygen species (ROS) levels in CeO2 NP-treated cells to determine if CeO2 NP exposure would reduce oxidative stress. We performed flow cytometry experiments using CellROX Deep Red oxidative stress dye (Figure 4b), where TGF-activated cells were treated with CeO2 NP and TiO2 NP. Their levels of oxidative stress were quantified, and results were normalised to TGF-activated cells control and tabulated (Table 1). While we observed an increase in ROS levels between quiescent and activated cells, this difference was marginal at only 0.18 (mean value of 0.82 vs. 1.0 respectively). Corroborating with the strong redox potential of CeO2 NP, 500 µM CeO2 NP-treated cells demonstrated the largest reduction in oxidative stress amongst the samples tested (mean value of 0.79). This was lower than the amount of ROS seen in quiescent cells (mean value of 0.817). Overall, a total reduction of 113.0% in ROS levels for 500 µM CeO2 NP was observed when quiescent cell ROS levels were used as a baseline for comparison. In comparison, TiO2 NP showed a mean ROS level of 1.04, signifying that TiO2 NP induced oxidative stress instead. Flow cytometry data charts are found in Supplementary Figure S1.
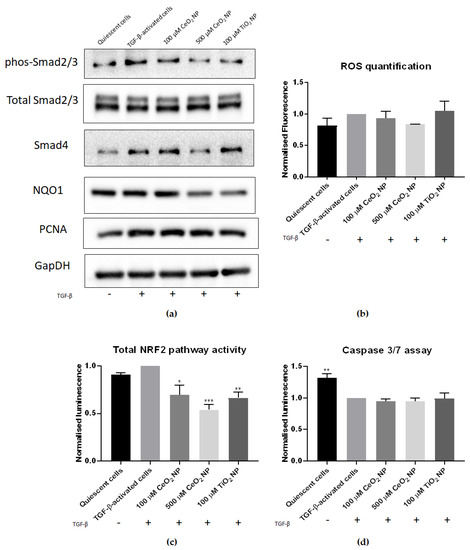
Figure 4.
CeO2 NP treatment reduces hallmarks of HSC activation. (a) Phosphorylated Smad2/3, total Smad2/3, Smad4 and NQO1 immunoblots. Phosphorylated Smad2/3 and Smad4 protein expression was decreased in 500 µM CeO2 NP-treated cells. Similarly, NQO1 expression was reduced in CeO2 NP-treated cells. PCNA expression showed no difference between TGF-β controls and CeO2 NP-treated samples. (n = 4) (b) ROS levels in CeO2 NP-treated cells were measured using flow cytometry. It can be seen that 500 µM CeO2 NP reduced oxidative stress to levels comparable to quiescent cell controls. (n = 3) (c) Nrf2 pathway activity. Total Nrf2 activity was measured using an ARE-promoter assay. The 100 µM CeO2 NP, 500 µM CeO2 NP and TiO2 NP-treated cells all showed significantly reduced Nrf2 activity. (n = 3) (d) Caspase 3/7 activity assay. CeO2 NP-treated cells showed no significant difference in caspase 3/7 activity compared to TGF-β controls. However, quiescent cells showed significantly higher caspase 3/7 activity. (n = 3). Error bars represent SEM; ANOVA was used to calculate significance. * p < 0.05, ** p < 0.01, *** p < 0.001.

Table 1.
ROS-level reduction in CeO2-treated cells.
We next examined the activity of antioxidant pathways in CeO2 NP-treated cells by performing antioxidant response element (ARE)-driven luciferase assays. CeO2 NP-treated cells showed a marked dose-dependent reduction in nuclear factor erythroid 2–related factor 2 (Nrf2) activity compared to TGF-β-activated controls (Figure 4c). To confirm this, we also studied the expression of the Nrf2-responsive gene NAD(P)H quinone dehydrogenase 1 (NQO1) in CeO2 NP cells using immunoblotting. NQO1 expression was similarly found to be reduced (Figure 4a), suggesting a downregulation in Nrf2 activity in CeO2 NP-treated cells.
2.4. HSC Activation Phenotypes Are Reduced in CeO2 NP-Treated Cells
We have shown that fibrosis levels are reduced in CeO2 NP-treated cells. To investigate the mechanisms underlying this, we subsequently evaluated classical features of HSC activation in these cells.
We next investigated TGF-β signalling in CeO2 NP-treated cells. To determine if Smad-signalling activity was reduced in CeO2 NP-treated cells, we examined phosphorylated Smad2/3, total Smad2/3 protein, and Smad4 expression using immunoblotting. We found that CeO2 NP treatment downregulated Smad2/3 phosphorylation, affirming that the effector arm of TGF-β signalling was reduced in these cells (Figure 4a). To confirm this, we also examined Smad4 expression in CeO2 NP-treated cells. We found Smad4 expression to be reduced as well (Figure 4a), confirming that TGF-β signalling is reduced in CeO2 NP-treated cells.
We also examined if CeO2 NP-treatment affected cell proliferation. Immunoblot analysis revealed that CeO2 NP-treated cells showed no difference in proliferating cell nuclear antigen (PCNA) expression compared to control TGF-β-activated cells (Figure 4a), demonstrating that DNA replication was unchanged in these cells. This suggests that cell proliferation is unaffected in these cells.
The degree of apoptosis was also studied in CeO2 NP-treated cells. We performed caspase 3/7 activity assays, which revealed no significant differences in caspase 3 activity between TGF-β-treated control cells and both 100 µM and 500 µM CeO2 NP-treated cells (Figure 4d). This indicated that CeO2 NP treatment did not actively promote apoptosis activity in TGF-β-activated cells.
We sought to investigate if autophagy had been modified in CeO2 NP-treated cells through examining the expression of key autophagic markers. Microtubule-associated proteins 1A/1B light chain 3B (LC3-II) expression was compared between cells treated with and without chloroquine using immunoblotting to assess the degree of LC3-II accumulation and hence autophagic flux. It can be seen that 500 µM CeO2 NP treatment showed reduced autophagic flux compared to TGF-β controls (Figure 5a,b), again supporting that HSC activation is decreased in CeO2 NP-treated cells in a dose-dependent manner. However, this result was not found to be statistically significant. In addition, the expression of p62/sequestosome-1 (p62) was also analysed using immunoblotting. CeO2 NP-treated cells showed increased p62 expression in a dose-dependent manner (Figure 5c), demonstrating that CeO2 NP treatment was potentially able to inhibit autophagy.
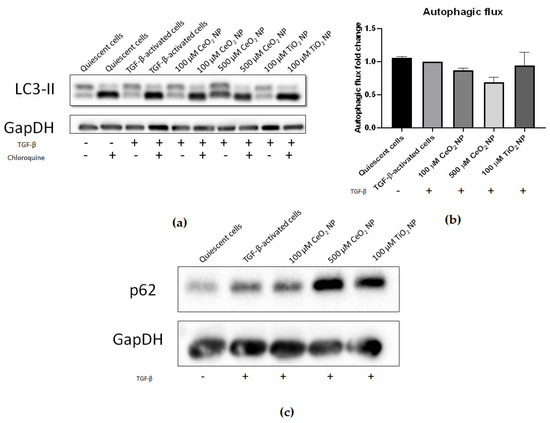
Figure 5.
Autophagy is potentially reduced in CeO2 NP-treated cells. (a) Immunoblots of LC3-II expression in CeO2 NP-treated cells with and without the autophagy inhibitor chloroquine. (n = 4) (b) The 100 µM and 500 µM CeO2 NP showed reduced autophagic flux in a dose-dependent manner when calculated using the ratio of LC3-II expression in chloroquine-treated and chloroquine-untreated cells and measured using densitometry analysis (n = 4). (c) p62 expression was increased in 100 µM and 500 µM CeO2 NP-treated cells when investigated using immunoblotting (n = 5). Error bars represent SEM; ANOVA was used to calculate significance.
3. Discussion
This study set out to investigate the potential of 25 nm CeO2 NP to treat liver fibrosis by using the immortalised human HSC cell line LX2 as an in vitro model that recapitulates the machinery of liver fibrosis [34].
We began this project by defining the physical characteristics of the CeO2 NP used. Aggregated NPs have been postulated to cause toxicity not seen with dispersed single particle NPs, emphasising the importance of ensuring a disperse solution. Under the conditions we used, CeO2 NP in both distilled water and 1% FBS DMEM solutions remained disperse when tracked using DLS. Their sizes remained stable in both solutions throughout the experiments, indicating that CeO2 NP did not aggregate for up to 90 min post-dispersion. The CeO2 NP maintained negative zeta potential in both water and 1% FBS DMEM (pH 7.4), and as such, it can promote interaction with positively charged macromolecules in cell membranes to allow stronger NP attachment to cell surfaces, which results in more NPs being internalised into cells [35].
Central to the intent of the study, we found Col-I and α-SMA expression were reduced after CeO2 NP treatment, indicating that CeO2 NP were able to inhibit fibrogenesis, thereby decreasing the amount of secreted ECM material. This crucial early result demonstrated the pharmacological potential of CeO2 NP, rendering it purposeful to further investigate other fibrosis characteristics in CeO2 NP-treated cells.
Of interest, the regulation of the extracellular matrix microenvironment is not simply governed by the deposition of new collagen, but is also maintained by a counterbalance of fibrolytic activities. Under normal conditions, ECM content is regulated in part by quiescent HSCs releasing MMPs to actively degrade ECM material and prevent the excessive accumulation of ECM. In the presence of stress signals, activated HSCs posture to increase the amount of ECM through secreting ECM components, such as connective tissue proteins, and releasing TIMPs. Here, we found that MMP1 expression was upregulated while TIMP2 expression was downregulated in CeO2 NP-treated cells. MMP1 actively degrades ECM material, and MMP1 upregulation has been shown to reduce hepatic ECM accumulation [36]. TIMP2 inhibits MMP activity [37], and lowered TIMP2 expression similarly results in decreased ECM retention. Overall, CeO2 NP-treated cells demonstrated a dual-prong recalibration of ECM homeostasis towards a more quiescent cell-like manner of matrix regulation, supporting that CeO2 NP treatment reduces HSC activation. The concurrent modulation of both fibrogenesis and fibrolysis events offer a more robust control ECM maintenance to achieve therapeutic gains.
The fibrotic phenotype goes beyond the regulation of ECM dynamics and also includes morphological and mobility changes. Activated HSCs undergo epithelial-to-mesenchymal transitions (EMT), gain contractility and motility and migrate to wound sites where they secrete ECM material as part of the wound-healing response [1]. We found that CeO2 NP-treated cells had reduced motility when measured through transwell assays. They also had high E-cad and low N-cad expression, tending away from a mesenchymal predominance. The significantly diminished motility observed in 500 µM CeO2 NP-treated cells, together with the significantly less contractile phenotype compared to TGF-β controls, promulgate a quiescent HSC phenotype that limits further profibrotic activities and buys time for the liver at large to recover through removal of injury and regeneration of hepatocytes.
Fibrotic HSCs also display changes in their cellular maintenance. Autophagy is a cellular housekeeping machinery where unrequired cell components are degraded into their component molecules and recycled. HSC activation results in increased autophagy as HSCs undergo massive internal remodelling to complement their shift to a more mobile phenotype [38]. LC3 is a protein component of autophagosomal membranes and is commonly used for profiling autophagic flux [39,40]. The cargo adaptor protein p62 interacts with autophagic substrates and delivers them to autophagosomes for degradation. Thus, expression of p62 is inversely correlated with autophagic flux [41] and serves as a useful second confirmation for total autophagic activity. We found LC3 autophagic flux to be decreased in a dose-dependent manner, while p62 expression was increased, indicating that these cells demonstrated potentially reduced autophagy compared to TGF-β-activated controls. Coupling this with a lack of apoptosis, CeO2 NP are effective in inactivating HSCs without killing them, thereby desensitizing them to further TGF-β signals as a therapeutic advantage.
To address the molecular mechanism of CeO2 NP action on HSC, its antioxidant potential was investigated. The importance of oxidative stress in liver fibrosis is emphasised by studies identifying antioxidants as antifibrotic agents [42,43,44,45]. Crucially, we found that CeO2 NP treatment decreased oxidative stress in activated HSC cells, congruent with its known antioxidant properties. The 100 µM and 500 µM CeO2 NP treatments suppressed ROS release in a dose-dependent manner. We confirmed this through examining the expression of cellular antioxidant response genes. Nrf2 is a major regulator controlling cellular response to oxidative stress, and Nrf2 activity is often used as a surrogate for total cellular oxidative stress [46]. Total Nrf2 activity was significantly reduced in both CeO2 NP concentrations, suggesting an alleviation of the oxidative stress response as a trigger point. To confirm that Nrf2 activity was truly decreased in CeO2 NP-treated cells, we also studied the expression of the Nrf2 responsive gene NQO1 [47]. NQO1 expression was similarly found to be reduced, supporting our finding that Nrf2 activity was decreased in CeO2 NP-treated cells. The effect of CeO2 NP on downregulating the Nrf2 pathway has been demonstrated independently. CeO2 NP reduced oxidative stress levels and lowered Nrf2 and heme oxygenase-1 (HO-1) expression after 25 nm cubic CeO2 NP were used to alleviate D-galactosamine and lipopolysaccharide (D-GALN/LPS)-induced hepatotoxicity [48]. A human epithelial lung cell line also showed reduced Nrf2-responsive genes HO-1 and superoxide dismutase 2 (Sod2) expression after 25 nm cubic CeO2 NP pre-exposure [49]. CeO2 NP (4–20 nm spherical) also protected HepG2 hepatocytes from oxidative stress damage, partly through alteration of oxidative stress-related, kinase-signalling pathways [50]. Taken together, these results confirm that Nrf2 activity, and ultimately oxidative stress levels, were reduced in CeO2 NP-treated cells.
The alleviation of oxidative stress asserts a direct impact on the master regulator of hepatic fibrosis, i.e., TGF-β. Latent TGF-β is released by Kupffer cells and other immune cells in the form of an inactive complex comprising mature TGF-β, latency-associated protein (LAP) and latent TGF-β binding protein (LTBP) [51]. After activation, TGF-β is released from this complex and is then free to bind to TGF-β receptors on the surface of quiescent HSCs, initiating the Smad-signalling cascade and commencing HSC activation. Several studies have pointed to TGF-β signalling being sensitive to oxidative stress levels [42,51]. The dissociation of TGF-β from its latent complex requires several factors, including ROS signalling [51]. Oxidants can act on the latent TGF-β complex directly by oxidising LAP, dissociating it from the complex and releasing TGF-β, or indirectly through activating MMPs, which then cleave the complex and release TGF-β. Furthermore, active Smad signalling represses the expression of antioxidants, such as glutathione and Sod [51], and increases oxidative stress by upregulating ROS-generating enzymes, such as mitochondrial NADPH oxidases (NOX) [52,53]. Oxidative stress therefore activates HSCs partly through its effects on TGF-β signalling.
Agreeably, the hallmarks of TGF-β signalling, including Smad expression, were downregulated in CeO2 NP-treated cells through reduced levels of phosphorylated Smad2/3 and Smad4 levels. The question remains if the observed decrease in TGF-β signalling stems exclusively from the suppression of oxidative stress after CeO2 NP redox activity or is due to other extraneous factors not examined. CeO2 NP may have other intrinsic nonantioxidant properties that are able to reduce TGF-β signalling [54]. Future work should look to further tease apart this situation, possibly through the use of CeO2 NP treated to inhibit their redox capacity.
Our findings corroborated the observations of Oró and colleagues, when they treated CCl4-induced fibrotic rats with 4–20 nm spherical CeO2 NP [27]. However, they found that CeO2 NP-treated rats showed reduced expression of α-SMA, but not Col-I. This was a surprising finding, as Col-I is a marker for ECM and fibrosis, and suggests that overall fibrosis levels were not reduced in these animals. Similarly, Hirst et al. treated mice with CCl4-induced fibrosis with CeO2 NP and found reduced levels of lipid peroxidation as measured through MDA levels [19]. Unfortunately, they did not report on the degree of fibrosis observed, and hence the status of fibrosis in these mice is unknown.
We reason that this deviation from our findings may be due to the amount of CeO2 NP that enter HSCs in vivo not reaching sufficiently high enough concentrations required for therapeutic benefit. Our study indicated that relatively high concentrations of CeO2 NP were required to significantly inhibit fibrosis symptoms (100 µM, or 17.2 mg/L; and 500 µM, or 86.1 mg/L). To give biological context to this in vitro dosage, Yokel et al. injected a similar concentration of 85 mg/kg CeO2 NP (30 nm, cubic) into rats and reported that the liver retained 4.6 mg and 4.43 mg of total cerium 30 and 90 days post-injection respectively [17]. Oró et al. injected fibrotic rats with 0.1 mg/kg CeO2 NP twice weekly for two weeks. They then used inductively coupled plasma-mass spectroscopy (ICP-MS) to quantify the amount of total cerium in rat livers after eight weeks post-injection and found that these livers accumulated approximately 15 µg/g of total cerium [27]. This is less than our low dose (17.2 mg/L) found to inhibit fibrogenesis in our study. Furthermore, after entry into the liver, CeO2 NP are predominately taken up by Kupffer cells and hepatocytes, with Kupffer cells responsible for phagocytosing the large majority of NP [19,21,22,55]. This suggests that HSC NP uptake is comparatively little compared to macrophages and hepatocytes, and thus HSCS may only accumulate a small fraction of the 15 µg/g of total liver cerium from Oró et al. Tseng et al. investigated CeO2 NP accumulation (30 nm, cubic) in various liver cell types at the ultrastructural level [22]. From their presented TEM images, it is noticeable that the amount of CeO2 NP shown in an HSC cell after 90 days post-exposure was lower when compared to adjacent images of a Kupffer cell and a hepatocyte. We therefore suspect that the amount of CeO2 NP entering HSCs in previous studies may have been insufficient to completely treat hepatic fibrosis in vivo.
To address this limitation in a physiologically complete system, HSC-specific targeting mechanisms can be added to CeO2 NP to directly target them to HSCs and to avoid being taken up by other liver cell types. Adding an HSC-specific sequence to directly deliver CeO2 NP to HSCs may increase HSC CeO2 NP in vivo accumulation to levels approaching therapeutic benefits. Several methods have been proposed for use as HSC targeting sequences [56]. HSC-targeting CeO2 NP can also be loaded with cytotoxic drugs such as sunitinib, which will kill activated HSCs, reducing the number of activated HSCs and thereby reducing liver fibrosis levels in vivo. As proof of this concept, Sulthana et al. conjugated folic acid onto the surface of CeO2 NP carrying doxorubicin and the HSP90 inhibitor ganetespib, which allowed efficient targeting of non-small-cell lung cancer cells that overexpressed folic-acid receptor [57]. This resulted in vastly increased killing efficiency compared to nonfolic-acid-conjugated drug-loaded CeO2 NP after 48 h. This report demonstrates that CeO2 NP can act as efficient drug carriers and suggests a future technique where modifying CeO2 NP with an HSC-targeting signal will allow effective targeting of HSCs in vivo.
Additionally, CeO2 NP can also be surface modified with protective coatings, such as polyethylene glycol (PEG) or albumin. These coatings have been shown to reduce degradation by body components after introduction, thereby increasing the amount of NPs reaching target organs [58]. PEG coatings have even been shown to reduce NP phagocytosis by Kupffer cells [59], further increasing the amounts reaching HSCs. Importantly, PEG-coated CeO2 NP still retain their antioxidant capabilities [60], which suggests that surface modifying CeO2 NP with a PEG layer will not hinder their antifibrotic effects.
Overall, while metallic NP are often categorically dismissed as being detrimental for health, our work underscores the reality that the actual situation may be more nuanced, as each element has its own intrinsic properties that can dictate their specific interactions with biological systems [5]. While our study and numerous others have found that CeO2 NP can have therapeutic potential for liver diseases, their role in the lung is considerably less beneficial, with CeO2 NP inhalation being found to induce pulmonary inflammation and fibrosis in rats [61,62]. It is therefore crucial to thoroughly investigate the effects of each NP carefully in the correct biological context before deciding if a particular NP type is beneficial or detrimental to a biological system. Along this line, future work can include examining the effects of exposing quiescent LX2 cells to CeO2 NP to understand the effects of CeO2 NP on fibrosis induction.
Our study demonstrated that CeO2 NP were able to reduce hepatic fibrosis symptom levels in vitro. This was achieved through lowering oxidative stress and TGF-β signalling, ultimately reducing the activation of CeO2 NP-treated LX2 cells. Our work indicated that contrary to previously published reports, the final conclusion for the effect of CeO2 NP on liver fibrosis is still unclear, and CeO2 NP may yet be a potential therapy for hepatic fibrosis.
4. Materials and Methods
4.1. Nanoparticles Used in This Study
CeO2 NP (catalogue number 544841) and TiO2 NP (catalogue number 718467) were purchased from Sigma-Aldrich (St. Louis, MO, USA). The size, shape and charge of TiO2 NP was described previously [31]. NPs were freshly prepared for each experiment. NP powder was weighed to appropriate amounts to make a stock solution, dissolved in ultrapure water and dispersed using probe sonication (Fisher Scientific, Pittsburgh, PA, USA) for 1 min to minimise NP aggregation and ensure a disperse single particle suspension. This dispersed solution was then added to media at appropriate concentrations before the media-NP solution was probe sonicated again for 1 min just before use. CeO2 NP were first characterised for their size and shape using transmission electron microscopy. 10 µL of 100 µM CeO2 NP solution was pipetted directly onto formvar-coated grids and incubated for 1 min, before being washed with distilled water, dried and imaged on a Tecnai G2 Spirit operating at 120 kV (FEI, Hillsboro, OR, USA).
4.2. Cell Lines Used
The human hepatic stellate cell LX2 (received as a kind gift from Professor Scott Friedman) was used in this study. LX2 cells were maintained in Dulbecco’s Modified Eagle’s Medium (Sigma-Aldrich, USA) containing 10% FBS (Gibco, Amarillo, TX, USA) supplemented with penicillin-streptomycin (Gibco, USA) at 37 °C and 5% CO2. One generation prior to use in experiments, cells were subcultured in 1% FBS DMEM to ensure quiescence. LX2 cells were activated using 2 ng/mL TGF-β (STEMCELL Technologies, Vancouver, BC, Canada) in 1% FBS DMEM.
4.3. Dynamic Light Scattering
Before analysis, 100 µM CeO2 NP was resuspended in 1 mL of ultrapure water or 1% FBS DMEM. Hydrodynamic size and zeta potential were measured using a Litesizer 500 (Anton Paar, Graz, Austria).
4.4. MTS Assay
Cell viability was measured using MTS assay (CellTiter 96® AQueous One Solution Cell Proliferation Assay, Promega, Madison, WI, USA). Overnight, 10,000 cells per well were seeded before being treated with 2 ng/mL TGF-β and appropriate NPs for 24 h. Each treatment was performed in triplicate. An hour before the incubation period finished, 20 µL of MTS reagent was added per well and incubated for an hour at 37 °C before being read on a plate reader (Tecan, Männedorf, Switzerland) at 490 nm.
4.5. Cell Imaging with Light Microscopy
Overnight, 200,000 cells were seeded in six-well plates before being treated for 24 h with 2 ng/mL TGF-β and appropriate NPs. Cells were washed in PBS, before images taken at 10× magnification with an Olympus DP21 camera (Olympus, Shinjuku, Tokyo, Japan).
4.6. Cell Migration Assay
Overnight, 200,000 cells were seeded in six-well plates before being treated for 24 h with 2 ng/mL TGF-β and appropriate NPs. After the treatment period, cells were then stained with 1 µg/mL CellTracker Orange CMRA Dye (Invitrogen, Waltham, MA, USA) for 45 min at 37 °C. Cells were then removed from the plate, counted and seeded into the inner chamber of a transwell insert (8 µm pore size, Corning Costar, Cambridge, MA, USA) at 10,000 cells/insert in 100 µL of serum-free DMEM. The insert was then carefully lowered into a 24-well plate containing 600 µL of 10% FBS DMEM. Cells were then incubated at 37 °C for a further 24 h. A cotton bud was then used to carefully remove media and cells from the upper membrane layer inside the insert before the membrane was fixed with 10% formalin (Sigma-Aldrich, St. Louis, MO, USA). Cells were then stained with 2 µg/mL Hoechst 33342 stain for 30 min at room temperature. The transwell insert membrane was then carefully removed and mounted on a glass slide before imaging using an Olympus FV100 confocal microscope (Olympus, Shinjuku, Tokyo, Japan). At least 16 random images were taken per sample at 20× magnification, and the total number of cells were counted per sample and normalised to TGF-β controls.
4.7. Oxidative Stress Measurement
Overnight, 600,000 LX2 cells were seeded in a 60 mm dish and treated with 2 ng/mL TGF-β and appropriate NPs for 24 h. Samples were then washed with PBS and incubated with 5 µM CellROX Deep Red (Thermo Fisher Scientific, Waltham, MA, USA) for 30 min at 37 °C. Cells were then washed with PBS and treated with trypsin (Hyclone, Logan, UT, USA) for 5 min at 37 °C. Serum-free DMEM was then used to inactivate the trypsin. Cells were then washed again with PBS before being fixed with 10% formalin for 15 min at room temperature. Cells were then washed with PBS, then resuspended in 250 µL of PBS before being analysed on a CytoFLEX Platform flow cytometer (Beckman Coulter, Brea, CA, USA). We used 20,000 events per sample to calculate mean fluorescence intensity per cell and ultimately ROS accumulation per sample and normalised to TGF-β controls.
4.8. Nrf2 Activity Assay
The ARE Reporter Kit (BPS Bioscience, San Diego, CA, USA) was used to study total Nrf2 activity according to manufacturer’s instructions. Briefly, 10,000 LX2 cells were seeded overnight in a white, clear-bottom, 96-well plate (NUNC, Rochester, NY, USA), then transfected with ARE Reporter plasmid or Negative Control Reporter plasmid using lipofectamine 2000 (Invitrogen, Waltham, MA, USA). Cells were then left to recover for 24 h at 37 °C. Cells were then treated with 2 ng/mL TGF-β and appropriate NPs for 24 h before luciferase activity was measured using a Dual-Luciferase Reporter Assay System (St. Louis, MO, Promega, USA) on a 96-well plate reader (Tecan, Männedorf, Switzerland) and data normalised to TGF-β controls.
4.9. Immunoblots
Overnight, 600,000 LX2 cells were seeded in a 60 mm dish and treated with 2 ng/mL TGF-β and appropriate NPs for 24 h. Total cell proteins were extracted with radioimmunoprecipitation assay (RIPA) buffer supplemented with protease inhibitors aprotinin, sodium orthovanadate, sodium fluoride and phenylmethylsulfonyl fluoride (PMSF). For blots investigating autophagic flux, chloroquine was used to inhibit autophagy to permit the calculation of autophagic flux. Treatment media was removed 4 h before the incubation period ended, and replaced with fresh media containing 40 µM of chloroquine, before total cell proteins were extracted as above. Protein concentration was determined using the Pierce BCA Protein Assay Kit (Thermo Fisher Scientific, Waltham, MA, USA) according to the manufacturer’s instructions. We loaded 20–30 µg of protein per sample on 10% or 15% SDS-polyacrylamide gels (PAGE). Samples for denaturing gels were mixed with 6X SDS loading dye and boiled at 95 °C for 5 min before loading. Samples for native gels were mixed with native sample buffer (Bio-Rad, Hercules, CA, USA) and loaded. Gels were run at 100 V before being transferred to polyvinylidene fluoride (PVDF) membranes using a wet transfer system (Bio-Rad, Hercules, CA, USA). Membranes were then blocked with 5% BSA in tris-borate saline buffer with 0.1% tween-20 before being probed overnight at 4 °C with primary antibodies, and subsequently probed with the appropriate species-specific horseradish peroxidase (HRP)-conjugated secondary antibody for 1 h at room temperature. Blots were developed with Pierce ECL Western Blotting Substrate (Thermo Fisher Scientific, Waltham, MA, USA) and imaged on a G:BOX Chemi XX6 system (Syngene, Bangalore, India). Relative band intensities to GAPDH were calculated using ImageJ [63] and plotted using Graphpad Prism (San Diego, California, USA).
The antibodies used in this study include anti-GAPDH antibody (#5174, Cell Signaling Technology, Danvers, MA, USA), anti-phos-Smad2/3 (#8828S, Cell Signaling Technology, Danvers, MA, USA), anti-Smad2/3 (#8685S, Cell Signaling Technology, USA), anti-Smad4 (#38454S, Cell Signaling Technology, USA), anti-collagen I (ab34710, ABCAM, Cambridge, UK), anti-Smooth Muscle Actin (M0851, Dako, Glostrup, Denmark), anti-microtubule-associated proteins 1A/1B light chain 3B (LC3B) (#2775S, Cell Signaling Technology, Danvers, MA, USA), anti-p62 (ab56416, ABCAM, Cambridge, UK), anti-NQO1 (#62262, Cell Signaling Technology, Danvers, MA, USA). Our phosphorylated Smad2/3 antibody recognises the Ser465/467 site on Smad2 and the Ser423/425 site on Smad3.
4.10. RNA Extraction, cDNA Synthesis and Real-Time PCR
Overnight, 200,000 LX2 cells per well were seeded in six-well plates and treated with 2 ng/mL TGF-β and appropriate NPs for 24 h. RNA was extracted using trizol (Invitrogen, Waltham, MA, USA), according to manufacturer’s instructions. We used 750 ng of RNA per sample to synthesise complementary DNA (cDNA) using Superscript II (Invitrogen, USA). Expression levels of target genes were determined using Green-2-Go qPCR mix (BioBasic, Toronto, Canada) on a CFX96 real-time PCR machine (Bio-Rad, Hercules, CA, USA). CT values were calculated using the CFX96 software. Gene expression was normalised to glyceraldehyde-3-phosphate dehydrogenase (GAPDH) mRNA expression using the comparative ΔΔCt method and plotted using Graphpad Prism (San Diego, CA, USA). The following primers were used: GAPDH: 5′-ACTTTGGTATCGTGGAAGGACT-3 (forward) and 5-GTAGAGGCAGGGATGATGTTCT-3′ (reverse) [31]; Col-I: 5′-CCTGGATGCCATCAAAGTCT-3′ (forward) and 5-CGCCATACTCGAACTGGAAT-3′ (reverse) [31]; α-SMA: 5-CCGGGAGAAAATGACTCAAA-3′ (forward) and 5-GCAAGGCATAGCCCTCATAG-3′ (reverse) [31]; E-cad: 5- AATTCCTGCCATTCTGGGGA-3′ (forward) and 5′- TCTTCTCCGCCTCCTTCTTC-3′ (reverse) [31]; and N-cad: 5′-TGAGCCTGAAGCCAACCTTA-3′ (forward) and 5′-AGGTCCCCTGGAGTTTTCTG-3′ (reverse) [31]; MMP1: 5′-CAGAGATGAAGTCCGGTTTTTC-3′ (forward) and 5′-GGGGTATCCGTGTAGCACAT-3′ (reverse) [64]; TIMP2: 5′-GAGCCTGAACCACAGGTACCA-3′ (forward) and 5′-TCTGTGACCCAGTCCATCCA-3′ (reverse) [65].
4.11. Caspase 3/7 Activity Assay
Caspase 3/7 activity was determined using the Caspase 3/7-GLO assay kit (Promega, Madison, WI, USA). Overnight, 10,000 cells were seeded in a white, 96-well plate and treated with 2 ng/mL TGF-β and appropriate NPs for 24 h. Each treatment was performed in triplicate. Cells were subsequently treated with Caspase 3/7-GLO assay reagents according to manufacturer’s instructions. Luminescence was measured on a microplate reader (Tecan, Männedorf, Switzerland) and data normalised to TGF-β controls.
4.12. Statistical Analysis
All experiments were performed in at least three replicates (n = 3). One-way ANOVA followed by Dunnett’s multiple comparisons test was performed using GraphPad Prism version 8.0.0 for Windows, GraphPad Software (San Diego, CA, USA), www.graphpad.com accessed on 11 February 2021. Error bars represent standard error of the mean. Statistical significance was set at p ≤ 0.05.
Supplementary Materials
The following are available online at https://www.mdpi.com/article/10.3390/ijms222111777/s1.
Author Contributions
Conceptualization, A.B. and H.K.H.; methodology, A.B. and H.K.H.; validation, A.B. and H.K.H.; formal analysis, A.B.; investigation, A.B., S.Q.L. and S.B.; resources, H.K.H.; data curation, A.B.; writing–original draft preparation, A.B.; writing–review and editing, A.B., S.Q.L., S.B. and H.K.H.; visualization, A.B.; supervision, H.K.H.; project administration, A.B. and H.K.H.; funding acquisition, A.B. and H.K.H. All authors have read and agreed to the published version of the manuscript.
Funding
This research was funded by Ministry of Education (MOE), grant numbers R-148-000-295-114 and R-148-000-318-114.
Institutional Review Board Statement
Not applicable.
Informed Consent Statement
Not applicable.
Data Availability Statement
Not applicable.
Acknowledgments
The authors thank the Electron Microscopy Unit (https://medicine.nus.edu.sg/msc/electron-microscopy-unit/; accessed on 28 October 2021) and the Medicine Confocal Microscopy Unit at the National University of Singapore for their support and assistance in the EM work and confocal imaging respectively.
Conflicts of Interest
The authors declare no conflict of interest.
References
- Tsuchida, T.; Friedman, S.L. Mechanisms of hepatic stellate cell activation. Nat. Rev. Gastroenterol. Hepatol. 2017, 14, 397–411. [Google Scholar] [CrossRef]
- Friedman, S.L.; Neuschwander-Tetri, B.A.; Rinella, M.; Sanyal, A.J. Mechanisms of NAFLD development and therapeutic strategies. Nat. Med. 2018, 24, 908–922. [Google Scholar] [CrossRef]
- Bansal, R.; Nagórniewicz, B.; Prakash, J. Clinical advancements in the targeted therapies against liver fibrosis. Mediat. Inflamm. 2016, 2016, 1–16. [Google Scholar] [CrossRef]
- Schuppan, D.; Ashfaq-Khan, M.; Yang, A.T.; Kim, Y.O. Liver fibrosis: Direct antifibrotic agents and targeted therapies. Matrix Biol. 2018, 68–69, 435–451. [Google Scholar] [CrossRef]
- Boey, A.; Ho, H.K. All roads lead to the liver: Metal nanoparticles and their implications for liver health. Small 2020, 16, e2000153. [Google Scholar] [CrossRef]
- Elsaesser, A.; Howard, C.V. Toxicology of nanoparticles. Adv. Drug Deliv. Rev. 2012, 64, 129–137. [Google Scholar] [CrossRef]
- Das, S.; Dowding, J.M.; Klump, K.E.; McGinnis, J.F.; Self, W.; Seal, S. Cerium oxide nanoparticles: Applications and prospects in nanomedicine. Nanomedicine 2013, 8, 1483–1508. [Google Scholar] [CrossRef]
- Korsvik, C.; Patil, S.; Seal, S.; Self, W.T. Superoxide dismutase mimetic properties exhibited by vacancy engineered ceria nanoparticles. Chem. Commun. 2007, 1056–1058. [Google Scholar] [CrossRef]
- Baldim, V.; Bedioui, F.; Mignet, N.; Margaill, I.; Berret, J.-F. The enzyme-like catalytic activity of cerium oxide nanoparticles and its dependency on Ce3+ surface area concentration. Nanoscale 2018, 10, 6971–6980. [Google Scholar] [CrossRef] [Green Version]
- Xu, C.; Qu, X. Cerium oxide nanoparticle: A remarkably versatile rare earth nanomaterial for biological applications. NPG Asia Mater. 2014, 6, e90. [Google Scholar] [CrossRef]
- Estevez, A.Y.; Erlichman, J.S. The potential of cerium oxide nanoparticles (nanoceria) for neurodegenerative disease therapy. Nanomedicine 2014, 9, 1437–1440. [Google Scholar] [CrossRef] [Green Version]
- Rzigalinski, B.A.; Carfagna, C.S.; Ehrich, M. Cerium oxide nanoparticles in neuroprotection and considerations for efficacy and safety. Wiley Interdiscip. Rev. Nanomed. Nanobiotechnol. 2017, 9, e1444. [Google Scholar] [CrossRef] [PubMed]
- Kim, C.K.; Kim, T.; Choi, I.-Y.; Soh, M.; Kim, D.; Kim, Y.-J.; Jang, H.; Yang, H.-S.; Kim, J.Y.; Park, H.-K.; et al. Ceria nanoparticles that can protect against ischemic stroke. Angew. Chem. Int. Ed. 2012, 51, 11039–11043. [Google Scholar] [CrossRef]
- Kyosseva, S.V.; Kyosseva, S.V. Cerium oxide nanoparticles as promising ophthalmic therapeutics for the treatment of retinal diseases. World J. Ophthalmol. 2015, 5, 23. [Google Scholar] [CrossRef]
- Casals, E.; Zeng, M.; Parra-Robert, M.; Fernández-Varo, G.; Morales-Ruiz, M.; Jiménez, W.; Puntes, V.; Casals, G. Cerium oxide nanoparticles: Advances in biodistribution, toxicity, and preclinical exploration. Small 2020, 16, e1907322. [Google Scholar] [CrossRef] [PubMed]
- Li, D.; Morishita, M.; Wagner, J.G.; Fatouraie, M.; Wooldridge, M.; Eagle, W.E.; Barres, J.; Carlander, U.; Emond, C.; Jolliet, O. In vivo biodistribution and physiologically based pharmacokinetic modeling of inhaled fresh and aged cerium oxide nanoparticles in rats. Part. Fibre Toxicol. 2015, 13, 45. [Google Scholar] [CrossRef] [Green Version]
- Yokel, R.A.; Tseng, M.T.; Dan, M.; Unrine, J.; Graham, U.M.; Wu, P.; Grulke, E.A. Biodistribution and biopersistence of ceria engineered nanomaterials: Size dependence. Nanomed. Nanotechnol. Biol. Med. 2013, 9, 398–407. [Google Scholar] [CrossRef]
- Geraets, L.; Oomen, A.G.; Schroeter, J.D.; Coleman, V.; Cassee, F.R. Tissue Distribution of inhaled micro- and nano-sized cerium oxide particles in rats: Results from a 28-day exposure study. Toxicol. Sci. 2012, 127, 463–473. [Google Scholar] [CrossRef] [PubMed]
- Hirst, S.M.; Karakoti, A.; Singh, S.; Self, W.; Tyler, R.; Seal, S.; Reilly, C.M. Bio-distribution and in vivo antioxidant effects of cerium oxide nanoparticles in mice. Environ. Toxicol. 2013, 28, 107–118. [Google Scholar] [CrossRef]
- Molina, R.M.; Konduru, N.V.; Jimenez, R.J.; Pyrgiotakis, G.; Demokritou, P.; Wohlleben, W.; Brain, J.D. Bioavailability, distribution and clearance of tracheally instilled, gavaged or injected cerium dioxide nanoparticles and ionic cerium. Environ. Sci. Nano 2014, 1, 561–573. [Google Scholar] [CrossRef]
- Tseng, M.T.; Lu, X.; Duan, X.; Hardas, S.S.; Sultana, R.; Wu, P.; Unrine, J.M.; Graham, U.; Butterfield, D.A.; Grulke, E.A.; et al. Alteration of hepatic structure and oxidative stress induced by intravenous nanoceria. Toxicol. Appl. Pharmacol. 2012, 260, 173–182. [Google Scholar] [CrossRef]
- Tseng, M.T.; Fu, Q.; Lor, K.; Fernandez-Botran, G.R.; Deng, Z.-B.; Graham, U.; Butterfield, D.A.; Grulke, E.A.; Yokel, R. Persistent hepatic structural alterations following nanoceria vascular infusion in the rat. Toxicol. Pathol. 2014, 42, 984–996. [Google Scholar] [CrossRef] [PubMed]
- Adebayo, O.A.; Akinloye, O.; Adaramoye, O.A. Cerium oxide nanoparticles attenuate oxidative stress and inflammation in the liver of diethylnitrosamine-treated mice. Biol. Trace Elem. Res. 2020, 193, 214–225. [Google Scholar] [CrossRef]
- Córdoba-Jover, B.; Arce-Cerezo, A.; Ribera, J.; Pauta, M.; Oró, D.; Casals, G.; Fernández-Varo, G.; Casals, E.; Puntes, V.; Jiménez, W.; et al. Cerium oxide nanoparticles improve liver regeneration after acetaminophen-induced liver injury and partial hepatectomy in rats. J. Nanobiotechnol. 2019, 17, 1–12. [Google Scholar] [CrossRef]
- Ibrahim, H.G.; Attia, N.; Hashem, F.E.Z.A.; El Heneidy, M.A. Cerium oxide nanoparticles: In pursuit of liver protection against doxorubicin-induced injury in rats. Biomed. Pharmacother. 2018, 103, 773–781. [Google Scholar] [CrossRef]
- Sangomla, S.; Saifi, M.A.; Khurana, A.; Godugu, C. Nanoceria ameliorates doxorubicin induced cardiotoxicity: Possible mitigation via reduction of oxidative stress and inflammation. J. Trace Elements Med. Biol. 2018, 47, 53–62. [Google Scholar] [CrossRef] [PubMed]
- Oró, D.; Yudina, T.; Fernández-Varo, G.; Casals, E.; Reichenbach, V.; Casals, G.; de la Presa, B.G.; Sandalinas, S.; Carvajal, S.; Puntes, V.; et al. Cerium oxide nanoparticles reduce steatosis, portal hypertension and display anti-inflammatory properties in rats with liver fibrosis. J. Hepatol. 2016, 64, 691–698. [Google Scholar] [CrossRef]
- Kobyliak, N.; Virchenko, O.; Falalyeyeva, T.; Kondro, M.; Beregova, T.; Bodnar, P.; Shcherbakov, O.; Bubnov, R.; Caprnda, M.; Delev, D.; et al. Cerium dioxide nanoparticles possess anti-inflammatory properties in the conditions of the obesity-associated NAFLD in rats. Biomed. Pharmacother. 2017, 90, 608–614. [Google Scholar] [CrossRef]
- Carvajal, S.; Perramón, M.; Oró, D.; Casals, E.; Fernández-Varo, G.; Casals, G.; Parra, M.; de la Presa, B.G.; Ribera, J.; Pastor, Ó.; et al. Cerium oxide nanoparticles display antilipogenic effect in rats with non-alcoholic fatty liver disease. Sci. Rep. 2019, 9, 12848. [Google Scholar] [CrossRef] [Green Version]
- Fernández-Varo, G.; Perramón, M.; Carvajal, S.; Oró, D.; Casals, E.; Boix, L.; Oller, L.; Macías-Muñoz, L.; Marfà, S.; Casals, G.; et al. Bespoken nanoceria: An effective treatment in experimental hepatocellular carcinoma. Hepatology 2020, 72, 1267–1282. [Google Scholar] [CrossRef] [Green Version]
- Peng, F.; Tee, J.K.; Setyawati, M.I.; Ding, X.; Yeo, H.L.A.; Tan, Y.L.; Leong, D.T.; Ho, H.K. Inorganic nanomaterials as highly efficient inhibitors of cellular hepatic fibrosis. ACS Appl. Mater. Interfaces 2018, 10, 31938–31946. [Google Scholar] [CrossRef]
- Bashandy, S.A.; Alaamer, A.; Moussa, S.; Omara, E.A. Role of zinc oxide nanoparticles in alleviating hepatic fibrosis and nephrotoxicity induced by thioacetamide in rats. Can. J. Physiol. Pharmacol. 2018, 96, 337–344. [Google Scholar] [CrossRef] [Green Version]
- Shalby, A.; El-Maksoud, M.; Moneim, A.; Ahmed, H. Antifibrotic candidates of Selenium nanoparticles and selenium in the experimental model. J. Appl. Pharm. Sci. 2017, 7, 191–198. [Google Scholar] [CrossRef] [Green Version]
- Xu, L.; Hui, A.Y.; Albanis, E.; Arthur, M.J.; O’Byrne, S.M.; Blaner, W.S.; Mukherjee, P.; Friedman, S.L.; Eng, F.J. Human hepatic stellate cell lines, LX-1 and LX-2: New tools for analysis of hepatic fibrosis. Gut 2005, 54, 142–151. [Google Scholar] [CrossRef] [Green Version]
- Patil, S.; Sandberg, A.; Heckert, E.; Self, W.; Seal, S. Protein adsorption and cellular uptake of cerium oxide nanoparticles as a function of zeta potential. Biomaterials 2007, 28, 4600–4607. [Google Scholar] [CrossRef] [PubMed] [Green Version]
- Iimuro, Y.; Nishio, T.; Morimoto, T.; Nitta, T.; Stefanovic, B.; Choi, S.K.; Brenner, D.; Yamaoka, Y. Delivery of matrix metalloproteinase-1 attenuates established liver fibrosis in the rat. Gastroenterology 2003, 124, 445–458. [Google Scholar] [CrossRef]
- Arpino, V.; Brock, M.; Gill, S.E. The role of TIMPs in regulation of extracellular matrix proteolysis. Matrix Biol. 2015, 44–46, 247–254. [Google Scholar] [CrossRef]
- Thoen, L.F.; Guimarães, E.L.; Dollé, L.; Mannaerts, I.; Najimi, M.; Sokal, E.; van Grunsven, L. A role for autophagy during hepatic stellate cell activation. J. Hepatol. 2011, 55, 1353–1360. [Google Scholar] [CrossRef]
- Mizushima, N.; Yoshimori, T. How to interpret LC3 immunoblotting. Autophagy 2007, 3, 542–545. [Google Scholar] [CrossRef]
- Tanida, I.; Ueno, T.; Kominami, E. LC3 and autophagy. Methods Mol. Biol. 2008, 445, 77–88. [Google Scholar] [CrossRef]
- Lippai, M.; Lőw, P. The role of the selective adaptor p62 and ubiquitin-like proteins in autophagy. BioMed Res. Int. 2014, 2014, 832704. [Google Scholar] [CrossRef] [Green Version]
- Ramos-Tovar, E.; Muriel, P. Molecular mechanisms that link oxidative stress, inflammation, and fibrosis in the liver. Antioxidants 2020, 9, 1279. [Google Scholar] [CrossRef]
- Galicia-Moreno, M.; Favari, L.; Muriel, P. Antifibrotic and antioxidant effects of N-acetylcysteine in an experimental cholestatic model. Eur. J. Gastroenterol. Hepatol. 2012, 24, 179–185. [Google Scholar] [CrossRef]
- Mata-Santos, H.A.; Dutra, F.F.; Rocha, C.C.; Lino, F.G.; Xavier, F.R.; Chinalia, L.A.; Hossy, B.H.; Castelo-Branco, M.T.L.; Teodoro, A.J.; Paiva, C.N.; et al. Silymarin reduces profibrogenic cytokines and reverses hepatic fibrosis in chronic murine schistosomiasis. Antimicrob. Agents Chemother. 2014, 58, 2076–2083. [Google Scholar] [CrossRef] [Green Version]
- Zhao, X.-A.; Chen, G.-M.; Liu, Y.; Chen, Y.-X.; Wu, H.-Y.; Chen, J.; Xiong, Y.-L.; Tian, C.; Wang, G.-Y.; Jia, B.; et al. Inhibitory effect of silymarin on CCl4-induced liver fibrosis by reducing Ly6Chi monocytes infiltration. Int. J. Clin. Exp. Pathol. 2017, 10, 11941–11951. [Google Scholar]
- Ma, Q. Role of Nrf2 in oxidative stress and toxicity. Annu. Rev. Pharmacol. Toxicol. 2013, 53, 401–426. [Google Scholar] [CrossRef] [Green Version]
- Ross, D.; Siegel, D. Functions of NQO1 in cellular protection and CoQ10 metabolism and its potential role as a redox sensitive molecular switch. Front. Physiol. 2017, 8, 595. [Google Scholar] [CrossRef]
- Hashem, R.; Rashd, L.A.; Hashem, K.S.; Soliman, H.M. Cerium oxide nanoparticles alleviate oxidative stress and decreases Nrf-2/HO-1 in D-GALN/LPS induced hepatotoxicity. Biomed. Pharmacother. 2015, 73, 80–86. [Google Scholar] [CrossRef]
- Rubio, L.; Annangi, B.; Vila, L.; Hernandez, A.; Marcos, R. Antioxidant and anti-genotoxic properties of cerium oxide nanoparticles in a pulmonary-like cell system. Arch. Toxicol. 2016, 90, 269–278. [Google Scholar] [CrossRef]
- Carvajal, S.; Perramón, M.; Casals, G.; Oró, D.; Ribera, J.; Morales-Ruiz, M.; Casals, E.; Casado, P.; Melgar-Lesmes, P.; Fernández-Varo, G.; et al. Cerium oxide nanoparticles protect against oxidant injury and interfere with oxidative mediated kinase signaling in human-derived hepatocytes. Int. J. Mol. Sci. 2019, 20, 5959. [Google Scholar] [CrossRef] [Green Version]
- Liu, R.-M.; Desai, L.P. Reciprocal regulation of TGF-β and reactive oxygen species: A perverse cycle for fibrosis. Redox Biol. 2015, 6, 565–577. [Google Scholar] [CrossRef] [Green Version]
- Jiang, F.; Liu, G.-S.; Dusting, G.J.; Chan, E.C. NADPH oxidase-dependent redox signaling in TGF-β-mediated fibrotic responses. Redox Biol. 2014, 2, 267–272. [Google Scholar] [CrossRef] [PubMed] [Green Version]
- Samarakoon, R.; Overstreet, J.M.; Higgins, P.J. TGF-β signaling in tissue fibrosis: Redox controls, target genes and therapeutic opportunities. Cell. Signal. 2013, 25, 264–268. [Google Scholar] [CrossRef] [PubMed] [Green Version]
- Corsi, F.; Caputo, F.; Traversa, E.; Ghibelli, L. Not only redox: The multifaceted activity of cerium oxide nanoparticles in cancer prevention and therapy. Front. Oncol. 2018, 8, 309. [Google Scholar] [CrossRef] [Green Version]
- Graham, U.M.; Yokel, R.A.; Dozier, A.K.; Drummy, L.; Mahalingam, K.; Tseng, M.T.; Birch, E.; Fernback, J. Analytical high-resolution electron microscopy reveals organ-specific nanoceria bioprocessing. Toxicol. Pathol. 2017, 46, 47–61. [Google Scholar] [CrossRef]
- Bartneck, M.; Warzecha, K.T.; Tacke, F. Therapeutic targeting of liver inflammation and fibrosis by nanomedicine. Hepatobiliary Surg. Nutr. 2014, 3, 364–376. [Google Scholar] [CrossRef] [PubMed]
- Sulthana, S.; Banerjee, T.; Kallu, J.; Vuppala, S.R.; Heckert, B.; Naz, S.; Shelby, T.; Yambem, O.; Santra, S. Combination therapy of NSCLC using Hsp90 inhibitor and doxorubicin carrying functional nanoceria. Mol. Pharm. 2017, 14, 875–884. [Google Scholar] [CrossRef] [PubMed]
- Suk, J.S.; Xu, Q.; Kim, N.; Hanes, J.; Ensign, L.M.; Sciences, H.; Sciences, M. PEGylation as a strategy for improving nanoparticle-based drug and gene delivery. Adv. Drug Deliv. Rev. 2016, 99, 28–51. [Google Scholar] [CrossRef] [PubMed] [Green Version]
- Qie, Y.; Yuan, H.; von Roemeling, C.; Chen, Y.; Liu, X.; Shih, K.D.; Knight, J.A.; Tun, H.W.; Wharen, R.E.; Jiang, W.; et al. Surface modification of nanoparticles enables selective evasion of phagocytic clearance by distinct macrophage phenotypes. Sci. Rep. 2016, 6, 26269. [Google Scholar] [CrossRef] [PubMed] [Green Version]
- Bhargava, K.; Arya, A.; Gangwar, A.; Singh, S.K.; Roy, M.; Das, M.; Sethy, N.K. Cerium oxide nanoparticles promote neurogenesis and abrogate hypoxia-induced memory impairment through AMPK–PKC–CBP signaling cascade. Int. J. Nanomed. 2016, 11, 1159–1173. [Google Scholar] [CrossRef] [Green Version]
- Ma, J.Y.; Mercer, R.R.; Barger, M.; Schwegler-Berry, D.; Scabilloni, J.; Ma, J.K.; Castranova, V. Induction of Pulmonary Fibrosis by Cerium Oxide Nanoparticles. Toxicol. Appl. Pharmacol. 2012, 262, 255–264. [Google Scholar] [CrossRef] [PubMed] [Green Version]
- Ma, J.; Bishoff, B.; Mercer, R.R.; Barger, M.; Schwegler-Berry, D.; Castranova, V. Role of Epithelial Mesenchymal Transition (EMT) and Fibroblast Function in Cerium Oxide Nanoparticles-Induced Lung Fibrosis. Toxicol. Appl. Pharmacol. 2017, 323, 16–25. [Google Scholar] [CrossRef]
- Schneider, C.A.; Rasband, W.S.; Eliceiri, K.W. NIH image to ImageJ: 25 years of image analysis. Nat. Methods 2012, 9, 671–675. [Google Scholar] [CrossRef] [PubMed]
- Markiewicz, L.; Pytel, D.; Mucha, B.; Szymanek, K.; Szaflik, J.; Szaflik, J.P.; Majsterek, I. Altered expression levels of MMP1, MMP9, MMP12, TIMP1, and IL-1β as a risk factor for the elevated IOP and optic nerve head damage in the primary open-angle glaucoma patients. BioMed Res. Int. 2015, 2015, 1–8. [Google Scholar] [CrossRef] [PubMed] [Green Version]
- Sahlin, L.; Stjernholm-Vladic, Y.; Roos, N.; Masironi, B.; Ekman-Ordeberg, G. Impaired leukocyte influx in cervix of postterm women not responding to prostaglandin priming. Reprod. Biol. Endocrinol. 2008, 6, 36. [Google Scholar] [CrossRef] [PubMed] [Green Version]
Publisher’s Note: MDPI stays neutral with regard to jurisdictional claims in published maps and institutional affiliations. |
© 2021 by the authors. Licensee MDPI, Basel, Switzerland. This article is an open access article distributed under the terms and conditions of the Creative Commons Attribution (CC BY) license (https://creativecommons.org/licenses/by/4.0/).