Abstract
Multifactorial metabolic diseases, such as non-alcoholic fatty liver disease, are a major burden to modern societies, and frequently present with no clearly defined molecular biomarkers. Herein we used system medicine approaches to decipher signatures of liver fibrosis in mouse models with malfunction in genes from unrelated biological pathways: cholesterol synthesis—Cyp51, notch signaling—Rbpj, nuclear factor kappa-light-chain-enhancer of activated B cells (NF-κB) signaling—Ikbkg, and unknown lysosomal pathway—Glmp. Enrichment analyses of Kyoto Encyclopedia of Genes and Genomes (KEGG), Reactome and TRANScription FACtor (TRANSFAC) databases complemented with genome-scale metabolic modeling revealed fibrotic signatures highly similar to liver pathologies in humans. The diverse genetic models of liver fibrosis exposed a common transcriptional program with activated estrogen receptor alpha (ERα) signaling, and a network of interactions between regulators of lipid metabolism and transcription factors from cancer pathways and the immune system. The novel hallmarks of fibrosis are downregulated lipid pathways, including fatty acid, bile acid, and steroid hormone metabolism. Moreover, distinct metabolic subtypes of liver fibrosis were proposed, supported by unique enrichment of transcription factors based on the type of insult, disease stage, or potentially, also sex. The discovered novel features of multifactorial liver fibrotic pathologies could aid also in improved stratification of other fibrosis related pathologies.
1. Introduction
Fibrosis is a common feature of skin, lung, kidney, and liver diseases; however, it can affect virtually every organ. It is characterized by excessive deposition of connective tissue components, which leads to tissue remodeling and organ malfunction. High mortality is associated with fibrotic diseases. The progress in development of anti-fibrotic drugs is slow, especially for individual fibrotic diseases where mechanisms are not clear. There is a need to unravel the core fibrotic pathways across different fibrotic diseases, as well as across the same type of fibrotic disease that can arise from a multitude of causes. It is believed that, in addition to common fibrotic programs, other factors influencing fibrotic disease susceptibility may be distinct, with disease-specific and organ-specific risk factors [1].
Liver fibrosis is a characteristic of the progressive liver pathologies defined by accumulation of collagen, smooth-muscle actin, hydroxyproline, etc., and is one of the hallmarks of the advanced stages of non-alcoholic fatty liver disease (NAFLD), currently called metabolism-associated fatty liver disease (MAFLD). This is a multifactorial disease with variable etiology and no clearly defined molecular biomarkers for diagnosis, prognosis, or progression [2]. The advanced disease stages include non-alcoholic steatohepatitis (NASH) and cirrhosis, both potentially leading to liver cancer. The prevalence and hence the burden of the disease is increasing because of the lack of approved pharmacotherapies and low impact of prevention strategies [3]. In animal models, liver fibrosis is a result of a chronic liver injury induced by different factors, which range from alcohol, diets, toxins, drugs, bile duct ligation, genetic modifications, and others. Each type of liver injury activates a specific program at cellular and molecular levels [4], and if sustained, disease progresses to further stages [5].
In humans, NAFLD and NASH have many faces, as clinical manifestations are highly heterogeneous [6]. Cirrhosis may or may not be present; not all patients show abnormal blood parameters; comorbidities, such as diabetes and obesity, vary, and the presence of fibrosis and steatosis is not uniform. Clinical drug trials consistently show that targeting NAFLD histological features does not always result in disease resolution. For example, reduction of steatosis did not improve other histological outcomes of NAFLD [7] and elevated steatosis did not always associate with worsening of fibrosis [8]. All of this indicates that there are potentially different subtypes of NAFLD patients. In concordance, a recent study identified three NAFLD subtypes in relation to methionine/folate cycle, according to serum metabolite signature, also predicting the progression to NASH [9]. The latest recommendation was a subcategorization of NASH patients to identify those who will be best suited for specific treatments in clinical trials [8].
As resolution of fibrosis is one of the endpoints of clinical trials, we can benefit from a variety of mouse models that develop progressive fibrosis similarly to humans. In our previous work, we discovered that hepatocyte-specific Cyp51 (cytochrome P450 or lanosterol 14α-demethylase) knockout (LKO) males and females develop liver fibrosis (without steatosis or cholestasis) due to blockage of cholesterol synthesis [10]. Among metabolic alterations were: deregulated sterol intermediates, decrease in hepatic cholesterol and its esters, modified bile acid composition, and elevated plasma total cholesterol and high-density lipoprotein (HDL) in a sex-specific manner. Similarly, the whole-body knockout (KO) of Glmp (glycosylated lysosomal membrane protein) presented with liver fibrosis although the function of this lysosomal protein, remains to be clarified [11]. Among metabolic alterations in Glmp KO mice are increased liver bile acids and infiltration of inflammatory cells [12]. Decreased blood glucose, triglycerides (TAG) and non-esterified fatty acids were also observed, together with increased liver TAGs, although liver steatosis was not confirmed histologically [13].
As two such different KO models both result in a similar liver phenotype, we hypothesized that it might be possible to determine a common fibrotic signature from multiple mouse models. We focused on single gene knockouts that develop histologically confirmed liver fibrosis (with or without steatosis or cholestasis) without additional dietary or chemical insults, preferably in both sexes, and with well annotated transcriptome data. In addition to Cyp51, LKO, and Glmp KO, the fibrotic phenotype also develops in the liver knockout of a notch signaling pathway repressor Rbpj (recombination signal binding protein for immunoglobulin kappa J region) due to impaired bile duct maturation causing obstructive bile acid flow, accumulation of bile acids, necrosis, and severe cholestasis with progression to hepatocellular carcinoma (HCC) [14]. Fibrosis is also a feature of the hepatocyte-specific Ikbkg (Nemo, Inhibitor of kappa B kinase gamma) knockout males with steatohepatitis and HCC through changing the response to inflammation [15]. Increased oxidative stress was present, mitochondria appeared to be affected, irregular glycogen deposits were observed, and serum glucose was decreased while serum TAG and cholesterol levels were unchanged [16].
We aimed to study the fibrotic signatures of both sexes; however, only the Cyp51 LKO transcriptome data also include females. Using functional comparative analysis of gene expression based on Kyoto Encyclopedia of Genes and Genomes (KEGG), Reactome and TRANScription FACtor (TRANSFAC) databases, as well as genome-scale metabolic models (GEMs), we could identify multiple common fibrotic transcriptome signatures, with high similarity to human NAFLD and NASH. The hallmark is downregulation of metabolic pathways and upregulation of immune system-related pathways and pathways in cancer. We provide also new insights into the function of GLMP in the liver and propose “universal” fibrosis-related biomarkers with some sex dependencies.
2. Results
2.1. Similar Transcriptome Alterations Caused by Different Genetic Defects
The characteristics of genetic mouse models are summarized in Table S1. They were all adult males with C57BL/6J genetic background, in addition to a group of Cyp51 LKO females, with histologically confirmed fibrosis, increased inflammation (except Rbpj LKO where it was not measured), and final progression to liver tumors or dysplastic nodules. The Cyp51 LKO and Glmp KO did not present with histological steatosis and cholestasis. We analyzed the liver transcriptome data and compared the differentially expressed genes (DEGs) between these genetic models of fibrosis (Table S2). At the intersection, we observed a higher number of upregulated (59) than downregulated genes (3) (Figure 1). A higher percentage of upregulated genes was common also when we compared the overlap of DEGs between each pair of fibrotic models (Table S3). Clustering analyses of 62 common DEGs showed that the most similar models are Cyp51 F and M LKO and Ikbkg LKO (Figure S1). From the common DEGs, the majority have a function at the plasma membrane or extracellular space or are involved in immune response pathways, among them Tgfbr2, Tgfbi from TGF-β (Transforming growth factor beta) signaling, and the lipoprotein lipase (Figure 2A). TGFBI (Transforming growth factor beta induced) was recently confirmed to be strongly associated with NAFLD and cirrhosis in humans [17]. These results lead us to a conclusion that the common transcriptional program of liver fibrosis is largely represented in the set of upregulated genes, while downregulation of genes is more associated with the unique program probably related to the type of the insult, disease stage or sex. Additionally, the overlap in DEGs is affected by different biological variables of the models (age and stage of the disease). We could not exclude effects of technical factors, such as RNA isolation, type of microarrays, etc. Therefore, we focused on pathway analyses, which are less sensitive to such effects compared to expression of individual genes.
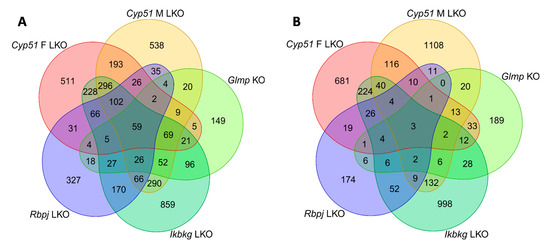
Figure 1.
Venn diagrams of differentially expressed genes (DEGs) in mouse genetic models of liver fibrosis. (A) Upregulated DEGs. (B) Downregulated DEGs.
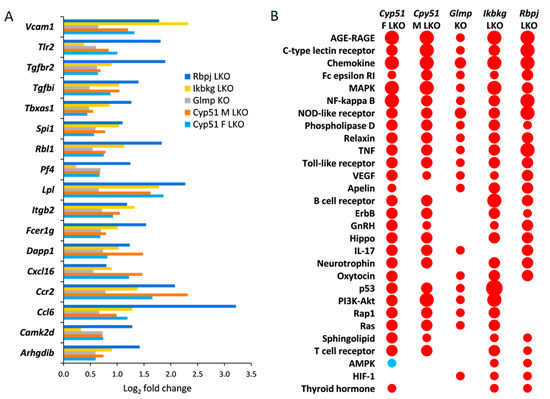
Figure 2.
Common significantly enriched Kyoto Encyclopedia of Genes and Genomes (KEGG) signaling pathways and DEGs. (A). Log2 fold change in expression of selected common DEGs in all fibrotic models. Only DEGs, which are a part of common enriched signaling or metabolic KEGG pathways, are presented. Log2 fold change represents log2 ratio between average knockout (KO) vs. wild type (WT). (B). KEGG signaling pathways common to at least three mouse genetic models of liver fibrosis as calculated using pGSEA (Parametric gene set enrichment analysis)are presented. Red indicates positive enrichment and blue negative. The size of the bubble reflects the fold change of each pathway.
2.2. Common KEGG and Reactome Pathways in Different Fibrotic Models
Positively enriched KEGG (65) and Reactome (52) pathways common to all liver fibrotic models have roles in response to liver injury, repair, hemostasis, cancer, regulation of metabolism, development of fibrosis, and activation of the immune system (Tables S4 and S5). Both pathway analyses confirmed that models are most similar in positively enriched pathways (Table S3). At the intersection of different genetic models, there were many positively enriched KEGG pathways indicating an activation of a common transcriptional program in fibrosis regardless of the type of injury, age, or sex (Figure 2B). Common enriched Reactome and KEGG pathways were, with few exceptions, always enriched in the same direction in the models. One exception was AMPK (AMP-activated protein kinase) signaling, which was positively enriched in Ikbkg LKO and Rbpj LKO, but negatively in female Cyp51 LKO (Figure 2B). Pathway analysis revealed that cellular organelles are affected during progression of fibrosis. For example, peroxisome pathways (Peroxisomal protein import, Peroxisome pathway) and Autophagy were negatively enriched while Lysosome was enriched positively. Interestingly, with exception of Glmp KO and the male Cyp51 LKO, HCC pathway was enriched positively, indicating an early commitment of liver cells towards cancer in these models.
2.3. Mouse Genetic Models Show Overlapping Transcriptome Signatures with Human NAFLD and NASH
It is important to compare the mouse genetic models of hepatic fibrosis to human NAFLD and NASH. We selected a list of enriched KEGG pathways calculated by GSEA (Gene set enrichment analysis) in patients with NAFLD (N = 27) and NASH (N = 25) as presented in Teufel et al. [18], where liver transcriptome data from NAFLD and NASH patients of both sexes were compared to control (N = 39) and healthy obese (N = 25) patients and also to mouse female diet models. In our analyses, we used the Teufel data for direct comparison of our pGSEA (Parametric gene set enrichment analysis) analyses from genetic models with data from patients with NAFLD and NASH (Table S6). There were many common, positively enriched KEGG signaling pathways between mouse genetic models and human NAFLD and NASH, which is in line with a common fibrotic program (Table 1). Interestingly, the genetic fibrotic models had a much higher overlap of enriched KEGG pathways with human NAFLD and NASH compared to dietary mouse models reported in Teufel et al. [18]. This was surprising since in humans, diet is supposed to be a crucial factor in the majority of NAFLD cases. However, we cannot exclude that some of the observed distinctions were not due to differences between humans and mice or due to diet, but might be linked to sex. Our mouse models were of both sexes while Teufel data included NAFLD and NASH patients of both sexes and only female dietary mouse models.

Table 1.
Top enriched KEGG pathways common between genetic mouse models of liver fibrosis and human non-alcoholic fatty liver disease (NAFLD) and non-alcoholic steatohepatitis (NASH) from Teufel et al. [18].
2.4. Negative Enrichment of Metabolic Pathways in Fibrosis
We discovered that negative enrichment of metabolic pathways is a hallmark of fibrosis. From basic metabolism, bile and fatty acids (linoleic), steroid hormone, ketone, butanoate, nitrogen, heme, and branched-chain amino acid-related KEGG and Reactome pathways were enriched negatively in the four genetic fibrotic models (Table 2, Tables S4 and S5). Most importantly, the upstream pathways regulating metabolism were also negatively enriched, such as several nuclear receptors, IGF1R (Insulin like growth factor 1 receptor) and insulin signaling (Table S5). In contrast, Glycosphingolipid and Sphingolipid metabolism and its signaling were positively enriched in all models except Glmp KO. These results indicate that the modulation of metabolic pathways happens regardless of the type of injury, metabolic state, or sex, and also in absence of dietary manipulation.
Table 2.
Selected statistically significantly enriched Reactome pathways from metabolism.
Focusing on more unique pathways and DEGs that are not common among models, we observed distinct changes in metabolism of almost all amino acids, carbohydrates, vitamins, cofactors, and energy metabolism, exposing female Cyp51 LKO and male Ikbkg LKO models as the most affected (Table 2). These results propose specific metabolic programs and the existence of different metabolic subtypes depending on the type of injury, stage of fibrosis or sex. In conclusion, data from genetic fibrotic models exposed a wide array of metabolic rearrangements as the hallmark of the fibrosis program.
2.5. Genome-Scale Metabolic Models Confirmed Rearrangements in Lipid Metabolism Pathways
Since metabolic rearrangements were enriched in pathway analyses, we used GEMs to simulate and predict metabolic fluxes at systems-level using transcriptome data. Figure 3 represents statistically significant changes in GEMs common to at least three models, with the majority involved in fatty acids metabolism (synthesis, oxidation, transport) in different cellular compartments (cytosol, mitochondria, peroxisome). Importantly, several sterol-related GEMs were affected by fibrosis, such as cholesterol and bile acid synthesis, cholesterol esters and steroid metabolism (Figure 3). The levels of liver cholesterol, cholesterol esters and bile acids were decreased in the Cyp51 M LKO model, indicating that similar conditions might be present in other genetic models [10]. Several other lipid pathways were rearranged during fibrosis, such as glycerolipid, glycerophospholipid and sphingolipid pathways. GEM analyses also detected changes in carnitine shuttle, transport reactions and retinol metabolism. Again, each model exhibited a unique combination of metabolic rearrangement. Importantly, the GEM analyses confirmed the global rearrangement of lipid homeostasis as a part of the common program in liver fibrosis. Moreover, GEM analyses indicated that the type of injury defined which cellular compartment was affected and in what way.
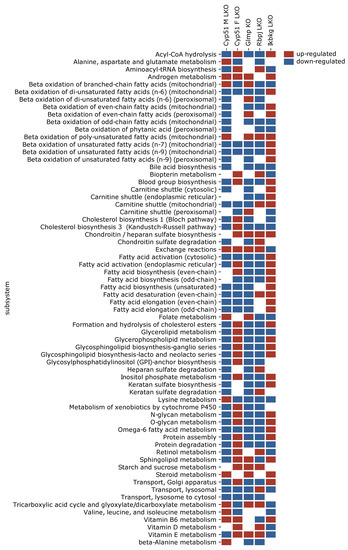
Figure 3.
Statistically significantly perturbed genome-scale metabolic model (GEM) subsystems. Presented are subsystems common to at least three models of liver fibrosis. Red is upregulated, blue is downregulated.
2.6. Enrichment of Transcription Factors Exposed Variability in Metabolic Regulators
Transcription factors (TFs) are upstream regulators of metabolism and are thus upstream of metabolic pathways in KEGG and Reactome, adding another level of understanding. The majority of TFs were positively enriched (Tables S3 and S7). Twenty TFs were enriched in all genetic fibrotic models, among them estrogen receptor alpha (ERα), NF-Y, c-ETS-1, and an additional 16 were common to four S7). All were enriched positively and involved in the regulation of the immune system, cancer, or metabolic or hormone pathways. Several nuclear receptors regulating lipid metabolism and estrogen receptor α were enriched, coinciding with enrichment of Reactome pathways related to estrogen receptor and nuclear receptors (Figure 4A). Cytoscape analysis using the STRING database revealed a network of interactions between the common TFs regulating lipid metabolism and common TFs regulating cancer pathways and the immune system (Figure 4B). It is important to note that the enrichment of TFs regulating lipid metabolism varied among the studied genetic models (Figure 4A). For example, E2F-1 (E2F transcription factor 1), a mediator of sustained lipogenesis and contributor to hepatic steatosis, was enriched positively in Ikbkg LKO and Rbpj LKO, and negatively in Glmp KO, coinciding with histological findings. PPARγ:RXRα (Peroxisome proliferator activated receptor gamma: Retinoid X receptor alpha), RXRα, and VDR (Vitamin D receptor) were positively enriched in at least three models, LXRα (Liver X receptor alpha) and PPARα (Peroxisome proliferator activated receptor alpha) in two to three, while FXR (Farnesoid X receptor) was not enriched at all. Another known lipid regulator is SREBP1 (Sterol regulatory element-binding protein 1), which was positively enriched in Rbpj LKO, and negatively in Ikbkg LKO. These data indicate that the combination of enriched TFs, the regulators of metabolism, could depend on genetic background and could be used to predict the metabolic subtypes of fibrosis.
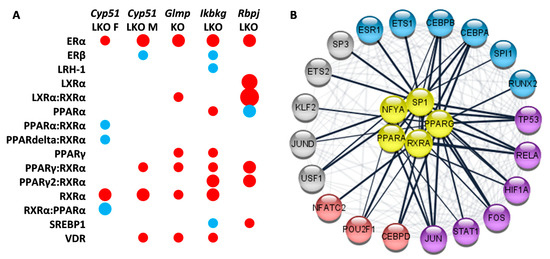
Figure 4.
Selected enriched transcription factors (TFs) in mouse genetic models of liver fibrosis. (A). Model-specific enrichment of nuclear receptors in fibrotic models. Red indicates positive enrichment and blue negative. The size of the bubble reflects the fold change of each pathway. (B). Common enriched transcription factors reveal network-like interactions between regulators of lipid metabolism (yellow) and TFs involved in regulation of cancer pathways (blue and violet) and the immune system (red and violet).
3. Discussion
While it is believed that fibrosis can arise through a multitude of causes, it is nevertheless reasonable to believe that a common “fibrotic program” is hidden beneath that. To address this hypothesis, we used systems medicine approaches and pathway analyses to decipher transcriptome signatures of four genetic mouse models of liver fibrosis, one available in both sexes. In each of these models, a single gene has been knocked out and no dietary or chemical manipulation was used. Malfunction of genes with very different biological roles (cholesterol biosynthesis, notch and nuclear factor kappa-light-chain-enhancer of activated B cells (NF-κB) signaling, and unknown lysosomal membrane protein) resulted in liver fibrosis, which progressed to liver cancer.
Herein we show that despite the different genetic insults, different sex, age, and the disease stage, a common fibrotic transcriptional program was identified (Figure 5). Positively enriched KEGG and Reactome pathways were predominantly involved in the immune system, extracellular matrix, cell-cell communication, hemostasis, and cancer. This common program is very similar to human NAFLD and NASH [18]. Downregulation of fatty acid metabolism and positive enrichment of platelets and hemostasis-related pathways is a hallmark of our data as well as transcriptomes of human NASH [19,20,21,22,23].
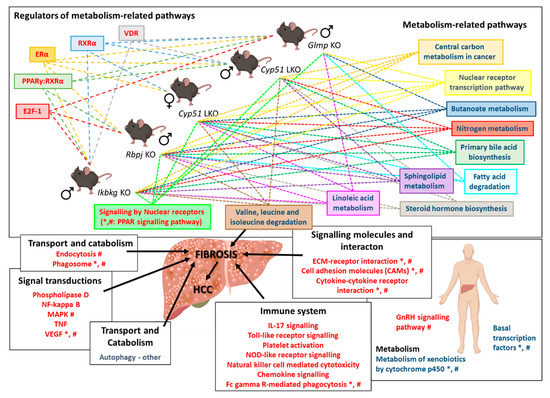
Figure 5.
Scheme of the common transcriptional program in mouse liver fibrotic models. Knocking out a single gene from different unrelated pathways (Cyp51, Rbpj, Ikbkg, and Glmp) leads to downregulation of metabolism-related pathways, regulated by different TFs, and upregulation of signaling pathways, resulting in fibrosis. Mouse transcriptome data from mouse models was compared to human NAFLD and NASH transcriptome data [18]. *—pathways/TFs enriched also in human NAFLD; #—pathways/TFs enriched in human NASH. Blue text color—negatively enriched KEGG/Reactome/TFs; Red text color—positively enriched KEGG/Reactome/TFs. Dashed arrows indicate enriched pathways/TFs in individual liver fibrotic mouse model. Icons are used from the BioRender library.
The negative enrichment of liver metabolic pathways indicates a molecular link between disrupted energy homeostasis and cell cycle control, which could be crucial for the development of NASH-related HCC [24]. Pathway analyses and GEMs detected wide rearrangements in the metabolism of sphingolipids, ketones, bile, linoleic, and fatty acids, as well as branched amino acids in all genetic models of fibrosis. These groups of metabolites present potential serum biomarkers of NAFLD/NASH progression since the changes seem to be independent of the etiology of the disease. Furthermore, they represent potential new diagnostic and prognostic biomarkers of liver diseases in humans (Table 3). Bile acids are an example of a potential common serum biomarker of liver diseases. A potential prognostic biomarker was identified by a metabolomics prospective study where serum fatty acids, including linoleic and α-linoleic acids, were lower before the occurrence of cirrhosis in patients in comparison to healthy controls [25]. The observed model-specific changes in transcriptome signatures could reflect the unique metabolic rearrangements among fibrotic models (Figure 6). For example, the female Cyp51 LKO model has upregulated genes, indicating increase in GM2 ganglioside and decrease in GM3 ganglioside, while the male Cyp51 LKO, Ikbkg LKO and Rbpj LKOs have potentially increased GM3 ganglioside. Overall, it seems very plausible that serum metabolites reflect the stage of liver disease and the patient’s metabolic state, and could enable differentiation of metabolic subtypes of NAFLD, NASH, and beyond. For example, C4 (7-alpha-hydroxy-4-cholesten-3-one), a bile acid intermediate used to assess liver bile acid biosynthesis, was increased in obese NAFLD patients [26], but decreased in lean patients [27]. A combination of serum metabolites could be used for patient stratification in personalized medicine. This is further supported by the fact that also in genetic models of liver fibrosis significant changes in blood and liver metabolites were observed [10,12,13,16,28]. For example, bile acids were increased in serum of Glmp KO, while they were decreased in bile in Cyp51 F and M LKO. A decrease in blood TAG and non-esterified fatty acids was observed in Glmp KO, no change was observed in blood TAG in Ikbkg LKO model, while liver TAG were increased in both models. A decrease in liver total cholesterol was observed only in Cyp51 M LKO, while esterified liver cholesterol was decreased in Cyp51 F and M LKO. Plasma total and LDL cholesterol were increased in Cyp51 M LKO, while no changes were observed in Cyp51 F LKO and Ikbkg LKO model. A decrease in blood glucose was observed in Glmp KO and Ikbkg LKO, while in liver, glycogen deposits accumulated in the Ikbkg LKO model. More importantly, we emphasize that these genetic models develop metabolic rearrangements similar to NAFLD and NASH without obesity, dietary or chemical manipulation. We propose that overall metabolic rearrangements are crucial for the “fibrotic transcriptional program”. However, type of the injury, stage of fibrosis and sex, define the direction, degree and type of metabolic pathway affected.
Table 3.
Overview of changes in the level of serum metabolites and in the liver expression of transcription factors in humans with NAFLD and NASH. Selected were metabolites and TFs, which were exposed as key factors in the fibrotic program by genetic mouse models of liver fibrosis. C4: 7-alpha-hydroxy-4-cholesten-3-one.
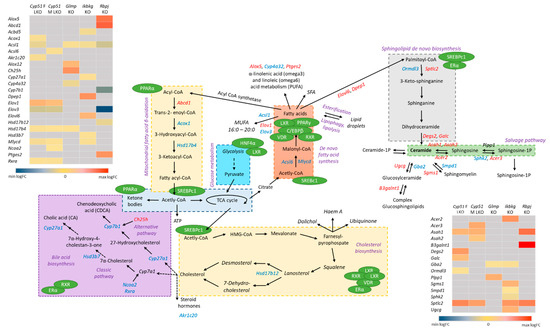
Figure 6.
Unique lipid metabolite’s rearrangements in mouse liver fibrotic models. Pathways analyses and GEM subsystems detected model-specific deregulation of lipid metabolism in genetic models. Blue color indicates downregulated DEGs, while red are upregulated DEGs. Grey in heat maps represents insignificant expression. Green circles are detected TFs in liver mouse models, which regulate different metabolic pathways (violet). Legend of heat maps are shown at the bottom.
Applying different approaches and databases enabled a fresh perspective on the fibrotic transcriptome data, also allowing us to consider transcription factors as major regulators of cellular metabolism. The Reactome pathways nuclear receptor transcription pathway and regulation of lipid metabolism by peroxisome proliferate-activated receptor-α were negatively enriched, while signaling by nuclear receptors and extra-nuclear estrogen signaling were positively enriched. This underlines the importance of transcriptional reprogramming of metabolism in fibrosis. Recent studies exposed a suppression of liver-identity transcription factors induced by liver injury [51]. Two models, female CYP51 LKO and Ikbkg LKO, exhibit a suppression of these TFs. Furthermore, several TFs regulating the lipid metabolism were enriched, such as PPARγ, RXRα, VDR, PPARα, SREBF1C, and LXR. Their expression is affected by NAFLD or NASH progression in human livers (Table 3). However, enrichment of these TF was not overlapping among genetic models, indicating that regulation of metabolism is specific to each genetic model of fibrosis and also defines the manner of metabolic rearrangements. For example, female CYP51 LKO has the strongest inhibition of overall metabolism, including the TCA cycle, and fatty acid and amino acid metabolism, while it is also the only model with a negative enrichment of metabolic regulators AMPK, PPARδ and PPARα. The different transcriptome landscapes resulting from different genetic backgrounds could be considered as stratified metabolic subtypes of NAFLD or NASH. This view may help to explain the variable success of treatments targeting these metabolic regulators [6]. Based on this, we propose that regulators and their downstream metabolites that differ between the genetic models warrant further testing as potential biomarkers in a human setting, to enable stratification of patients for metabolic subtypes of fibrosis. This could substantially increase the impact of existing and novel therapeutic strategies.
Epidemiological data in humans clearly show that estrogen has a protective role against NAFLD and NASH in premenopausal females [52]. Thus, sex hormones affect the development of liver diseases [53]. Our pathway and TF enrichment analyses and GEMs exposed changes in overall steroid hormone metabolism as one of the hallmarks of the fibrotic program. Extra-nuclear estrogen signaling and ERα (Estrogen receptor alpha) were positively enriched in all mouse models, regardless of sex, while Steroid hormone biosynthesis was negatively enriched in four models. Data in humans confirm increased expression of ERα in NAFLD livers and its correlation with the severity of steatosis [54]. ERα knockout in mice present with induced steatosis in both sexes, indicating that ERα activation in fibrosis could be a sex-independent protective adaptation against liver insults, exposing estrogen receptor as a potential drug target for NAFLD management [55,56,57]. Interestingly, even though we have previously shown a sex-dependent difference in the progression of liver fibrosis [58], we observe similar changes in steroid-related pathways in both sexes [10]. Based on our analysis we cannot draw conclusions regarding fibrotic programs in each sex since too little data is available for the females. Signaling through the estrogen receptor seems to be a part of the common fibrotic transcriptional program, regardless of the insult or sex. An important aspect of stratification could be potential differences in the liver fibrotic transcriptome signatures between females and males. It will therefore be important to have more comparable data available for both sexes.
Since one of the fibrotic models has a knockout in the gene Glmp, a gene whose function is not fully understood, the comparative transcriptome analysis helped in shedding light on its role at the molecular level. The full knockout of GLMP leads to liver fibrosis with inflammation, oval cell activation, and proliferation, hepatocyte apoptosis, oxidative stress, and development of HCC and hemangioma-like tumors from the age of 12 months [11,12]. Since evidence for HCC was not substantiated in KEGG analyses, in contrast to other mouse models, we anticipate that alternative pathways are responsible. A likely explanation for liver cancer in Glmp KO mice is impaired autophagy due to deficiency of lysosomes, which may on one hand contribute to the pathogenesis of NAFLD [59], and can also lead to lysosomal storage disorders [60]. A recent report demonstrated that Major Facilitator Superfamily Domain Containing 1 (MFSD1) and GLMP, both lysosomal membrane proteins, interact and affect each other’s expression [61]. MFSD1 belongs to a group of proteins transporting nutrients, waste, and ions across membranes [62]. A dysfunctional GLMP/MFSD1 complex could induce abnormal functions in lysosomes, severely affecting autophagy [63]. We propose that disturbances in these two pathways work cooperatively in increasing ER stress, the inflammatory-related KEGG pathway and development of fibrosis [64]. This is corroborated by the observed negative enrichment of mTOR (The mammalian target of rapamycin) signaling and KEGG pathways associated with detoxification, such as cytochromes P450.
4. Materials and Methods
4.1. Microarray-Based Gene Expression Analysis
Glmp KO and Cyp51 LKO transcriptomes were determined in-house and deposited in GEO, while raw transcriptome data for Ikbkg LKO and, Rbpj LKO models were obtained from GEO. The animal experiments, ethical statements and details about RNA isolation from the liver of Glmp KO and Cyp51 LKO genetic models are described in the original papers [10,13]. To assess the Glmp transcriptome, we used total RNA isolated as described in Kong X.Y. et al. 2015 [13]. We hybridized Affymetrix GeneChip Mouse Gene 2.0 ST Arrays (Affymetrix, Santa Clara, CA, USA) with samples from livers of 16 Glmp KO and Glmp wild type (WT) mice at age 8 and 18 weeks. Each group consisted of 4 samples (Table S8). Data analyses were performed using R and Bioconductor software packages (https://www.bioconductor.org/). We normalized raw (CEL) expression data using the RMA algorithm from the oligo package [65]. Quality control and outlier detection were performed using the arrayQualityMetrics package before and after normalization [66]. Raw as well as normalized data were deposited in GEO under the accession GSE154021.
The generation of transcriptome data from 19-week Cyp51 LKO (GSE58271), 4-week Rbpj LKO (GSE121302), 8- to 9-week Ikbkg LKO (GSE33161) and resulting mice were described previously [10,14,28]. The RMA algorithm from the oligo package and quantile normalization from the limma package [67] were used for re-normalization of raw expression data from Affymetrix and Agilent arrays, respectively. limma was used to fit individual normalized gene expression data using linear regression models as shown in Table S8. Empirical Bayes statistics were used to estimate the statistical significance of expression differences of genes and the Benjamini–Hochberg procedure was used to calculate false discovery rate (FDR) of differential expression. For selecting DEGs, a FDR cut-off at α < 0.05 was used, no log fold change cut-off was applied.
KEGG pathways [68], Reactome pathways [69] and TRANSFAC database version 2020.1 [70] were used for functional enrichment studies. Gene sets containing 5 or more elements were constructed and tested for enrichment using the PGSEA package [71]. In the case of TF enrichment, factors were merged based on their ID irrespective of their binding sites. Statistical significance of gene set enrichment was estimated using the same approach as for individual genes.
To facilitate comparative functional genomics analysis, DEGs and enriched gene sets were partitioned according to their overlaps between the studies. Genes and gene sets were split into up/down regulated and positively/negatively enriched groups and their numbers are reported. Overlaps between the models are visualized by Venn using the VennDiagram package [72]. For hierarchical clustering of samples/genes and heat map visualization, gene expression was scaled per sample to have mean zero and standard deviation one.
Functional similarity between the mouse models was quantified as a ratio of significant expression/enrichment changes that are in common to the models vs. the significant expression/enrichment changes of each model individually, e.g., the number of DEGs in the intersection of two models was divided by the number of DEGs for each model. Thus, a non-symmetric similarity matrix was calculated summarizing similarities between all pairs of models from a perspective of each model. Ratios of significant DEGs are shown in Table S3, together with the number of DEGs. Furthermore, the similarity between models is expressed separately for positive and negative expression/enrichment changes; thus each pair of the model is characterized by two ratios, left for positive and right for negative expression changes. Ratios are represented row-wise: the number of DEGs in common was divided by the number of DEGs of the model within the corresponding row. Table S3 show similarities between the models for KEGG and Reactome pathways and TFs, respectively.
4.2. Genome–Scale Metabolic Modeling
We performed the integration of DEGs into the GEM of C57BL6/J mice liver tissue, which was previously described [20] and is available in the Metabolic Atlas Database (www.metabolicatlas.org) [73]. DEGs were integrated into the model using the Metabolic Adjustment by Differential Expression (MADE) method [74,75]. MADE integrates differential expression data into a reference model using flux balance analysis (FBA) to obtain a functional metabolic model describing a perturbed state of a system (e.g., after gene silencing). When reference and perturbed models are available, up-/down-regulated reactions can be identified using the flux variability analysis (FVA) [76]. The list of up-/down-regulated reactions obtained with the FVA was used to perform metabolic subsystem enrichment analysis based on the hypergeometric test. The Benjamini and Hochberg procedure was used for p value adjustment. The cut-off value for significantly up-/down-regulated subsystems was set to 0.05.
5. Conclusions
Based on comparing different genetic models of liver fibrosis without dietary manipulation, we revealed common liver fibrotic transcriptome signatures with high similarity to signatures of human NAFLD and NASH. A hallmark of the fibrotic program are changes in metabolic pathways related to lipids, such as bile acids, steroids, sphingolipids, and fatty acids. These metabolites and their regulators (AMPK, FOXOA1, SREBP1, LXRα, PPARδ, and PPARα) exhibit enrichment that depends on the genetic background, exposing their potential to serve as diagnostic and prognostic biomarkers of fibrotic subtypes also in humans. They could also enable a more precise metabolism-related stratification of NAFLD/NASH patients before entering clinical drug trials and facilitate the implementation of personalized liver disease management.
Supplementary Materials
The following are available online at https://www.mdpi.com/1422-0067/22/2/832/s1. Table S1: Characteristics of genetic mouse models of liver fibrosis, Table S2: List of DEGs significant (adjusted p-value < 0.05) in at least one genetic model with log2 fold change (KO/WT), Table S3: Numbers of DEGs, KEGG pathways, Reactome pathways and overlap between different genetic models of liver fibrosis, Table S4: Enriched KEGG pathways significant (adjusted p-value < 0.05) in at least one genetic model with log2 fold change (KO/WT), Table S5: Enriched Reactome pathways significant (adjusted p-value < 0.05) in at least one genetic model with log2 fold change (KO/WT), Table S6: Comparison of enriched KEGG pathways between genetic mouse models with pathways reported for NAFLD and NASH in Teufel A. et al. 2016, Table S7: Enriched transcription factors significant (adjusted p-value < 0.05) in at least one genetic model with log2 fold change (KO/WT), Table S8: Mouse liver samples that were included in the study, Figure S1: A heat map of 62 common DEGs in genetic mouse models of liver fibrosis. Columns were scaled to have mean zero and standard deviation one.
Author Contributions
K.B.C. and Ž.U. performed microarray experiment. M.M. (Miha Moškon) and M.M. (Miha Mraz) conceptualized and performed GEM analysis. X.Y.K. and W.E. prepared samples for analyses. P.J. conceptualized and performed statistical analyses of microarray data. D.R. and T.R. conceptualized and supervised the study. All authors have read and agreed to the published version of the manuscript.
Funding
This work was supported by the Slovenian Research Agency (ARRS) program (grants P1-0104, P1-0390, P2-0359 and J1-9176), and the Norwegian Research Council (grant # NFR 240844 NCD). K.B.C. and Ž.U. were supported by the graduate fellowship of ARRS.
Institutional Review Board Statement
Not applicable.
Informed Consent Statement
Not applicable.
Data Availability Statement
Data is contained within the article and supplementary material.
Acknowledgments
We would like to acknowledge Nejc Nadižar for help with generating figures and John Hancock for revision of the manuscript.
Conflicts of Interest
The authors declare no conflict of interest.
Abbreviations
| AASLD | American Association for the Study of Liver Diseases |
| AMPK | AMP-activated protein kinase |
| CYP51 | Cytochrome P450, family 51 |
| DEGs | Differentially expressed genes |
| E2F1 | E2F transcription factor 1 |
| EASL | The European Association for the Study of the Liver |
| ECM | Extracellular matrix |
| ERα | Estrogen receptor alpha |
| ErbB | Erb-B2 receptor tyrosine kinase |
| F | Female |
| FXR | Farnesoid X receptor |
| GEM | Genome-scale metabolic model |
| GLMP | Glycosylated lysosomal membrane protein |
| HCC | Hepatocellular carcinoma |
| HDL | High-density lipoprotein |
| IGF1R | Insulin like growth factor 1 receptor |
| IKBKG | Inhibitor of nuclear factor kappa B kinase regulatory subunit gamma |
| KEGG | Kyoto Encyclopedia of Genes and Genomes |
| KO | Knock-out |
| LKO | Liver knock-out |
| LXR | Liver X receptor |
| M | Male |
| MAFLD | Metabolic Associated Fatty Liver Disease |
| MAPK | Mitogen-activated protein kinase |
| MFSD1 | Major facilitator superfamily domain containing 1 |
| mTOR | The mammalian target of rapamycin |
| NAFLD | Non-alcoholic fatty liver disease |
| NASH | Non-alcoholic steatohepatitis |
| NF-κB | Nuclear factor kappa-light-chain-enhancer of activated B cells |
| pGSEA | Parametric gene set enrichment analysis |
| PPAR | Peroxisome proliferator activated receptor |
| RBPJ | Recombination signal binding protein for immunoglobulin kappa J region |
| RXR | Retinoid X receptor |
| SREBP1 | Sterol regulatory element-binding protein 1 |
| STRING | Search tool for recurring instances of neighboring genes |
| TAG | Triglycerides |
| TCA | Tricarboxylic acid cycle |
| TF | Transcription factor |
| TGF-β | Transforming growth factor beta |
| TGFBI | Transforming growth factor beta induced |
| TRANSFAC | TRANScription FACtor |
| VDR | Vitamin D receptor |
| VEGF | Vascular endothelial growth factor |
| WT | Wild type |
References
- Distler, J.H.W.; Györfi, A.H.; Ramanujam, M.; Whitfield, M.L.; Königshoff, M.; Lafyatis, R. Shared and distinct mechanisms of fibrosis. Nat. Rev. Rheumatol. 2019, 15, 705–730. [Google Scholar] [CrossRef] [PubMed]
- Eslam, M.; Sanyal, A.J.; George, J. MAFLD: A consensus-driven proposed nomenclature for metabolic associated fatty liver disease. Gastroenterology 2020. [Google Scholar] [CrossRef] [PubMed]
- Younossi, Z.; Anstee, Q.M.; Marietti, M.; Hardy, T.; Henry, L.; Eslam, M.; George, J.; Bugianesi, E. Global burden of NAFLD and NASH: Trends, predictions, risk factors and prevention. Nat. Rev. Gastroenterol. Hepatol. 2018, 15, 11–20. [Google Scholar] [CrossRef] [PubMed]
- Liedtke, C.; Luedde, T.; Sauerbruch, T.; Scholten, D.; Streetz, K.; Tacke, F.; Tolba, R.; Trautwein, C.; Trebicka, J.; Weiskirchen, R. Experimental liver fibrosis research: Update on animal models, legal issues and translational aspects. Fibrogenes. Tissue Repair 2013, 6. [Google Scholar] [CrossRef]
- Sircana, A.; Paschetta, E.; Saba, F.; Molinaro, F.; Musso, G. Recent insight into the role of fibrosis in nonalcoholic steatohepatitis-related hepatocellular carcinoma. Int. J. Mol. Sci. 2019, 20, 1745. [Google Scholar] [CrossRef] [PubMed]
- Friedman, S.L.; Neuschwander-Tetri, B.A.; Rinella, M.; Sanyal, A.J. Mechanisms of NAFLD development and therapeutic strategies. Nat. Med. 2018, 24, 908–922. [Google Scholar] [CrossRef] [PubMed]
- Bril, F.; Barb, D.; Lomonaco, R.; Lai, J.; Cusi, K. Change in hepatic fat content measured by MRI does not predict treatment-induced histological improvement of steatohepatitis. J. Hepatol. 2020, 72, 401–410. [Google Scholar] [CrossRef]
- Rinella, M.E.; Tacke, F.; Sanyal, A.J.; Anstee, Q.M. Report on the AASLD/EASL joint workshop on clinical trial endpoints in NAFLD. J. Hepatol. 2019, 71, 823–833. [Google Scholar] [CrossRef]
- Alonso, C.; Fernández-Ramos, D.; Varela-Rey, M.; Martínez-Arranz, I.; Navasa, N.; Van Liempd, S.M.; Lavín Trueba, J.L.; Mayo, R.; Ilisso, C.P.; de Juan, V.G.; et al. Metabolomic Identification of Subtypes of Nonalcoholic Steatohepatitis. Gastroenterology 2017, 152, 1449–1461.e7. [Google Scholar] [CrossRef]
- Lorbek, G.; Perše, M.; Jeruc, J.; Juvan, P.; Gutierrez-mariscal, F.M.; Lewinska, M.; Gebhardt, R.; Horvat, S.; Bjorkhem, I.; Rozman, D.; et al. Lessons from Hepatocyte-Specific Cyp51 Knockout Mice: Impaired Cholesterol Synthesis Leads to Oval Cell-Driven Liver Injury. Sci. Rep. 2015, 5, 1–11. [Google Scholar] [CrossRef]
- Kong, X.Y.; Nesset, C.K.; Damme, M.; Lbøerg, E.M.; Lubke, T.; Mhælen, J.; Andersson, K.B.; Lorenzo, P.I.; Roos, N.; Thoresen, G.H.; et al. Loss of lysosomal membrane protein NCU-G1 in mice results in spontaneous liver fibrosis with accumulation of lipofuscin and iron. DMM Dis. Model. Mech. 2014, 7, 351–362. [Google Scholar] [CrossRef] [PubMed]
- Nesset, C.K.; Kong, X.Y.; Damme, M.; Schjalm, C.; Roos, N.; Løberg, E.M.; Eskild, W. Age-dependent development of liver fibrosis in Glmpgt/gt mice. Fibrogenes. Tissue Repair 2016, 9, 1–13. [Google Scholar] [CrossRef] [PubMed]
- Kong, X.Y.; Kase, E.T.; Herskedal, A.; Schjalm, C.; Damme, M.; Nesset, C.K.; Thoresen, G.H.; Rustan, A.C.; Eskild, W. Lack of the lysosomal membrane protein, GLMP, in mice results in metabolic dysregulation in liver. PLoS ONE 2015, 10, e0129402. [Google Scholar] [CrossRef] [PubMed]
- Tharehalli, U.; Svinarenko, M.; Kraus, J.M.; Kühlwein, S.D.; Szekely, R.; Kiesle, U.; Scheffold, A.; Barth, T.F.E.; Kleger, A.; Schirmbeck, R.; et al. YAP activation drives liver regeneration after cholestatic damage induced by Rbpj deletion. Int. J. Mol. Sci. 2018, 19, 3801. [Google Scholar] [CrossRef] [PubMed]
- Beraza, N.; Malato, Y.; Sander, L.E.; Al-Masaoudi, M.; Freimuth, J.; Riethmacher, D.; Gores, G.J.; Roskams, T.; Liedtke, C.; Trautwein, C. Hepatocyte-specific NEMO deletion promotes NK/NKT cell- and TRAIL-dependent liver damage. J. Exp. Med. 2009, 206, 1727–1737. [Google Scholar] [CrossRef] [PubMed]
- Luedde, T.; Beraza, N.; Kotsikoris, V.; van Loo, G.; Nenci, A.; De Vos, R.; Roskams, T.; Trautwein, C.; Pasparakis, M. Deletion of NEMO/IKKγ in Liver Parenchymal Cells Causes Steatohepatitis and Hepatocellular Carcinoma. Cancer Cell 2007, 11, 119–132. [Google Scholar] [CrossRef] [PubMed]
- Niu, L.; Geyer, P.E.; Wewer Albrechtsen, N.J.; Gluud, L.L.; Santos, A.; Doll, S.; Treit, P.V.; Holst, J.J.; Knop, F.K.; Vilsbøll, T.; et al. Plasma proteome profiling discovers novel proteins associated with non-alcoholic fatty liver disease. Mol. Syst. Biol. 2019, 15, 1–16. [Google Scholar] [CrossRef]
- Teufel, A.; Itzel, T.; Erhart, W.; Brosch, M.; Wang, X.Y.; Kim, Y.O.; von Schönfels, W.; Herrmann, A.; Brückner, S.; Stickel, F.; et al. Comparison of Gene Expression Patterns Between Mouse Models of Nonalcoholic Fatty Liver Disease and Liver Tissues From Patients. Gastroenterology 2016, 151, 513–525. [Google Scholar] [CrossRef]
- Arendt, B.M.; Comelli, E.M.; Ma, D.W.L.; Lou, W.; Teterina, A.; Kim, T.; Fung, S.K.; Wong, D.K.H.; Mcgilvray, I.; Fischer, S.E.; et al. Altered hepatic gene expression in nonalcoholic fatty liver disease is associated with lower hepatic n-3 and n-6 polyunsaturated fatty acids. Hepatology 2015, 61, 1565–1578. [Google Scholar] [CrossRef]
- Mardinoglu, A.; Agren, R.; Kampf, C.; Asplund, A.; Uhlen, M.; Nielsen, J. Genome-scale metabolic modelling of hepatocytes reveals serine deficiency in patients with non-alcoholic fatty liver disease. Nat. Commun. 2014, 5, 1–11. [Google Scholar] [CrossRef]
- Moylan, C.A.; Pang, H.; Dellinger, A.; Suzuki, A.; Garrett, M.E.; Guy, C.D.; Murphy, S.K.; Ashley-Koch, A.E.; Choi, S.S.; Michelotti, G.A.; et al. Hepatic gene expression profiles differentiate presymptomatic patients with mild versus severe nonalcoholic fatty liver disease. Hepatology 2014, 59, 471–482. [Google Scholar] [CrossRef] [PubMed]
- Ramadori, P.; Klag, T.; Malek, N.P.; Heikenwalder, M. Platelets in chronic liver disease, from bench to bedside. JHEP Reports 2019, 1, 448–459. [Google Scholar] [CrossRef] [PubMed]
- Naguib, G.; Morris, N.; Yang, S.; Fryzek, N.; Haynes-Williams, V.; Huang, W.C.A.; Norman-Wheeler, J.; Rotman, Y. Dietary fatty acid oxidation is decreased in non-alcoholic fatty liver disease: A palmitate breath test study. Liver Int. 2020, 40, 590–597. [Google Scholar] [CrossRef] [PubMed]
- Satriano, L.; Lewinska, M.; Rodrigues, P.M.; Banales, J.M.; Andersen, J.B. Metabolic rearrangements in primary liver cancers: Cause and consequences. Nat. Rev. Gastroenterol. Hepatol. 2019, 16. [Google Scholar] [CrossRef]
- Yoo, H.J.; Jung, K.J.; Kim, M.M.; Kim, M.M.; Kang, M.; Jee, S.H.; Choi, Y.; Lee, J.H. Liver Cirrhosis Patients Who Had Normal Liver Function Before Liver Cirrhosis Development Have the Altered Metabolic Profiles Before the Disease Occurrence Compared to Healthy Controls. Front. Physiol. 2019, 10, 1421. [Google Scholar] [CrossRef]
- Jiao, N.; Baker, S.S.; Chapa-Rodriguez, A.; Liu, W.; Nugent, C.A.; Tsompana, M.; Mastrandrea, L.; Buck, M.J.; Baker, R.D.; Genco, R.J.; et al. Suppressed hepatic bile acid signalling despite elevated production of primary and secondary bile acids in NAFLD. Gut 2018, 67, 1–11. [Google Scholar] [CrossRef]
- Chen, F.; Esmaili, S.; Rogers, G.B.; Bugianesi, E.; Petta, S.; Marchesini, G.; Bayoumi, A.; Metwally, M.; Azardaryany, M.K.; Coulter, S.; et al. Lean NAFLD: A Distinct Entity Shaped by Differential Metabolic Adaptation. Hepatology 2020, 71, 1213–1227. [Google Scholar] [CrossRef]
- Cubero, F.J.; Singh, A.; Borkham-Kamphorst, E.; Nevzorova, Y.A.; Al Masaoudi, M.; Haas, U.; Boekschoten, M.V.; Gassler, N.; Weiskirchen, R.; Muller, M.; et al. TNFR1 determines progression of chronic liver injury in the IKKγ/Nemo genetic model. Cell Death Differ. 2013, 20, 1580–1592. [Google Scholar] [CrossRef]
- Mouzaki, M.; Wang, A.Y.; Bandsma, R.; Comelli, E.M.; Arendt, B.M.; Zhang, L.; Fung, S.; Fischer, S.E.; McGilvray, I.G.; Allard, J.P. Bile acids and dysbiosis in non-alcoholic fatty liver disease. PLoS ONE 2016, 11, e0151829. [Google Scholar] [CrossRef]
- Ferslew, B.C.; Xie, G.; Johnston, C.K.; Su, M.; Stewart, P.W.; Jia, W.; Brouwer, K.L.R.; Sidney Barritt, A. Altered Bile Acid Metabolome in Patients with Nonalcoholic Steatohepatitis. Dig. Dis. Sci. 2015, 60, 3318–3328. [Google Scholar] [CrossRef]
- Bechmann, L.P.; Kocabayoglu, P.; Sowa, J.P.; Sydor, S.; Best, J.; Schlattjan, M.; Beilfuss, A.; Schmitt, J.; Hannivoort, R.A.; Kilicarslan, A.; et al. Free fatty acids repress small heterodimer partner (SHP) activation and adiponectin counteracts bile acid-induced liver injury in superobese patients with nonalcoholic steatohepatitis. Hepatology 2013, 57, 1394–1406. [Google Scholar] [CrossRef] [PubMed]
- Kahlan, S.C.; Guo, L.; Edmison, J.; Dasarathy, S.; McCullough, A.J.; Hanson, R.W.; Milburn, M. Plasma Metabolomic Profile in Non-Alcoholic Fatty Liver Disease. Metabolism 2011, 60, 404–413. [Google Scholar]
- Chen, J.; Zheng, M.; Liu, J.; Luo, Y.; Yang, W.; Yang, J.; Liu, J.; Zhou, J.; Xu, C.; Zhao, F.; et al. Ratio of Conjugated Chenodeoxycholic to Muricholic Acids is Associated with Severity of Nonalcoholic Steatohepatitis. Obesity 2019, 27, 2055–2066. [Google Scholar] [CrossRef] [PubMed]
- Jahnel, J.; Zöhrer, E.; Alisi, A.; Ferrari, F.; Ceccarelli, S.; De Vito, R.; Scharnagl, H.; Stojakovic, T.; Fauler, G.; Trauner, M.; et al. Serum Bile Acid Levels in Children with Nonalcoholic Fatty Liver Disease. J. Pediatr. Gastroenterol. Nutr. 2015, 61, 85–90. [Google Scholar] [CrossRef] [PubMed]
- Papandreou, C.; Bullò, M.; Tinahones, F.J.; Martínez-González, M.Á.; Corella, D.; Fragkiadakis, G.A.; López-Miranda, J.; Estruch, R.; Fitó, M.; Salas-Salvadó, J. Serum metabolites in non-alcoholic fatty-liver disease development or reversion; A targeted metabolomic approach within the PREDIMED trial. Nutr. Metab. 2017, 14, 1–11. [Google Scholar] [CrossRef]
- Caussy, C.; Hsu, C.; Singh, S.; Bassirian, S.; Kolar, J.; Faulkner, C.; Sinha, N.; Bettencourt, R.; Gara, N.; Valasek, M.A.; et al. Serum bile acid patterns are associated with the presence of NAFLD in twins, and dose-dependent changes with increase in fibrosis stage in patients with biopsy-proven NAFLD. Aliment. Pharmacol. Ther. 2019, 49, 183–193. [Google Scholar] [CrossRef]
- Spahis, S.; Alvarez, F.; Ahmed, N.; Dubois, J.; Jalbout, R.; Paganelli, M.; Grzywacz, K.; Delvin, E.; Peretti, N.; Levy, E. Non-alcoholic fatty liver disease severity and metabolic complications in obese children: Impact of omega-3 fatty acids. J. Nutr. Biochem. 2018, 58, 28–36. [Google Scholar] [CrossRef]
- Lou, D.J.; Zhu, Q.Q.; Si, X.W.; Guan, L.L.; You, Q.Y.; Yu, Z.M.; Zhang, A.Z.; Li, D. Serum phospholipid omega-3 polyunsaturated fatty acids and insulin resistance in type 2 diabetes mellitus and non-alcoholic fatty liver disease. J. Diabetes Complicat. 2014, 28, 711–714. [Google Scholar] [CrossRef]
- Elizondo, A.; Araya, J.; Rodrigo, R.; Sgherri, C.; Comporti, M.; Poniachik, J.; Videla, L.A. Effects of weight loss on liver and erythrocyte polyunsaturated fatty acid pattern and oxidative stress status in obese patients with non-alcoholic fatty liver disease. Biol. Res. 2008, 41, 59–68. [Google Scholar] [CrossRef]
- Puri, P.; Wiest, M.M.; Cheung, O.; Mirshahi, F.; Sargeant, C.; Min, H.K.; Contos, M.J.; Sterling, R.K.; Fuchs, M.; Zhou, H.; et al. The plasma lipidomic signature of nonalcoholic steatohepatitis. Hepatology 2009, 50, 1827–1838. [Google Scholar] [CrossRef]
- Guo, X.F.; Yang, B.; Tang, J.; Li, D. Fatty acid and non-alcoholic fatty liver disease: Meta-analyses of case-control and randomized controlled trials. Clin. Nutr. 2018, 37, 113–122. [Google Scholar] [CrossRef] [PubMed]
- Ramos-Molina, B.; Castellano-Castillo, D.; Pastor, O.; Ocaña-Wilhelmi, L.; Fernández-García, D.; Romero-Gómez, M.; Cardona, F.; Tinahones, F.J. A Pilot Study of Serum Sphingomyelin Dynamics in Subjects with Severe Obesity and Non-alcoholic Steatohepatitis after Sleeve Gastrectomy. Obes. Surg. 2019, 29, 983–989. [Google Scholar] [CrossRef] [PubMed]
- Feldman, A.; Eder, S.K.; Felder, T.K.; Kedenko, L.; Paulweber, B.; Stadlmayr, A.; Huber-Schönauer, U.; Niederseer, D.; Stickel, F.; Auer, S.; et al. Clinical and Metabolic Characterization of Lean Caucasian Subjects with Non-alcoholic Fatty Liver. Am. J. Gastroenterol. 2017, 112, 102–110. [Google Scholar] [CrossRef] [PubMed]
- Männistö, V.T.; Simonen, M.; Hyysalo, J.; Soininen, P.; Kangas, A.J.; Kaminska, D.; Matte, A.K.; Venesmaa, S.; Käkelä, P.; Kärjä, V.; et al. Ketone body production is differentially altered in steatosis and non-alcoholic steatohepatitis in obese humans. Liver Int. 2015, 35, 1853–1861. [Google Scholar] [CrossRef] [PubMed]
- Francque, S.; Verrijken, A.; Caron, S.; Prawitt, J.; Paumelle, R.; Derudas, B.; Lefebvre, P.; Taskinen, M.R.; Van Hul, W.; Mertens, I.; et al. PPARα gene expression correlates with severity and histological treatment response in patients with non-alcoholic steatohepatitis. J. Hepatol. 2015, 63, 164–173. [Google Scholar] [CrossRef]
- Kersten, S.; Stienstra, R. The role and regulation of the peroxisome proliferator activated receptor alpha in human liver. Biochimie 2017, 136, 75–84. [Google Scholar] [CrossRef]
- Yang, Z.X.; Shen, W.; Sun, H. Effects of nuclear receptor FXR on the regulation of liver lipid metabolism in patients with non-alcoholic fatty liver disease. Hepatol. Int. 2010, 4, 741–748. [Google Scholar] [CrossRef]
- Westerbacka, J.; Kolak, M.; Kiviluoto, T.; Arkkila, P.; Sire, J.; Hamsten, A.; Fisher, R.M.; Yki-ja, H. Genes involved in fatty acid partitioning and binding, inflammation are overexpressed in the human fatty liver of insulin-resistant subjects. Diabetes 2007, 56, 2759–2765. [Google Scholar] [CrossRef]
- Bozic, M.; Guzmán, C.; Benet, M.; Sánchez-Campos, S.; García-Monzón, C.; Gari, E.; Gatius, S.; Valdivielso, J.M.; Jover, R. Hepatocyte vitamin D receptor regulates lipid metabolism and mediates experimental diet-induced steatosis. J. Hepatol. 2016, 65, 748–757. [Google Scholar] [CrossRef]
- Barchetta, I.; Carotti, S.; Labbadia, G.; Gentilucci, U.V.; Muda, A.O.; Angelico, F.; Silecchia, G.; Leonetti, F.; Fraioli, A.; Picardi, A.; et al. Liver vitamin D receptor, CYP2R1, and CYP27A1 expression: Relationship with liver histology and vitamin D3 levels in patients with nonalcoholic steatohepatitis or hepatitis C virus. Hepatology 2012, 56, 2180–2187. [Google Scholar] [CrossRef]
- Dubois, V.; Gheeraert, C.; Vankrunkelsven, W.; Dubois-Chevalier, J.; Dehondt, H.; Bobowski-Gerard, M.; Vinod, M.; Zummo, F.P.; Güiza, F.; Ploton, M.; et al. Endoplasmic reticulum stress actively suppresses hepatic molecular identity in damaged liver. Mol. Syst. Biol. 2020, 16, 1–27. [Google Scholar] [CrossRef] [PubMed]
- Lee, C.; Kim, J.; Jung, Y. Potential Therapeutic Application of Estrogen in Gender Disparity of Nonalcoholic Fatty Liver Disease/Nonalcoholic Steatohepatitis. Cells 2019, 8, 1259. [Google Scholar] [CrossRef] [PubMed]
- Ruggieri, A.; Gagliardi, M.C.; Anticoli, S. Sex-Dependent Outcome of Hepatitis B and C Viruses Infections: Synergy of Sex Hormones and Immune Responses? Front. Immunol. 2018, 9, 2302. [Google Scholar] [CrossRef] [PubMed]
- Choi, E.; Kim, W.; Joo, S.K.; Park, S.; Park, J.H.; Kang, Y.K.; Jin, S.-Y.; Chang, M.S. Expression patterns of STAT3, ERK and estrogen-receptor α are associated with development and histologic severity of hepatic steatosis: A retrospective study. Diagn. Pathol. 2018, 13, 23. [Google Scholar] [CrossRef]
- Hart-Unger, S.; Arao, Y.; Hamilton, K.J.; Lierz, S.L.; Malarkey, D.E.; Hewitt, S.C.; Freemark, M.; Korach, K.S. Hormone signaling and fatty liver in females: Analysis of estrogen receptor α mutant mice. Int. J. Obes. 2017, 41, 945–954. [Google Scholar] [CrossRef]
- Qiu, S.; Vazquez, J.T.; Boulger, E.; Liu, H.; Xue, P.; Hussain, M.A.; Wolfe, A. Hepatic estrogen receptor α is critical for regulation of gluconeogenesis and lipid metabolism in males. Sci. Rep. 2017, 7. [Google Scholar] [CrossRef]
- Hevener, A.L.; Clegg, D.J.; Mauvais-Jarvis, F. Impaired estrogen receptor action in the pathogenesis of the metabolic syndrome. Mol. Cell. Endocrinol. 2015, 418, 306–321. [Google Scholar] [CrossRef]
- Urlep, Ž.; Lorbek, G.; Perše, M.; Jeruc, J.; Juvan, P.; Matz-Soja, M.; Gebhardt, R.; Björkhem, I.; Hall, J.A.; Bonneau, R.; et al. Disrupting hepatocyte Cyp51 from cholesterol synthesis leads to progressive liver injury in the developing mouse and decreases RORC signalling. Sci. Rep. 2017, 7, 1–13. [Google Scholar] [CrossRef]
- Ke, P.Y. Diverse functions of autophagy in liver physiology and liver diseases. Int. J. Mol. Sci. 2019, 20, 300. [Google Scholar] [CrossRef]
- Seranova, E.; Connolly, K.J.; Zatyka, M.; Rosenstock, T.R.; Barrett, T.; Tuxworth, R.I.; Sarkar, S. Dysregulation of autophagy as a common mechanism in lysosomal storage diseases. Essays Biochem. 2017, 61, 733–749. [Google Scholar]
- López, D.M.; Thelen, M.; Stahl, F.; Thiel, C.; Linhorst, A.; Sylvester, M.; Hermanns-Borgmeyer, I.; Lüllmann-Rauch, R.; Eskild, W.; Saftig, P.; et al. The lysosomal transporter mfsd1 is essential for liver homeostasis and critically depends on its accessory subunit glmp. eLife 2019, 8. [Google Scholar] [CrossRef]
- Perland, E.; Bagchi, S.; Klaesson, A.; Fredriksson, R. Characteristics of 29 novel atypical solute carriers of major facilitator superfamily type: Evolutionary conservation, predicted structure and neuronal co-expression. Open Biol. 2017, 7. [Google Scholar] [CrossRef] [PubMed]
- Yim, W.W.Y.; Mizushima, N. Lysosome biology in autophagy. Cell Discov. 2020, 6, 6. [Google Scholar] [CrossRef] [PubMed]
- Lavallard, V.J.; Gual, P. Autophagy and Non-Alcoholic Fatty Liver Disease. Biomed Res. Int. 2014, 2014. [Google Scholar] [CrossRef]
- Carvalho, B.S.; Irizarry, R.A. A framework for oligonucleotide microarray preprocessing. Bioinformatics 2010, 26, 2363–2367. [Google Scholar] [CrossRef]
- Kauffmann, A.; Gentleman, R.; Huber, W. arrayQualityMetrics—A bioconductor package for quality assessment of microarray data. Bioinformatics 2009, 25, 415–416. [Google Scholar] [CrossRef]
- Smyth, G.K. Linear models and empirical bayes methods for assessing differential expression in microarray experiments. Stat. Appl. Genet. Mol. Biol. 2004, 3, 1–25. [Google Scholar] [CrossRef]
- Kanehisa, M.; Sato, Y.; Furumichi, M.; Morishima, K.; Tanabe, M. New approach for understanding genome variations in KEGG. Nucleic Acids Res. 2019, 47, D590–D595. [Google Scholar] [CrossRef]
- Jassal, B.; Matthews, L.; Viteri, G.; Gong, C.; Lorente, P.; Fabregat, A.; Sidiropoulos, K.; Cook, J.; Gillespie, M.; Haw, R.; et al. The reactome pathway knowledgebase. Nucleic Acids Res. 2020, 48, D498–D503. [Google Scholar] [CrossRef]
- Matys, V. TRANSFAC and its module TRANSCompel: Transcriptional gene regulation in eukaryotes. Nucleic Acids Res. 2006, 34, D108–D110. [Google Scholar] [CrossRef]
- Furge, K.K.D. PGSEA: Parametric Gene Set Enrichment Analysis. R Package Version 2006, 1, 44. [Google Scholar]
- Chen, H. VennDiagram: Generate High-Resolution Venn and Euler Plots. R Package Version 2018, 1, 1. [Google Scholar]
- Pornputtapong, N.; Nookaew, I.; Nielsen, J. Human metabolic atlas: An online resource for human metabolism. Database 2015, 2015. [Google Scholar] [CrossRef] [PubMed]
- Jensen, P.A.; Papin, J.A. Functional integration of a metabolic network model and expression data without arbitrary thresholding. Bioinformatics 2011, 27, 541–547. [Google Scholar] [CrossRef]
- Jensen, P.A.; Lutz, K.A.; Papin, J.A. TIGER: Toolbox for integrating genome-scale metabolic models, expression data, and transcriptional regulatory networks. BMC Syst. Biol. 2011, 5, 147. [Google Scholar] [CrossRef]
- Gudmundsson, S.; Thiele, I. Computationally efficient flux variability analysis. BMC Bioinform. 2010, 11, 489. [Google Scholar] [CrossRef]
Publisher’s Note: MDPI stays neutral with regard to jurisdictional claims in published maps and institutional affiliations. |
© 2021 by the authors. Licensee MDPI, Basel, Switzerland. This article is an open access article distributed under the terms and conditions of the Creative Commons Attribution (CC BY) license (http://creativecommons.org/licenses/by/4.0/).