Abstract
The inelastic interaction between the incident photons and acoustic phonons in the taurine single crystal was investigated by using Brillouin spectroscopy. Three acoustic phonons propagating along the crystallographic b-axis were investigated over a temperature range of −185 to 175 °C. The temperature dependences of the sound velocity, the acoustic absorption coefficient, and the elastic constants were determined for the first time. The elastic behaviors could be explained based on normal lattice anharmonicity. No evidence for the structural phase transition was observed, consistent with previous structural studies. The birefringence in the ac-plane indirectly estimated from the split longitudinal acoustic modes was consistent with one theoretical calculation by using the extrapolation of the measured dielectric functions in the infrared range.
1. Introduction
Taurine (2-aminoethanesulfonic acid), NH3(CH2)2SO3, is a well-known and important organic compound that is found in many organs of animal bodies, the bile being the most representative one [1]. Taurine is one of the sulfur-containing amino acids, but it does not belong to the constituents of proteins and is thus regarded as a nonessential amino acid. However, taurine is known to have many biological functions, such as membrane stabilization [2], osmoregulation [3], and antioxidation [4], to name a few. Moreover, taurine has been studied for various applications, such as sensors [5], nanofiltration [6], etc.
On the other hand, fundamental aspects of taurine have been investigated by various methods because taurine is a model system of a sulfur-included organic compound. In particular, a single crystal form or a powder pellet has been used for the characterization of the exact structure and vibrational properties. Taurine can be formed into a colorless crystal and can thus be studied as one of the organic crystals. The structure of the taurine crystal was first determined by X-ray scattering to be monoclinic P21/c [7,8]. There are trans and gauche forms in taurine molecules, but the taurine crystal is grown in the zwitterion configuration (NH3+–CH2–CH2–SO3−) where only the gauche configuration exists, as confirmed by x-ray crystallography [8,9,10,11,12]. According to these structural studies, the N—H···O hydrogen bonds form a three-dimensional network, and the electrostatic potential exhibits large negative and positive regions near SO3− and NH3+, respectively.
There are several vibrational studies on taurine material in its various forms, including solutions to solid states [13,14,15,16,17,18,19,20,21,22]. These studies, combined with normal mode analysis, revealed detailed vibrational modes of taurine molecules, power samples, and single crystals. Some of these vibrational studies include a surface-enhanced Raman study carried out on taurine absorbed on silver nanoparticles [19] and the combination of infrared and Raman analyses for taurine single crystals [22]. In particular, temperature- or pressure-dependent spectroscopic investigations are a promising tool for studying any possible phase transitions in these organic materials.
Taurine crystal shows successive pressure-induced phase transitions at ~0.7 and ~5.2 GPa, as revealed by high-pressure Raman spectroscopy [15]. A high-temperature Raman study above room temperature did not reveal any high-temperature phase transition [18]. On the other hand, Lim et al. suggested a first-order phase transition at ~250 K (measured upon cooling) by using a temperature-dependent Raman study below room temperature [16]. They also presented an enthalpic anomaly in a similar temperature range where the phase transition temperature showed a large thermal hysteresis of about 21 K. On the other hand, Bajaj et al. reported a low-temperature infrared study of torsional vibrations of taurine [21]. They observed a splitting of the CSH torsional mode near 250 K consistent with the Raman study described above.
However, apart for these two spectroscopic studies, there has been no other report about the structural phase transition of taurine single crystals. Moreover, the crystal structure (space group) does not change below room temperature down to 120 K [23]. Other structural studies also confirmed that the space group at low temperatures below 250 K is P21/c, the same as that measured at room temperature [10,11]. In this context, the existence of a low-temperature phase transition near 250 K and its exact structure below this temperature are still controversial.
The purpose of the present study is aimed at tackling this issue by using Brillouin spectroscopy, which is one of the inelastic light-scattering methods. Brillouin light-scattering is based on the inelastic interaction between the incident photons and acoustic phonons in the crystal. From the measured inelastic photon signals, sound velocities and elastic stiffness coefficients (abbreviated as elastic constants) can be derived [24]. Elastic constants are directly associated with interatomic and intermolecular potentials and are thus affected by phase transitions [25]. Brillouin spectroscopy has been applied to various organic crystals including pharmaceutical materials, such as aspirin [26,27], ibuprofen [28], acetaminophen [29], ketoprofen [30], indomethacin [31], etc. Some of these studies revealed detailed temperature dependences of elastic constants and acoustic damping effects in these organic crystals. The present study is the first report on the temperature dependence of the elastic properties of taurine single crystals. We could not find evidence for a structural phase transition in the investigated temperature of −185 °C ~ 175 °C.
2. Materials and Methods
The powder of taurine (purity ≥ 99%) was purchased from Aldrich and was dissolved in doubly distilled water. Single crystals of taurine were grown from an aqueous solution by slow evaporation technique at about 38 °C, the form of the resulting crystals depending on the rate of evaporation or supersaturation of the solution, as mentioned in previous works [7,32,33,34]. Optically transparent crystals have a different morphology ranging from a prism shape to acicular shape, in agreement with references [7,32,33,34]. With a rapid evaporation or a high degree of supersaturated solution, needle-shaped crystals were formed, the length of the needle being parallel to the a-axis. On the other hand, with a slow evaporation or a low degree of supersaturated solution, the crystals adopted a tabular form, the greatest length being along the a-axis. The monoclinic b-axis is perpendicular to the largest face and the a-direction [32,33]. Thus, the natural plane perpendicular to the b-axis was chosen for the investigation.
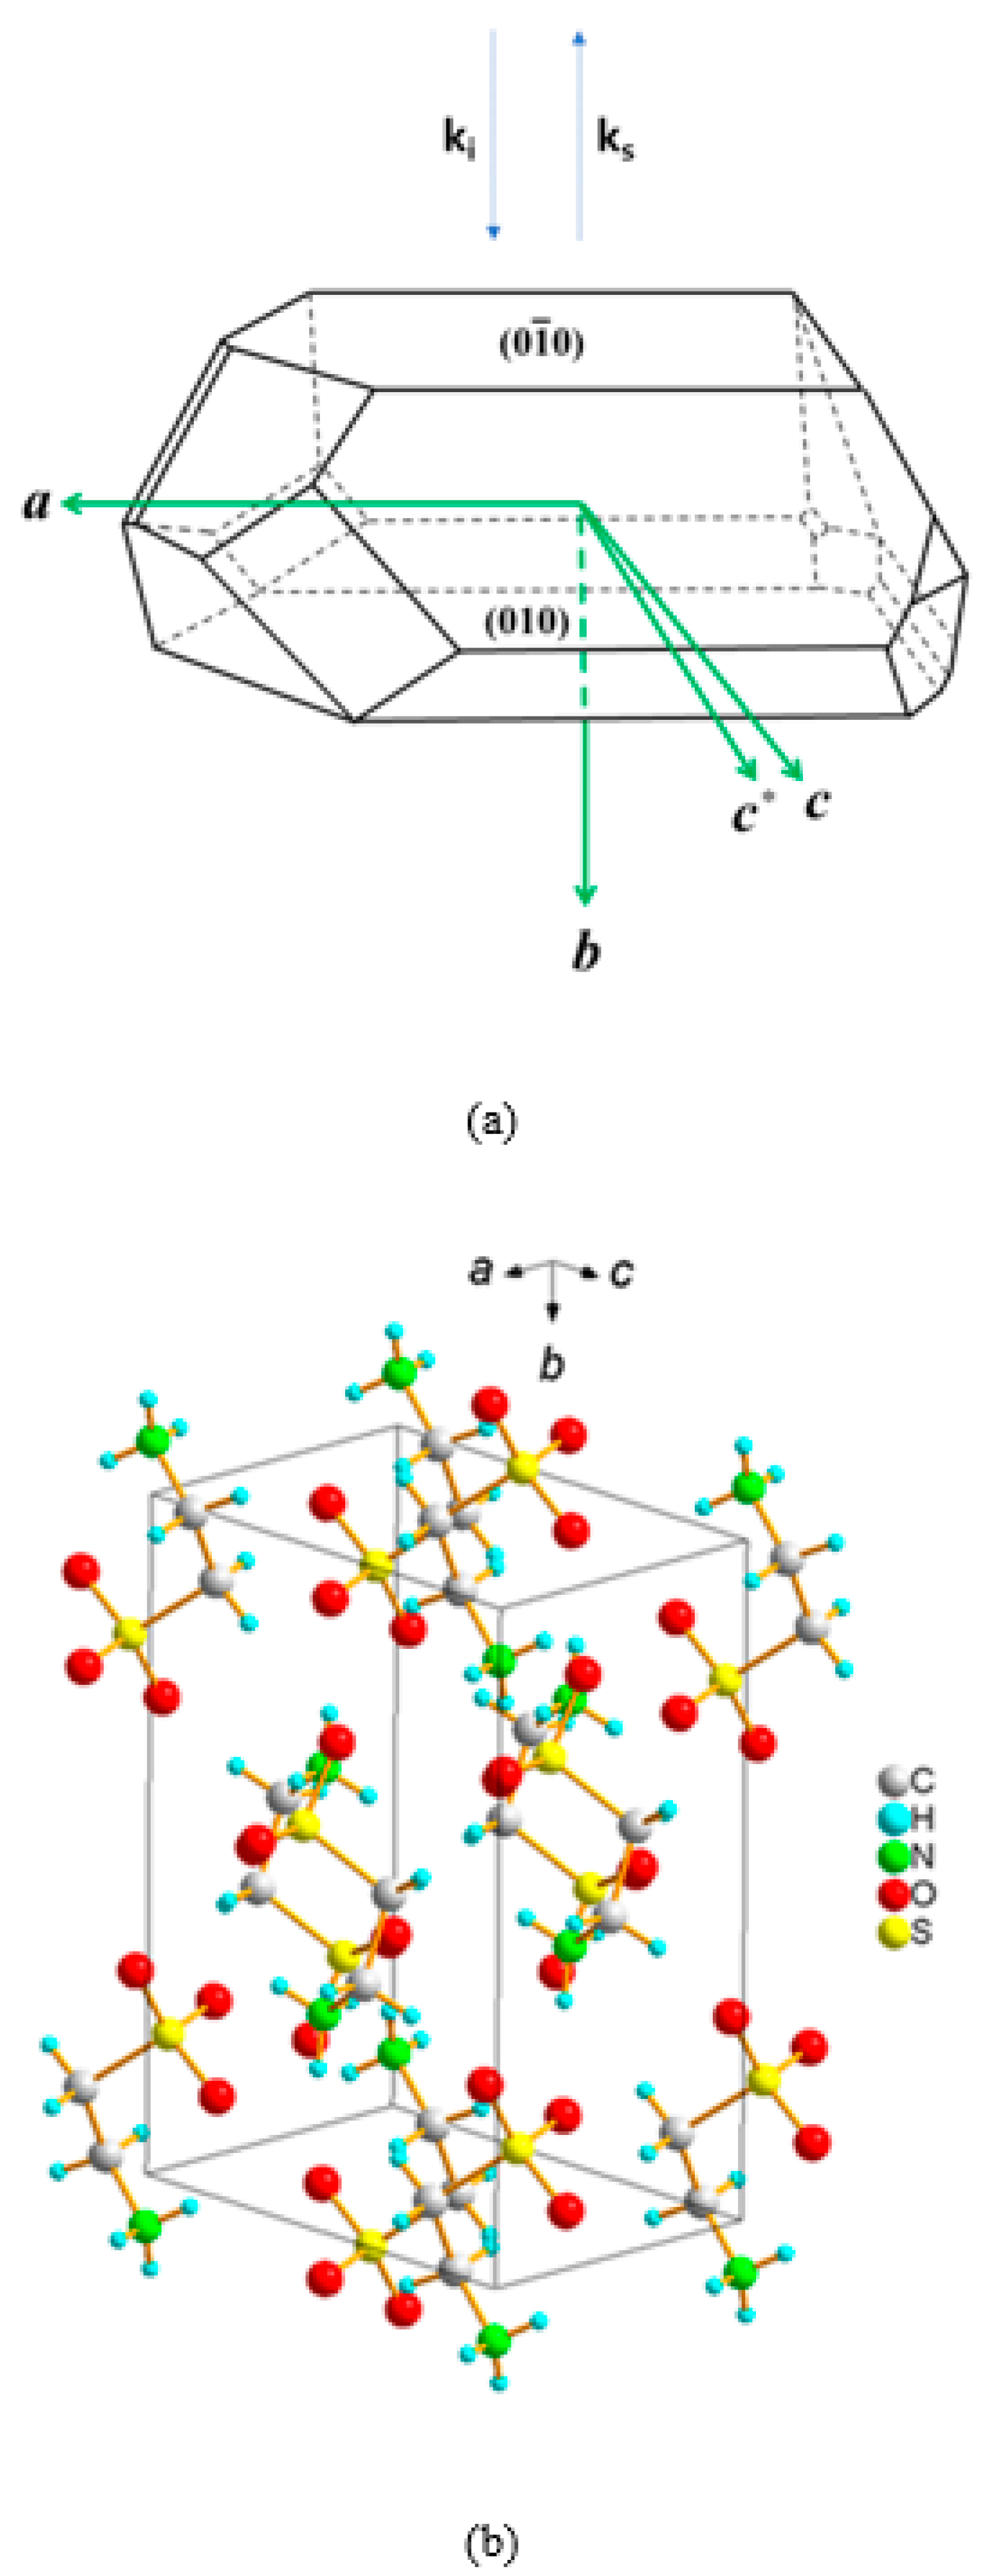
Figure 1a,b shows the morphology of the taurine single crystal along with the crystallographic axes and the crystallographic unit cell, respectively. The directions of the incident and the scattered light were denoted in terms of the wave vectors ki and ks, respectively. A conventional Brillouin scattering spectrometer (TFPI-1, JRS Co., Zürich, Switzerland) was used to perform the measurements. Sample excitation was achieved by using a diode-pumped solid-state laser with a wavelength of 532 nm. The sample was put in a cryostat stage (THMS 600, Linkam, Tadworth, England) for temperature variation. All measurements were carried out upon cooling. An optical microscope (BX41, Olympus, Tokyo, Japan) with an objective lens of ×20 magnification was employed for backscattering geometry along the monoclinic b axis, as shown in Figure 1. The polarization direction of the incident light was in the ac plane, and no analyzer was used for the scattered light. Before every measurement, the temperature was stabilized for at least 2 min.
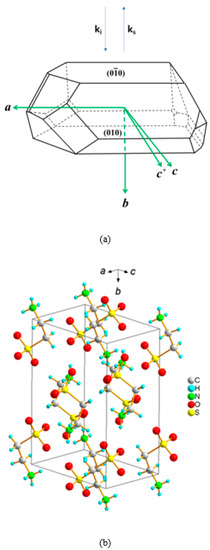
Figure 1.
(a) The crystal morphology along with major crystallographic surfaces and axes. Two vectors ki and ks denote the wave vectors of the incident and the scattered lights, respectively. c* direction is perpendicular to both a and b axes. (b) The crystallographic unit cell of the taurine single crystal.
3. Results and Discussion
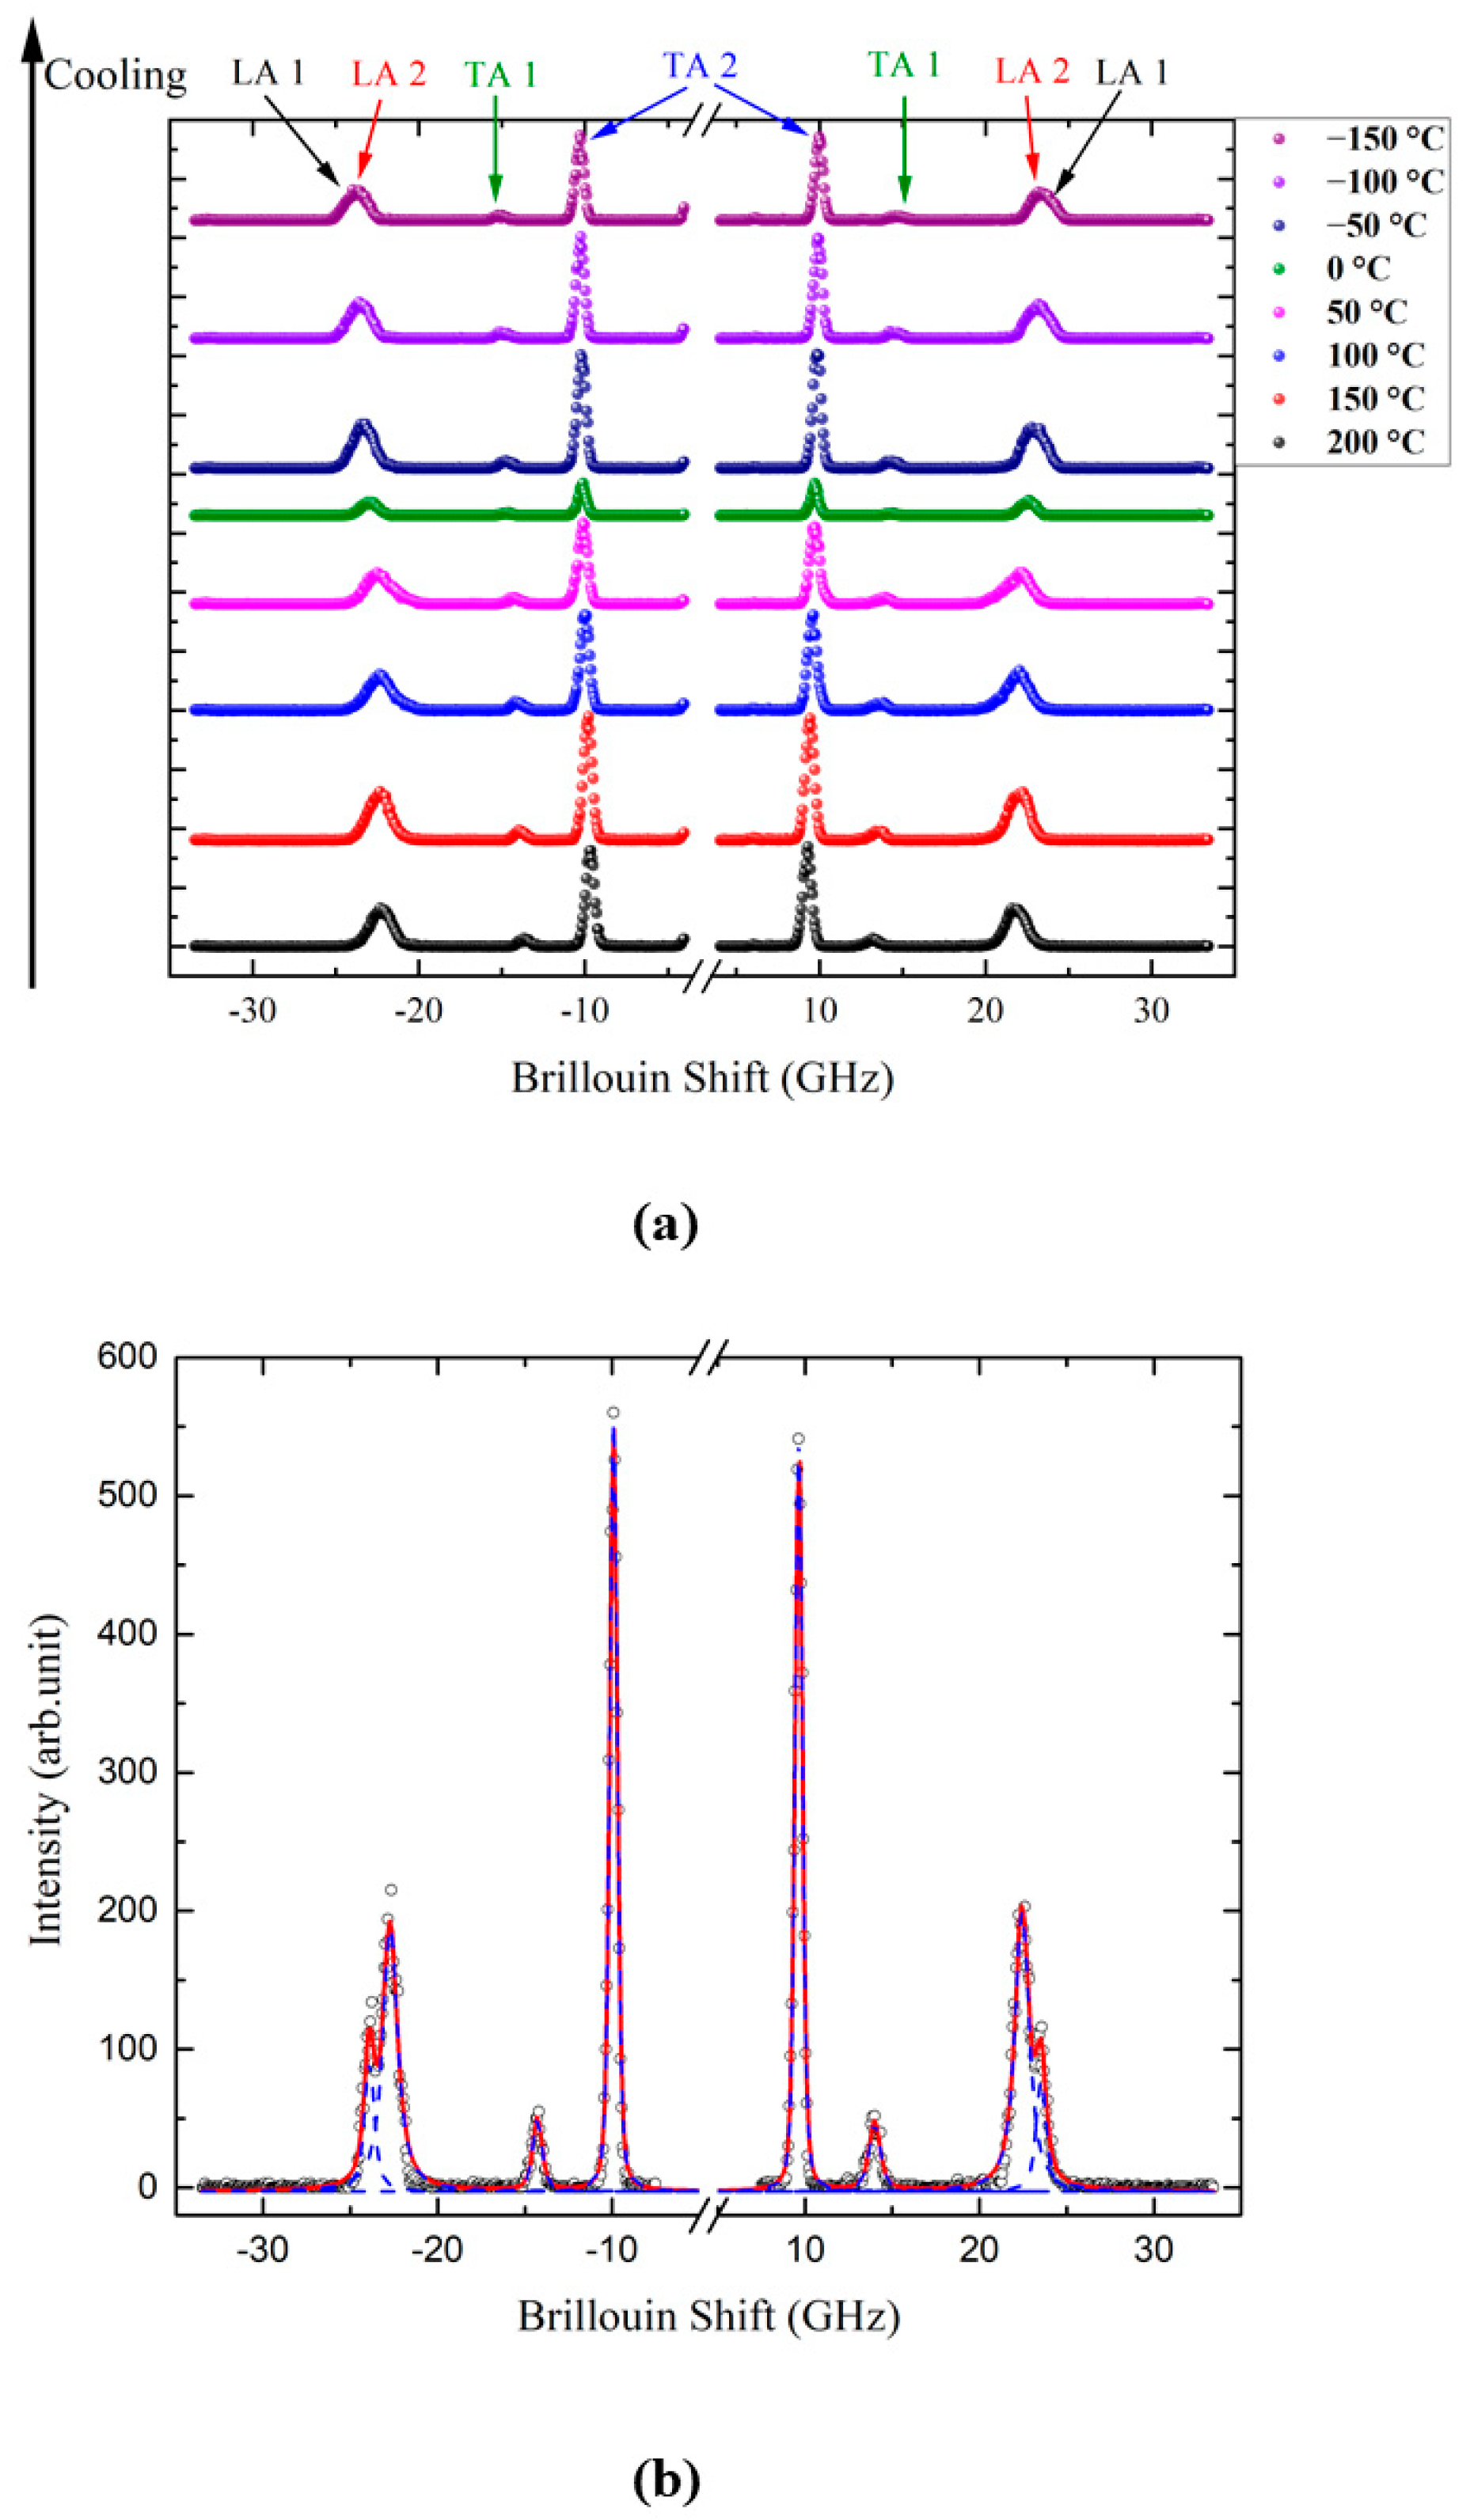
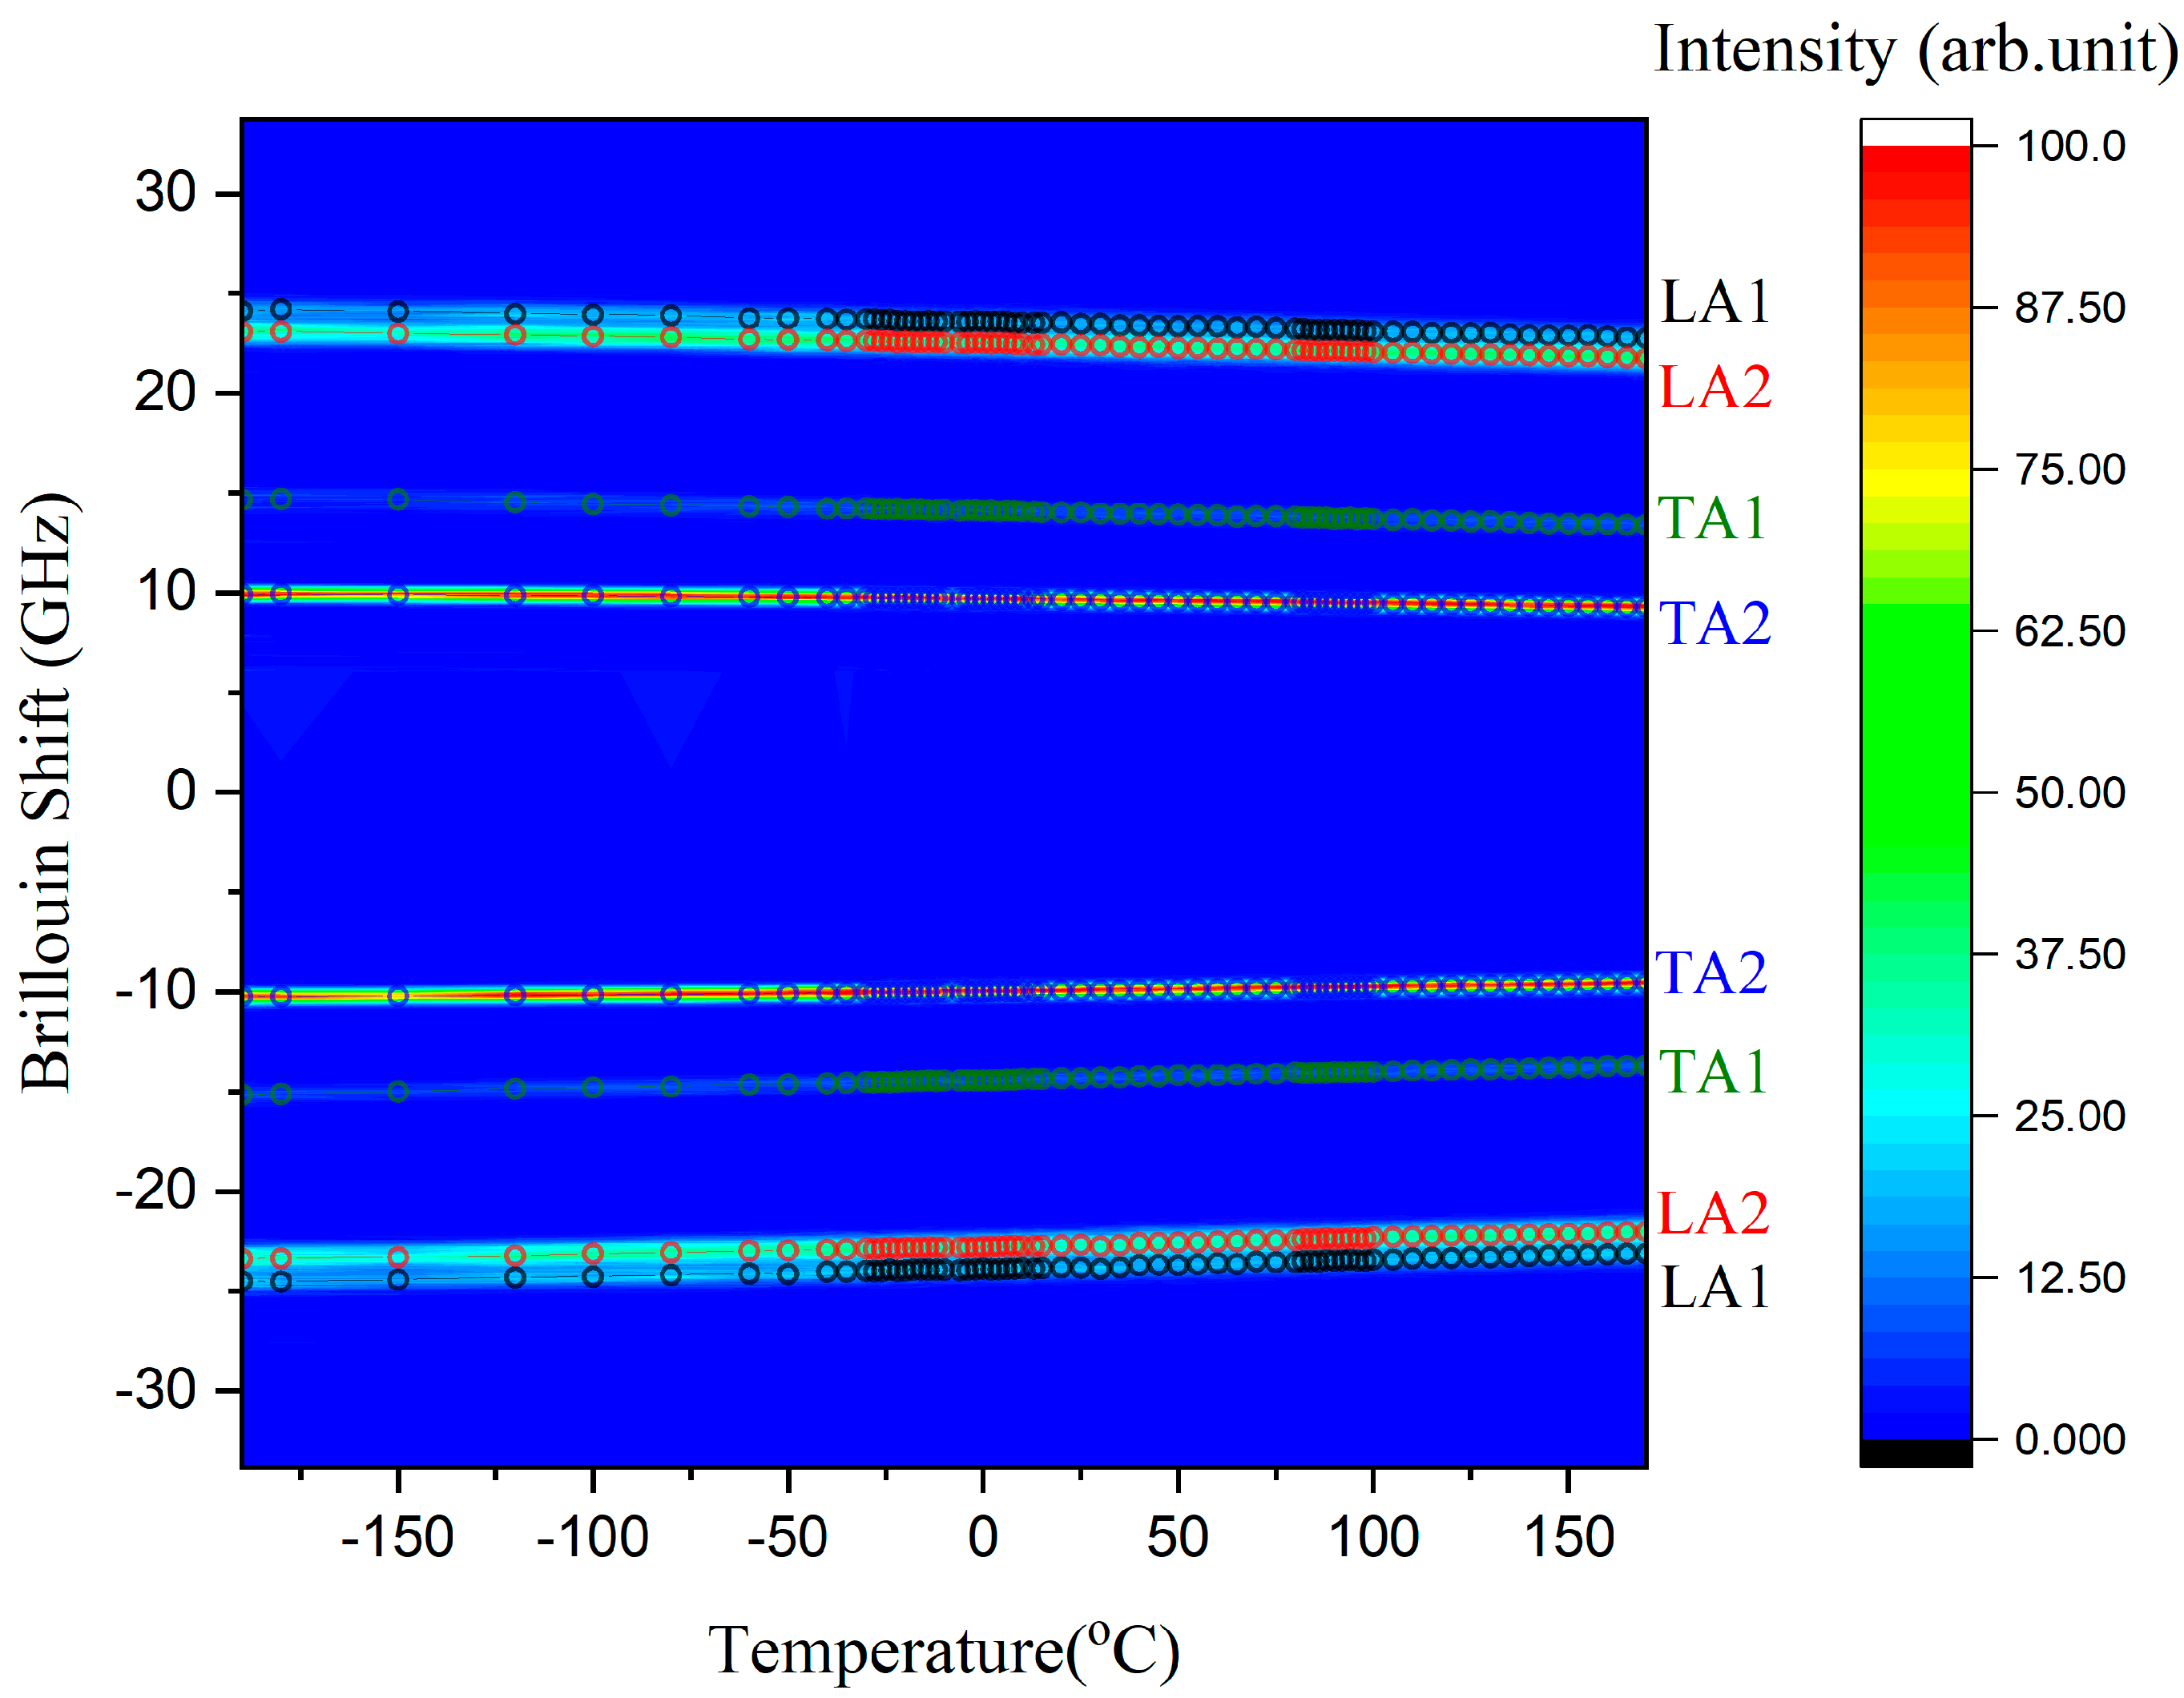
Figure 2a shows the Brillouin spectra of the taurine single crystal at several temperatures. Each Brillouin spectrum consists of one longitudinal acoustic (LA) mode at ~24 GHz and two transverse acoustic (TA) modes near 15 and 10 GHz. However, a close inspection shows that the LA mode shows splitting at all temperatures. Figure 2b shows one example of the curve-fitting result for the spectrum measured at 30 °C. Splitting of the LA mode has been observed from several birefringent single crystals, such as aspirin and 1,2,4,5-tetrabromobenzene single crystals [26,35]. Thus, the most probable origin of the splitting of the LA mode is the birefringence of the taurine single crystal, which the incident polarization feels. Another possible origin for the splitting is the possible existence of monoclinic twins, where different twin structures might contribute to the splitting of the LA mode. The half widths do not show noticeable changes, but the mode frequencies seem to exhibit a slight hardening upon cooling. Figure 3 shows the intensity color plot of the measured Brillouin spectra as a function of the temperature. It includes the traces of the mode frequencies of two LA modes (LA1 and LA2, denoted with descending frequencies) and two TA modes (TA1 and TA2, denoted with descending frequencies), all being denoted by circle symbols. All acoustic modes seem to become hardened upon cooling.
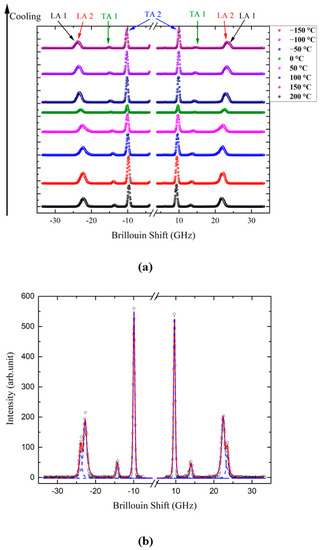
Figure 2.
(a) Brillouin spectra of a taurine crystal at a few temperatures. (b) The Brillouin spectra of a taurine crystal measured at 30 °C and the fitting lines for each acoustic mode.
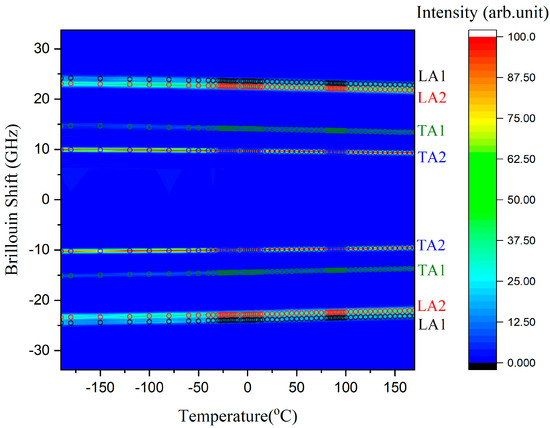
Figure 3.
The intensity color plot of the measured Brillouin spectra as a function of the temperature. Mode frequencies are denoted in terms of circle symbols.
Each Brillouin spectrum was curve-fitted by using the Voigt function, which is a convolution of a Lorentzian function (an approximate form of the response function of the damped harmonic oscillator for the phonon modes) and a Gaussian function (an instrumental function of the interferometer which causes a broadening of the spectrum). The Brillouin frequency shift (νB) corresponding to the mode frequency and the full width at half maximum (FWHM, ΓB) of each acoustic mode could be obtained as a function of the temperature. It clearly shows a splitting of the LA mode. There seems to be no central peak within the measured frequency range.
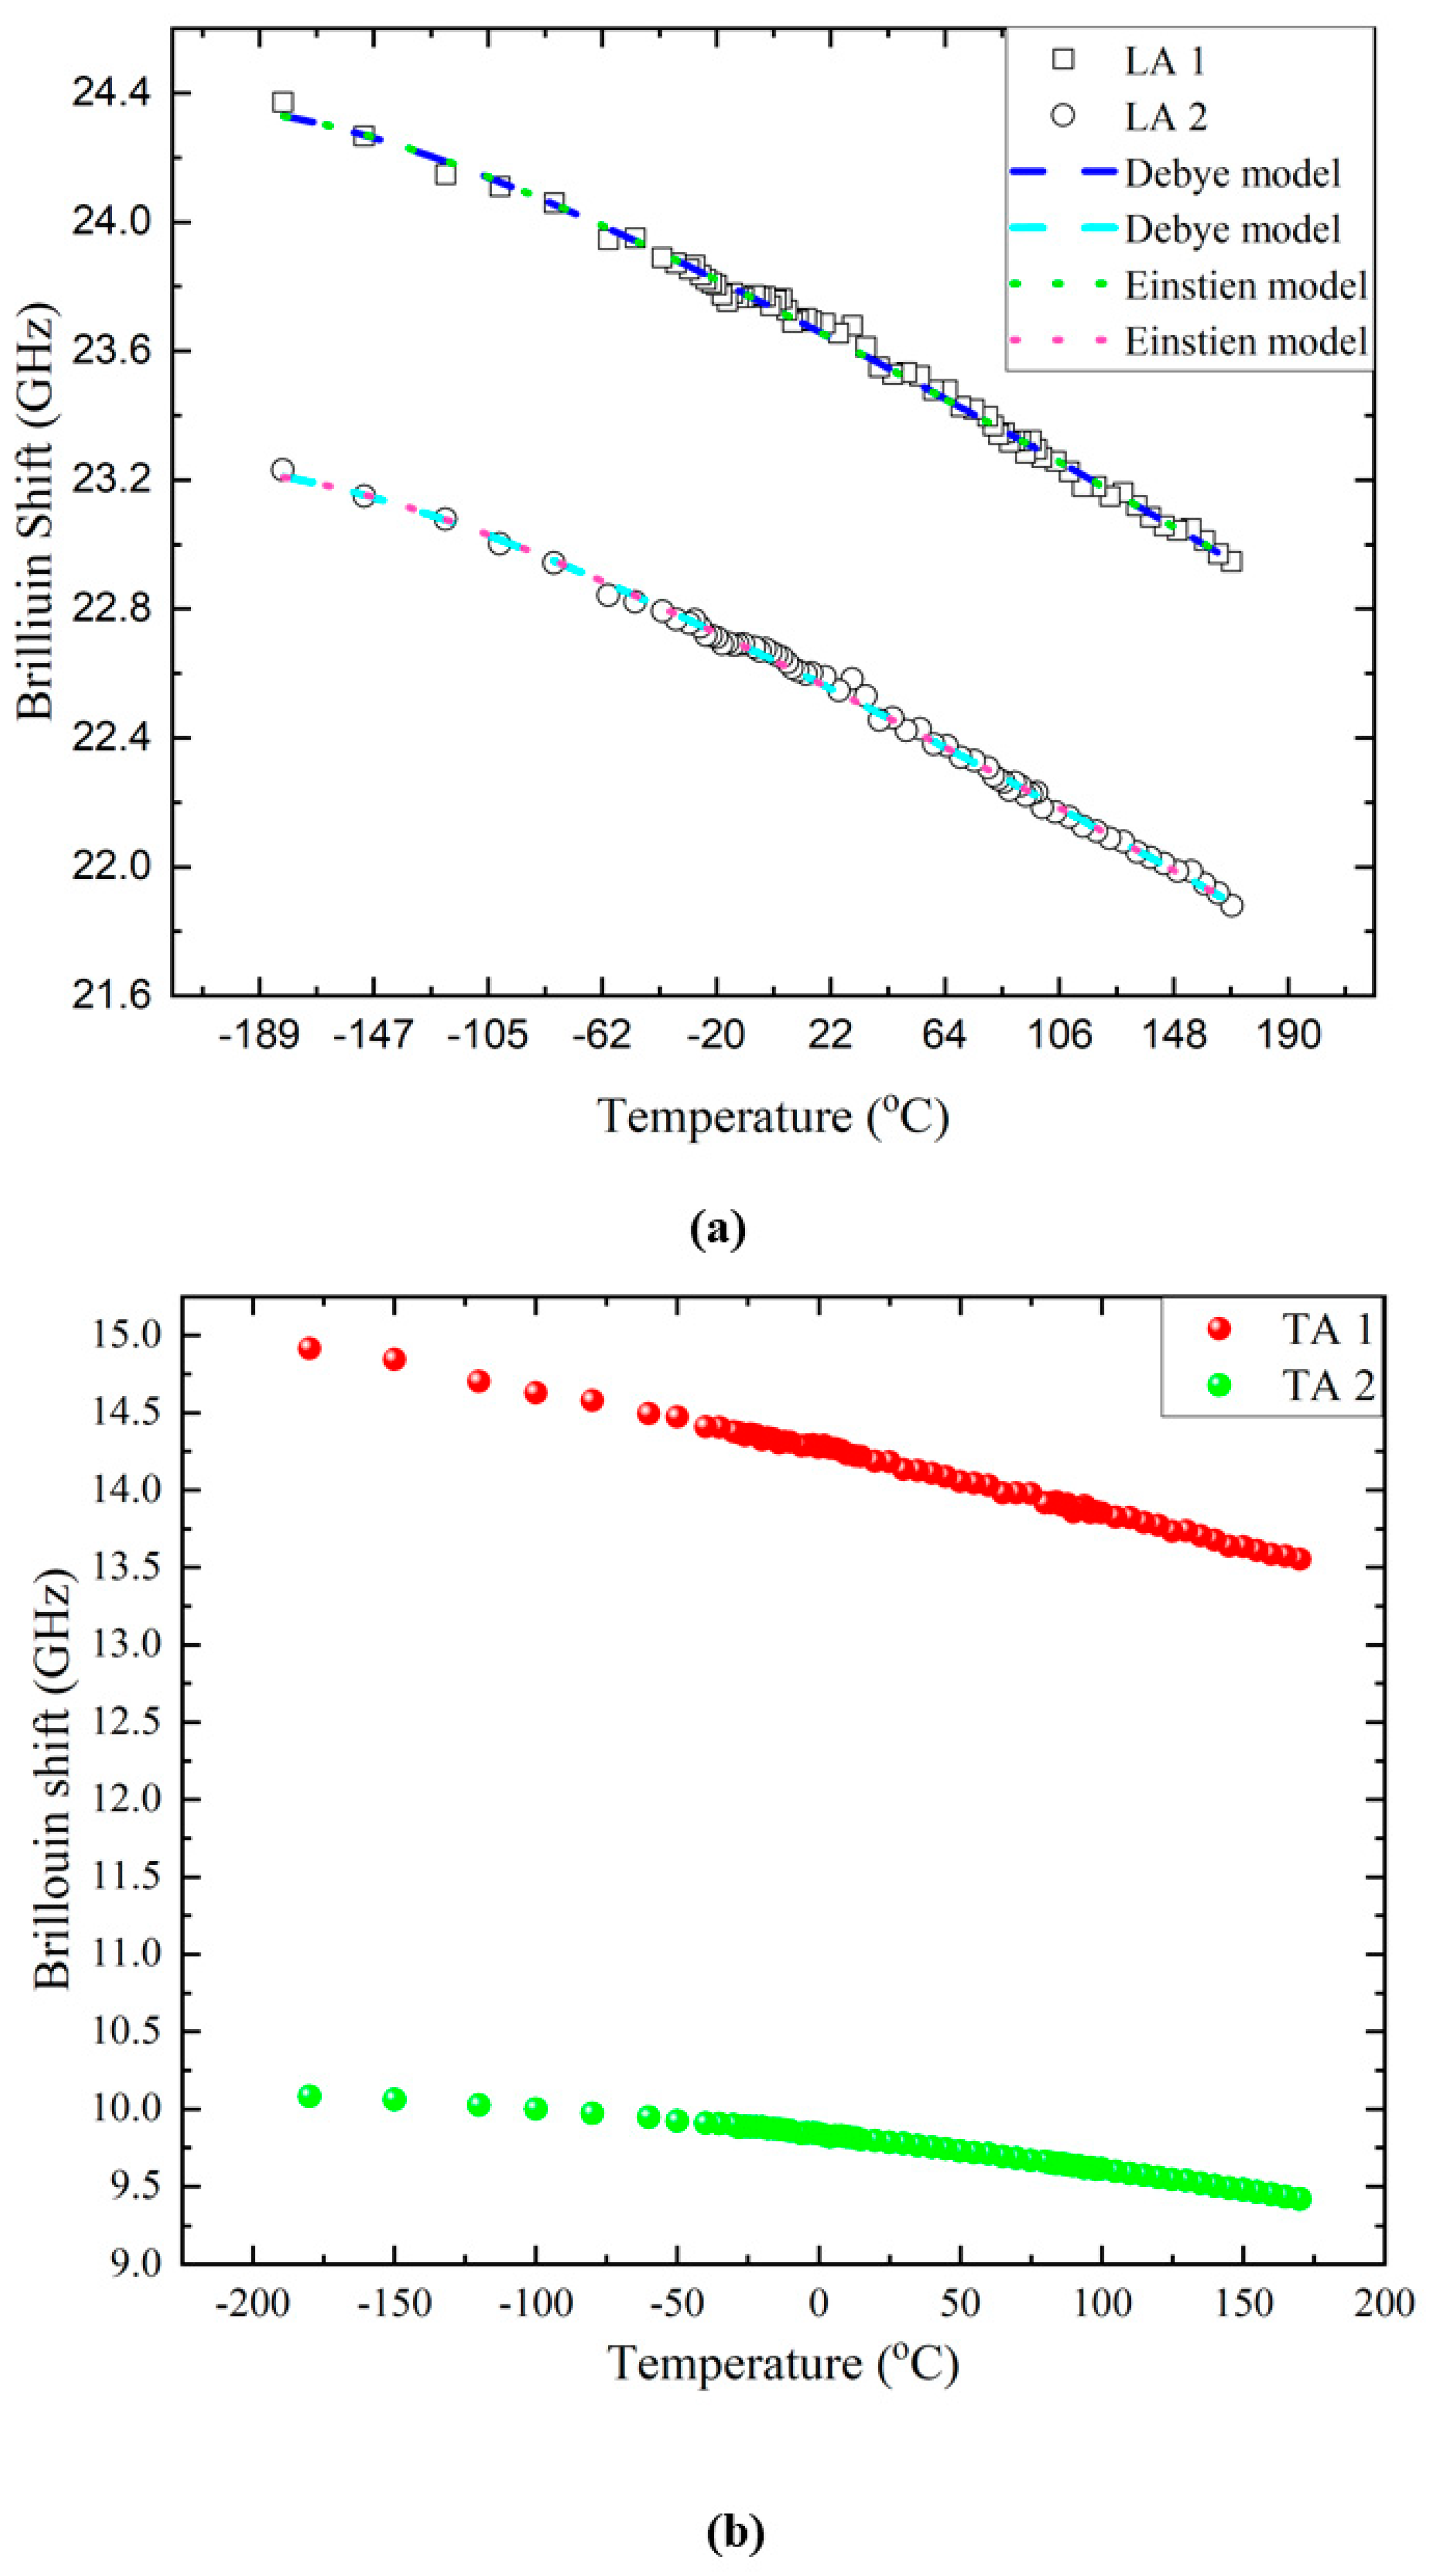
Figure 4 shows the temperature dependences of the Brillouin shifts of the acoustic modes. The split LA modes, as well as the two TA modes, show hardening upon cooling without any noticeable anomalies in the investigated temperature range. When there is a phase transition in condensed matters, one may observe various spectral changes in the light-scattering spectrum, such as the formation of strong central peaks in order-disorder phase transitions [36] or low-frequency soft optic modes [37], which may couple to the acoustic modes, resulting in substantial acoustic anomalies. These anomalies are in general associated with a downward softening or sudden, discontinuous changes in the mode frequencies concomitant with a significant increase in the half widths near or upon approaching the phase transition point [38]. The present result indicates that there is no experimental evidence for elastic anomalies associated with structural phase transitions in taurine single crystals at the present scattering geometry in the investigated temperature range of −185 °C to 175 °C. This result is in contrast to the result of the temperature-dependent Raman study where the authors suggested that a first-order phase transition occurs at −23 °C [16].
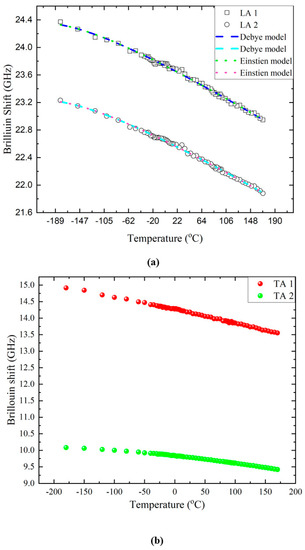
Figure 4.
Temperature dependences of the Brillouin frequency shift of (a) the LA modes and (b) the TA modes. The dotted and dashed lines in (a) denote the best-fitted results by the Debye and the Einstein models. See the text for details.
The monotonic increase in the mode frequency upon cooling is conventionally observed from normal solids which do not show any structural phase transition. In this case, normal lattice anharmonicity plays a critical role in the change of acoustic properties. There are two theoretical models and corresponding functions to describe the temperature dependence of the acoustic mode frequency: the Varshni function based on the Einstein model [39] and the Lakkad function based on the Debye approach [40]. When the Einstein model is adopted, the temperature dependence of the Brillouin shift is expressed as:
where are the fitting parameters. The is called the Einstein temperature. Lakkad’s approach is based on the Debye model, and the Brillouin shift is described by the following equation:
where
is the Debye function and are the fitting parameters. The is called the Debye temperature. The and in each model are the mode frequencies extrapolated to 0 K. The ratio of to is known to be 0.75 [41].
The temperature dependences of the mode frequencies of the LA1 and LA2 modes were curve-fitted by using either Equation (1) or Equation (2). The dotted and dashed lines in Figure 4a denote the best-fitted results obtained by the Debye and the Einstein models described above. There is no noticeable difference between the two fitting results. Table 1 shows the obtained best-fitted parameters. It shows that the Einstein temperature is approximately 107 °C (~380 K) while the Debye temperature is near 237 °C (~510 K) in both modes. Moreover, the ratio of to is 0.74 in both cases, close to the theoretical prediction of 0.75 [41]. All these results indicate that the acoustic mode behavior in taurine single crystals is dominated by the usual lattice anharmonicity frequently observed in normal solids and that there is no direct experimental evidence for elastic anomalies associated with any structural phase transition in the investigated temperature range.

Table 1.
The best-fitted results for the LA modes by using two models as described in the text.
The mode frequency and the FWHM measured in the backscattering geometry can be used to calculate the sound velocity (V) and the absorption coefficient (α) via the following equations:
In these equations, λ and n denote the wavelength of the excitation laser light and the refractive index, respectively. For the calculation, the temperature dependence of the refractive index is necessary. However, only the average refractive index of 1.52 (space-averaged one) and the average refractive index of 1.545 on the ac-plane were reported experimentally [22]. Thus, the two LA mode frequencies were averaged to get the average mode frequency, which was used to calculate the average sound velocity and the absorption coefficient by using the average refractive index on the ac-plane (1.545).
Figure 5a–c shows the calculated sound velocities and the absorption coefficients of the LA and the two TA modes, respectively, as a function of the temperature. The longitudinal sound velocity increases from ~3860 m/s at 170 °C to ~4100 m/s at −180 °C upon cooling. The absorption coefficient of the LA waves is approximately 3 × 10⁵ m−1 and does not show any substantial temperature dependence. The transverse sound velocities of the two TA modes show a monotonic increase upon cooling over the whole measured temperature range. The absorption coefficient is nearly constant in both cases. These results demonstrate that the investigated acoustic modes propagating along the [10] direction are not associated with a structural phase transition in the taurine single crystal over the temperature range of −185 °C to 175 °C.
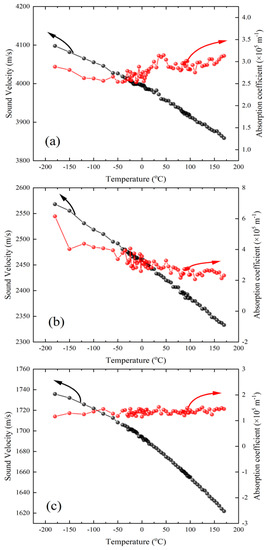
Figure 5.
Temperature dependence of the sound velocity and the absorption coefficient of (a) the LA mode, (b) the TA1 mode, and (c) the TA2 mode.
Moreira et al. predicted the theoretical refractive indices n1 = 1.601, n2 = 1.597, and n3 = 1.524 by using the extrapolation of the measured dielectric functions in the infrared range [22]. Since the sound velocity depends on the refractive index via Equation (4), it is worth checking the reliability of the calculated refractive indices of the taurine single crystal from the present study. The polarization of the incident light on the taurine crystal was in the ac-plane, and, thus, the two relevant refractive indices are n1 and n3. The sound velocities of the LA1 and LA2 modes were calculated by using these predicted refractive indices and Equation (4). The obtained results are shown in Supplementary Figure S1 in the Supplementary Materials. The two sound velocities are nearly the same within 0.21% on average, which indicates that the theoretical prediction for the refractive indices suggested by Moreira et al. [22] is reliable, at least from the viewpoint of the birefringence in the ac-plane.
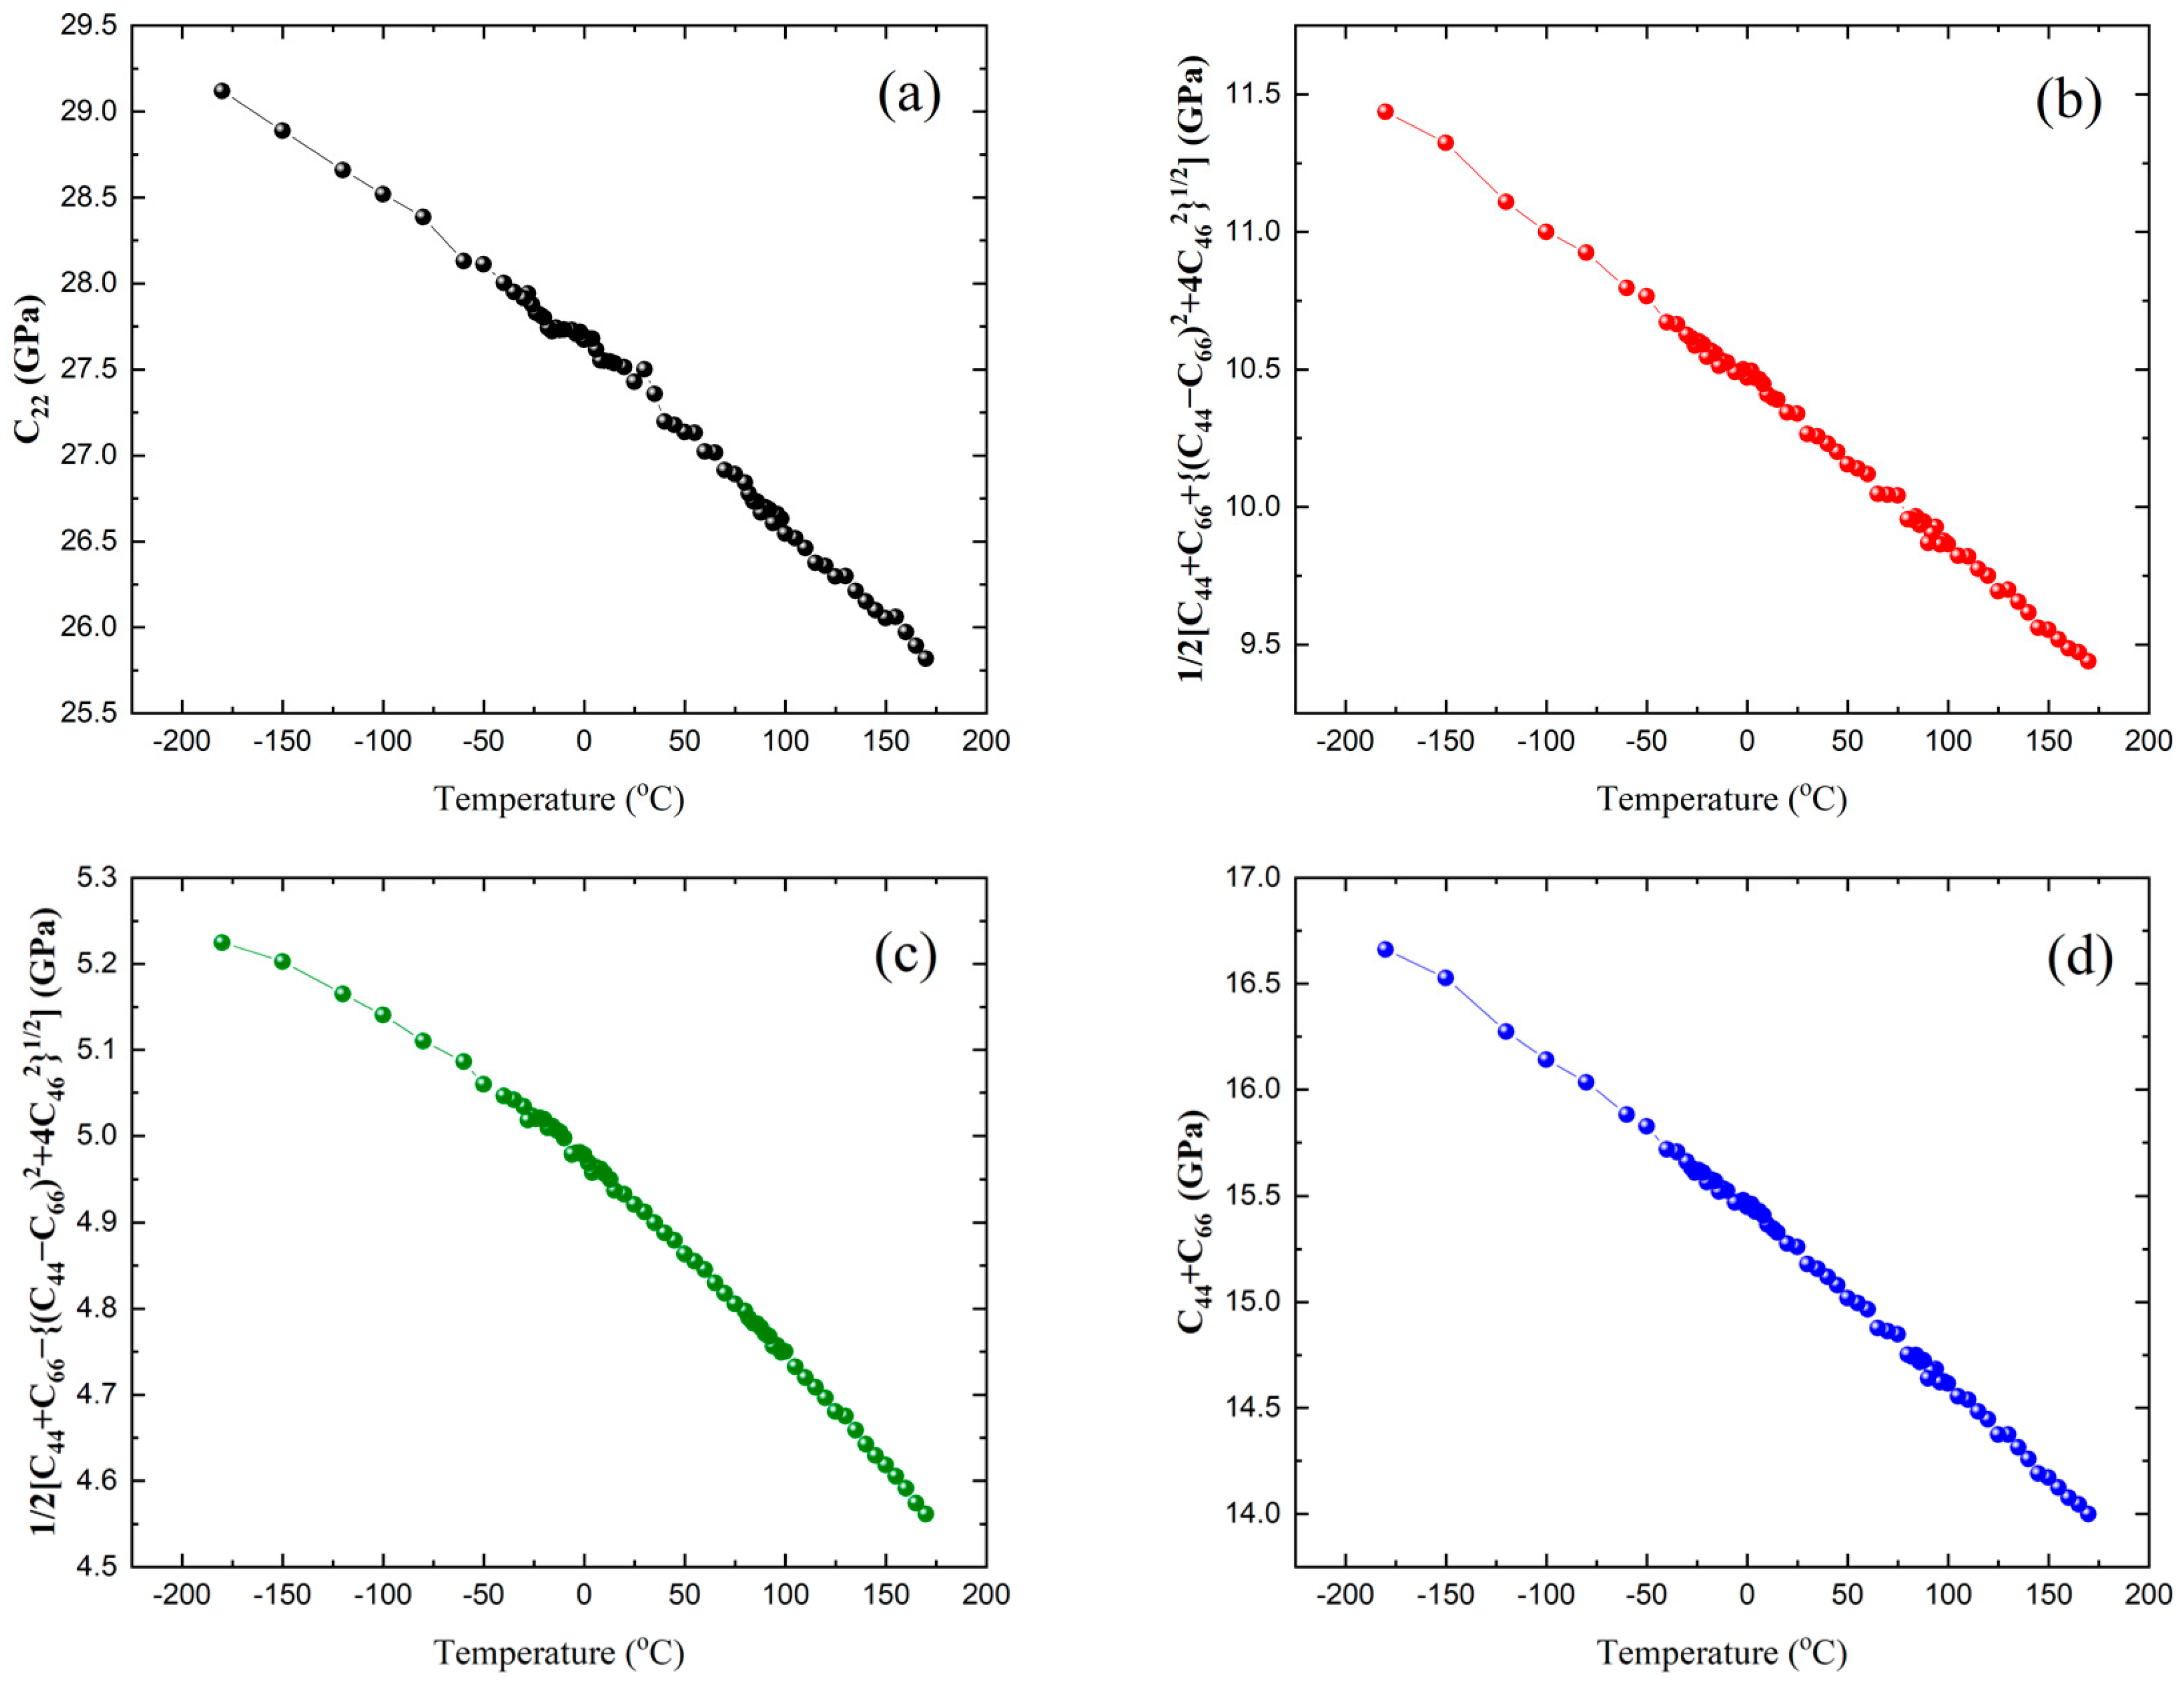
The elastic constants of the three acoustic modes can be calculated from the obtained sound velocities via ρV2, where ρ is the crystal density. The reported density of 1734 kg/m3 [11] was used for the calculation. Table 2 shows the relationship between the acoustic mode and its associated elastic constant in the monoclinic phase [42]. The LA mode corresponds to C22, while the two TA modes are related to two complex combinations of elastic constants. If the two elastic constants of the two TA modes are added, (C44 + C66) can be derived. Figure 6a–c shows the temperature dependences of the three elastic constants shown in Table 2.
Table 2.
The correlation between the three acoustic modes and the elastic constants obtained from the present scattering geometry. The numerical values are measured at 20 °C.
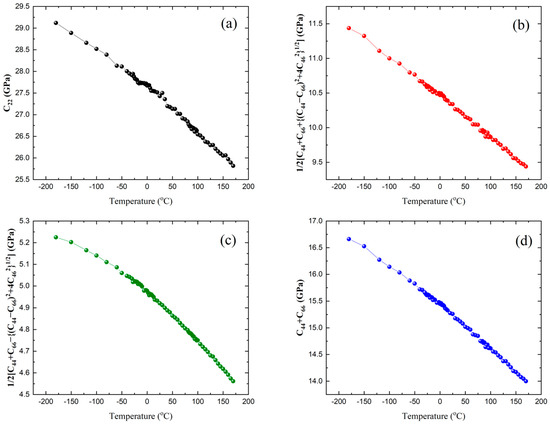
Figure 6.
Temperature dependence of (a) , (b) /2, (c) /2, and (d) .
C22 is 27.5 GPa at room temperature, while the two elastic constants of the two TA modes are 10.3 and 4.9 GPa, resulting in (C44 + C66) = 15.2 GPa. There is only one earlier report on the elastic constants of taurine crystals [32]. The C22 reported in this study is substantially different from this earlier value (~46.9 GPa), while (C44 + C66) is similar ((C44 + C66) in [32] is ~17.2 GPa). The origin of this large discrepancy for C22 is not clear at the moment, but it might be due to different experimental techniques having different probe frequencies and/or to different definitions of the crystal orientation. To check the reliability of the large value for C22 (~46.9 GPa) reported in [32], we made a taurine pellet sample by grinding the crystal into fine powders and pressing them into a circular plate. In the case of pellets and ceramics, the Brillouin light-scattering spectrum consists of continuously varying components whose scattering angle changes between 0 and 180° [43,44]. The Brillouin shift corresponding to the value of 46.9 GPa can be theoretically estimated to be about 31 GHz if we use the average refractive index of 1.574 [22]. This Brillouin shift corresponds to a longitudinal sound velocity of ~5200 m/s, which is unusually large for organic crystals like taurine. Figure 7 shows the comparison of the Brillouin spectrum of the taurine pellet with that of the single crystal measured at room temperature. Interestingly, the main peaks in the pellet spectrum are coincident with those of the single crystals measured at the present backscattering geometry. The broadening of the peaks in the pellet spectrum is due to the overlap of various acoustic modes with changing wave vectors. If the C22 value of ~46.9 GPa is correct, we should expect some significant contribution (or resonance peak) at ~31 GHz, where only the end of the tail of the main peak at ~23 GHz can be seen. Considering all these aspects, the previous report about the elastic constants of taurine [32] should be revisited.
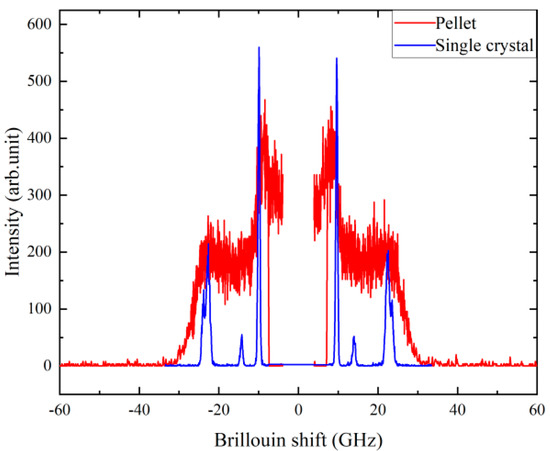
Figure 7.
Comparison of the Brillouin spectrum of taurine pellet and single-crystal samples measured at room temperature.
The strong hydrogen bond network exists in the ab plane, with tightly-locked molecules being confined in this plane [23]. On the other hand, the molecules are loosely packed along the c-axis. Thus, although we have not investigated C33 in this study due to the limited available crystal size, we expect that C33 may be much smaller than C22. Since elastic properties are important physical parameters required for various applications, such as pharmaceuticals or sensor applications, the present study and the succeeding studies will supply systematic elastic parameters which would accelerate the application of taurine molecules in various fields.
Lima et al. suggested that a structural phase transition existed near 250 K, where some changes in the Raman mode frequency occurred accompanied by enthalpic anomaly [16]. However, structural studies did not reveal any change in the space group of the taurine crystals. The acoustic anomalies and three sets of elastic constants showed monotonic increases upon cooling, which could be explained based on the normal anharmonic effect. Thus, the present study does not support the existence of low-temperature structural phase transitions in taurine single crystals. However, further studies based on other experimental techniques with different spatiotemporal probe scales are necessary in order to unambiguously settle this issue completely.
4. Conclusions
In summary, taurine single crystals were grown and investigated by Brillouin light scattering. One LA and two TA modes were observed, and their mode frequencies increased monotonically upon cooling from 175 °C to −180 °C. The temperature dependence of the LA mode could be satisfactorily explained by using both the Debye and the Einstein anharmonic models. The Einstein and Debye temperatures were 380 and 510 K, respectively, with a ratio of 0.74 consistent with theoretical predictions. The temperature dependences of the sound velocities, acoustic absorption coefficients, and associated elastic constants of taurine single crystals could be obtained for the first time. There was no noticeable anomaly in these acoustic properties, which does not support the existence of structural phase transitions suggested by Raman and calorimetric measurements in [16]. The birefringence of the split LA mode could be estimated and was consistent with the theoretical calculations of the three principal refractive indices [22].
Supplementary Materials
Supplementary materials can be found at https://www.mdpi.com/article/10.3390/ijms22137116/s1.
Author Contributions
J.-H.K., K.-S.L. and S.K. conceived and designed the experiments; K.-S.L. performed the crystal growth; D.H.K. and S.H.O. performed the Brillouin scattering experiments; D.H.K., S.H.O., J.-H.K., K.-S.L. and S.K. carried out a formal analysis of the experimental data; J.-H.K. prepared the original draft; J.-H.K., K.-S.L. and S.K. reviewed and did editing. All authors have read and agreed to the published version of the manuscript.
Funding
This work was supported by the Hallym University Research Fund, 2021 (HRF-202106-008).
Institutional Review Board Statement
Not applicable.
Informed Consent Statement
Not applicable.
Data Availability Statement
The data presented in this study is contained within the aricle.
Conflicts of Interest
The authors declare no conflict of interest.
References
- Stapleton, P.P.; Charles, R.P.; Redmond, H.P.; Bouchier-Hayes, D.J. Taurine and human nutrition. Clin. Nutr. 1997, 16, 103. [Google Scholar] [CrossRef]
- Timbrell, J.A.; Seabra, V.; Waterfield, C.J. The in vivo and in vitro protective properties of taurine. Gen. Pharmacol. 1995, 26, 453. [Google Scholar] [CrossRef]
- Schaffer, S.; Takahashi, K.; Azuma, J. Role of osmoregulation in the actions of taurine. Amino Acids 2000, 19, 527. [Google Scholar] [CrossRef] [PubMed]
- Aruoma, O.I.; Halliwell, B.; Hoey, B.M.; Butler, J. The antioxidant action of taurine, hypotaurine and their metabolic precursors. Biochem. J. 1998, 256, 251. [Google Scholar] [CrossRef]
- Hasanzadeh, M.; Pournaghi-Azar, M.H.; Shadjou, N.; Jouyban, A. Electropolymerization of taurine on gold surface and its sensory application for determination of captopril in undiluted human serum. Mater. Sci. Eng. C Mater. Biol. Appl. 2014, 38, 197. [Google Scholar] [CrossRef]
- Jin, J.B.; Liu, D.Q.; Zhang, D.D.; Yin, Y.H.; Zhao, X.Y.; Zhang, Y.F. Taurine as an additive for improving the fouling resistance of nanofiltration composite membranes. J. Appl. Polym. Sci. 2015, 11, 41620. [Google Scholar] [CrossRef]
- Sutherland, H.H.; Young, D.W. The crystal and molecular structure of taurine. Acta Cryst. 1963, 16, 897. [Google Scholar] [CrossRef]
- Okaya, Y. Refinement of the crystal structure of taurine, 2-aminoethylsulfonic acid. An example of computer-controlled experimentation. Acta Cryst. 1966, 21, 726. [Google Scholar] [CrossRef]
- Briant, C.E.; Jones, D.W. Neutron refinement of the crystal structure of partially exchanged taurine. J. Chem. Crystallogr. 1997, 27, 481. [Google Scholar] [CrossRef]
- Görbitz, C.H.; Pryds, K.; Ugland, S. Taurine. Acta Cryst. 2000, C56, e23. [Google Scholar] [CrossRef] [Green Version]
- Hibbs, D.E.; Austin-Woods, C.J.; Platts, J.A.; Overgaard, J.; Turner, P. Experimental and Theoretical Charge Density Study of the Neurotransmitter Taurine. Chem. Eur. J. 2003, 9, 1075. [Google Scholar]
- Waller, M.P.; Howard, S.T.; Platts, J.A.; Piltz, R.O.; Willock, D.J.; Hibbs, D.E. Novel Properties from Experimental Charge Densities: An Application to the Zwitterionic Neurotransmitter Taurine. Chem. Eur. J. 2006, 12, 7603. [Google Scholar] [CrossRef]
- Ohno, K.; Mandai, Y.; Matsuura, H. Vibrational spectra and molecular conformation of taurine and its related compounds. J. Mol. Struct. 1992, 268, 41. [Google Scholar] [CrossRef]
- Frere, P.T.C.; Melo, F.E.A.; Filho, J.M. Polarized Raman and Infrared Spectra of Taurine Crystals. J. Raman Spectrosc. 1996, 27, 507. [Google Scholar] [CrossRef]
- Lima, R.J.C.; Teixeira, A.M.R.; Freire, P.T.C.; Sasaki, J.M.; Ayala, A.P.; Melo, F.E.A.; Filho, J.M. High-pressure Raman study of taurine crystal. J. Raman Spectrosc. 2001, 32, 27. [Google Scholar] [CrossRef]
- Lima, R.J.C.; Freire, P.T.C.; Sasaki, J.M.; Melo, F.E.A.; Filho, J.M.; Moreira, R.L. Temperature-dependent Raman study of taurine single crystal. J. Raman Spectrosc. 2001, 32, 751. [Google Scholar] [CrossRef]
- Freire, P.T.C.; Melo, F.E.A.; Filho, J.M.; Lima, R.J.C.; Teixeira, A.M.R. The behavior of NH3 torsional vibration of l-alanine, l-threonine and taurine crystals under high pressure: A Raman spectroscopic study. Vib. Spectrosc. 2007, 45, 99. [Google Scholar] [CrossRef]
- Cavaignac, A.L.O.; Lima, R.J.C.; Filho, P.F.F.; Moreno, A.J.D.; Freire, P.T.C. High-temperature Raman study of L-alanine, L-threonine and taurine crystals related to thermal decomposition. Phys. B 2016, 484, 22. [Google Scholar] [CrossRef]
- Maiti, M.; Thomas, S.; Debnath, A.; Kapoor, S. Raman and XPS study on the interaction of taurine with silver nanoparticles. RSC Adv. 2016, 6, 56406. [Google Scholar] [CrossRef]
- Dai, Z.; Xu, X.; Gu, Y.; Li, X.; Wang, F.; Lian, Y.; Fan, K.; Cheng, X.; Chen, Z.; Sun, M.; et al. A terahertz study of taurine: Dispersion correction and mode couplings. J. Chem. Phys. 2017, 146, 124119. [Google Scholar] [CrossRef]
- Bajaj, N.; Bhatt, H.; Vishwakarma, S.R.; Thomas, S.; Murli, C.; Deo, M.N. Low temperature IR spectroscopic study of torsional vibrations of taurine. AIP Conf. Proc. 2017, 1942, 030017. [Google Scholar]
- Moreira, R.L.; Lobo, R.P.S.M.; Dias, A. Infrared dispersion analysis and Raman scattering spectra of taurine single crystals. Spectrochim. Acta Part A 2018, 188, 276. [Google Scholar] [CrossRef]
- Beukes, J.A.; Mo, F.; van Beek, W. X-Ray induced radiation damage in taurine: A combined X-ray diffraction and Raman study. Phys. Chem. Chem. Phys. 2007, 9, 4709. [Google Scholar] [CrossRef] [PubMed]
- Brillouin, L. Diffusion de la lumière et des rayons X par un corps transparent homogène. Annal. Physique 1922, 17, 88–122. [Google Scholar] [CrossRef]
- Cummins, H.Z.; Levanyuk, A.P. Light Scattering Near Phase Transitions, 1st ed.; North-Holland Publishing Company: Amsterdam, The Netherlands, 1983; pp. 291–502. [Google Scholar]
- Ko, J.-H.; Lee, K.-S.; Ike, Y.; Kojima, S. Elastic properties of aspirin in its crystalline and glassy phases studied by micro-Brillouin scattering. Chem. Phys. Lett. 2008, 465, 36. [Google Scholar] [CrossRef]
- Ko, J.-H.; Kim, T.H.; Lee, K.-S.; Kojima, S. Acoustic properties of aspirin in its various phases and transformation stages studied by Brillouin scattering. J. Non-Cryst. Solids 2011, 357, 547. [Google Scholar] [CrossRef]
- Ko, J.-H.; Kim, T.H.; Lee, K.-S.; Kojima, S. Brillouin scattering study on crystalline and glassy states of anti-inflammatory racemic S(+)–R(−) ibuprofen. Chem. Phys. Lett. 2011, 515, 221. [Google Scholar] [CrossRef]
- Kwon, H.-J.; Kim, T.H.; Ko, J.-H.; Hwang, Y.-H. Relaxation phenomena in supercooled liquid and glassy acetaminophen studied by dielectric, photon correlation and Brillouin light scattering spectroscopies. Chem. Phys. Lett. 2013, 556, 117. [Google Scholar] [CrossRef]
- Shibata, T.; Takayama, H.; Kim, T.H.; Kojima, S. Acoustic and thermal anomalies in a liquid–glass transition of racemic S(+)–R(−) ketoprofen. Chem. Phys. Lett. 2014, 592, 80. [Google Scholar] [CrossRef] [Green Version]
- Shibata, T.; Kojima, S. Liquid, glass, and crystalline indomethacin studied by Brillouin scattering. Jpn. J. Appl. Phys. 2018, 57, 07LB03. [Google Scholar] [CrossRef] [Green Version]
- Haussühl, S. Notizen: Elastische und thermoelastische Konstanten von NH2(CH2)2SO3H (Taurin). Z. Naturforsch. A 1965, 20, 1235. [Google Scholar] [CrossRef]
- Lind, G.; Kewley, R. Electron Spin Resonance of γ-Irradiated Taurine. Can. J. Chem. 1972, 50, 43. [Google Scholar] [CrossRef] [Green Version]
- Takiyama, H. Supersaturation operation for quality control of crystalline particles in solution crystallization. Adv. Powder Technol. 2012, 23, 273. [Google Scholar] [CrossRef]
- Ko, J.-H.; Lee, K.-S.; Sahoo, S.C.; Naumov, P. Isomorphous phase transition of 1,2,4,5-tetrabromobenzene jumping crystals studied by Brillouin light scattering. Solid State Commun. 2013, 173, 46. [Google Scholar] [CrossRef]
- Ko, J.-H.; Kojima, S.; Koo, T.-Y.; Jung, J.H.; Won, C.J.; Hur, J. Elastic softening and central peaks in BaTiO3 single crystals above the cubic-tetragonal phase-transition temperature. Appl. Phys. Lett. 2008, 93, 102905. [Google Scholar] [CrossRef] [Green Version]
- Maczka, M.; Hanuza, J.; Ko, J.-H.; Kojima, S. High-resolution broadband Brillouin scattering study of antiferroelectric phase transition in CsBi(MoO4)2. Phys. Rev. B 2003, 68, 174101. [Google Scholar] [CrossRef]
- Rehwald, W. The study of structural phase transitions by means of ultrasonic experiments. Adv. Phys. 1973, 22, 721. [Google Scholar] [CrossRef]
- Varshni, Y.P. Temperature Dependence of the Elastic Constants. Phys. Rev. B 1970, 2, 3952. [Google Scholar] [CrossRef]
- Lakkad, S.C. Temperature Dependence of the Elastic Constants. J. Appl. Phys. 1971, 42, 4277. [Google Scholar] [CrossRef]
- Sonehara, T.; Tatsu, E.; Saikan, S. Temperature dependence of the Brillouin frequency shift in crystals. J. Appl. Phys. 2007, 101, 103507. [Google Scholar] [CrossRef]
- Errandonea, G. Elastic and mechanical studies of the transition in LaP5O14: A continuous ferroelastic transition with a classical Landau-type behavior. Phys. Rev. B 1980, 21, 5221. [Google Scholar] [CrossRef]
- Hernandez, J.; Li, G.; Cummins, H.Z.; Callender, R.H. Low-frequency light-scattering spectroscopy of powders. J. Opt. Soc. Am. B 1996, 13, 1130. [Google Scholar] [CrossRef]
- Ko, J.-H.; Kim, D.H.; Kojima, S.; Kim, J.-H.; Choo, W.K. Brillouin Scattering Study on Polycrystalline Relaxor Ferroelectrics. Jpn. J. Appl. Phys. 2003, 42, 3076. [Google Scholar] [CrossRef]


Publisher’s Note: MDPI stays neutral with regard to jurisdictional claims in published maps and institutional affiliations. |
© 2021 by the authors. Licensee MDPI, Basel, Switzerland. This article is an open access article distributed under the terms and conditions of the Creative Commons Attribution (CC BY) license (https://creativecommons.org/licenses/by/4.0/).