Abstract
Humans have developed effective survival mechanisms under conditions of nutrient (and energy) scarcity. Nevertheless, today, most humans face a quite different situation: excess of nutrients, especially those high in amino-nitrogen and energy (largely fat). The lack of mechanisms to prevent energy overload and the effective persistence of the mechanisms hoarding key nutrients such as amino acids has resulted in deep disorders of substrate handling. There is too often a massive untreatable accumulation of body fat in the presence of severe metabolic disorders of energy utilization and disposal, which become chronic and go much beyond the most obvious problems: diabetes, circulatory, renal and nervous disorders included loosely within the metabolic syndrome. We lack basic knowledge on diet nutrient dynamics at the tissue-cell metabolism level, and this adds to widely used medical procedures lacking sufficient scientific support, with limited or nil success. In the present longitudinal analysis of the fate of dietary nutrients, we have focused on glucose as an example of a largely unknown entity. Even most studies on hyper-energetic diets or their later consequences tend to ignore the critical role of carbohydrate (and nitrogen disposal) as (probably) the two main factors affecting the substrate partition and metabolism.
1. Introduction: Diet and Its Use in Energy Metabolism
At present, two main lines of study focus on metabolic acquisition, distribution and use of food energy to maintain efficiently human body functions. (1) The analysis of foods and diets, which largely uses centuries-old methodologies, and its subject of study is the relationship to diet of the body in relation to health and disease. (2) The analysis and function of cell and molecular effects of diet has developed during the last 8–9 decades, using the high pace of methodological advances and accumulated knowledge at the molecular and cellular level, with important inroads into the regulation of the cell, organ, and body homeostasis. Unfortunately, both lines run parallel, and there is not enough shared—connecting—knowledge to use the enormous amount of knowledge accumulated to help explain the direct relationships of dietary components with metabolic modulation and regulation, despite the paramount importance of this nexus. The complexity (and variability at all levels) or the problem hampers any approach to the health (and survival) problems related to diet.
In this focused review, we intend to present a few critical questions that may help to bridge the gap between these two lines. In most cases, the lack of hard research data is surprising [1]. The excessive narrowness of these study goals is even more severe [2]. The forfeiting of a large mass of knowledge accumulated just before the present century [3], and limited use of quantitative approaches [4], effectively breaks the continuum of research and knowledge that has brought us to the scattering of “modern” discoveries [5], in addition to the unjustified predominance of easily available (despite their complexity) recent techniques to obtain knowledge (and publishable material).
Because of its central role in metabolism (and physiology) and its assumed predominance on diet, we focused this lineal study on glucose, its dietary sources, its metabolic utilization, regulation and –specially– on its real “essentiality” and required supply.
2. Why Glucose?
All heterotrophs need to periodically ingress chemical substrates to oxidize and extract enough energy to sustain their survival against predators and the scarcity of nutrients, and to allow for the maintenance of the species and the intergenerational transmission of information. This is a basic biological rule, from which, obviously, humans and other placental mammals cannot escape. Today, the methodology to produce, prepare, and ingest a variety of foods is enormous, but we continue to retain most of the essential metabolic pathways inherited from our archaeal ancestors [6]. In the end, the main—and overwhelming—process to obtain usable chemical energy is photosynthesis, which produces D-glucose, and from that, an enormous number of organic molecules which later we use to build, protect, and provide energy to maintain our structures and functions.
Glucose is far from being a “perfect” substrate [7,8] in the same way as oxygen [9] is, but both are widely available, and coevolution allows us to continue using them just for biologic economy reasons. Both are materials dangerous for cells to handle, but we use glucose since we are geared to its massive consumption because of its ubiquity for the essential fact that glucose is produced by autotrophs as basic tool for their own metabolism, thus “providing” us with it as a main energy staple.
We often tend to forget that glucose is a powerful reducing agent. It occurs, in part, because under physiological conditions its high reactivity is less patent. Glucose in physiological media is found in essentially five different forms, four of them non-reducing, cyclical, with an internal hemiacetalic bond (isomers α- and β- of glucopyranose or glucofuranose), and the “open” reactive aldehyde form [10] (Figure 1). These molecular species are maintained in equilibrium, which favor the predominance of the α- and β-glucopyranose forms [11]. They interconvert spontaneously at a relatively slow rate, which can be accelerated by the enzyme mutarotase [12]. These changes necessarily require going through the intermediate step of open aldehyde form [13]; during this brief period of high reactivity, glucose may combine with amines (i.e., in proteins), initially forming Schiff bases, but can bind also to a number of other molecules [13]. In consequence, this bound glucose is “lost” as a substrate for energy and growth, often becoming, instead, a hindrance to the stability and function of diverse proteins [14].
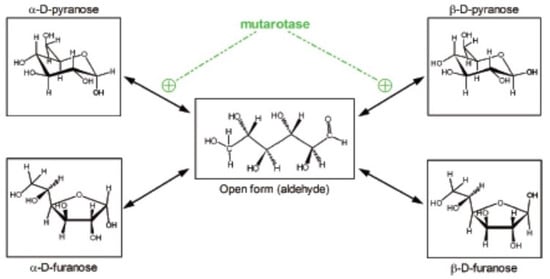
Figure 1.
Different structures of the glucose molecule present in biological systems. From Oliva et al. 2019 [10].
Most enzymes (and transporters) acting on glucose (and on some of its essential derivatives, such as glucose-6P) require glucose to be in the β-glucopyranose form [15], favoring its priority utilization because is in this form when the proximity of the -OH in C1 is closer to the C4-C5 pair, allowing the oxidation of the chain from the anomeric carbon. This selectivity, however, produces delays in glucose availability through the interconversion of (mainly) the α-isomer, predominant in plasma [11,13], that is non-usable “directly” in a number of metabolic processes. This limits the real-time access to glucose and thus its truly physiological concentration [10]. This difficulty has not been metabolically circumvented through evolution and has been massively ignored from the methodological point of view by researchers, as proven by the common but only approximate quantitative specific analysis of glucose using enzymatic methods [11].
Glucose, however, has considerable advantages as a primary energy-substrate source: it can be easily converted in two 3C fragments even under anaerobic conditions (via the classic Embden–Meyerhoff pathway), well preserved along evolution [6]. This quality is seldom recognized, especially considering the growing awareness on the perils of oxidative free radicals generated from oxygen metabolic interventions [9,16].
3. The 3C Fragments, the World around Pyruvate
Splitting one 6C unit (i.e., glucose) yields a variety of (essentially) 3C molecules: pyruvate, L-lactate, glycerol, alanine, serine, and phospho-enol-pyruvate (PEP), used for energy or synthetic pathways. 3C fragments are also generated from a number of key pathways in addition to straight glycolysis: the pentose-phosphate pathway, hexosamine metabolism, the Leloir (galactose) pathway, the catabolism of fructose and other monosaccharides as substrates, the incorporation of glycerides-glycerol, lactate, and a number of amino acid hydrocarbon skeletons. Not all three-carbon metabolites can be included in this 3C list. The clearest examples are propionate (yielding succinyl-CoA, see Section 7) and D-Lactate, a significant component of bacterial fermentation (including our microbiota), found in some foods. Its degradation is difficult [17] but does not proceed directly via pyruvate. In this review, we will reserve the term “lactate” for L-lactate as in most metabolic studies.
Pyruvate is the key 3C fragment from which the core of intermediary metabolism establishes the use of diet (or reserves/turnover) substrates (Figure 2), via direct oxidation for energy, used as building materials for biosynthesis or transport between pools (cell, organ, body) to achieve energy homeostasis and efficiency in metabolism. Pyruvate is also a main source of oxaloacetate (OAA) to regulate the TCA (tricarboxylic acid) cycle, i.e., the Krebs cycle (the second one) [18], or regenerate 6C units via gluconeogenesis. These processes require a critical control of the crossing of the mitochondrial membrane [19].
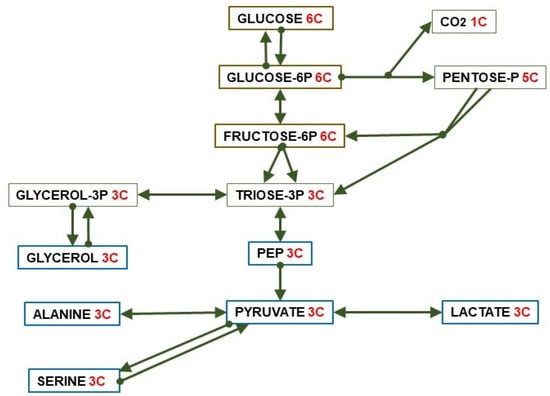
Figure 2.
Paths of conversion of glucose (6C) to 3C fragments.
Pyruvate helps maintain the redox state of cytoplasm via interconversion to lactate (lactate dehydrogenase) [20] as well as the transport through the cell membrane [21,22]. In any case, the main drain of pyruvate is the formation of acetyl-CoA via oxidative decarboxylation by pyruvate dehydrogenase [23]; this way, a 3C fragment becomes a 2C fragment and CO2.
The regulation of glucose fate and circulating levels has been studied exhaustively, and it has been found that the alteration of these processes may cause serious harm to energy homeostasis. Glucose is strictly controlled by a huge number of regulatory agents, including insulin, glucocorticoids, glucagon, intestinal peptides, catecholamines, cytokines, testosterone, estrogens, etc. [24]. They regulate glucose splanchnic production [25] and utilization [26,27,28]. Glucose modulates the production and secretion of insulin [29] and, indirectly, its hepatic inactivation [30]. However, insulin resistance affects very directly glucose uptake and metabolism, because of changes in insulin tissue receptors and signaling [31]. On the other side, the 3C fragments (mainly pyruvate, lactate, glycerol) are regulated within the cells, but not as extensively as is glucose in their inter-organ relationships. 3C substrates, such as lactate or glycerol can be easily taken up by a wide diversity of cells, even using less specific (or quite different) transport systems [32,33].
When the cell takes up lactate, it can immediately provide NADH in the cytosol, and then follow a number of diverse paths to provide C or energy (via conversion to 2C). In comparison, after a strongly regulated maintenance of its circulating levels, glucose is transported into the cell, converted to glucose-6P, and then it can be used for the production of 3C (and eventually 2C) through well-regulated mechanisms. The main potential inconvenient for plasma-carried 3C (specifically lactate) is its charge (a proton) and its reduced state, which necessarily has to be corrected via production of cytosolic NADH, but this is the same problem glucose generates at the level of triose-P dehydrogenase. In any case, glycerol or pyruvate do not comport these hindrances. It is well known that a high number of tissues use lactate for energy under exercise [34], limited insulin resistance [35], or as a cryptic “universal cell fuel” [36]. The brain is an active user of lactate [37] and glycerol [38,39]. Liver is a net lactate user, largely for gluconeogenesis [40,41]. White adipose tissue (WAT) can take up lactate for lipogenesis [42] or produce it from glucose in large amounts [43,44]. The intestine also provides 3C substrates, in part as a product of digestion [45]. The transfer of energy to tissues via 3C has been found to be much higher than often considered [46,47], constituting a clear alternative to intact glucose [47,48]. Under conditions of excess glucose availability, its conversion to 3C eases the pressure over the regulation of glycaemia and allows for the direct use of its energy via 3C [48,49], in a way comparable to the “pre-preparation” of fatty acids (2Cn) fragments to plasma-soluble ketone bodies (2C2 fragments). The relatively lax control and ease of direct metabolic incorporation allows for a loosely regulated use of 3C anywhere. This possibility is extensive to the nervous system, which can use 3C fragments to a large extent as a source of energy in addition to glucose (or as its substitute) [50].
Figure 3 shows the relationship between dietary nutrients and the 2C and 3C substrates pools. In addition to the carbohydrate paths shown in Figure 2, a large part of amino acid hydrocarbon skeletons can be incorporated to the 6C→3C pathways (largely glycolysis and gluconeogenesis) but also as intermediates of the TCA cycle (which eventually will result in OAA and then to a 3C fragment used for energy or synthesis. Lipids, essentially triacylglycerols (TAG), also provide 3C (as glycerol), but their carbon is essentially structured in 2C units (acetate, acetyl-CoA) or—massively—in 2Cn chains, such as fatty acids.
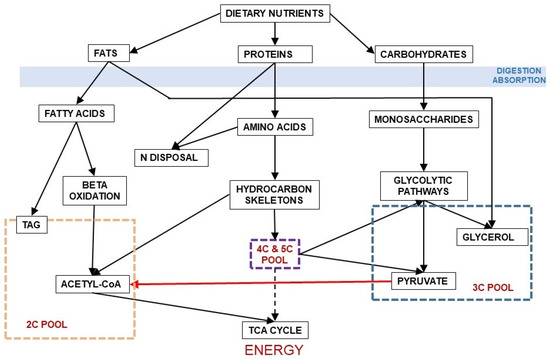
Figure 3.
Relationship between the main groups of dietary nutrients driving to the formation of 2C and 3C fragments. In red, the irreversible decarboxylative oxidation path of pyruvate (3C) to acetyl-CoA (2C).
4. Are There Glucose Specific Requirements? The Peculiarities of Erythrocytes and Nervous System Cells
Glucose (in general terms, carbohydrate) is required as a main dietary macro-component for humans. [51], also probably being an essential component of diet, at least by default [52]. The commonness, diverse forms, and high proportions of carbohydrates in many diets has masked this condition [52]. Nevertheless, the extended use of high-fat and high-protein diets resulting in inflammatory responses and metabolic alterations [53] points to the requirement of a sufficient amount of 6C substrates (preferably as 6Cn polysaccharides) in any normal health-sustaining diet, in proportions of 6Cn not different at present from our early hominid ancestors [54].
The notion that the brain only uses glucose as a substrate remains alive in many texts and studies, largely for the disproportionate basal consumption of glucose by the brain in comparison with most other organs [55]. However, the widespread existence of intercellular lactate-glucose micro-cycles between glia and neurons suggests otherwise [56,57]. The main substrate for brain energy changes with development [58], but the nervous system continues using a large proportion of blood glucose under standard conditions [55], whether this is a consequence of glia cells (i.e., astrocytes) producing lactate from glucose to feed neurons [59] or the neurons themselves using glucose directly is a question not yet settled [60,61]. The intensive utilization of lactate and glycerol by the brain as a whole has been known for more than half a century [38,62] and may be part of a system of protection against the chemical dangers posed by glucose reactivity.
From the earliest stages of development, the nervous system has specific needs for some nutrients, such as glucose, as key source of energy [63]; oligosaccharides containing galactose and other sugars [64]; 3C fragments, as indicated above; specific essential fatty acids [65]; and enough amino N and essential amino acids [66]. The needs of peripheral and enteric nervous systems are less known; in the last case, we have to include the direct relationships with intestinal microbiota [67]. In any case, it is widely acknowledged that the brain has priority over the rest of the body with respect to glucose supply [63]. The extent to which the requirements of 6C can be substituted by 3C is yet an object of discussion [60,61].
The erythrocytes (at least the non-nucleated mammal—including human—ones) are also peculiar with respect to the need for glucose. They require integer glucose, since they are not able to get energy via oxidation of 3C. Thus, these cells are considered purely glycolytic, releasing lactate from glucose [68]. Since the red blood cells need little energy and are a fundamental component of the blood (which carries glucose), their needs can be easily covered by direct uptake from plasma [69]. Because their consumption is non-oxidative (6C to 3C), the return of two 3C units per glucose does not alter the global equation of glucose consumption and do not represent a quantitatively critical factor, as can be the case with parts of our nervous systems.
5. 2C Substrates, the Critical Conditioning of the Lack of a Glyoxylate Shunt
The triad of TAG, fatty acids, and acetate/acetyl-CoA represents decreasing levels of complexity of most energy-related lipids; their MW is related directly to their physical conditioning and metabolic usage. A critical point is their lipophilic nature, which conditions transport by the blood and the crossing of intracellular and plasma membranes. Acetate (2C) and easily metabolizable ketone bodies (2C2), as well as some short-chain fatty acids, are hydrophilic enough to be transported in blood or lymph and may cross easily most membranes [70]. Fatty acids (2Cn, medium to long-chain with less than five to more than 10 2C units) are transported bound to proteins [71], and are incorporated into the cell by specific efficient binding-proteins [72] and transporters [73]. TAG are too large and insoluble to be carried by blood plasma: they are transported within lipoproteins, structured with apolipoproteins and other lipids, such as phospholipids and other classes of lipophilic compounds as minority components. The intestine and the liver initially build up these complex lipid carriers, mainly chylomicra and VLDL. They are fairly efficient systems for transporting large amounts of TAG (i.e., heavy energy packages, mostly containing 2Cn) to provide fuel for energy and organ functions [74] in addition to the transport to and from of critical lipophilic substrates such as cholesterol, a process reserved for the smaller lipoproteins (LDL, HDL) [75].
Within tissues, large amounts of lipid are transferred between cells by using at least two mechanisms. In the first, very large (often old) adipocytes, (or those marked for apoptosis), when broken up via apoptosis or autophagia, release a large amount of micro-drops of lipid. These vesicles are taken up via pinocytosis by macrophages, functional adipocytes [76], or other cells. A selective apoptotic (and packed groups of macrophages [77]) process has been proposed as a mechanism for tissue turnover, which is applied to dead or no longer functional adipocytes [78]. This clearing process has the advantage to constrain the diffusion of cell debris and lipid drops that can cause damage to other cells, as well as limiting the clogging of individual macrophages with the remains of apoptosis [79]. The other mechanism is the use of exosomes or vesicles, which can transfer signals, proteins, nucleic acids, but also TAG between cells [80,81]. This (incomplete) list represents a wide panoply of mechanisms for transfer of 2C-based substrates, primarily between the splanchnic bed to peripheral tissues, for storage or direct utilization.
The question of transport between cells and tissues is critical for the supply of energy on time, in the most efficient chemical form for immediate use, and with a sufficient transfer rate of to cover the needs. This is, probably the main reason why there are two main systems for sending energy substrates to the tissues via blood: a) lipophilic (2C-derived, energy-dense but large and difficult to handle) and b) hydrosoluble substrates, represented by glucose and 3C, but also the smaller 2C components soluble in plasma. The logistic advantages of having both systems rely essentially in the highly dense energy TAG as substrates sent elsewhere for heavy needs, and a variety of other metabolites, usable directly by the cells faster to supply in a continuous way, and easily subjected to immediate regulation.
The irreversible path of 3C to 2C is carried out by the pyruvate dehydrogenase complex [23] (Figure 4), which is highly regulated [82,83] and controls the entry of 3C into the mitochondrion [84]. We can use glucose to build fatty acids, but the reverse (regular fatty acids to glucose) is not possible because of this critical step at the confluence of the 2C and 3C worlds. This irreversibility is typical of animals, since plants and other phyla possess the “glyoxylate shunt” that we do not [85]. Probably, we lost this shunt along evolution because the main source of 2C to feed the TCA cycle and fatty acid synthesis remained glucose-derived pyruvate.
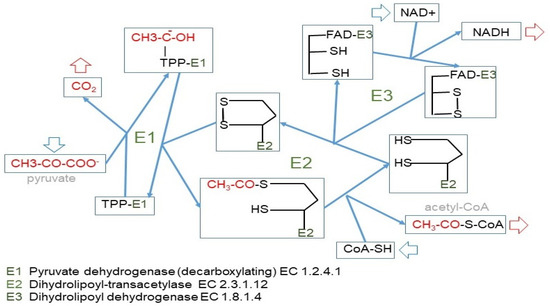
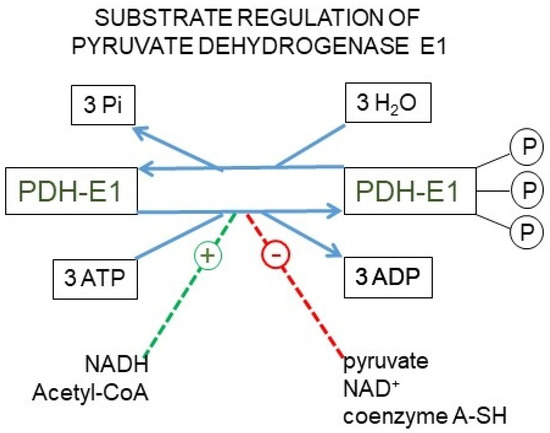
Figure 4.
The pyruvate dehydrogenase complex. Upper panel: mechanism of action of the pyruvate dehydrogenase complex, showing why the reaction catalyzed by the E1 enzyme unit is irreversible. Lower panel: kinase/phosphatase regulation of the E1 subunit. Main factors regulating its activation/inhibition.
The 3C→2C path irreversibility has important consequences for glucose and energy partition: while 6C→3C and 2Cn→2C relationships are reversible, 3C→2C is unidirectional. In plants, fatty acid reserves can be converted into 6C [86]. However, in humans and other animals, glucose (or other convertible 6C) is needed to provide the 3C fragments used in many metabolic paths, since despite the possible excess of 2C, no 3C derivatives can be obtained from them. This leaves us with an inefficient system to obtain energy from 6C when converted to 2C, and later oxidized via TCA cycle. An excess of 2C can be corrected only either storing it as fat or through its complete oxidation, whilst any excess of 6C or 3C can be used by a wider range of metabolic pathways, or ultimately derived into 2C.
6. Handling Glucose, Energy Homeostasis, Substrate Cycles, and Distribution
The reversible 6C→3C glycolytic conversion, and the easy entry of 3C in most cells results in a strategic advantage of distribution, limiting substrate buildups whilst maintaining their full homeostatic availability. This process is sustained by the existence of substrate cycles within adjoining groups of cells in a given tissue, as is the case of muscle [87] or the brain, between glia and neurons [56]. The substrate cycles between different organs are widely known, e.g., the Cori cycle [88] or the glucose-alanine cycle [89], in which exercising muscle converts glucose to 3C, later taken up by the liver, prompting gluconeogenesis (i.e., 3C→6C) with the overall result (Cori cycle) of transfer of reducing power from peripheral tissues to the liver [90]. In this case, the 3C→6C interconversion helps transfer reducing power (or 2-amino groups in the case of alanine) to the liver for their reutilization (Figure 5) or disposal. This inter-organ coordination prompts a more efficient use of energy and oxygen (and 2-amino N), helping to maintain the levels and availability of substrates.
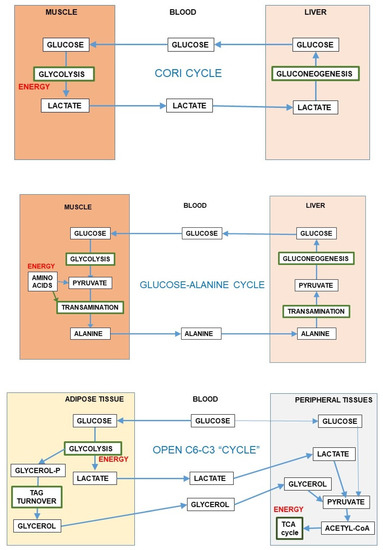
Figure 5.
Inter-organ substrate cycles (6C-3C). The first and second panels present the Cori cycle and glucose-alanine cycle [89]. The lower panel shows an “open” inter-organ relationship (6C-3C) such as that found between the adipose tissue and peripheral organs [49].
Most of the inter-organ substrate cycles were described as mechanisms preventing the dangers of reducing power or 2-amino N accumulation in muscle or other peripheral tissues under conditions of active use of glucose or amino acids (i.e., during exercise) for energy; they always present a time-delay component for maximal effectiveness. The exportation of 3C carrying the excess reducing power or N to the liver has the additional advantage of allowing the return of these 3C to the blood as glucose, completing a cycle. However, these “cycles” usually work, in real-time, as simple vectors for transfer—“open interrelationships” (Figure 5), making full use of the differential organ oxygen supply to transfer a reduced 3C (i.e., lactate) from active muscle to other muscles or the liver to regenerate glucose, resulting in a chain-transfer of reducing power [91]. This situation can be sustained only when glucose is not in excess (in the liver), since it may block gluconeogenesis [92], but the excess reducing power can be easily corrected because of the high liver oxygen supply, removing lactate immediately or after a delay and even after a buildup of acidosis [93]. The maximal “reduction” of open cycles can be found in the lung, which scarcely uses glucose [94] but uses blood protons (as the liver do) exported by relatively hypoxic tissues, using their energy at the mitochondria and thus helping limit acidosis [95].
A special situation is that of adipose tissue; it has been found to generate large amounts of 3C from glucose [48]. This process has been suggested to help lower glycaemia (and its associated problems) under conditions of excess substrate availability [96]. The extent of this transformation is considerable, especially in the mesenteric adipose mass, which receives the mixed 3C-6C results of digestion before sending them via portal vein to the liver [49]. This peculiarity is not limited to adipocytes, since the adipose stromal cells act in the same way: a practical anaerobic glycolytic conversion of 6C to 3C even under full oxygen availability [49]. This may be considered either as another contribution to regulate glycaemia or as an alternative to produce 3C fragments (essentially lactate and glycerol) in massive amounts to supply ready-to-use energy to most organs (including the brain) to circumvent the regulatory difficulties of glucose utilization under situations of excess substrate and/or insulin resistance [36,43,47,96]. The ample use of 3C as main energy substrate agrees with this interpretation.
7. Enter the N: Amino Acids, the Question of Diversity of Pathways, and Our Deep Lack of Knowledge of Them
Curiously, and despite their primeval importance, amino acids seldom are considered quantitatively important substrates for humans in analyses of overall energy metabolism. The most used explanations for this ellipsis are:
- The often incomplete hydrolysis of dietary proteins [97];
- Intervention of microbiota through transformation/catabolism or even synthesis of amino acids [98];
- Further transformation/catabolism by the intestine and the liver before overall distribution [99];
- Sparsely known real catabolic pathways for many amino acids [100,101,102,103] in humans;
- The absence of specific amino acid/protein reserves;
- The lack of knowledge on the regulation of essential amino acids;
- The gross differences between measured calorimetric pump energy content of proteins and the real energy obtained in vivo from amino acids according to the known (or assumed) metabolic pathways [103];
- The assumed relatively small amount of actually oxidized amino acids derived from the diet compared with carbohydrates and lipids;
- The uncertainty on how the N of amino acids is processed and excreted [104], which directly affects the estimations of dietary amino acid use [105];
- The “diversity and complexity” of amino acid catabolism;
- The common absence of data on diet protein amino acid composition.
In fact, the main question for eluding amino acids from most studies is the lack of knowledge. We do not know yet (in humans) the complete catabolic pathway of several essential amino acids or the implication and compartmentation of the catabolism of amino acids yielding 1C, 2C, 3C, and 4C/5C intermediates of the TCA cycle. To complicate further the analysis, we have only an approximate knowledge on how the dietary protein (in fact, the amino acids resulting from their digestion if assimilated) translates into metabolizable energy.
The role of a few amino acids in the maintenance of glycaemia via gluconeogenesis [89,106] is well known, but the focus is now on branched-chain amino acids [107,108]. These amino acids are catabolized to 2C fragments (leucine and isoleucine) and propionate (valine and isoleucine) [109] (nor a 3C but an important anaplerotic precursor of 4C fragments [110]). Some amino acids (such as alanine or serine), when oxidized, i.e., after their amino moiety has been removed, yield directly 3C (pyruvate). Others (i.e., leucine, lysine) are mainly broken down to 2C, but most are oxidized to intermediate metabolites of the TCA cycle (e.g., glutamate, aspartate, threonine). A simplified scheme of the fate of hydrocarbon moiety of amino acids is shown in Figure 6.
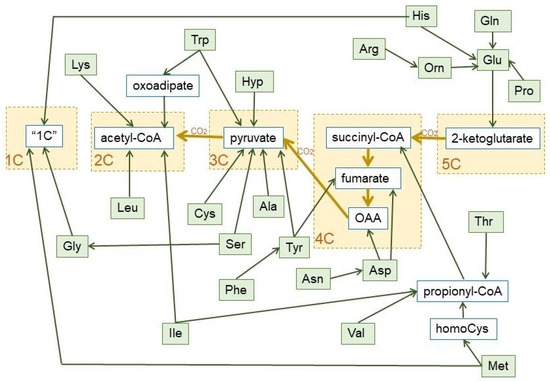
Figure 6.
Summary of the final conversion of dietary protein amino acids in 1C, 2C, 3C, 4C, and 5C fragments, which revert essentially into 3C and 2C, during the human catabolism of amino acid hydrocarbon-skeletons. The pathways used to prepare this graph are the most common, including the main alternate pathways [105]. The green lines show the carbon paths for each amino acid, the brown lines represent the relationship between the core of the TCA cycle and pyruvate dehydrogenase (with the loss of one CO2 between each substrate group box (marked in yellow). Non-standard abbreviations: Hyp = L-4-hydroxyproline; Orn = ornithine; “1C” = One-carbon fragment donor systems.
The amino acid hydrocarbon skeletons can, thus, provide 2C or (in a higher overall proportion) 3C, but also the high-energy containing 4C and 5C fragments, which, eventually will be converted into 3C along the TCA cycle, hence their importance for gluconeogenesis under conditions of severe energy stress. However, the use of 2C for 2-ketoacid synthesis is almost nil, widening the 2C-3C chasm. In fact, the variation of amino acid catabolic pathways results in a simplified handling of their complexity—losing in some cases energetic efficiency in the process—for gross energy purposes (as shown in Figure 6) than usually believed. As to the aspects of regulation cited above, we are yet in a serious state of ignorance, with few exceptions.
8. The Dangerous Duality of Needed 2-Amino-Nitrogen Preservation and Its Ill-Understood Disposal Pathways
From an evolutionary point of view, our design evolved to preserve 2-amino N, since we cannot significantly use other sources of 2-amino N than amino acids themselves (obtained from dietary protein). All amino acids are synthesized by plants (and other phyla) and used to build their own proteins. We use (eat and digest) these same proteins to obtain the amino acids we need to form our self-proteins and other N-containing molecules (e.g., purines, pyrimidines, porphyrins, etc.). All our amino acids have been obtained (from the diet) either preformed—e.g., essential amino acids—or rebuilt by us from available hydrocarbon structures and 2-amino N suppliers, i.e., amino acids from plant or animal (formerly “plant”) sources. Since we are omnivores, the dietary protein is just another source of energy, used, for this purpose, in proportions that depend on their availability [111,112]. Thus, the complex safety measures established to retain amino acid N necessarily should interfere with their utilization for energy. Nevertheless, it is obvious that essential amino acids are continuously oxidized for energy irrespective of their source: if there are not changes in body protein (in addition to the “obligatory” protein losses: Box 1), the amount of these amino acids ingested in the diet should tally their oxidation, since they cannot be stored.
Box 1. Forms of excretion/loss of nitrogen in humans.

The main, basic studies on our handling of diet amino acids, protein synthesis, and recycling of amino N were done essentially more than half century ago, and they were invariably focused on the ways to preserve N, the mechanisms to survive under conditions of starvation [113], dietary protein deprivation [114] and, globally, malnutrition [115,116]. Amino acids as energy staple have been, since, considered “secondary” (or at most “complementary”), and their assumedly “complex” metabolism was oversimplified around their possible use as gluconeogenic substrate under glucose deficits or generators of ketones (ketogenic) during starvation [117]. The epidemic nature of obesity, developed thereafter, and the need to find ways to cope with its ravages were centered on glucose and fats, a situation that continues with limited global interest on amino acids as energy substrates under conditions of plenty [118,119]. The key problems that remain and prevent further advances in this direction are the diversity of metabolic pathways used to oxidize the hydrocarbon skeletons of amino acids, the relatively unknown mechanisms to retain essential amino acids, and, especially, the not yet clarified variable fate of the N moiety of amino acids during their catabolism.
The canonic mechanism of excretion of the N moiety waste is the urea (or Krebs–Henseleit) cycle [120] (the “first” Krebs’ cycle [121]), a very peculiar pathway between cytosol and mitochondria. It may also harbor a shunt to generate nitric oxide (NO·) and citrulline from arginine [122]. The daily losses of N via the NO· pathway are a fraction of the overall N excretion, essentially made up from nitrogen oxides released through respiration [123] (a few µg/day) or further oxidized to nitrite, nitrate, and other nitroxylated compounds [124,125], which are excreted via saliva, urine, and stool [126,127]. However, there is proof of an additional, quantitatively significant, excretion of N as gas through respiration [128,129] that is supplementary to the standard and well-controlled urea excretion. When analyzing in detail N balances in experimental animals, the amount of N ingested is higher than the sum of the N accrued in the body and the N excreted and accounted for [130,131] (Box 1). The proportion of this “nitrogen gap” (assumedly N2) is in the range of 5–15% of all nitrogen ingested and not accrued (i.e., it is actually excreted), and its amount is related to diet and energy status [128,130]. It has been found that this N2 loss is related to arginine metabolism [131] (Figure 7).
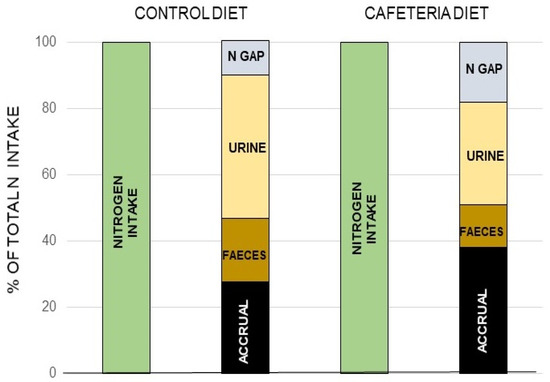
Figure 7.
The nitrogen “gap: in rats. A “nitrogen gap” was found when analyzing all the components of the nitrogen balance in young rats: i.e., the N ingested, that excreted by urine and feces as well as the total N accrued, thus proving the existence of a sizeable part of the N excreted not as urea, or through the other possible ways and means shown in Box 1. Different complete (measuring both sides of the N balance equation) studies repeated these findings, dependent on diet, and with a magnitude (in rodents at least) in the range of 10–30% of all nitrogen excreted. Redrawn with data from Esteve et al. [130].
In fresh-water plants [132] or fish [133,134] living under high (cytotoxic) ammonia concentrations, the levels of NO· are high, and the production of NO· is increased several fold on exposure to ammonia, assumedly potentiating its oxidation [134]. The most suggestive process is that of the anammox (anaerobic ammonia oxidation) bacteria [135], which assumedly use NOx, probably via NO· to oxidize NH4+ coupled to the reduction of NO· [136].
Both ammonia and nitrite or nitric oxide can react spontaneously in an exothermic reaction, yielding N2 and water [137], provided that ammonia is protonated to ammonium and the extra electrons are removed
4 NO + 2 NH4+ → 4 H2O + 3 N2 + 2 e-
This is a reaction very similar to the integral oxidation of ammonia with nitrite [138],
which can be reproduced very easily in the laboratory with minimal means. N2 is also produced by the reaction of nitrite with amino acids at low pH [139]. The abundance of nitrite produced in the inactivation of NO· could justify a small part of the production of N2, in part via its reaction with amino acids [140]. However, this process has been studied under conditions seldom found in a living human [139]. Nitrite may react more easily with ammonia, but their low circulating levels [141], and the small area of diffusion of newly-created NO·, in the µm range, may prevent this reaction taking place, except, perhaps, in the gut lumen, where the levels of ammonium and NO· (but not the environmental conditions) may be higher [142,143]. However, the fact that in axenic rodents the excretion of N2 is unchanged [128] hint at the existence of a less “occasional” and regulated source for the production of N2.
NO2- + NH4+ → N2 + 2 H2O
The mechanism of nitrogen gas synthesis from ammonia used by anammox bacteria suggests a possible pathway in which this oxidation is carried out in two steps [137]:
NO·+ NH4 + 2 H+ + 3 e- → N2H4 + H2O
N2H4 → N2 + 4 H+ + 4 e-
Evidently, the hypothesis we presented in Figure 8 with respect to the postulated origin of N2 from the mitochondrial reaction of ammonia and NO· has a serious weak point, since, as far as we know, the enzymes that allow the oxidation of ammonia by NO· (under anaerobiosis) are exclusive of anammox bacteria. However, the possibility of hydrazine being an intermediate step in the process could not be fully discarded given its limited toxicity (it has been used for the treatment of tuberculosis and cancer [144]) and its widespread effects on amino acid metabolism [145].
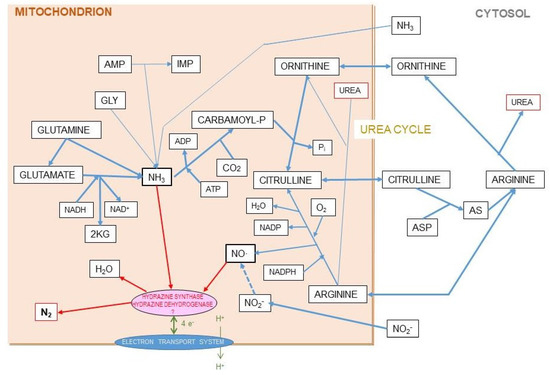
Figure 8.
Hypothesis for the origin of ammonia and nitric-oxide generation of nitrogen gas in mitochondria. The coexistence in the liver mitochondrial matrix of both ammonia/ammonium and nitric oxide, within well-regulated pathways, in significant amounts, and related to the urea cycle, suggests the possibility of a reaction which may generate nitrogen gas at the expense of both. This is a speculative hypothesis, which has not been proven so far. In any case it is difficult to justify the presence of both reactants in a relatively high concentration without interacting, since the uncontrolled chemical reaction between them is spontaneous and exergonic. In this hypothesis, we include the findings of Kartal et al. [137] in their study of the mechanism of ammonia oxidation in anammox bacteria, which has an intermediate metabolite between them, hydrazine (N2H4). The two enzyme activities of the complex hydrazine synthase and hydrazine dehydrogenase are intimately related to membrane of the anammoxosome particle.
Ammonia and nitric oxide are both produced in significant amounts in the mitochondria: ammonia through—mainly—glutamate dehydrogenase [146] and glutaminase [147], and NO· via NO· synthase [148] (Figure 8). One can speculate that within the mitochondria, the reaction 1 can take place through a regulated mechanism. The main problems for this hypothesis to be confirmed are the so far unidentified catalyzer system, and the question of the low solubility of N2 in biological fluids but not on fat tissue, several-fold higher than in plasma [149,150], to carry the gas away to be exhaled in respiration. This type of shunt is, probably, the base for the known excretion of N2 gas under certain circumstances (high arginine, high protein) resulting also in excess ammonium in the mitochondria [151]. This uncharted metabolic path is affected by diet, sex, and excess energy and amino-N availability [128,130,131], and constitutes an example of our extremely low level of knowledge on the mechanisms and factors that govern substrate energy partition. This uncertainty affects seriously any quantitative study on this subject.
9. Reserves, a Highly Reserved View
We need (and thus maintain) reserves of all possibly scarce materials we need: essential metals, ions, sulfur, selenium, some vitamins, and especially 2-amino-N. Evidently, we also store energy. The balance between reserves, their type and the problem of carrying them as part of our body weight has been extensively studied, but often, we tend to maintain excessive long-term reserves of lipid (2Cn). We retain a lower amount of 6Cn reserves (glycogen) for hypoglycemic emergences, and we also keep a small supply of phosphagens for immediate support to the first line of response (ATP).
Metabolic syndrome (MS) and similar conditions related to excess of energy supply create havoc with the management of reserves, since the unmanageable excess of 2C tends to end as lipid, which is massively stored for lack of alternatives. This problem derives largely from our taste for fat [152] (inherited from our ancestors because of its high energy density), perhaps helped by our ingrained memories of lactation [153] and the availability of “tasty” lipid-rich foods [154]; but it is also derived from an unbalanced supply of energy (especially in excess) of 2C vs. 3C as a main energy staple [155].
Our main (from a quantitative energy content point of view) physiological reserves are made of fat because WAT contains up to 80% TAG (in the range of 30 MJ/kg) [156]; thus, a few kg of WAT may provide enough energy for our basic sustenance for months (Table 1). Its main advantage is the high energy densities of fat and the adipose tissue holding it, especially when compared with polysaccharides. Our reserves of glycogen are small [157] and were devised to sustain glycaemia for a short time, since glycogen contains about half the energy than fat (on a dry weight comparison basis). In addition, it is highly hydrophilic and retains a large amount of water (added weight, limiting its accumulation in significant amounts) [158]. A high weight (including water) with respect to energy content limits movement excessively in exchange for short-lived reserves; thus, the main reserves, the more effective in terms of energy/weight are lipids. However, their real effectiveness depends on the body mass of protein [159].

Table 1.
Mass of energy reserves in the human body.
The main theoretical problems posed by body fat reserves are essentially two: a) its use as storage of energy may derive into being a 2C dump when energy intake is excessive, driving to obesity, inflammation and MS [164]; and b) we need, specifically, glucose/3C for inter-organ supply of energy. Thus, sources of 3C should be taped to preserve our homeostasis under conditions of severe scarcity; even when there is a large excess of 2C reserves available, we keep needing a steady supply of 3C, which often requires the sacrifice of protein [165]. In practical terms, the main 3C “reserve” of the body are the proteins (irrespective of their functionality). However, since we do not have protein reserves as such, we have had to rely on misadjusting the overall turnover rates to degrade faster and synthesize less protein [166], draining the amino acids freed to generate 3C, especially during starvation [167].
The data shown in Table 1 are only general approximations, but the figures of storage substrates and circulating compounds used with different intensity as nutrients throughout the whole body illustrate clearly the enormous difference between the make-up of 2C substrates and the 3C ones that may be used for functions other than the generation of energy through the TCA cycle. The 2C/3C ratio for all added-up energy reserves in normal weight healthy adults is about 24-fold higher when considering body reserves than when we analyze the nutrients carried by blood plasma. This highlights the differences (even with all logical caveats considered) between what is the homeostatic internal medium composition, akin to our immediate substrate supply needs, and what we have retained. The weight of 2C is overwhelming.
In Table 2, we have intended to obtain a value of the C2/C3 ratio in the human diet. The problem is the absence of data (especially on protein composition of the enormous varieties of diets) We analyzed the C2/C3 ratio for a “theoretical” adult healthy human eating a standard diet, such as those being recommended for a “healthy nutrition” by most specialists. The results were again shocking: the final ratio of the standard diet was in the range of 1/5th of that of our “normal” body composition, and it was more than five times higher than the plasma nutrient ratio. These differences stress an innate deficit of 3C yielding substrates, necessary to maintain energy homeostasis with respect to the energy stores, strongly decanted toward the 2C supply, making a large part of these reserves not physiologically usable and, in fact, only “dead weight”. This unchecked domination of 2C sources hint that our standard diets are probably inadequate, chosen more because of factors different from the best metabolic adequacy (taste, availability, social or historical factors, etc.). The recommendation of such types of diet adds to the problem they pose, since recommendations are based on population statistics with no ‘controls’ to refer to. They are not based on sound biochemical metabolic comparative data, simply because they have not been (sufficiently) investigated. The consequences are crystal-clear: a growing pandemic of diet-borne disorders, essentially undiagnosed, not treatable and affecting a large (and growing) proportion of our Society.
Table 2.
Estimation of the 2C/3C relationships of a human standard diet.
It is important to add an additional commentary on the methodology we use at present with diet (food) analyses. Despite the considerable difficulties, assumptions and techniques available, the classical study of Atwater [172] remains the “current” basis for our energy intake/expenditure calculations. In 12 decades, science has changed considerably, and precision is one of the critical points for accepting such widely used data. A recent critical analysis of the methodology used by Atwater but applying present-day criteria [173] showed that a significant deviation of the original data exists, and that we urgently need methodology more adapted to today’s conditions.
The dynamic situation of lipid reserves is clear and understandable. What is not is the reason why some body fat seems impossible to mobilize even using very-low energy diets [174,175] even with metabolic situations close to starvation, which resulted in scant (if any) mobilization of part of the fat reserves [176], often in spite of real body weight losses (water, protein, minerals). The extra weight and the inflammation accompanying the excess of adipose tissue fat are severely detrimental for the health and normal energy handling, and are maintained without any apparent reason [177].
Our energy metabolism overall can sustain, in a large proportion, the substitution (as energy substrates) of part of carbohydrate (3C-givers) by lipid (2C-providers). Carbohydrate may be compensated in part by protein [178]. However, the N moiety of protein and some amino acids could not be substituted (but we can lower our needs by modulating turnover rates) [179]. These compensations include the use of internal reserves (mainly lipid) but also, in part, the lowering of the body protein pool [165]. These measures do follow well-established priorities in the use of energy substrates (or, in the end, any substrate) ingested, and, when insufficient, compensated with the use of reserves [180]. The order of precedence in consumption (that of preservation is just the reverse) [180] is essentially:
1 Lipid (2C)→2 Carbohydrate (3C)→3 Protein (amino N)
Diet takes precedence in their use for energy over reserves, but changes in the diet may modify some of these evolutionary rules of precedence, thus protein is needed for lipid oxidation and to prevent its storage [181]. These mechanisms were developed, and refined with efficient regulatory mechanisms, to enhance survival by maintaining energy homeostasis under conditions of insufficient food availability (including starvation), and incorporating the hypothesis of thrifty genes and their possible incidence in the development of diabetes/obesity [182,183]. However, we have not established a metabolic process (spendthrift) to cope with a simultaneous excess of energy and of all main nutrient classes in the diet. No process has evolved to solve this situation because this is a peculiarity, affecting practically only our species, which appeared in a very short time (in evolution terms) [183]. The trend is fueled in part by the setting of epigenetic traits favoring the development of obesity, despite its real deleterious effects [184,185]. We have no historical evolutionary memory on how the problem of excess can be handled, since our tools are useful only to counter scarcity, and thus, the mechanisms/processes applied are often not only inadequate, but self-defeating and harmful.
10. The Triad of Main Energy Sources and How Sorting of Substrates Seems to Proceed
We ingest food for energy and growth/maintenance. Evidently, a large part of the main substrates (amino acids, fatty acids, sugars and intermediate metabolites, as well as most essential components) are used in connection with turnover strategies of our own living matter, in order to maintain all mechanisms in their prime efficiency. However, from a theoretical (quantitative) point of view, intake should match excretion and energy loss (assuming that there is no real change in our mass) [186,187]. Thus, the main types of substrate we ingest for energy (with all provisos stated above) belong to three groups: amino acids (N providers), 3C and 2C providers. After a large portion of amino acids is sieved and selected, they revert largely to “excess N” plus 2C, 3C and 4C (TCA cycle intermediates) (Figure 2, Figure 3 and Figure 6). The final proportion of 2C and 3C available during a certain stretch of time depends on digestion, rhythms etc., but we can just center the question in basic one-day periods. Under no-growth conditions (i.e., no additional storage of energy: only turnover) almost all 2C will end as a source of energy via TCA cycle. 3C have a higher variability of uses, but at last, all excess 3C is converted to 2C, which is then oxidized for energy (or stored as fat). If there is a large excess of amino acids, the elimination of N stresses the 2C/3C setup, both because of anaplerotic enhancement of TCA cycle (via 4C) and an intense pressure for growth, which increases protein synthesis and “storage” as body protein. Most of these effects/mechanisms remain rather unknown, because almost never come alone, and are largely mediated via gene expression and hormonal modulation affecting select different groups of cells.
A large part of nutrients is used with little change (if any) for turnover (e.g., amino acids, fatty acids, glucose, etc. for, respectively, proteins, TAG or glycogen), or to build-up reserves (i.e., fatty acids) or (almost all compounds) for growth and reposition of live matter lost (i.e., hair, epithelial cells or secretions). Amino acids could not be substituted from the point of view of reposition and turnover, as well as for the synthesis of other N-containing body components. Carbohydrates may be substituted, largely, by protein, but the loss of energy in the complex catabolism of some amino acids, plus the need to dispose-of 2-amino N markedly limits the extent of this substitution. On the other side, lipids (e.g., TAG, but not including the essential fatty acids) can be entirely substituted because their sole specific metabolic contribution is to provide large amounts of 2C, which we are prepared to compensate with protein and, essentially carbohydrate.
An excess of 2C, on the other side, limits the utilization of dietary fatty acids, which are then incorporated to the stored fat reserves, without previous oxidation to 2C [188]. This is an efficient way to store dietary energy, quite different from the energetically expensive lipogenesis from acetyl-CoA [189]. This 2C molecule is also in excess (limited by the availability of coenzyme A because of insufficient capacity of the TCA cycle to oxidize it, since reducing power/ATP are produced on demand. This is compounded by limited lipogenesis, restrained because of the excess of dietary fatty acids [190]. The large acetyl-CoA availability, due to its limited need, inhibits the oxidative decarboxylation of pyruvate, the critical 3C→2C unidirectional process [191], thus secondarily provoking an unwanted accumulation of 3C. In parallel, glycolysis is also limited because of insufficient 3C removal [192], which results in lower glycolytic processing of 6C, which adds to the excess carbohydrate provided by the diet together with the unneeded excesses of dietary amino-N and fatty acids (Figure 9).
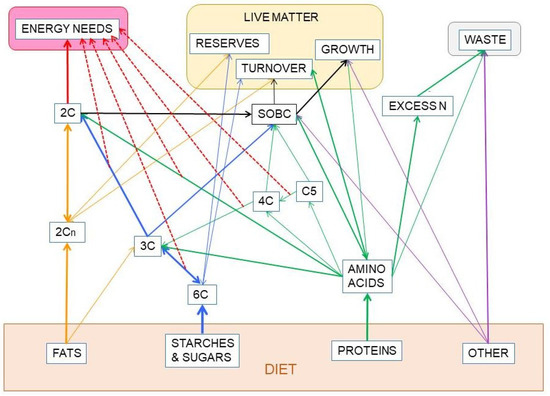
Figure 9.
Partition-related substitution of nutrients in the diet to fuel the metabolic processes. This graph intends to explain the absence of a total/complete substitution capability between the three main groups of nutrients: Protein, carbohydrate and fat, which constitute most of our diet, at least from an energy point of view. Solid lines show the direct relationship between the groups of substrates. The large red line emanating from 2C represents the oxidation of acetyl-CoA in the TCA cycle to obtain most of the energy we use. The thinner red dash-lines indicate other main sources of cell ATP, adding up to the sum of energy available to cover our needs. Part of our food is made up of other components (minerals, organic micro-components, fiber, etc.). Their relationships with other compounds are marked with purple lines. SOBC stands for: “synthesis of other body components” from the building blocks provided by the four groups of nutrients analyzed. Their mixed paths have been marked in black. The lines in blue represent the metabolism of carbohydrates, including the part shared with amino acids and lipid. Protein-amino acid paths are marked in green. The lines in dark yellow represent the paths exclusive of lipids.
The serious difficulty lies on the iterative nature of the process along time. A few days of excesses can be modulated in part by decreasing appetite and voluntary intake [193], increasing protein turnover [194], thermogenesis [195] and topping the reserves of glycogen and fat [196]. Nevertheless, these ‘solutions’ work only to a certain degree, not in a permanent way, and create a regulatory havoc that cannot be sustained indefinitely. The emergency measures only patch, do not solve the problem, it is just metabolic procrastination, and in short time deep problems begin to develop [197]; and shortly afterward, they also become chronic [198,199]. The excesses of substrates could not be disposed of, and the regular mechanisms of partition cannot function in a fluid way. Obviously, oxidation of 2C is enhanced, but what to do with the unused ATP? In a global setting, thermogenesis helps, but not at the level of each cell (largely those in the splanchnic bed). Then, the priorities list ingrained in our metabolic control systems retake their place of reference.
- Save as many amino N as possible and take special actions to prevent the toxicity of NH3, perhaps via the alternative “NH3 + NO·” production of N2.
- Limit the processing of fatty acids to 2C fragments and thus dump them as TAG (with a token 3C glycerol) [200]. This process induces obesity [201], steatosis [202], and drives muscle to be essentially a fat-infiltrated 2C energy user, with glucose intolerance [203,204].
- The toxicity of glucose (the same occurs with the excess of ammonia) represents an immediate danger that cannot be “stored” (as are the fatty acids in TAG).
The insulin basic controlling mechanisms of glycaemia no longer function properly [205], in fact they interfere, limiting the peripheral utilization of glucose as substrate [206,207]. Hyperglycemia is a problem [208] which is in part corrected by the conjunctive tissue (including adipose tissue), which actively takes up glucose and returns 3C to the blood [96]. Most tissues may work (including the brain) perfectly using 3C (largely lactate and glycerol) [36,37,38,91]. Thus, the blockage of liver metabolism, in its ↑2C-↑3C no-win situation, is in part corrected by an adipose tissue (also inflamed, engrossed by the excess lipid storage [209]) which generates large amounts of 3C at the expense of glucose [96]. It also produces urea cycle intermediates, probably to compensate in part for the decreased capacity of the liver [210,211].
11. Normalization and Regulation under Excess (if Any)
Return to normalcy from the excess-driven picture of energy metabolism is difficult. The search for drugs is not a viable solution, because the problems observed have a known origin, and the severity of the damages is largely a consequence of the mechanisms established to ensure survival under scarcity. We cannot fight these mechanisms because a) we do not know them enough, b) we need them to sustain our “normal” homeostasis, and c) they have to be operative to achieve that normalcy. Right now, the main systems in use to fight obesity are—essentially, and despite their limited effect—diet and exercise; but, what type of diet? Hypocaloric?
Under starvation, the stored fat is progressively shed to last as much as feasible; our bodies adapt to lower energy, lower carbohydrate and limited protein intake diets, including the absence of fats, following the blueprints for starvation [212]. The elimination of dietary carbohydrates [213,214] and lowering of energy intake share some characteristics, because of our adaptability to starvation, but there is a considerable discussion on the proposed benefits of ketogenic diets, which, in any case, could not be generalized from epilepsy to obesity [215,216,217]. Nevertheless, even after prolonged starvation or removal of dietary carbohydrates, a significant portion of body fat remains, even after prolonged exposure. Unfortunately, in the practice and for most obese people, dietary treatments remain not effective [218].
Exercise is an alternative to increase energy expenditure with (or even without) restricted intake [219,220]. This approach is not always feasible, since obesity is syndromic with cardiovascular disease and problems of mobility [221] and, despite numerous claims on the contrary, exercise it not sufficient to revert the damages of an established MS [222], and may not improve the health status [223]. However, well dosed exercise may provide benefits to mild cases and young patients [224]. In addition, the effectiveness of exercise is also limited from the point of view of energy: limited duration, limited proportion of increase in overall energy consumed, consequences in the availability and transport of oxygen and products of substrate oxidation. In fact, exercise is better suited to maintain functionality [225] (when applicable) than to fight obesity. The chronicity of the “excess situation” described above, usually continue even when the dietary excesses cease. Too often, very low-energy dieting and exercise combined (even using additional anti-obesity approaches) are unable to eliminate the excess fat and reverse the damages already induced by (or accompanying) this excess deposition. The size of fat depots is a critical point for the severity of the disorders and a barrier to a progressive and effective removal, often leaving only the alternative of surgical modification of nutrient intake [226]. However, none of these procedures can revert the metabolic homeostasis to the situation prior to depot engrossment. Nevertheless, drastic treatments may extend the patient life span, improve the lifestyle and ameliorate a few components of the MS [227,228], but not cure it or its associated pathologies. The corollary to this exposition is our extreme resilience to change in the energy (and nutrient) equilibrium, which allows us to cope with the situation for a time and then alter, in a probably irreversible (and unknown) way, the common mechanisms for nutrient partition in a situation far from normal, which could not be sustained indefinitely. However, these changes allow a number of affected individuals to keep living despite the severe damages to metabolic processes and their control. A deeper layer of thought (and thorough research) are needed to understand how people can survive decades under MS conditions.
Probably, excess body fat is directly related to the severity of the disorder it causes: it is commonly accepted that the body mass index vs. mortality curves are U shaped [229]. However, this index is not a real indexed measurement of the body fat content, and parallel studies analyzing body fat vs. mortality showed a lineal direct relationship [230]. Nevertheless, a certain degree of obesity helps protect the patient from some cardiovascular diseases [231]. The discussion about the causes of the obesity paradox or even its existence continue, but part of the problem may lie on the inadequate use of body mass index to “measure” obesity [232], and the question of whether obesity is by itself a disease (or simply a part of a more severe disorder such as MS). The repeated references to “healthy obesity” (i.e., large body fat stores without the associated metabolic disorders of “proper” obesity) [233], have been relatively circumscribed by introducing factors such as age and gender [234]. Our group has postulated that a certain degree of obesity may help limit the ravages of type 2 diabetes by removing excess glucose and releasing 3C, being more a (palliative) consequence than a cause for this disease [49,96]. In any case, the question is not settled, and perhaps there is also a margin for optimal (and not rigidly low, invariable and universal) mass of body fat reserves other than the one used at present.
Under conditions of excess energy intake, the metabolic handling of substrates is parallel to modifications in the hormonal mechanisms that regulate energy metabolism [235], since the main system of regulation of glycaemia (insulin) has been severely damaged [236]. The other mechanisms complementary to insulin have a wider array of functions: the glucocorticoids, favor liver glucose output under conditions of stress or metabolic distress [237]. Glucocorticoids also affect the fate of the main gluconeogenic precursors, amino acids, and altering the excretion of N [238,239]. Testosterone pairs with insulin as a main anabolic hormone [240], but glucocorticoids tend to limit testosterone production and availability [241], also affecting the availability of estrogen [242], which plays a critical function favoring the oxidation of 2C (i.e., saving 3C) in females [243] via direct intervention in mitochondrial function [244,245], and also preventing liver steatosis [246]. An estrogen-derivative has been found to down-modulate the adjustment of the ponderostat, i.e., the oxidation/mobilization of lipids from adipose tissue [247,248], by decreasing food intake and maintaining thermogenesis [249]. Unfortunately, there is insufficient mechanistic information on the effect of estrogen derivatives because only recently these hormones are considered important metabolic regulators [250,251] and act not only in the sex-related way indicated by its etymology.
Substitutive testosterone treatment normalizes the glycaemia of mature and old men, a situation that is slowly being accepted by endocrinologists (diabetologists, in fact) [252,253] after being a mainstay of the treatment of MS aging-related disorders by gerontologists [254]. Its soothing effect on the MS ravages [255] is complemented by the already known effects of estrogen on energy partition [256,257], limiting the storage of lipids. Most of present-day studies on obesity (and of MS, as an afterthought) are focused on cytokine and regulatory circulating RNA types [258] and the paths they modulate, which add considerable knowledge on the possible regulation of their mechanisms of action, but not on the causes/mechanisms of the disorders or the ways to prevent and treat them. Figure 10 shows a simplified scheme of the main hormone-controlled mechanisms regulating glycaemia.
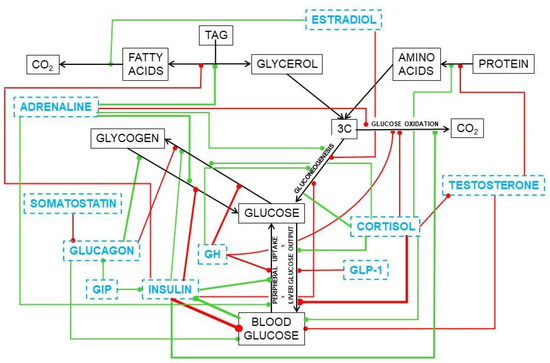
Figure 10.
Simplified presentation of the main hormonal mechanisms that control the circulating concentrations of glucose. Black titles and arrows show the basic relationships between glucose and other substrates. Blue titles represent hormones and other regulating agents. Green lines indicate activation or increase effects of the regulator on the signaled path. Red lines show inhibitory or deactivation effects.
In the liver, glucocorticoids increase glucose output [237] and favor lipogenesis [259] and TAG deposition in most tissues [260]; testosterone induces the accrual of protein [261,262] and stabilizes the maintenance of glycaemia [252]. Estrogens favor 2C oxidation [263], increase oxidative metabolism in mitochondria [245], and limit lipogenesis and TAG deposition [264]. The role of these steroid hormones on the direct modulation of glucose is less clear, despite the large number of agents and effects uncovered. We already know a part of the puzzle, but there are not yet enough dots to draw a sufficiently clear line to understand their real function and help us fight the ravages of our own (effective) systems of protection of energy and protein.
12. Diet, Its Composition, and the Central Role of Glucose
Man’s main energy staple has been, in the last millions of years, of plant origin: seeds, starchy roots or other plant energy reserves, fruits, leafy foods, complemented with some products of animal origin. Humans have evolved in parallel to their nutrition [265]. Foods from animals have been increasing their share with time [266], and our diets are clearly adapted to our pre-human (but pervading) basic food taste types. Less exercise, better medical attention, longer lives and control of the sources of food have modified our present-day diets. Culture, unproven ideas about food have been combined with religious or social taboos, increased availability of different presentations of food and the culture-driven extreme cult to taste. We are leaving starches to consume fats [266], and animal muscle protein and collagen instead of aleurone-like plant reserves [267]. However, our digestive system and metabolic energy handling systems were adapted to a quite different diet [268], and have not been able to maintain the pace of change in eating habits occurring in the last centuries [266].Thus, a gap between digestive system/nutrient utilization and diet composition exists and keeps growing. Glucose continues being the main energy substrate, in spite of everything else, but its food form, ingestion, digestion, handling, and oxidation necessarily change with the composition of the diet. However, that of Neanderthals showed little differences with our present day optimal diet types [269]. The periodicity, the ratio of energy consumed (or needed) for a straightforward metabolic equilibrium versus that actually ingested is a powerful destabilizing factor for an effective maintenance of metabolic equilibrium. Activity, feeding, light and internal rhythms control our hormones and metabolism, helping us to adapt to the variable conditions of the environment [270]. Probably this imbalance is a main cause of the MS together to the fattening of the diet [271].
Considerable observation and experimentation have shown that amino-N should be a part of our diet (in the range of 10–15% of ingested energy) [272]; and, also, that protein should be ever present in our meals [273]. This implies that we also need to ingest an adequate supply of a few special amino acids we cannot synthesize [274]. In parallel, we also know that, today, most humans are taking in too much fat in their diets [275], often over 30% of all energy ingested [168,169]. An effect compounded by the ingestion of energy above our physiological needs [276]. There is little quantitative analysis of necessities, amounts and proportions, as explained in detail above. These approximate proportions are quite different from those of all present-day apes, even more than most of the other primates [277]. This comparison should include our earlier human ancestors, usually short in protein, and even shorter in lipids. Hints on the postulated hunter-gatherer ancestors feeding standards and behavior, and the study of human dietary variability at present suggest that we are a remarkably adaptable species [278], but in all cases, 3C takes priority over 2C, often with the help of the highest protein intake of all primates [161,162]. Evidently, within the enormous variety of human groups and their adaptation to all types of diet (the food available) and environmental conditions, it is expectable that a wide variety will be found –also– in the differential use of the main nutrients; provoked, in general, through epigenetic-driven adaptation to the foods available [279]. But most humans not living under extreme conditions maintain diets which, despite the ample variability in foods and their proportions, provide enough amino-N, 3C and 2C for healthy survival [267] (Figure 9).
The problems arise when the carefully established compensatory mechanisms for diets markedly deviate from those of our ancestors, which result inoperative or deficient by excess of energy and, especially, of some nutrients [199,205]. It seems that the Paleolithic (including ancient historical times) physiological blueprint has evolved little in regulation, despite our admirable adaptation, to occupy almost any ecological niche conceivable on Earth, and thus, diet-provoked “inflammatory” diseases appear and remain unchecked [280].
Variable food supply, including in some cases its excesses and early death (for almost any cause imaginable including diseases) shortened the lifespan of our predecessors already in historical times [281]. Notwithstanding, in the present, our main health dangers seem to be related to our “excessive” success in providing food and health care to a large proportion of humans, coupled with an insufficiently fast evolutionary pace to let our bodies to adapt to this, so far, unique success in the extension of a species mean lifespan and its consequences [282]. Enter the problems of aging: until recently, a problem affecting a very small part of developed societies, that became a prime cause of health, lifestyle and social problems because of the success in expanding our longevity [282,283].
Despite all that, we have not established (in times of plenty) an estimation of the magnitude of 3C-precursor nutrients we need to consume. Essentially the question is: do we need a minimum intake of carbohydrate? [284]. Glucose is the main energy staple of our diet, and we base on 3C substrates most of our metabolic function and regulation [36,47,48]. Instead, we centered our attention on lipid (2C sources) [285,286,287], sugars as such [288], some minerals (e.g., salt), and, to a limited extent, on protein [289]. It is unclear why our flag substrate, glucose, has not been given due importance except as a marker of disease. However, the pervading idea of almost any food-derived nutrient contributing effectively to our energy sustenance, with (almost) full substitution possibilities (as energy fuels) between carbohydrates, fats, protein (and even alcohol) is deeply rooted. This belief would render superfluous to analyze if there were a dietary minimum supply of 6C-3C substrates, in the way we know that this minimum exists for amino-N and “loose” maximums are generally accepted for lipids and alcohol (a toxic substance and “pure” 2C). From the data available, the quest for lowering glycaemia and reducing body weight [290] favor the use of low carbohydrate ketogenic diets [291]. However, high-carbohydrate diets improve glucose metabolism [292] in healthy individuals, and restriction of diet carbohydrates increases the risk of cardiovascular disorders, depending on the diet energy and composition, especially in patients with disorders of glucose metabolism [293] (but not in healthy individuals [294]). Not even glycaemia is better regulated in diabetics with excessive dietary carbohydrate restriction [295]. The disarrangement provoked by the relative insufficiency of carbohydrate in some “low-carbohydrate” diets depends, essentially on four factors:
- (a)
- The metabolic “basal state” of the patients, since the results depend on gender, age and the incidence of MS-related disorders.
- (b)
- The overall energy intake with respect to the needs (or slimming goals) of the patient.
- (c)
- A diet low in carbohydrates must get the energy from either protein or lipid, the proportion and structure of these nutrients in the diet affects the incidence of lowering carbohydrate intake.
- (d)
- The type of carbohydrate present in the diet and its food associations, essentially its relationship to fiber and the mean molecular weight of the polysaccharides (including their digestibility and effects on the microbiota).
The enormous variation of results, consequences, and effectiveness of the proposals coupled to the soundness of the results from the data published, results in a near-impossibility to draw conclusions. In addition, almost all diets studied have been applied for short periods of time to small numbers of individuals with scant information even for the point a) and were done in ‘comparison’ with other different types of diets. Even the reviews and meta-analyses could not draw clear consequences from the huge amount of literature accrued on this question. There are too many factors to allow us to draw safe conclusions from partial, incomplete and not superimposable data. To face this type of analysis, a much-needed simplification is required, and reserve on the conclusions (and on their application to people) must be observed.
Diet studies largely analyze the consumption of food items (a huge, varied and socially peculiar group of products), which in addition have been cooked and mixed in varied proportions. This is “reduced” to the nutrients they contain, but this may forsake aspects such as synergisms, food structure (i.e., fiber), and the nature of the nutrient itself (fructose is as carbohydrate as amylose or a resistant-starch, for instance, and collagen-rich squid is as protein as gluten). We know what is eaten but not what is assimilated (the variable microbiota plays a critical role on this process). We need more information on—at least—what is ingested along longer periods of time.
In any case, a multilateral approximation to the data known and the line of thought presented here allows us to assume that a minimum (both in proportion and in absolute terms) of daily dietary carbohydrate does exist [284], despite the possibility to substitute a large portion of the 6C intake by other sources of 3C.
13. Perspectives, Conclusions, and an Urgent Call for More Quantitative Basic Nutritional Studies
There is abundant literature but a dearth of information on diets. Unfortunately, when dealing with the concept of diet industry, policy, fashion, absurdity and taste interact to produce dispersion, unproven assertions, expanded private interests and outright lies, with—unfortunately—scant material usable to advance scientific knowledge and improve the preservation of health. In most of the studies available, an enormous variability in all the factors implied can be observed, and the formal and bona fides results rarely go further than “hinting to,” with excessive room for interpretation and discordance (or even actual overall relevance). The most recent and popular case in point is the Mediterranean diet, which, in fact, has not been yet defined in nutritional terms [296] but has generated, nevertheless, a considerable number of studies on its health benefits [297,298].
Why do relatively small modifications in diet may induce so deep changes or no changes at all in functional parameters? We do not yet know enough to obtain a defendable and plausible answer. On one side, the nutritionists and dieticians usually analyze diets as a whole, use tables and measure our anthropometric (and metabolic) data and detailed food intake to calculate the needs of nutrients (translated to foods) to cover the energy expenditure, despite the fact that both factors are closely linked. On the other side, a growing number of molecular biologists analyze the specific mechanisms of control of endocrine and paracrine factors (largely those easily measurable), usually using isolated cells or cultures, since this approach is not viable in most in vivo models. Both worlds of study are eons apart, and keep publishing large amounts of deep, sometimes excellent studies on “new” signaling factors or mechanisms, and the beneficial properties of some foods. Our scientific careers have passed through different consecutive fashion periods: enzymes, hormone receptors, cyclic nucleotides, gene analysis, cytokines, gene expression, microRNAs, gene modification, exosomes, stem cells, the transcendence of microbiome, “virome/pandemic” etc. However, surprisingly nobody has devoted sufficient time and funds to study such elementary “unknowns” as how “essential” are some amino acids (and which are the paths of their complete catabolism in humans), how the excess N is eliminated (signals, pathways, mechanisms, sites), or how much 6C (largely glycosyl monomers) we need to ingest daily? What is our dependence of 3C as energy substrates? How is regulated the utilization of 2C/3C for energy (not only in a type of cells, but overall)? Where does this take place? Why there are not enough quantitative studies on how much lactate or glycerol uses the brain, muscle or heart? Is WAT a real storage depot or a secondary supplier of 3C from excess glucose during hyperglycemia? Is insulin the main hormone controlling use of glucose by tissues? What is the role of steroid hormones in the control of glycaemia? and so on.
Perhaps the plausible results of studies trying to answer these questions do not sound “flashy” enough for promotion, or perhaps they are not sufficiently “safe” to merit publication in “prestige” journals, but we need to carry on “risky” studies to get the answers we need in order to understand real problems such as how the substrates provided by the diet are distributed and used. We also need them to understand and fight the negative effects of disorders that right now affect large portions of Humankind. Right now, it is critical to obtain much more basic (and critical) knowledge to understand the nature (and causes) of “inflammation” (obviously, not that defined by Celsus!) that is often used to justify everything that is wrong in MS and related disorders.
Funding
This study received no funding, and was in part financed by the researchers themselves, colleagues and the sparse funds available from the University.
Acknowledgments
We want to specially thank the professionals working in the library of the University of Barcelona (CRAI-UB) for their patience, support and constant help in maintaining the flow of information despite the prolonged adverse (largely financial) environmental conditions.
Conflicts of Interest
The Authors declare no conflict of interest.
Abbreviations
| 1C | One-carbon fragments |
| 2C | Two-carbon molecules |
| 3C | Three-carbon molecules |
| 4C | Four-carbon molecules |
| 5C | Five-carbon molecules |
| 6C | Six-carbon sugar |
| MS | Metabolic syndrome |
| MW | Molecular weight |
| NO· | Nitric oxide |
| OAA PEP | Oxaloacetate Phospho-enol-pyruvate |
| TCA | Tricarboxylic acid |
| TAG | Triacylglycerol/ triacylglycerols |
References
- Buckland, G.; Bach, A.; Serra-Majem, L. Obesity and the Mediterranean diet: A systematic review of observational and intervention studies. Obes. Rev. 2008, 9, 582–593. [Google Scholar] [CrossRef] [PubMed]
- Garfield, E. Trends in biochemical literature. Trends Biochem. Sci. 1979, 4, N290. [Google Scholar] [CrossRef]
- Ionescu-Tirgoviste, C. Insulin, the molecule of the century. Arch. Physiol. Biochem. 1996, 104, 807–813. [Google Scholar] [CrossRef] [PubMed]
- Sawyer, A. South, north, east and western: The story of how the western blot came into being. BioTechniques, 18 July 2018. [Google Scholar]
- Sanders, J.M.; Monogue, M.L.; Jodlowski, T.Z.; Cutrell, J.B. Pharmacologic treatments for coronavirus disease 2019 (COVID-19): A review. J. Am. Med. Assoc. 2020, 323, 1824–1836. [Google Scholar] [CrossRef] [PubMed]
- Stein, M.; Gabdoulline, R.R.; Wade, R.C. Cross-species analysis of the glycolytic pathway by comparison of molecular interaction fields. Mol. Biosyst. 2009, 6, 162–174. [Google Scholar] [CrossRef] [PubMed]
- Fujimoto, Y.; Torres, T.P.; Donahue, E.P.; Shiota, M. Glucose toxicity is responsible for the development of impaired regulation of endogenous glucose production and hepatic glucokinase in Zucker diabetic fatty rats. Diabetes 2006, 55, 2479–2490. [Google Scholar] [CrossRef]
- Robertson, R.P. Chronic oxidative stress as a central mechanism for glucose toxicity in pancreatic isled beta cells in diabetes. J. Biol. Chem. 2004, 279, 42351–42354. [Google Scholar] [CrossRef]
- Cadenas, E. Biochemistry of oxygen toxicity. Annu. Rev. Biochem. 1989, 58, 79–110. [Google Scholar] [CrossRef]
- Oliva, L.; Fernández-López, J.A.; Remesar, X.; Alemany, M. The anomeric nature of glucose and its implications on its analyses and the influence of diet: Are routine glycaemia measurements reliable enough? J. Endocrinol. Metab. 2019, 9, 63–70. [Google Scholar] [CrossRef]
- Miwa, I.; Maeda, K.; Okuda, J. Anomeric compositions of D-glucose in tissues and blood of rat. Experientia 1978, 34, 167–169. [Google Scholar] [CrossRef]
- Okuda, J.; Miwa, I. Mutarotase effect on micro determinations of D-glucose and its anomers with β-D-glucose oxidase. Anal. Biochem. 1971, 43, 312–315. [Google Scholar] [CrossRef]
- BeMiller, J.N. Carbohydrate Chemistry for Food Scientists; American Association of Cereal Chemists: Saint Paul, MN, USA, 2007. [Google Scholar]
- Oliva, L.; Baron, C.; Fernández-López, J.A.; Remesar, X.; Alemany, M. Marked increase in rat red blood cell membrane protein glycosylation by one-month treatment with a cafeteria diet. PeerJ 2015, 3, e1101. [Google Scholar] [CrossRef] [PubMed]
- Malaisse, W.J.; Malaisse-Lagae, F. Anomeric specificity of D-glucose metabolism in rat brain cells. Brain Res. 1979, 419, 505–516. [Google Scholar] [CrossRef]
- Halliwell, B.; Gutteridge, J.M.C. Oxygen-Toxicity, Oxygen Radicals, Transition-Metals and Disease. Biochem. J. 1984, 219, 1–14. [Google Scholar] [CrossRef]
- Ewaschuk, J.B.; Naylor, J.M.; Zello, G.A. D-Lactate in human and ruminant metabolism. J. Nutr. 2005, 135, 1619–1625. [Google Scholar] [CrossRef] [PubMed]
- Krebs, H.A.; Johnson, W.A. Metabolism of ketonic acids in animal tissues. Biochem. J. 1937, 31, 645–660. [Google Scholar] [CrossRef] [PubMed]
- Halestrap, A.P. Stimulation of pyruvate transport in metabolizing mitochondria through changes in the transmembrane pH gradient induced by glucagon treatment of rats. Biochem. J. 1978, 172, 389–398. [Google Scholar] [CrossRef]
- Everse, J.; Kaplan, N.O. Lactate dehydrogenases: Structure and function. Adv. Enzymol. Relat. Areas Mol. Biol. 1973, 37, 61–133. [Google Scholar]
- Bosshart, P.D.; Kalbermatter, D.; Bonetti, S.; Fotiadis, D. Mechanistic basis of L-lactate transport in the SLC16 solute carrier family. Nat. Commun. 2019, 10, 2649. [Google Scholar] [CrossRef]
- Adeva-Andany, M.; López-Ojén, M.; Funcasta-Calderón, R.; Ameneiros-Rodríguez, E.; Donapetry-García, C.; Vila-Altesor, M.; Rodríguez-Seijas, J. Comprehensive review on lactate metabolism in human health. Mitochondrion 2014, 17, 76–100. [Google Scholar] [CrossRef]
- Wieland, O.H. The mammalian pyruvate dehydrogenase complex: Structure and regulation. Rev. Physiol. Biochem. Pharmacol. 1983, 96, 123–170. [Google Scholar] [CrossRef] [PubMed]
- Rizza, R.A.; Cryer, P.E.; Gerich, J.E. Role of glucagon, catecholamines, and growth hormone in human glucose counterregulation. Effects of somatostatin and combined a- and b-adrenergic blockade on plasma glucose recovery and glucose flux rates after insulin-induced hypoglycemia. J. Clin. Investig. 1979, 64, 62–71. [Google Scholar] [CrossRef] [PubMed]
- Wahren, J.; Ekberg, K. Splanchnic regulation of glucose production. Annu. Rev. Nutr. 2007, 27, 329–345. [Google Scholar] [CrossRef]
- Jiang, G.; Zhang, B.B. Glucagon and regulation of glucose metabolism. Am. J. Physiol. 2003, 284, E671–E678. [Google Scholar] [CrossRef] [PubMed]
- Kowalski, G.M.; Bruce, C.R. The regulation of glucose metabolism: Implications and considerations for the assessment of glucose homeostasis in rodents. Am. J. Physiol. 2014, 307, E859–R871. [Google Scholar] [CrossRef]
- Kim, J.H.; Cho, H.T.; Kim, Y.J. The role of estrogen in adipose tissue metabolism: Insights into glucose homeostasis regulation. Endocr. J. 2014, 61, 1055–1067. [Google Scholar] [CrossRef] [PubMed]
- Brelje, T.C.; Sorenson, R.L. Nutrient and hormonal regulation of the threshold of glucose-stimulated insulin secretion in isolated rat pancreases. Endocrinology 1988, 123, 1582–1590. [Google Scholar] [CrossRef] [PubMed]
- Bojsen-Moller, K.N.; Lundsgaard, A.-M.; Madsbad, S.; Kiens, B.; Holst, J.J. Hepatic insulin clearance in regulation of systemic insulin concentrations-role of carbohydrate and energy availability. Diabetes 2018, 67, 2129–2136. [Google Scholar] [CrossRef]
- Renström, F.; Burén, J.; Svensson, M.; Eriksson, J.W. Insulin resistance induced by high glucose and high insulin precedes insulin receptor substrate 1 protein depletion in human adipocytes. Metab. Clin. Exp. 2007, 56, 190–198. [Google Scholar] [CrossRef]
- Jelen, S.; Wacker, S.; Ponte-Santamaria, C.; Skott, M.; Rojek, A.; Johanson, U.; Kjellbom, P.; Nielsen, S.; de Groot, B.L.; Rutzler, M. Aquaporin-9 protein is the primary route of hepatocyte glycerol uptake for glycerol gluconeogenesis in mice. J. Biol. Chem. 2011, 286, 44319–44325. [Google Scholar] [CrossRef]
- Carneiro, L.; Pellerin, L. Monocarboxylate transporters: New players in body weight regulation. Obes. Rev. 2015, 16, 55–66. [Google Scholar] [CrossRef] [PubMed]
- Granata, A.L.; Midrio, M.; Corsi, A. Lactate oxidation by skeletal muscle during sustained contraction in vivo. Pflügers Arch. Eur. J. Physiol. 1976, 366, 247–250. [Google Scholar] [CrossRef]
- Lovejoy, J.; Mellen, B.; DiGirolamo, M. Lactate generation following glucose ingestion. Relation to obesity, carbohydrate tolerance and insulin sensitivity. Int. J. Obes. 1990, 14, 843–855. [Google Scholar] [PubMed]
- Rabinowitz, J.D.; Enerback, S. Lactate: The ugly duckling of energy metabolism. Nat. Metab. 2020, 2, 566–571. [Google Scholar] [CrossRef] [PubMed]
- Quistorff, B.; Secher, N.H.; Van Lieshout, J.J. Lactate fuels the human brain during exercise. FASEB J. 2008, 22, 3443–3449. [Google Scholar] [CrossRef]
- Sloviter, H.A.; Shimkin, P.; Suhara, K. Glycerol as a substrate for brain metabolism. Nature 1966, 210, 1334–1336. [Google Scholar] [CrossRef] [PubMed]
- McKenna, M.C.; Bezold, L.I.; Kimatian, S.J.; Tildon, J.T. Competition of glycerol with other oxidizable substrates in rat brain. Biochem. J. 1986, 237, 47–51. [Google Scholar] [CrossRef]
- Felipe, A.; Remesar, X.; Pastor-Anglada, M. L-Lactate uptake by rat liver. Effect of food deprivation and substrate availability. Biochem. J. 1991, 273, 195–198. [Google Scholar] [CrossRef]
- Bracht, A.; Constantin, J.; Ishii-Iwamoto, E.L.; Suzuki-Kemmelmeier, F. Zonation of gluconeogenesis from lactate and pyruvate in the rat liver studied by means of anterograde and retrograde bivascular perfusion. Biochim. Biophys. Acta 1994, 1199, 298–304. [Google Scholar] [CrossRef]
- Katz, J.; Wals, P.A. Lipogenesis from lactate in rat adipose tissue. Biochim. Biophys. Acta 1974, 348, 344–356. [Google Scholar] [CrossRef]
- DiGirolamo, M.; Newby, F.D.; Lovejoy, J. Lactate production in adipose tissue: A regulated function with extra-adipose implications. FASEB J. 1992, 6, 2405–2412. [Google Scholar] [CrossRef] [PubMed]
- Ho-Palma, A.C.; Rotondo, F.; Romero, M.d.M.; Fernández-López, J.A.; Remesar, X.; Alemany, M. Use of 14C-glucose by primary cultures of mature rat epididymal adipocytes. Marked release of lactate and glycerol, but limited lipogenesis in the absence of external stimuli. Adipocyte 2018, 7, 204–217. [Google Scholar] [CrossRef] [PubMed]
- Björkman, O.; Eriksson, L.S.; Nyberg, B.; Wahren, J. Gut exchange of glucose and lactate in basal state and after oral glucose ingestion in postoperative patients. Diabetes 1990, 39, 747–751. [Google Scholar] [CrossRef] [PubMed]
- Rémésy, C.; Demigné, C.; Aufrère, J. Inter-organ relationships between glucose, lactate and amino acids in rats fed on high-carbohydrate or high-protein diets. Biochem. J. 1978, 170, 321–329. [Google Scholar] [CrossRef]
- Hui, S.; Ghergurovich, J.M.; Morscher, R.J.; Jang, C.; Teng, X.; Lu, W.; Esparza, L.A.; Reya, T.; Zhan, L.; Guo, J.Y.; et al. Glucose feeds the TCA cycle via circulating lactate. Nature 2017, 551, 115–118. [Google Scholar] [CrossRef]
- Arriarán, S.; Agnelli, S.; Sabater, D.; Remesar, X.; Fernández-López, J.A.; Alemany, M. Evidences of basal lactate production in the main white adipose tissue sites of rats. Effects of sex and a cafeteria diet. PLoS ONE 2015, 10, e0119572. [Google Scholar] [CrossRef]
- Rotondo, F.; Ho-Palma, A.-C.; Romero, M.d.M.; Remesar, X.; Fernández-López, J.A.; Alemany, M. Higher lactate production from glucose in cultured adipose nucleated stromal cells than for rat adipocytes. Adipocyte 2019, 8, 61–76. [Google Scholar] [CrossRef]
- Chih, C.-P.; Lipton, P.; Roberts, E.L. Do active cerebral neurons really use lactate rather than glucose? Trends Neurosci. 2001, 24, 573–578. [Google Scholar] [CrossRef]
- Hardy, K.; Brand-Miller, J.; Brown, K.D.; Thomas, M.G.; Copeland, L. The importance of dietary carbohydrate in human evolution. Q. Rev. Biol. 2015, 90, 251–268. [Google Scholar] [CrossRef]
- Plaskett, L.G. On the essentiality of dietary carbohydrate. J. Nutr. Environ. Med. 2003, 13, 161–168. [Google Scholar] [CrossRef]
- Sampey, B.P.; Vanhoose, A.M.; Winfield, H.M.; Freemerman, A.J.; Mühlbauer, M.J.; Fueger, P.T.; Newgard, C.B.; Makowski, L. Cafeteria diet is a robust model of human metabolic syndrome with liver and adipose inflammation: Comparison to high-fat diet. Obesity 2011, 19, 1109–1117. [Google Scholar] [CrossRef]
- Eaton, S.B.; Eaton, S.B., III; Konner, M.J.; Shostak, M. An evolutionary perspective enhances understanding of human nutritional requirements. J. Nutr. 1996, 126, 1732–1740. [Google Scholar] [CrossRef] [PubMed]
- Fehm, H.; Kern, W.; Peters, A. The selfish brain: Competition for energy resources. Prog. Brain Res. 2006, 153, 129–140. [Google Scholar] [CrossRef]
- Pellerin, L.; Pellegri, G.; Bittar, P.G.; Charnay, Y.; Bouras, C.; Martin, J.L.; Stella, N.; Magistretti, P.J. Evidence supporting the existence of an activity-dependent astrocyte-neuron lactate shuttle. Dev. Neurosci. 1998, 20, 291–299. [Google Scholar] [CrossRef] [PubMed]
- Bouzier-Sore, A.K.; Voisin, P.; Bouchaud, V.; Bezancon, E.; Franconi, J.M.; Pellerin, L. Competition between glucose and lactate as oxidative energy substrates in both neurons and astrocytes: A comparative NMR study. Eur. J. Neurosci. 2006, 24, 1687–1694. [Google Scholar] [CrossRef]
- Fernández, E.; Medina, J.M. Lactate utilization by the neonatal rat brain in vitro. Competition with glucose and 3-hydroxybutyrate. Biochem. J. 1986, 234, 489–492. [Google Scholar] [CrossRef]
- Mason, S. Lactate shuttles in neuroenergetics—Homeostasis, allostasis and beyond. Front. Neurosci. 2017, 11, 43. [Google Scholar] [CrossRef]
- Barros, L.; Weber, B. CrossTalk proposal: An important astrocyte-to-neuron lactate shuttle couples neuronal activity to glucose utilisation in the brain. J. Physiol. 2018, 596, 347–350. [Google Scholar] [CrossRef]
- Bak, L.K.; Walls, A.B. CrossTalk opposing view: Lack of evidence supporting an astrocyte-to-neuron lactate shuttle coupling neuronal activity to glucose utilisation in the brain. J. Physiol. 2018, 596, 351–353. [Google Scholar] [CrossRef]
- Ashford, C.A.; Holmes, E.G. Further observations on the oxidation of lactic acid by brain tissue. Biochem. J. 1931, 25, 2028–2049. [Google Scholar] [CrossRef]
- Mergenthaler, P.; Lindauer, U.; Dienel, G.A.; Meisel, A. Sugar for the brain: The role of glucose in physiological and pathological brain function. Trends Neurosci. 2013, 36, 587–597. [Google Scholar] [CrossRef]
- Bode, L. Human milk oligosaccharides: Every baby needs a sugar mama. Glycobiology 2012, 22, 1147–1162. [Google Scholar] [CrossRef] [PubMed]
- Uauy, R.; Hoffman, D.R.; Peirano, P.; Birch, D.G.; Birch, E.E. Essential fatty acids in visual and brain development. Lipids 2001, 36, 885–895. [Google Scholar] [CrossRef]
- Pencharz, P.B.; Ball, R.O. Amino acid needs for early growth and development. J. Nutr. 2004, 134, 1566S–1568S. [Google Scholar] [CrossRef] [PubMed]
- Carabotti, M.; Scirocco, A.; Maselli, M.A.; Severi, C. The gut-brain axis: Interactions between enteric microbiota, central and enteric nervous systems. Ann. Gastroenterol. 2015, 28, 203–209. [Google Scholar]
- Hajjawi, O.S. Glucose transport in human red blood cells. Am. J. Biomed. Life Sci. 2013, 1, 44–52. [Google Scholar] [CrossRef]
- Brahm, J. Kinetics of glucose transport in human erythrocytes. J. Physiol. 1983, 339, 339–354. [Google Scholar] [CrossRef]
- Astbury, S.M.; Corfe, B.M. Uptake and metabolism of the short-chain fatty acid butyrate, a critical review of the literature. Curr. Drug Metab. 2012, 13, 815–821. [Google Scholar] [CrossRef]
- Brodersen, R.; Vorum, H.; Krukow, N.; Pedersen, A.O. Binding of long-chain fatty acids to serum albumin in healthy humans. Relationship to obesity. Eur. J. Biochem. 1991, 197, 461–465. [Google Scholar] [CrossRef]
- Dutta-Roy, A.K. Cellular uptake of long-chain fatty acids: Role of membrane-associated fatty-acid-binding/transport proteins. Cell. Mol. Life Sci. 2000, 57, 1360–1372. [Google Scholar] [CrossRef]
- Ehehalt, R.; Fullekrug, J.; Pohl, J.; Ring, A.; Herrmann, T.; Stremmel, W. Translocation of long chain fatty acids across the plasma membrane: Lipid rafts and fatty acid transport proteins. Mol. Cell. Biochem. 2006, 284, 135–140. [Google Scholar] [CrossRef]
- Mittendorfer, B.; Yoshino, M.; Patterson, B.W.; Klein, S. VLDL triglyceride kinetics in lean, overweight, and obese men and women. J. Clin. Endocrinol. Metab. 2016, 101, 4151–4160. [Google Scholar] [CrossRef]
- Fielding, C.J.; Fielding, P.E. Cholesterol transport between cells and body fluids. Role of plasma lipoproteins and the plasma cholesterol esterification system. Med. Clin. N. Am. 1982, 66, 363. [Google Scholar] [CrossRef]
- Frank, M.B.O.; Shoham, N.; Benayahu, D.; Gefen, A. Effects of accumulation of lipid droplets on load transfer between and within adipocytes. Biomech. Model. Mechanobiol. 2015, 14, 15–28. [Google Scholar] [CrossRef] [PubMed]
- Cinti, S.; Mitchell, G.; Barbatelli, G.; Murano, I.; Ceresi, E.; Faloia, E.; Wang, S.P.; Fortier, M.; Greenberg, A.S.; Obin, M.S. Adipocyte death defines macrophage localization and function in adipose tissue of obese mice and humans. J. Lipid Res. 2005, 46, 2347–2355. [Google Scholar] [CrossRef] [PubMed]
- Murano, I.; Barbatelli, G.; Parisani, V.; Latini, C.; Muzzonigro, G.; Castellucci, M.; Cinti, S. Dead adipocytes, detected as crown-like structures, are prevalent in visceral fat depots of genetically obese mice. J. Lipid Res. 2008, 49, 1562–1568. [Google Scholar] [CrossRef]
- Poon, I.K.; Lucas, C.D.; Rossi, A.G.; Ravichandran, K.S. Apoptotic cell clearance: Basic biology and therapeutic potential. Nat. Rev. Immunol. 2014, 14, 166–180. [Google Scholar] [CrossRef]
- Connolly, K.D.; Guschina, I.A.; Yeung, V.; Clayton, A.; Draman, M.S.; Von Ruhland, C.; Ludgate, M.; James, P.E.; Rees, D.A. Characterisation of adipocyte-derived extracellular vesicles released pre-and post-adipogenesis. J. Extracell. Vesicles 2015, 4, 29159. [Google Scholar] [CrossRef]
- Kita, S.; Maeda, N.; Shimomura, I. Interorgan communication by exosomes, adipose tissue, and adiponectin in metabolic syndrome. J. Clin. Investig. 2019, 129, 4041–4049. [Google Scholar] [CrossRef]
- Walajtys, E.I.; Gottesman, D.P.; Williamson, J.R. Regulation of pyruvate dehydrogenase in rat liver mitochondria by phosphorylation-dephosphorylation. J. Biol. Chem. 1974, 249, 1857–1865. [Google Scholar]
- Bowker-Kinley, M.M.; Davis, W.I.; Wu, P.F.; Harris, R.A.; Popov, K.M. Evidence for existence of tissue-specific regulation of the mammalian pyruvate dehydrogenase complex. Biochem. J. 1998, 329, 191–196. [Google Scholar] [CrossRef] [PubMed]
- Weiss, L.; Löffler, G.; Wieland, O.H. Regulation by insulin of adipose tissue pyruvate dehydrogenase. A mechanism controlling fatty acid synthesis from carbohydrates. Hoppe Seyler’s Z. Physiol. Chem. 1974, 355, 363–377. [Google Scholar] [CrossRef]
- Dolan, S.K.; Welch, M. The glyoxylate shunt, 60 years on. Annu. Rev. Microbiol. 2018, 72, 309–330. [Google Scholar] [CrossRef]
- Canvin, D.T.; Beevers, H. Sucrose synthesis from acetate in the germinating castor bean: Kinetics and pathway. J. Biol. Chem. 1961, 236, 988–995. [Google Scholar] [PubMed]
- Parry-Billings, M.; Newsholme, E.A. The possible role of glutamine substrate cycles in skeletal muscle. Biochem. J. 1991, 279, 327–328. [Google Scholar] [CrossRef] [PubMed]
- Reichard, G.A.; Moury, N.F.; Hochella, N.J.; Patterson, A.L.; Weinhouse, S. Quantitative estimation of the Cori cycle in human. J. Biol. Chem. 1963, 238, 495–501. [Google Scholar]
- Felig, P. The glucose-alanine cycle. Metabolism 1973, 22, 179–207. [Google Scholar] [CrossRef]
- Perriello, G.; Jorde, R.; Nurjhan, N.; Stumvoll, M.; Dailey, G.; Jenssen, T.; Bier, D.M.; Gerich, J.E. Estimation of glucose-alanine-lactate-glutamine cycles in postabsorptive humans: Role of skeletal muscle. Am. J. Physiol. 1995, 269, E443–E450. [Google Scholar] [CrossRef]
- Brooks, G. Lactate: Glycolytic end product and oxidative substrate during sustained exercise in mammals—The “lactate shuttle”. In Circulation, Respiration, and Metabolism; Gilles, R., Ed.; Springer: Berlin/Heidelberg, Germany, 1985; pp. 208–218. [Google Scholar] [CrossRef]
- Shikama, H.; Ui, M. Glucose load diverts hepatic gluconeogenic product from glucose to glycogen in vivo. Am. J. Physiol. 1978, 235, E354–E360. [Google Scholar] [CrossRef]
- Sestoft, L.; Marshall, M.O. Hepatic lactate uptake is enhanced by low pH at low lactate concentrations in perfused rat liver. Clin. Sci. 1986, 70, 19–22. [Google Scholar] [CrossRef]
- Latres, E.; Alemany, M.; Remesar, X. In vivo glucose metabolism in the rat lung. Biochem. Arch. 1992, 8, 175–182. [Google Scholar]
- Casado, J.; Fernández-López, J.A.; Esteve, M.; Rafecas, I.; Argilés, J.M.; Alemany, M. Rat splanchnic net oxygen consumption, energy implications. J. Physiol. 1990, 431, 557–569. [Google Scholar] [CrossRef] [PubMed]
- Rotondo, F.; Ho-Palma, A.C.; Remesar, X.; Fernández-López, J.A.; Romero, M.D.; Alemany, M. Glycerol is synthesized and secreted by adipocytes to dispose of excess glucose, via glycerogenesis and increased acyl-glycerol turnover. Sci. Rep. 2017, 7, 8983. [Google Scholar] [CrossRef] [PubMed]
- Darragh, A.J.; Hodgkinson, S.M. Quantifying the digestibility of dietary protein. J. Nutr. 2000, 130, 1850S–1856S. [Google Scholar] [CrossRef]
- Lin, R.; Liu, W.; Piao, M.; Zhu, H. A review of the relationship between the gut microbiota and amino acid metabolism. Amino Acids 2017, 49, 2083–2090. [Google Scholar] [CrossRef]
- Bloomgarden, Z.T.; Liljenquist, J.; Lacy, W.; Rabin, D. Amino acid disposition by liver and gastrointestinal tract after protein and glucose ingestion. Am. J. Physiol. 1981, 241, E90–E99. [Google Scholar] [CrossRef] [PubMed]
- van Sande, M.; van Camp, K. Absence of L-histidine ammonia lyase and histidine imidazole metabolites in human adenomatous prostate. Urol. Int. 1980, 35, 417–420. [Google Scholar] [CrossRef]
- Burrin, D.G.; Stoll, B. Emerging aspects of gut sulfur amino acid metabolism. Curr. Opin. Clin. Nutr. Metab. Care 2007, 10, 63–68. [Google Scholar] [CrossRef]
- Struys, E.A.; Jakobs, C. Metabolism of lysine in α-aminoadipic semialdehyde dehydrogenase-deficient fibroblasts: Evidence for an alternative pathway of pipecolic acid formation. FEBS Lett. 2010, 584, 181–186. [Google Scholar] [CrossRef]
- van Milgen, J. Modeling biochemical aspects of energy metabolism in mammals. J. Nutr. 2002, 132, 3195–3202. [Google Scholar] [CrossRef]
- Alemany, M. The problem of nitrogen disposal in the obese. Nutr. Res. Rev. 2012, 25, 18–28. [Google Scholar] [CrossRef]
- Ferrer-Lorente, R.; Fernández-López, J.A.; Alemany, M. Estimation of the metabolizable energy equivalence of dietary proteins. Eur. J. Nutr. 2007, 46, 1–11. [Google Scholar] [CrossRef]
- Aikawa, T.; Matsutaka, H.; Takezawa, K.; Ishikawa, E. Gluconeogenesis and amino acid metabolism 1. Comparison of various precursors for hepatic gluconeogenesis in vivo. Biochim. Biophys. Acta 1972, 279, 234–244. [Google Scholar] [CrossRef]
- Neinast, M.D.; Jang, C.; Hui, S.; Murashige, D.S.; Chu, Q.; Morscher, R.J.; Li, X.; Zhan, L.; White, E.; Anthony, T.G.; et al. Quantitative analysis of the whole-body metabolic fate of branched-chain amino acids. Cell Metab. 2019, 29, 417–429. [Google Scholar] [CrossRef]
- McGarrah, R.W.; Zhang, G.F.; Christopher, B.A.; Deleye, Y.; Walejko, J.M.; Page, S.; Ilkayeva, O.; White, P.J.; Newgard, C.B. Dietary branched-chain amino acid restriction alters fuel selection and reduces triglyceride stores in hearts of Zucker fatty rats. Am. J. Physiol. 2020, 318, E216–E223. [Google Scholar] [CrossRef] [PubMed]
- Coon, M.J.; Abrahamsen, N.S.; Greene, G.S. The relation of α-methylbutyrate to isoleucine metabolism. II. Propionate formation. J. Biol. Chem. 1952, 199, 75–84. [Google Scholar] [PubMed]
- Perry, R.J.; Borders, C.B.; Cline, G.W.; Zhang, X.-M.; Alves, T.C.; Petersen, K.F.; Rothman, D.L.; Kibbey, R.G.; Shulman, G.I. Propionate Increases Hepatic Pyruvate Cycling and Anaplerosis and Alters Mitochondrial Metabolism. J. Biol. Chem. 2016, 291, 12161–12170. [Google Scholar] [CrossRef]
- Sketcher, R.D.; Fern, E.B.; James, W.P.T. Adaptation in muscle oxidation of leucine to dietary protein and energy intake. Br. J. Nutr. 1974, 31, 333–342. [Google Scholar] [CrossRef] [PubMed][Green Version]
- Gurr, M.I.; Mawson, R.; Rothwell, N.J.; Stock, M.J. Effects of manipulating dietary protein and energy intake on energy balance and thermogenesis in the pig. J. Nutr. 1980, 110, 532–542. [Google Scholar] [CrossRef]
- Moldawer, L.L.; Bistrian, B.R.; Blackburn, G.L. Factors determining the preservation of protein status during dietary protein deprivation. J. Nutr. 1981, 111, 1287–1296. [Google Scholar] [CrossRef]
- Goodman, M.N.; Aoki, T.T.; Kaplan, M.M.; Larsen, P.R.; Ruderman, N.B.; Young, V.R. Starvation in the rat. 2. Effect of age and obesity on protein sparing and fuel metabolism. Am. J. Physiol. 1980, 239, E277–E286. [Google Scholar]
- Golden, M.H.N.; Waterlow, J.C.; Picou, D. Protein turnover, synthesis and breakdown before and after recovery from protein-energy malnutrition. Clin. Sci. Mol. Med. 1977, 53, 473–477. [Google Scholar] [CrossRef] [PubMed]
- Waterlow, J.C. Protein-energy malnutrition: The nature and extent of the problem. Clin. Nutr. 1997, 16 (Suppl. 1), 3–9. [Google Scholar] [CrossRef]
- Woolfson, A. Amino acids—Their role as an energy source. Proc. Nutr. Soc. 1983, 42, 489–495. [Google Scholar] [CrossRef]
- Mantha, O.L.; Polakof, S.; Huneau, J.F.; Mariotti, F.; Poupin, N.; Zalko, D.; Fouillet, H. Early changes in tissue amino acid metabolism and nutrient routing in rats fed a high-fat diet: Evidence from natural isotope abundances of nitrogen and carbon in tissue proteins. Br. J. Nutr. 2018, 119, 981–991. [Google Scholar] [CrossRef]
- Tessari, P. Are there dietary requirements for dispensable amino acids and if so, how do we assess requirements? Curr. Opin. Clin. Nutr. Metab. Care 2019, 22, 329–336. [Google Scholar] [CrossRef]
- Krebs, H.A.; Henseleit, K. Untersuchungen über die Harnstoffbildung im Tierkörper [Studies on urea formation in animal carcasses]. Hoppe-Seyler’s Z. Physiol. Chem. 1932, 210, 33–36. [Google Scholar] [CrossRef]
- Kornberg, H. Krebs and his trinity of cycles. Nat. Rev. Mol. Cell Biol. 2000, 1, 225–228. [Google Scholar] [CrossRef] [PubMed]
- Moncada, S.; Higgs, A. The L-arginine-nitric oxide pathway. N. Engl. J. Med. 1993, 329, 2002–2012. [Google Scholar]
- Kim, S.H.; Kim, T.H.; Sohn, J.W.; Yoon, H.J.; Shin, D.H.; Park, S.S. Reference values and determinants of exhaled nitric oxide in healthy Korean adults. J. Asthma 2010, 47, 563–567. [Google Scholar] [CrossRef]
- Torres, J.; Sharpe, M.A.; Rosquist, A.; Cooper, C.E.; Wilson, M.T. Cytochrome c oxidase rapidly metabolises nitric oxide to nitrite. FEBS Lett. 2000, 475, 263–266. [Google Scholar] [CrossRef]
- Little, J.W.; Doyle, T.; Salvemini, D. Reactive nitroxidative species and nociceptive processing: Determining the roles for nitric oxide, superoxide, and peroxynitrite in pain. Amino Acids 2012, 42, 75–94. [Google Scholar] [CrossRef] [PubMed]
- Chen, C.; Ren, F.; Lu, T.; Friis, T.; He, T.; Zhang, X.; Jian, Y. Involvement of salivary glands in regulating the human nitrate and nitrite levels. Arch. Oral Biol. 2010, 55, 613–620. [Google Scholar] [CrossRef] [PubMed]
- Hu, C.W.; Chang, Y.J.; Yen, C.C.; Chen, J.L.; Muthukumaran, R.B.; Chao, M.R. N15-labelled nitrite/nitrate tracer analysis by LC-MS/MS: Urinary and fecal excretion of nitrite/nitrate following oral administration to mice. Free Radic. Biol. Med. 2019, 143, 193–202. [Google Scholar] [CrossRef]
- Costa, G.; Ullrich, L.; Kantor, F.; Holland, J.F. Production of elemental nitrogen by certain mammals including man. Nature 1968, 218, 546–551. [Google Scholar] [CrossRef]
- Cissik, J.H.; Johson, R.E.; Rokosch, D.K. Production of gaseous nitrogen in human steady-state conditions. J. Appl. Physiol. 1972, 32, 155–159. [Google Scholar] [CrossRef]
- Esteve, M.; Rafecas, I.; Remesar, X.; Alemany, M. Nitrogen balances of lean and obese Zucker rats subjected to a cafeteria diet. Int. J. Obes. 1992, 16, 237–244. [Google Scholar]
- Sabater, D.; Agnelli, S.; Arriarán, S.; Fernández-López, J.-A.; Romero, M.d.M.; Alemany, M.; Remesar, X. Altered nitrogen balance and decreased urea excretion in male rats fed cafeteria diet are related to arginine availability. Biomed Res. Int. 2014, 2014, 959420. [Google Scholar] [CrossRef]
- Wang, C.; Zhang, S.H.; Li, W.; Fang Wang, P.; Li, L. Nitric oxide supplementation alleviates ammonium toxicity in the submerged macrophyte Hydrilla verticillata (Lf.) Royle. Ecotoxicol. Environ. Saf. 2011, 74, 67–73. [Google Scholar] [CrossRef]
- Choudhury, M.G.; Saha, N. Influence of environmental ammonia on the production of nitric oxide and expression of inducible nitric oxide synthase in the freshwater air-breathing catfish (Heteropneustes fossilis). Aquat. Toxicol. 2012, 116–117, 43–53. [Google Scholar] [CrossRef]
- Kumari, S.; Choudhury, M.G.; Saha, N. Hyper-ammonia stress causes induction of inducible nitric oxide synthase gene and more production of nitric oxide in air-breathing magur catfish, Clarias magur (Hamilton). Fish Physiol. Biochem. 2019, 45, 907–920. [Google Scholar] [CrossRef] [PubMed]
- Kuenen, J.G. Anammox bacteria: From discovery to application. Nat. Rev. Microbiol. 2008, 6, 320–326. [Google Scholar] [CrossRef] [PubMed]
- Kartal, B.; Tan, N.C.G.; van de Biezen, E.; Kampschreur, M.J.; van Loosdrecht, M.C.M.; Jetten, M.S.M. Effect of nitric oxide on anammox bacteria. Appl. Environ. Microbiol. 2010, 76, 6304–6306. [Google Scholar] [CrossRef] [PubMed]
- Kartal, B.; Maalcke, W.J.; de Almeida, N.M.; Cirpus, I.; Gloerich, J.; Geerts, W.; Op den Camp, H.J.M.; Harhangi, H.R.; Janssen-Megens, E.M.; Francoijs, K.-J.; et al. Molecular mechanism of anaerobic ammonium oxidation. Nature 2011, 479, 127–130. [Google Scholar] [CrossRef]
- Nguyen, D.A.; Iwaniw, M.A.; Fogler, H.S. Kinetics and mechanism of the reaction between ammonium and nitrite ions: Experimental and theoretical studies. Chem. Eng. Sci. 2003, 58, 4351–4362. [Google Scholar] [CrossRef]
- Schmidt, C.L.A. The reaction between nitrous acid and certain amino acids related compounds at 45°. J. Biol. Chem. 1929, 82, 587–594. [Google Scholar]
- Sllison, F.E.; Doetsch, J.H.; Sterling, L.D. Nitrogen gas formation by interaction of nitrites and amino acids. Soil Sci. 1952, 74, 311–314. [Google Scholar] [CrossRef]
- Kramer, L.; Tribl, B.; Gendo, A.; Zauner, C.; Schneider, B.; Ferenci, P.; Madl, C. Partial pressure of ammonia versus ammonia in hepatic encephalopathy. Hepatology 2000, 31, 30–34. [Google Scholar] [CrossRef]
- Vermeiren, J.; van de Wiele, T.; Verstraete, W.; Boeckx, P.; Boon, N. Nitric oxide production by the human intestinal microbiota by dissimilatory nitrate reduction to ammonium. J. Biomed. Biotechnol. 2009, 2009, 284718. [Google Scholar] [CrossRef]
- Wrong, O.M. Intestinal handling of urea and ammonia. Proc. R. Soc. Med. 1971, 64, 1025–1026. [Google Scholar]
- Sinha, B.K.; Mason, R.P. Biotransformation of hydrazine dervatives in the mechanism of toxicity. J. Drug Metab. Toxicol. 2014, 5, 1000168. [Google Scholar] [CrossRef]
- Simonsen, D.G.; Roberts, E. Influence of hydrazine on the distributions of free amino acids in mouse liver. Proc. Soc. Exp. Biol. Med. 1967, 124, 806–811. [Google Scholar] [CrossRef] [PubMed]
- Karaca, M.; Martin-Levilain, J.; Grimaldi, M.; Li, L.; Dizin, E.; Emre, Y.; Maechler, P. Liver glutamate dehydrogenase controls whole-body energy partitioning through amino acid-derived gluconeogenesis and ammonia homeostasis. Diabetes 2018, 67, 1949–1961. [Google Scholar] [CrossRef] [PubMed]
- Verhoeven, A.J.; van Iwaarden, J.F.; Joseph, S.K.; Meijer, A.J. Control of rat-liver glutaminase by ammonia and pH. Eur. J. Biochem. 1983, 133, 241–244. [Google Scholar] [CrossRef]
- Lacza, Z.; Pankotai, E.; Busija, D.W. Mitochondrial nitric oxide synthase: Current concepts and controversies. Front. Biosci. 2009, 14, 4436–4443. [Google Scholar] [CrossRef] [PubMed]
- Langø, T.; Mørland, T.; Brubakk, A. Diffusion coefficients and solubility coefficients for gases in biological fluids and tissues: A review. Undersea Hyperb. Med. 1996, 23, 247–272. [Google Scholar]
- Koopman, H.N.; Westgate, A.J. Solubility of nitrogen in marine mammal blubber depends on its lipid composition. J. Exp. Biol. 2012, 215, 3856–3863. [Google Scholar] [CrossRef]
- Kumar, S.; Asrani, S.K. Non-cirrhotic hyperammonemia—When high ammonia is not always from cirrhosis. Curr. Hepatol. Rep. 2015, 14, 25–31. [Google Scholar] [CrossRef]
- Drewnowski, A.; Krahn, D.D.; Demitrack, M.A.; Nairn, K.; Gosnell, B.A. Taste responses and preferences for sweet high-fat foods: Evidence for opioid involvement. Physiol. Behav. 1992, 51, 371–379. [Google Scholar] [CrossRef]
- Alemany, M. Different effects of hyperlipidic diets in human lactation and adulthood: Growth versus the development of obesity. Reprod. Biol. Endocrinol. 2011, 9, 101. [Google Scholar] [CrossRef]
- Sclafani, A.; Springer, D. Dietary obesity in adult rats: Similarities to hypothalamic and human obesity syndromes. Physiol. Behav. 1976, 17, 461–471. [Google Scholar] [CrossRef]
- Kennedy, A.R.; Pissios, P.; Otu, H.; Xue, B.Z.; Asakura, K.; Furukawa, N.; Marino, F.E.; Liu, F.F.; Kahn, B.B.; Libermann, T.A.; et al. A high-fat, ketogenic diet induces a unique metabolic state in mice. Am. J. Physiol. 2007, 292, E1724–E1739. [Google Scholar] [CrossRef] [PubMed]
- Romero, M.d.M.; Roy, S.; Pouillot, K.; Feito, M.; Esteve, M.; Grasa, M.d.M.; Fernández-López, J.-A.; Alemany, M.; Remesar, X. Treatment of rats with a self-selected hyperlipidic diet, increases the lipid content of the main adipose tissue sites in a proportion similar to that of the lipids in the rest of organs and tissues. PLoS ONE 2014, 9, e90995. [Google Scholar] [CrossRef] [PubMed]
- Carlson, M.G.; Snead, W.L.; Campbell, P.J. Fuel and energy metabolism in fasting humans. Am. J. Clin. Nutr. 1994, 60, 29–36. [Google Scholar] [CrossRef] [PubMed]
- Kreitzman, S.N.; Coxon, A.Y.; Szaz, K.F. Glycogen storage: Illusions of easy weight loss, excessive weight regain, and distortions in estimates of body composition. Am. J. Clin. Nutr. 1992, 56, 292S–293S. [Google Scholar] [CrossRef]
- Caloin, M. Modeling of lipid and protein depletion during total starvation. Am. J. Physiol. 2004, 287, E790–E798. [Google Scholar] [CrossRef]
- Rafecas, I.; Esteve, M.; Fernández-López, J.A.; Remesar, X.; Alemany, M. Whole-rat protein-content estimation. Applicability of the Nx6.25 factor. Br. J. Nutr. 1994, 72, 199–209. [Google Scholar] [CrossRef]
- Frayn, K.N. Metabolic Regulation. A Human Perspective, 3rd ed.; Wiley-Blackwell: London, UK, 2010. [Google Scholar]
- Janssen, I.; Heymsfield, S.B.; Wang, Z.M.; Ross, R. Skeletal muscle mass and distribution in 468 men and women aged 18–88 yr. J. Appl. Physiol. 2000, 89, 81–88. [Google Scholar] [CrossRef]
- Mosoni, L.; Malmezat, T.; Valluy, M.C.; Houlier, M.L.; Attaix, D.; Patureau Mirand, D. Lower recovery of muscle protein lost during starvation in old rats despite a stimulation of protein synthesis. Am. J. Physiol. 1999, 277, E608–E616. [Google Scholar] [CrossRef]
- Després, J.P.; Lemieux, I. Abdominal obesity and metabolic syndrome. Nature 2006, 444, 881–887. [Google Scholar] [CrossRef]
- Afolabi, P.R.; Jahoor, F.; Jackson, A.A.; Stubbs, J.; Johnstone, A.M.; Faber, P.; Lobley, G.; Gibney, E.; Elia, M. The effect of total starvation and very low energy diet in lean men on kinetics of whole body protein and five hepatic secretory proteins. Am. J. Physiol. 2007, 293, E1580–E1589. [Google Scholar] [CrossRef] [PubMed]
- Millward, D.J. Protein turnover in skeletal muscle. II. The effect of starvation and a protein-free diet on synthesis and catabolism of skeletal muscle proteins in comparison to liver. Clin. Sci. 1970, 39, 591–603. [Google Scholar] [CrossRef] [PubMed]
- le Maho, Y.; Robin, J.P.; Cherel, Y. Starvation as a treatment of obesity: The need to conserve body protein. News Physiol. Sci. 1988, 3, 21–24. [Google Scholar] [CrossRef]
- WHO; FAO. Diet, Nutrition and the Prevention of Chronic Diseases; WHO Technical Report Series 916; WTO: Généve, Switzerland, 2003; pp. 1–159. [Google Scholar]
- EFSA. Scientific opinion on dietary reference values for energy. EFSA J. 2013, 11, 3005. [Google Scholar] [CrossRef]
- Oliva, L.; Aranda, T.; Alemany, M.; Fernández-López, J.-A.; Remesar, X. Unconnected body accrual of dietary lipid and protein in rats fed diets with different lipid and protein content. Mol. Nutr. Food Res. 2020, 64, 2000265. [Google Scholar] [CrossRef] [PubMed]
- Oliva, L.; Aranda, T.; Caviola, G.; Fernández-Bernal, A.; Alemany, M.; Fernández-Lopez, J.A.; Remesar, X. In rats fed high-energy diets, taste, rather than fat content, is the key factor increasing food intake: A comparison of a cafeteria and a lipid-supplemented standard diet. PeerJ 2017, 5, e3697. [Google Scholar] [CrossRef]
- Atwater, W.O. Foods: Nutritive Value and Cost; Farmers’ Bulletin 36; US Department of Agriculture: Washington, DC, USA, 1894; pp. 1–32. [Google Scholar]
- Sánchez-Peña, M.J.; Márquez-Sandoval, F.; Ramírez-Anguiano, A.C.; Velasco-Ramírez, S.F.; Macedo-Ojeda, G.; González-Ortiz, L.J. Calculating the metabolizable energy of macronutrients: A critical review of Atwater’s results. Nutr. Rev. 2017, 75, 37–48. [Google Scholar] [CrossRef]
- Lecerf, J.M.; Waysfeld, B.; Klein, P.; Filipecki, J. Les moyens mis en œuvre pour perdre du poids chez 1000 sujets en surpoids ou obèses. Obésité 2007, 2, 239–244. [Google Scholar] [CrossRef]
- Lemmens, V.E.P.P.; Oenema, A.; Klepp, K.I.; Henriksen, H.B.; Brug, J. A systematic review of the evidence regarding efficacy of obesity prevention interventions among adults. Obes. Rev. 2008, 9, 446–455. [Google Scholar] [CrossRef]
- Ball, M.F.; Canary, J.J.; Kyle, L.H. Comparative effects of caloric restriction and total starvation on body composition in obesity. Ann. Intern. Med. 1967, 67, 60–67. [Google Scholar] [CrossRef]
- Bray, G.A. Risks of obesity. Endocrinol. Metab. Clin. N. Am. 2003, 32, 787–804. [Google Scholar] [CrossRef]
- Kaloyianni, M.; Freedland, R.A. Contribution of several amino acids and lactate to gluconeogenesis in hepatocytes isolated from rats fed various diets. J. Nutr. 1990, 120, 116–122. [Google Scholar] [CrossRef]
- Lowell, B.B.; Goodman, M.N. Protein sparing in skeletal-muscle during prolonged starvation: Dependence on lipid fuel availability. Diabetes 1987, 36, 14–19. [Google Scholar] [CrossRef] [PubMed]
- Alemany, M. Adjustment to dietary energy availability: From starvation to overnutrition. RSC Adv. 2013, 3, 1636–1651. [Google Scholar] [CrossRef]
- Schwarz, J.; Tomé, D.; Baars, A.; Hooiveld, G.J.E.J.; Müller, M. Dietary protein affects gene expression and prevents lipid accumulation in the liver in mice. PLoS ONE 2012, 7, e47303. [Google Scholar] [CrossRef] [PubMed]
- Wells, J.C.K. Thrift: A guide to thrifty genes, thrifty phenotypes and thrifty norms. Int. J. Obes. 2009, 33, 1331–1338. [Google Scholar] [CrossRef] [PubMed]
- Prentice, A.M.; Hennig, B.J.; Fulford, A. Evolutionary origins of the obesity epidemic: Natural selection of thrifty genes or genetic drift following predation release? Int. J. Obes. 2008, 32, 1607–1610. [Google Scholar] [CrossRef] [PubMed]
- Huypens, P.; Sass, S.; Wu, M.; Dyckhoff, D.; Tschop, M.; Theis, F.; Marschall, S.; de Angelis, M.H.; Beckers, J. Epigenetic germline inheritance of diet-induced obesity and insulin resistance. Nat. Genet. 2016, 48, 497–499. [Google Scholar] [CrossRef]
- Ouni, M.; Schürmann, A. Epigenetic contribution to obesity. Mamm. Genome 2020, 31, 134–145. [Google Scholar] [CrossRef] [PubMed]
- Schrauwen, P.; Lichtenbelt, W.D.; Westerterp, K.R. Energy balance in a respiration chamber: Individual adjustment of energy intake to energy expenditure. Int. J. Obes. 1997, 21, 769–774. [Google Scholar] [CrossRef][Green Version]
- Drenowatz, C. Reciprocal compensation to changes in dietary intake and energy expenditure within the concept of energy balance. Adv. Nutr. 2015, 6, 592–599. [Google Scholar] [CrossRef]
- Bickerton, A.S.; Roberts, R.; Fielding, B.A.; Hodson, L.; Blaak, E.E.; Wagenmakers, A.J.; Gilbert, M.; Karpe, F.; Frayn, K.N. Preferential uptake of dietary fatty acids in adipose tissue and muscle in the postprandial period. Diabetes 2007, 56, 168–176. [Google Scholar] [CrossRef] [PubMed]
- Aarsland, A.; Chinkes, D.; Wolfe, R.R. Hepatic and whole-body fat synthesis in humans during carbohydrate overfeeding. Am. J. Clin. Nutr. 1997, 65, 1774–1782. [Google Scholar] [CrossRef]
- Hellerstein, M.K.; Schwarz, J.-M.; Neese, R.A. Regulation of hepatic de novo lipogenesis in humans. Annu. Rev. Nutr. 1996, 16, 523–557. [Google Scholar] [CrossRef]
- Leite, T.C.; Coelho, R.G.; da Silva, D.; Coelho, W.S.; Marinho-Carvalho, M.M.; Sola-Penna, M. Lactate downregulates the glycolytic enzymes hexokinase and phosphofructokinase in diverse tissues from mice. FEBS Lett. 2011, 585, 92–98. [Google Scholar] [CrossRef]
- Pettit, F.H.; Pelley, J.W.; Reed, L.J. Regulation of pyruvate dehydrogenase kinase and phosphatase by acetyl-CoA/CoA and NADH/NAD ratios. Biochem. Biophys. Res. Commun. 1975, 65, 575–582. [Google Scholar] [CrossRef]
- Stubbs, R.J.; Whybrow, S. Energy density, diet composition and palatability: Influences on overall food energy intake in humans. Physiol. Behav. 2004, 81, 755–764. [Google Scholar] [CrossRef]
- Kita, K.; Muramatsu, T.; Okumura, J. Effect of dietary protein and energy intakes on whole body protein turnover and its contribution to heat production in chicks. Br. J. Nutr. 1993, 69, 681–688. [Google Scholar] [CrossRef] [PubMed]
- Rothwell, N.J.; Saville, M.E.; Stock, M.J. Effects of feeding a cafeteria diet on energy-balance and diet-induced thermogenesis in 4 strains of rat. J. Nutr. 1982, 112, 1515–1524. [Google Scholar] [CrossRef]
- Gianotti, M.; Roca, P.; Palou, A. Body weight and tissue composition in rats made obese by a cafeteria diet. Effect of 24 hours starvation. Horm. Metab. Res. 1988, 20, 208–212. [Google Scholar] [CrossRef] [PubMed]
- Melhorn, S.J.; Krause, E.G.; Scott, K.A.; Mooney, M.R.; Johnson, J.D.; Woods, S.C.; Sakai, R.R. Acute exposure to a high-fat diet alters meal patterns and body composition. Physiol. Behav. 2010, 99, 33–39. [Google Scholar] [CrossRef]
- Coate, K.C.; Scott, M.; Farmer, B.; Moore, M.C.; Smith, M.; Roop, J.; Neal, D.W.; Williams, P.; Cherrington, A.D. Chronic consumption of a high-fat/ high-fructose diet renders the liver incapable of net hepatic glucose uptake. Am. J. Physiol. 2010, 299, E887–E898. [Google Scholar] [CrossRef] [PubMed]
- Demigné, C.; Bloch-Faure, M.; Picard, N.; Sabboh, H.; Besson, C.; Rémésy, C.; Geoffroy, V.; Gaston, A.T.; Nicoletti, A.; Hagège, A.; et al. Mice chronically fed a westernized experimental diet as a model of obesity, metabolic syndrome and osteoporosis. Eur. J. Nutr. 2006, 45, 298–308. [Google Scholar] [CrossRef]
- Brennan, M.F.; Fitzpatrick, G.F.; Cohen, K.H.; Moore, F.D. Glycerol: Major contributor to the short-term sparing effect of fat emulsions in normal man. Ann. Surg. 1975, 182, 386–394. [Google Scholar] [CrossRef]
- Rolls, B.J.; Rowe, E.A.; Turner, R.C. Persistent obesity in rats following a period of consumption of a mixed, high-energy diet. J. Physiol. 1980, 298, 415–427. [Google Scholar] [CrossRef] [PubMed]
- Pereira de Moura, L.; Dalia, R.A.; Barbosa de Araújo, M.; da Silva Sponton, A.C.; Pauli, J.R.; Ferreira de Moura, R.; Rostom de Mello, M.A. Alteraçðes bioquímicas e hepáticas em ratos submetidos à una dieta hiperlipídica/hiperenergenética {Hepatic biochemical changes in rats submitted to a high-fat/high-energy diet}. Rev. Nutr. 2012, 25, 685–693. [Google Scholar] [CrossRef]
- Messa, G.A.M.; Piasecki, M.; Hurst, J.; Hill, C.; Tallis, J.; Degens, H. The impact of a high-fat diet in mice is dependent on duration and age, and differs between muscles. J. Exp. Biol. 2020, 223, jeb217117. [Google Scholar] [CrossRef] [PubMed]
- Bock, G.; Chittilapilly, E.; Basu, R.; Toffolo, G.; Cobelli, C.; Chandramouli, V.; Landau, B.R.; Rizza, R.A. Contribution of hepatic and extrahepatic insulin resistance to the pathogenesis of impaired fasting glucose. Role of increased rates of gluconeogenesis. Diabetes 2007, 56, 1703–1711. [Google Scholar] [CrossRef]
- Yang, Z.H.; Miyahara, H.; Takeo, J.; Katayama, M. Diet high in fat and sucrose induces rapid onset of obesity-related metabolic syndrome partly through rapid response of genes involved in lipogenesis, insulin signalling and inflammation in mice. Diabetol. Metab. Syndr. 2012, 4, 32. [Google Scholar] [CrossRef]
- Cavaghan, M.K.; Ehrmann, D.A.; Polonsky, K.S. Interactions between insulin resistance and insulin secretion in the development of glucose intolerance. J. Clin. Investig. 2000, 106, 329–333. [Google Scholar] [CrossRef]
- Merz, K.E.; Thurmond, D.C. Role of skeletal muscle in insulin resistance and glucose uptake. Compr. Physiol. 2020, 10, 785–809. [Google Scholar] [CrossRef] [PubMed]
- Tuan, C.Y.; Abbasi, F.; Lamendola, C.; McLaughlin, T.; Reaven, G. Usefulness of plasma glucose and insulin concentrations in identifying patients with insulin resistance. Am. J. Cardiol. 2003, 92, 606–610. [Google Scholar] [CrossRef]
- Iyer, A.; Fairlie, D.P.; Prins, J.B.; Hammock, B.D.; Brown, L. Inflammatory lipid mediators in adipocyte function and obesity. Nat. Rev. Endocrinol. 2010, 6, 71–82. [Google Scholar] [CrossRef] [PubMed]
- Arriarán, S.; Agnelli, S.; Remesar, X.; Fernández-López, J.-A.; Alemany, M. The urea cycle of rat white adipose tissue. RSC Adv. 2015, 5, 93403–93414. [Google Scholar] [CrossRef]
- Arriarán, S.; Agnelli, S.; Remesar, X.; Alemany, M.; Fernández-López, J.A. White adipose tissue urea cycle activity is not affected by one-month treatment with a hyperlipidic diet in female rats. Food Funct. 2016, 7, 1554–1563. [Google Scholar] [CrossRef]
- Cahill, G.F.; Owen, O.E. Body fuels and starvation. Int. Psychiatry Clin. 1970, 7, 25–36. [Google Scholar]
- Morrison, C.D.; Hill, C.M.; DuVall, M.A.; Coulter, C.E.; Gosey, J.L.; Herrera, M.J.; Maisano, L.E.; Sikaffy, H.X.; McDougal, D.H. Consuming a ketogenic diet leads to altered hypoglycemic counter-regulation in mice. J. Diabetes Its Complicat. 2020, 34, 107557. [Google Scholar] [CrossRef]
- Sjödin, A.; Hellström, F.; Sehlstedt, E.C.; Svensson, M.; Buren, J. Effects of a ketogenic diet on muscle fatigue in healthy, young, normal-weight women: A randomized controlled feeding trial. Nutrients 2020, 12, 955. [Google Scholar] [CrossRef]
- O’Neill, B.; Raggi, P. The ketogenic diet: Pros and cons. Atherosclerosis 2020, 292, 119–126. [Google Scholar] [CrossRef]
- Qi, X.; Tester, R.F. The ‘epileptic diet’- ketogenic and/or slow release of glucose intervention: A review. Clin. Nutr. 2020, 39, 1324–1330. [Google Scholar] [CrossRef]
- Goldberg, E.L.; Shchukina, I.; Asher, J.L.; Sidorov, S.; Artyomov, M.N.; Dixit, V.D. Ketogenesis activates metabolically protective gdT cells in visceral adipose tissue. Nat. Metab. 2020, 2, 50–61. [Google Scholar] [CrossRef] [PubMed]
- Wooley, S.C.; Garner, D.M. Dietary treatments for obesity are ineffective. Br. Med. J. 1994, 309, 655–656. [Google Scholar] [CrossRef]
- Yoshioka, M.; Doucet, E.; St Pierre, S.; Alméras, N.; Richard, D.; Labrie, A.; Després, J.P.; Bouchard, C.; Tremblay, A. Impact of high-intensity exercise on energy expenditure, lipid oxidation and body fatness. Int. J. Obes. 2001, 25, 332–339. [Google Scholar] [CrossRef] [PubMed]
- Colley, R.C.; Hills, A.P.; King, N.A.; Byrne, N.M. Exercise-induced energy expenditure: Implications for exercise prescription and obesity. Patient Educ. Couns. 2010, 79, 327–332. [Google Scholar] [CrossRef] [PubMed]
- Forhan, M.; Gill, S.V. Obesity, functional mobility and quality of life. Best Pract. Res. Clin. Endocrinol. Metab. 2013, 27, 129–137. [Google Scholar] [CrossRef] [PubMed]
- da Costa Machado, A.; Coelho Barbosa, T.; Robson Kluser Sales, A.; Nogueira de Souza, M.; Lucas da Nobrega, A.C.; Moreira Silva, B. Adults with initial metabolic syndrome have altered muscle deoxygenation during incremental exercise. Obesity 2017, 25, 424–431. [Google Scholar] [CrossRef]
- Lyerly, G.W.; Sui, X.M.; Church, T.S.; Lavie, C.J.; Hand, G.A.; Blair, S.N. Maximal exercise electrocardiographic responses and coronary heart disease mortality among men with metabolic syndrome. Mayo Clin. Proc. 2010, 85, 239–246. [Google Scholar] [CrossRef]
- Sato, Y. Physical exercise improves low cardiorespiratory fitness associated with intramyocellular lipids in patients with metabolic syndrome. Hypertens. Res. 2011, 34, 991–993. [Google Scholar] [CrossRef]
- Heiston, E.M.; Eichner, N.Z.; Gilbertson, N.M.; Malin, S.K. Exercise improves adiposopathy, insulin sensitivity and metabolic syndrome severity independent of intensity. Exp. Physiol. 2020, 105, 632–640. [Google Scholar] [CrossRef]
- Stefater, M.A.; Kohli, R.; Inge, T.H. Advances in the surgical treatment of morbid obesity. Mol. Asp. Med. 2013, 34, 84–94. [Google Scholar] [CrossRef]
- Polymeris, A. The pluses and minuses of bariatric surgery for morbid obesity: An endocrinological perspective. Hormones 2012, 11, 233–240. [Google Scholar] [CrossRef] [PubMed]
- Athyros, V.G.; Tziomalos, K.; Karagiannis, A.; Mikhailidis, D.P. Cardiovascular benefits of bariatric surgery in morbidly obese patients. Obes. Rev. 2011, 12, 515–524. [Google Scholar] [CrossRef]
- Gu, D.; He, J.; Duan, X.; Reynolds, K.; Wu, X.; Chen, J.; Huang, G.; Chen, C.-S.; Whelton, P.K. Body weight and mortality among men and women in China. J. Am. Med. Assoc. 2006, 295, 776–783. [Google Scholar] [CrossRef] [PubMed]
- Allison, D.B.; Faith, M.S.; Heo, M.; Kotler, D.P. Hypothesis concerning the U-shaped relation between body mass index and mortality. Am. J. Epidemiol. 1997, 146, 339–349. [Google Scholar] [CrossRef]
- Curtis, J.P.; Selter, J.G.; Wang, Y.F.; Rathore, S.S.; Jovin, I.S.; Jadbabaie, F.; Kosiborod, M.; Portnay, E.L.; Sokol, S.I.; Bader, F.; et al. The obesity paradox. Body mass index and outcomes in patients with heart failure. Arch. Intern. Med. 2005, 165, 55–61. [Google Scholar] [CrossRef] [PubMed]
- Donini, L.M.; Pinto, A.; Giusti, A.M.; Lenzi, A.; Poggiogalle, E. Obesity or BMI paradox? Beneath the tip of the iceberg. Front. Nutr. 2020, 7, 53. [Google Scholar] [CrossRef]
- Després, J.P. What is “metabolically healthy obesity”?: From epidemiology to pathophysiological insights. J. Clin. Endocrinol. Metab. 2012, 97, 2283–2285. [Google Scholar] [CrossRef]
- Mustafina, S.V.; Vinter, D.A.; Shcherbakova, L.V.; Malyutina, S.K.; Ragino, Y.I.; Rymar, O.D. Gender and age related features of metabolically healthy obesity phenotype prevalence. Byulleten Sib. Meditsiny Bull. Sib. Med. 2020, 19, 76–84. [Google Scholar] [CrossRef]
- Larqué, C.; Velasco, M.; Navarro-Tableros, V.; Duhne, M.; Aguirre, J.; Gutiérrez-Reyes, G.; Moreno, J.; Robles-Diaz, G.; Hong, E.; Hiriart, M. Early endocrine and molecular changes in metabolic syndrome models. IUBMB Life 2011, 63, 831–839. [Google Scholar] [CrossRef]
- Mielke, J.G.; Nicolitch, K.; Avellaneda, V.; Earlam, K.; Ahuja, T.; Mealing, G.; Messier, C. Longitudinal study of the effects of a high-fat diet on glucose regulation, hippocampal function, and cerebral insulin sensitivity in C57BL/6 mice. Behav. Brain Res. 2006, 175, 374–382. [Google Scholar] [CrossRef] [PubMed]
- Kuo, T.; McQueen, A.; Chen, T.C.; Wang, J.C. Regulation of glucose homeostasis by glucocorticoids. Adv. Exp. Med. Biol. 2015, 872, 99–126. [Google Scholar] [CrossRef]
- May, R.C.; Bailey, J.L.; Mitch, W.E.; Masud, T.; England, B.K. Glucocorticoids and acidosis stimulate protein and amino acid catabolism in vivo. Kidney Int. 1996, 49, 679–683. [Google Scholar] [CrossRef]
- Okun, J.G.; Conway, S.; Schmidt, K.V.; Schumacher, J.; Wang, X.Y.; de Guia, R.; Zota, A.; Klement, J.; Seibert, O.; Peters, A.; et al. Molecular regulation of urea cycle function by the liver glucocorticoid receptor. Mol. Metab. 2015, 4, 732–740. [Google Scholar] [CrossRef] [PubMed]
- Pal, M.; Khan, J.; Kumar, R.; Surolia, A.; Gupta, S. Testosterone supplementation improves insulin responsiveness in HFD fed male T2DM mice and potentiates insulin signaling in the skeletal muscle and C2C12 myocyte cell line. PLoS ONE 2019, 14, e0224162. [Google Scholar] [CrossRef] [PubMed]
- Alemany, M. Do the interactions between glucocorticoids and sex hormones regulate the development of the metabolic syndrome? Front. Endocrinol. 2012, 3, 27. [Google Scholar] [CrossRef]
- Gong, H.; Jarzynka, M.J.; Cole, T.J.; Lee, J.H.; Wada, T.; Zhang, B.; Gao, J.; Song, W.C.; Defranco, D.B.; Cheng, S.Y.; et al. Glucocorticoids antagonize estrogens by glucocorticoid receptor-mediated activation of estrogen sulfotransferase. Cancer Res. 2008, 68, 7386–7393. [Google Scholar] [CrossRef] [PubMed]
- Oliva, L.; Alemany, M.; Fernández-López, J.A.; Remesar, X. Estradiol determine liver lipid deposition in rats fed standard diets unbalanced with excess lipid or protein. Chemrxiv 2020. [Google Scholar] [CrossRef]
- Schubert, C.; Raparelli, V.; Westphal, C.; Dworatzek, E.; Petrov, G.; Kararigas, G.; Regitz-Zagrosek, V. Reduction of apoptosis and preservation of mitochondrial integrity under ischemia/reperfusion injury is mediated by estrogen receptor beta. Biol. Sex Differ. 2016, 7, 53. [Google Scholar] [CrossRef]
- Klinge, C.M. Estrogenic control of mitochondrial function. Redox Biol. 2020, 31, 101435. [Google Scholar] [CrossRef]
- Zhu, L.; Brown, W.C.; Cai, Q.; Krust, A.; Chambon, P.; McGuinness, O.P.; Stafford, J.M. Estrogen treatment after ovariectomy protects against fatty liver and may improve pathway-selective insulin resistance. Diabetes 2013, 62, 424–434. [Google Scholar] [CrossRef]
- Vilà, R.; Cabot, C.; Villarreal, L.; Monegal, A.; Ayet, E.; Romero, M.M.; Grasa, M.M.; Esteve, M.; Fernández-López, J.A.; Remesar, X.; et al. Oleoyl-estrone is a precursor of an estrone-derived ponderostat signal. J. Steroid Biochem. Mol. Biol. 2011, 124, 99–111. [Google Scholar] [CrossRef] [PubMed][Green Version]
- Remesar, X.; Fernández-López, J.A.; Alemany, M. Oleoyl-estrone. Med. Res. Rev. 2012, 32, 1263–1291. [Google Scholar] [CrossRef]
- Sanchis, D.; Balada, F.; Picó, C.; Grasa, M.M.; Virgili, J.; Farrerons, C.; Palou, A.; Fernández-López, J.A.; Remesar, X.; Alemany, M. Rats receiving the slimming agent oleoyl-estrone in liposomes (Merlin-2) decrease food intake but maintain thermogenesis. Arch. Physiol. Biochem. 1997, 105, 663–672. [Google Scholar] [CrossRef]
- Hevener, A.L.; Clegg, D.J.; Mauvais-Jarvis, F. Impaired estrogen receptor action in the pathogenesis of the metabolic syndrome. Mol. Cell. Endocrinol. 2015, 418, 306–321. [Google Scholar] [CrossRef] [PubMed]
- Buniam, J.; Chukijrungroat, N.; Khamphaya, T.; Weerachayaphorn, J.; Saengsirisuwan, V. Estrogen and voluntary exercise attenuate cardiometabolic syndrome and hepatic steatosis in ovariectomized rats fed a high-fat high-fructose diet. Am. J. Physiol. 2019, 316, E908–E921. [Google Scholar] [CrossRef] [PubMed]
- Groti, K.; Žuran, I.; Antonič, B.; Foršnarič, L.; Pfeifer, M. The impact of testosterone replacement therapy on glycemic control, vascular function, and components of the metabolic syndrome in obese hypogonadal men with type 2 diabetes. Aging Male 2018, 21, 158–169. [Google Scholar] [CrossRef]
- Shigehara, K.; Konaka, H.; Kato, Y.; Iijima, M.; Nakashima, K.; Kawaguchi, S.; Nohara, T.; Izumi, K.; Namiki, M.; Mizokami, A. Effect of testosterone replacement therapy on sexual function and glycemic control among hypogonadal men with type 2 diabetes mellitus. Int. J. Impot. Res. 2019, 31, 25–30. [Google Scholar] [CrossRef]
- Alexandersen, P.; Christiansen, C. The aging male: Testosterone deficiency and testosterone replacement. An up-date. Atherosclerosis 2004, 173, 157–169. [Google Scholar] [CrossRef]
- Hackett, G. Metabolic effects of testosterone therapy in men with type 2 diabetes and metabolic syndrome. Sex. Med. Rev. 2019, 7, 476–490. [Google Scholar] [CrossRef]
- Mauvais-Jarvis, F.; Clegg, D.J.; Hevener, A.L. The role of estrogens in control of energy balance and glucose homeostasis. Endocr. Rev. 2013, 34, 309–338. [Google Scholar] [CrossRef]
- Xu, Y.; Lopez, M. Central regulation of energy metabolism by estrogens. Mol. Metab. 2018, 15, 104–115. [Google Scholar] [CrossRef]
- Al-Rawaf, H.A. Circulating microRNAs and adipokines as markers of metabolic syndrome in adolescents with obesity. Clin. Nutr. 2019, 38, 2231–2238. [Google Scholar] [CrossRef] [PubMed]
- Gathercole, L.L.; Morgan, S.A.; Bujalska, I.J.; Hauton, D.; Stewart, P.M.; Tomlinson, J.W. Regulation of lipogenesis by glucocorticoids and insulin in human adipose tissue. PLoS ONE 2011, 6, e26223. [Google Scholar] [CrossRef]
- Asensio, C.; Muzzin, P.; Rohner-Jeanrenaud, F. Role of glucocorticoids in the physiopathology of excessive fat deposition and insulin resistance. Int. J. Obes. 2004, 28, S45–S52. [Google Scholar] [CrossRef] [PubMed]
- Griggs, R.C.; Kingston, W.; Jozefowicz, R.F.; Herr, B.E.; Forbes, G.; Halliday, D. Effect of testosterone on muscle mass and muscle protein synthesis. J. Appl. Physiol. 1989, 66, 498–503. [Google Scholar] [CrossRef]
- Urban, R.J.; Bodenburg, Y.H.; Gilkison, C.; Foxworth, J.; Coggan, A.R.; Wolfe, R.R.; Ferrando, A. Testosterone administration to elderly men increases skeletal muscle strength and protein synthesis. Am. J. Physiol. 1995, 269, E820–E826. [Google Scholar] [CrossRef] [PubMed]
- Maher, A.C.; Akhtar, M.; Tarnopolsky, M.A. Men supplemented with 17b-estradiol have increased beta-oxidation capacity in skeletal muscle. Physiol. Genom. 2010, 42, 342–347. [Google Scholar] [CrossRef]
- Dakin, R.S.; Walker, B.R.; Seckl, J.R.; Hadoke, P.W.F.; Drake, A.J. Estrogens protect male mice from obesity complications and influence glucocorticoid metabolism. Int. J. Obes. 2015, 39, 1539–1547. [Google Scholar] [CrossRef]
- James, W.P.T.; Johnson, R.J.; Speakman, J.R.; Wallace, D.C.; Fruhbeck, G.; Iversen, P.O.; Stover, P.J. Nutrition and its role in human evolution. J. Intern. Med. 2019, 285, 533–549. [Google Scholar] [CrossRef]
- Eaton, S.B. Humans, lipids and evolution. Lipids 1992, 27, 814–820. [Google Scholar] [CrossRef]
- Baltic, M.Z.; Boskovic, M. When man met meat: Meat in human nutrition from ancient times till today. Procedia Food Sci. 2015, 5, 6–9. [Google Scholar] [CrossRef]
- Eaton, S.B.; Konner, M. Palaeolithic nutrition. A consideration of its nature and current implications. N. Engl. J. Med. 1985, 312, 283–289. [Google Scholar] [CrossRef]
- Sistiaga, A.; Mallol, C.; Galván, B.; Summons, R.E. The Neanderthal meal: A new perspective using faecal biomarkers. PLoS ONE 2014, 9, e101045. [Google Scholar] [CrossRef] [PubMed]
- Manoogian, E.N.; Panda, S. Circadian rhythms, time-restricted feeding, and healthy aging. Ageing Res. Rev. 2017, 39, 59–67. [Google Scholar] [CrossRef] [PubMed]
- Bellisari, A. Evolutionary origins of obesity. Obes. Rev. 2008, 9, 165–180. [Google Scholar] [CrossRef]
- Westerterp-Plantenga, M.S. Protein intake and energy balance. Regul. Pept. 2008, 149, 67–69. [Google Scholar] [CrossRef] [PubMed]
- Wu, G.; Wu, Z.; Dai, Z.; Yang, Y.; Wang, W.; Liu, C.; Wang, B.; Wang, J.; Yin, Y. Dietary requirements of “nutritionally non-essential amino acids” by animals and humans. Amino Acids 2013, 44, 1107–1113. [Google Scholar] [CrossRef] [PubMed]
- Reeds, P.J. Dispensable and indispensable amino acids for humans. J. Nutr. 2000, 130, 1835S–1840S. [Google Scholar] [CrossRef]
- Parry, S.A.; Woods, R.M.; Hodson, L.; Hulston, C.J. A single day of excessive dietary fat intake reduces whole-body insulin sensitivity: The metabolic consequence of binge eating. Nutrients 2017, 9, 818. [Google Scholar] [CrossRef]
- Norgan, N.G.; Durnin, J.V.G.A. The effect of six weeks of overfeeding on the body weight, body composition, and energy metabolism of young men. Am. J. Clin. Nutr. 1980, 33, 978–988. [Google Scholar] [CrossRef]
- Hamilton, W.J.; Busse, C.D. Primate carnivory and its significance to human diets. BioScience 1978, 28, 761–766. [Google Scholar] [CrossRef]
- Jarman, C.L.; Larsen, T.; Hunt, T.; Lipo, C.; Solsvik, R.; Wallsgrove, N.; Ka’apu-Lyons, C.; Close, H.G.; Popp, B.N. Diet of the prehistoric population of Rapa Nui (Easter Island, Chile) shows environmental adaptation and resilience. Am. J. Phys. Anthropol. 2017, 164, 343–361. [Google Scholar] [CrossRef]
- Stover, P.J.; James, W.P.T.; Krook, A.; Garza, C. Emerging concepts on the role of epigenetics in the relationships between nutrition and health. J. Intern. Med. 2018, 284, 37–49. [Google Scholar] [CrossRef] [PubMed]
- Cameron, A.J.; Shaw, J.E.; Zimmet, P.Z. The metabolic syndrome: Prevalence in worldwide populations. Endocrinol. Metab. Clin. N. Am. 2004, 33, 351–375. [Google Scholar] [CrossRef]
- Wolfe, N.D.; Dunavan, C.P.; Diamond, J. Origins of major human infectious diseases. Nature 2007, 447, 279–283. [Google Scholar] [CrossRef] [PubMed]
- Finch, C.E. Evolution of the human lifespan and diseases of aging: Roles of infection, inflammation, and nutrition. Proc. Natl. Acad. Sci. USA 2010, 107, 1718–1724. [Google Scholar] [CrossRef] [PubMed]
- Harper, S.; Howse, K. An upper limit to human longevity? J. Popul. Ageing 2008, 1, 99–106. [Google Scholar] [CrossRef]
- Westman, E.C. Is dietary carbohydrate essential for human nutrition? Am. J. Clin. Nutr. 2002, 75, 951–953. [Google Scholar] [CrossRef]
- Tsintzas, K.; Jones, R.; Pabla, P.; Mallinson, J.; Barrett, D.A.; Kim, D.H.; Cooper, S.; Davies, A.; Taylor, T.; Chee, C.; et al. Effect of acute and short-term dietary fat ingestion on postprandial skeletal muscle protein synthesis rates in middle-aged, overweight, and obese men. Am. J. Physiol. 2020, 318, E417–E429. [Google Scholar] [CrossRef]
- Khan, A.S.; Keast, R.; Khan, N.A. Preference for dietary fat: From detection to disease. Prog. Lipid Res. 2020, 78, 101032. [Google Scholar] [CrossRef]
- Jacquet, P.; Schutz, Y.; Montani, J.P.; Dulloo, A. How dieting might make some fatter: Modeling weight cycling toward obesity from a perspective of body composition autoregulation. Int. J. Obes. 2020, 44, 1243–1253. [Google Scholar] [CrossRef] [PubMed]
- Teixeira de Oliveira, D.; da Costa Fernandes, I.; Galdino de Sousa, G.; Pereira dos Santos, T.A.; Nogueira de Paiva, N.C.; Martins Carneiro, C.; Evangelista, E.A.; Rocha Barboza, N.; Guerra-Sá, R. High-sugar diet leads to obesity and metabolic diseases in ad libitum-fed rats irrespective of caloric intake. Arch. Endocrinol. Metab. 2020, 64, 71–81. [Google Scholar] [CrossRef]
- Mariotti, F.; Gardner, C.D. Adéquation de l’apport en protéines et acides aminés dans les régimes végétariens [Protein and amino acids adequacy in vegetarian diets]. Cah. Nutr. Diététique 2020, 55, 66–81. [Google Scholar] [CrossRef]
- Foster, G.D.; Wyatt, H.R.; Hill, J.O.; McGuckin, B.G.; Brill, C.; Mohammed, B.S.; Szapary, P.O.; Rader, D.J.; Edman, J.S.; Klein, S. A randomized trial of a low-carbohydrate diet for obesity. N. Engl. J. Med. 2003, 348, 2082–2090. [Google Scholar] [CrossRef] [PubMed]
- Westman, E.C.; Mavropoulos, J.; Yancy, W.S.; Volek, J.S. A review of low-carbohydrate ketogenic diets. Curr. Atheroscler. Rep. 2003, 5, 476–483. [Google Scholar] [CrossRef] [PubMed]
- Pérez-Jiménez, F.; López-Miranda, J.; Pinillos, M.D.; Gómez, P.; Paz-Rojas, E.; Montilla, P.; Marín, C.; Velasco, M.J.; Blanco-Molina, A.; Jiménez Perepérez, J.A.; et al. A Mediterranean and a high-carbohydrate diet improve glucose metabolism in healthy young persons. Diabetologia 2001, 44, 2038–2043. [Google Scholar] [CrossRef] [PubMed]
- Schugar, R.C.; Crawford, P.A. Low-carbohydrate ketogenic diets, glucose homeostasis, and nonalcoholic fatty liver disease. Curr. Opin. Clin. Nutr. Metab. Care 2012, 15, 374–380. [Google Scholar] [CrossRef] [PubMed]
- Wood, R.J.; Volek, J.S.; Davis, S.R.; dell’Ova, C.; Fernández, M.L. Effects of a carbohydrate-restricted diet on emerging plasma markers for cardiovascular disease. Nutr. Metab. 2006, 3, 19. [Google Scholar] [CrossRef]
- Snorgaard, O.; Poulsen, G.M.; Andersen, H.K.; Astrup, A. Systematic review and meta-analysis of dietary carbohydrate restriction in patients with type 2 diabetes. BMJ Open Diabetes Res. Care 2017, 5, e000354. [Google Scholar] [CrossRef] [PubMed]
- Alemany, M. Concepto de dieta mediterránea: ¿un grupo de alimentos saludables, una dieta o una panacea publicitaria? [The mediterranean diet: A group of healthy foods, a type of diet, or an advertising panacea]. Med. Clin. Barc. 2011, 136, 594–599. [Google Scholar] [CrossRef]
- Ballesteros, J.-M.; Struijk, E.A.; Rodríguez-Artalejo, F.; López-García, E. Mediterranean diet and risk of falling in community-dwelling older adults. Clin. Nutr. 2020, 39, 276–281. [Google Scholar] [CrossRef] [PubMed]
- Sánchez-Sánchez, M.L.; García-Vigara, A.; Hidalgo-Mora, J.J.; García-Pérez, M.-Á.; Tarín, J.; Cano, A. Mediterranean diet and health: A systematic review of epidemiological studies and intervention trials. Maturitas 2020, 136, 25–37. [Google Scholar] [CrossRef] [PubMed]


Publisher’s Note: MDPI stays neutral with regard to jurisdictional claims in published maps and institutional affiliations. |
© 2020 by the authors. Licensee MDPI, Basel, Switzerland. This article is an open access article distributed under the terms and conditions of the Creative Commons Attribution (CC BY) license (http://creativecommons.org/licenses/by/4.0/).