Non-Muscle-Invasive Bladder Carcinoma with Respect to Basal Versus Luminal Keratin Expression


Abstract

1. Introduction
2. Results
2.1. Patient Characteristics
2.2. Differentially Expressed Genes
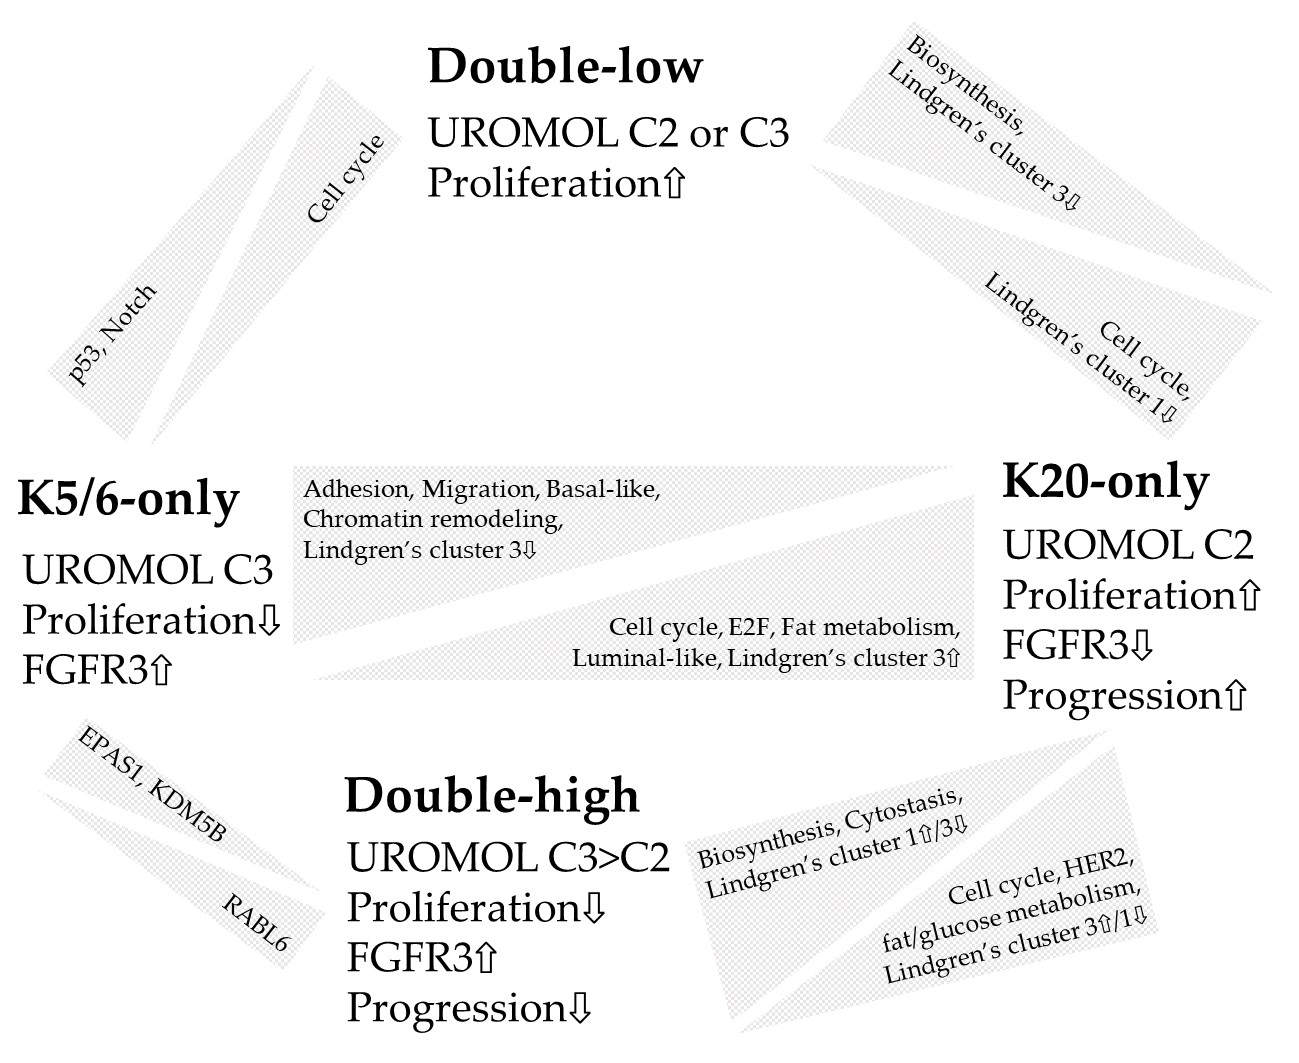
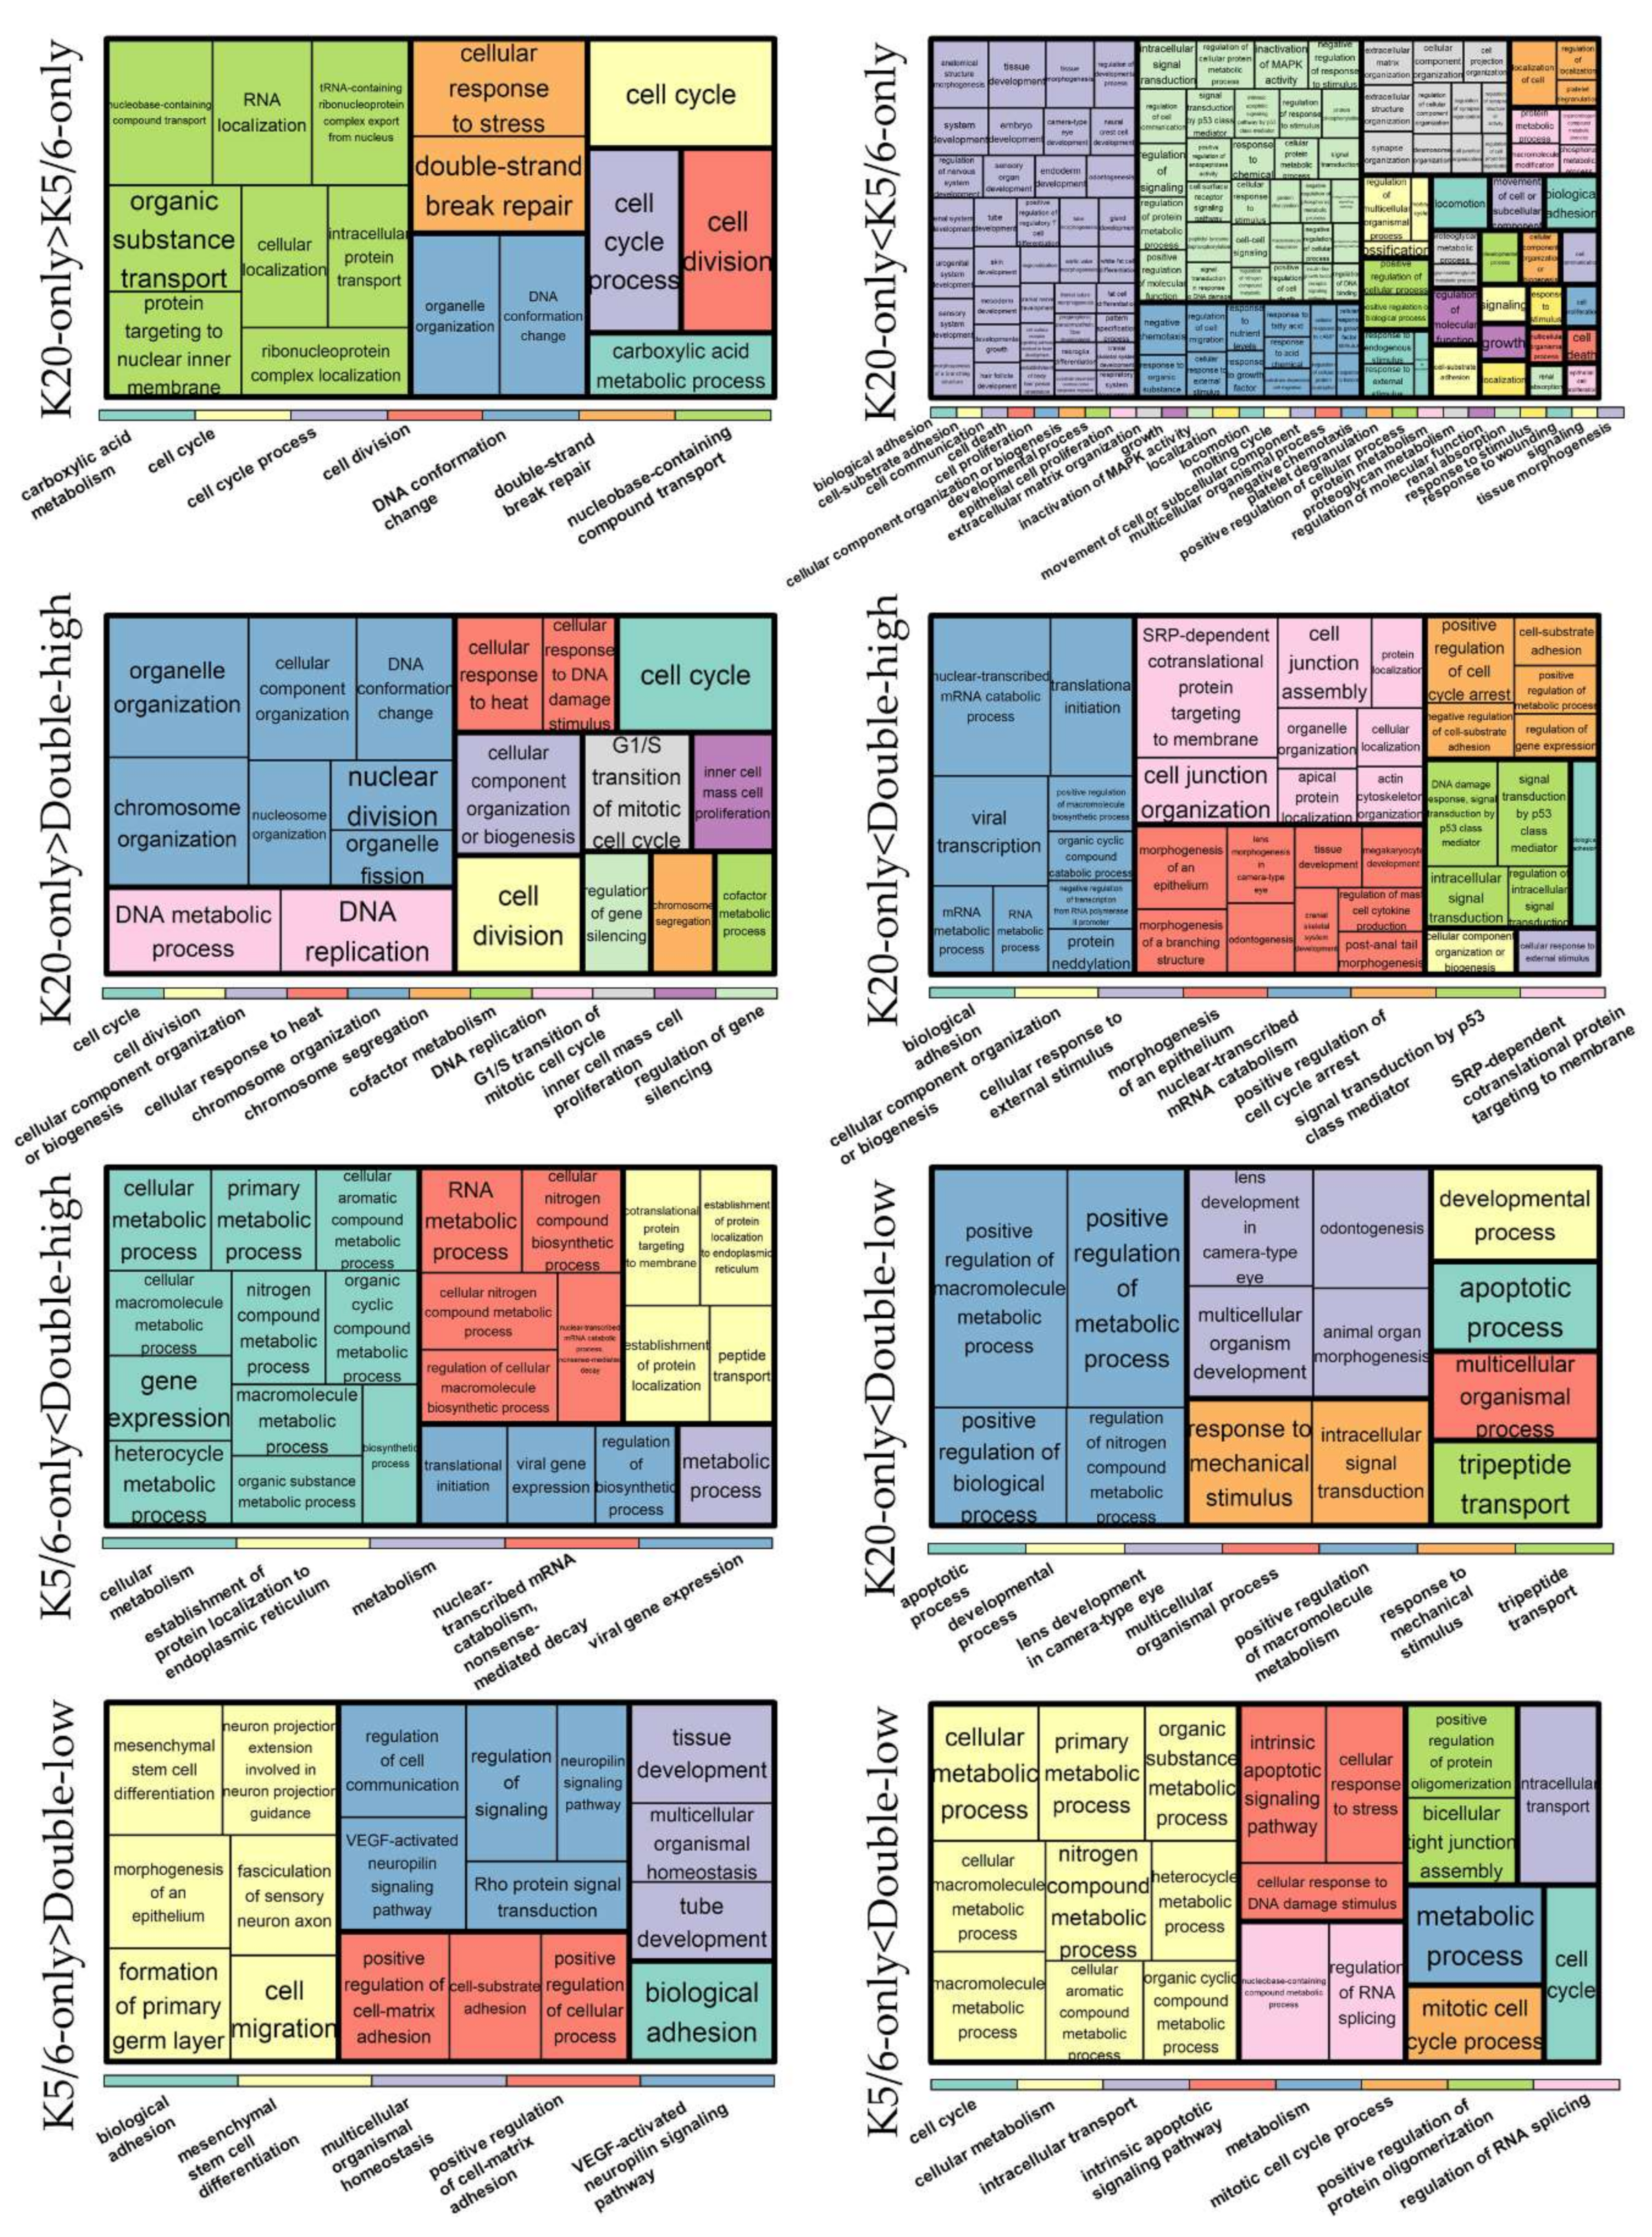
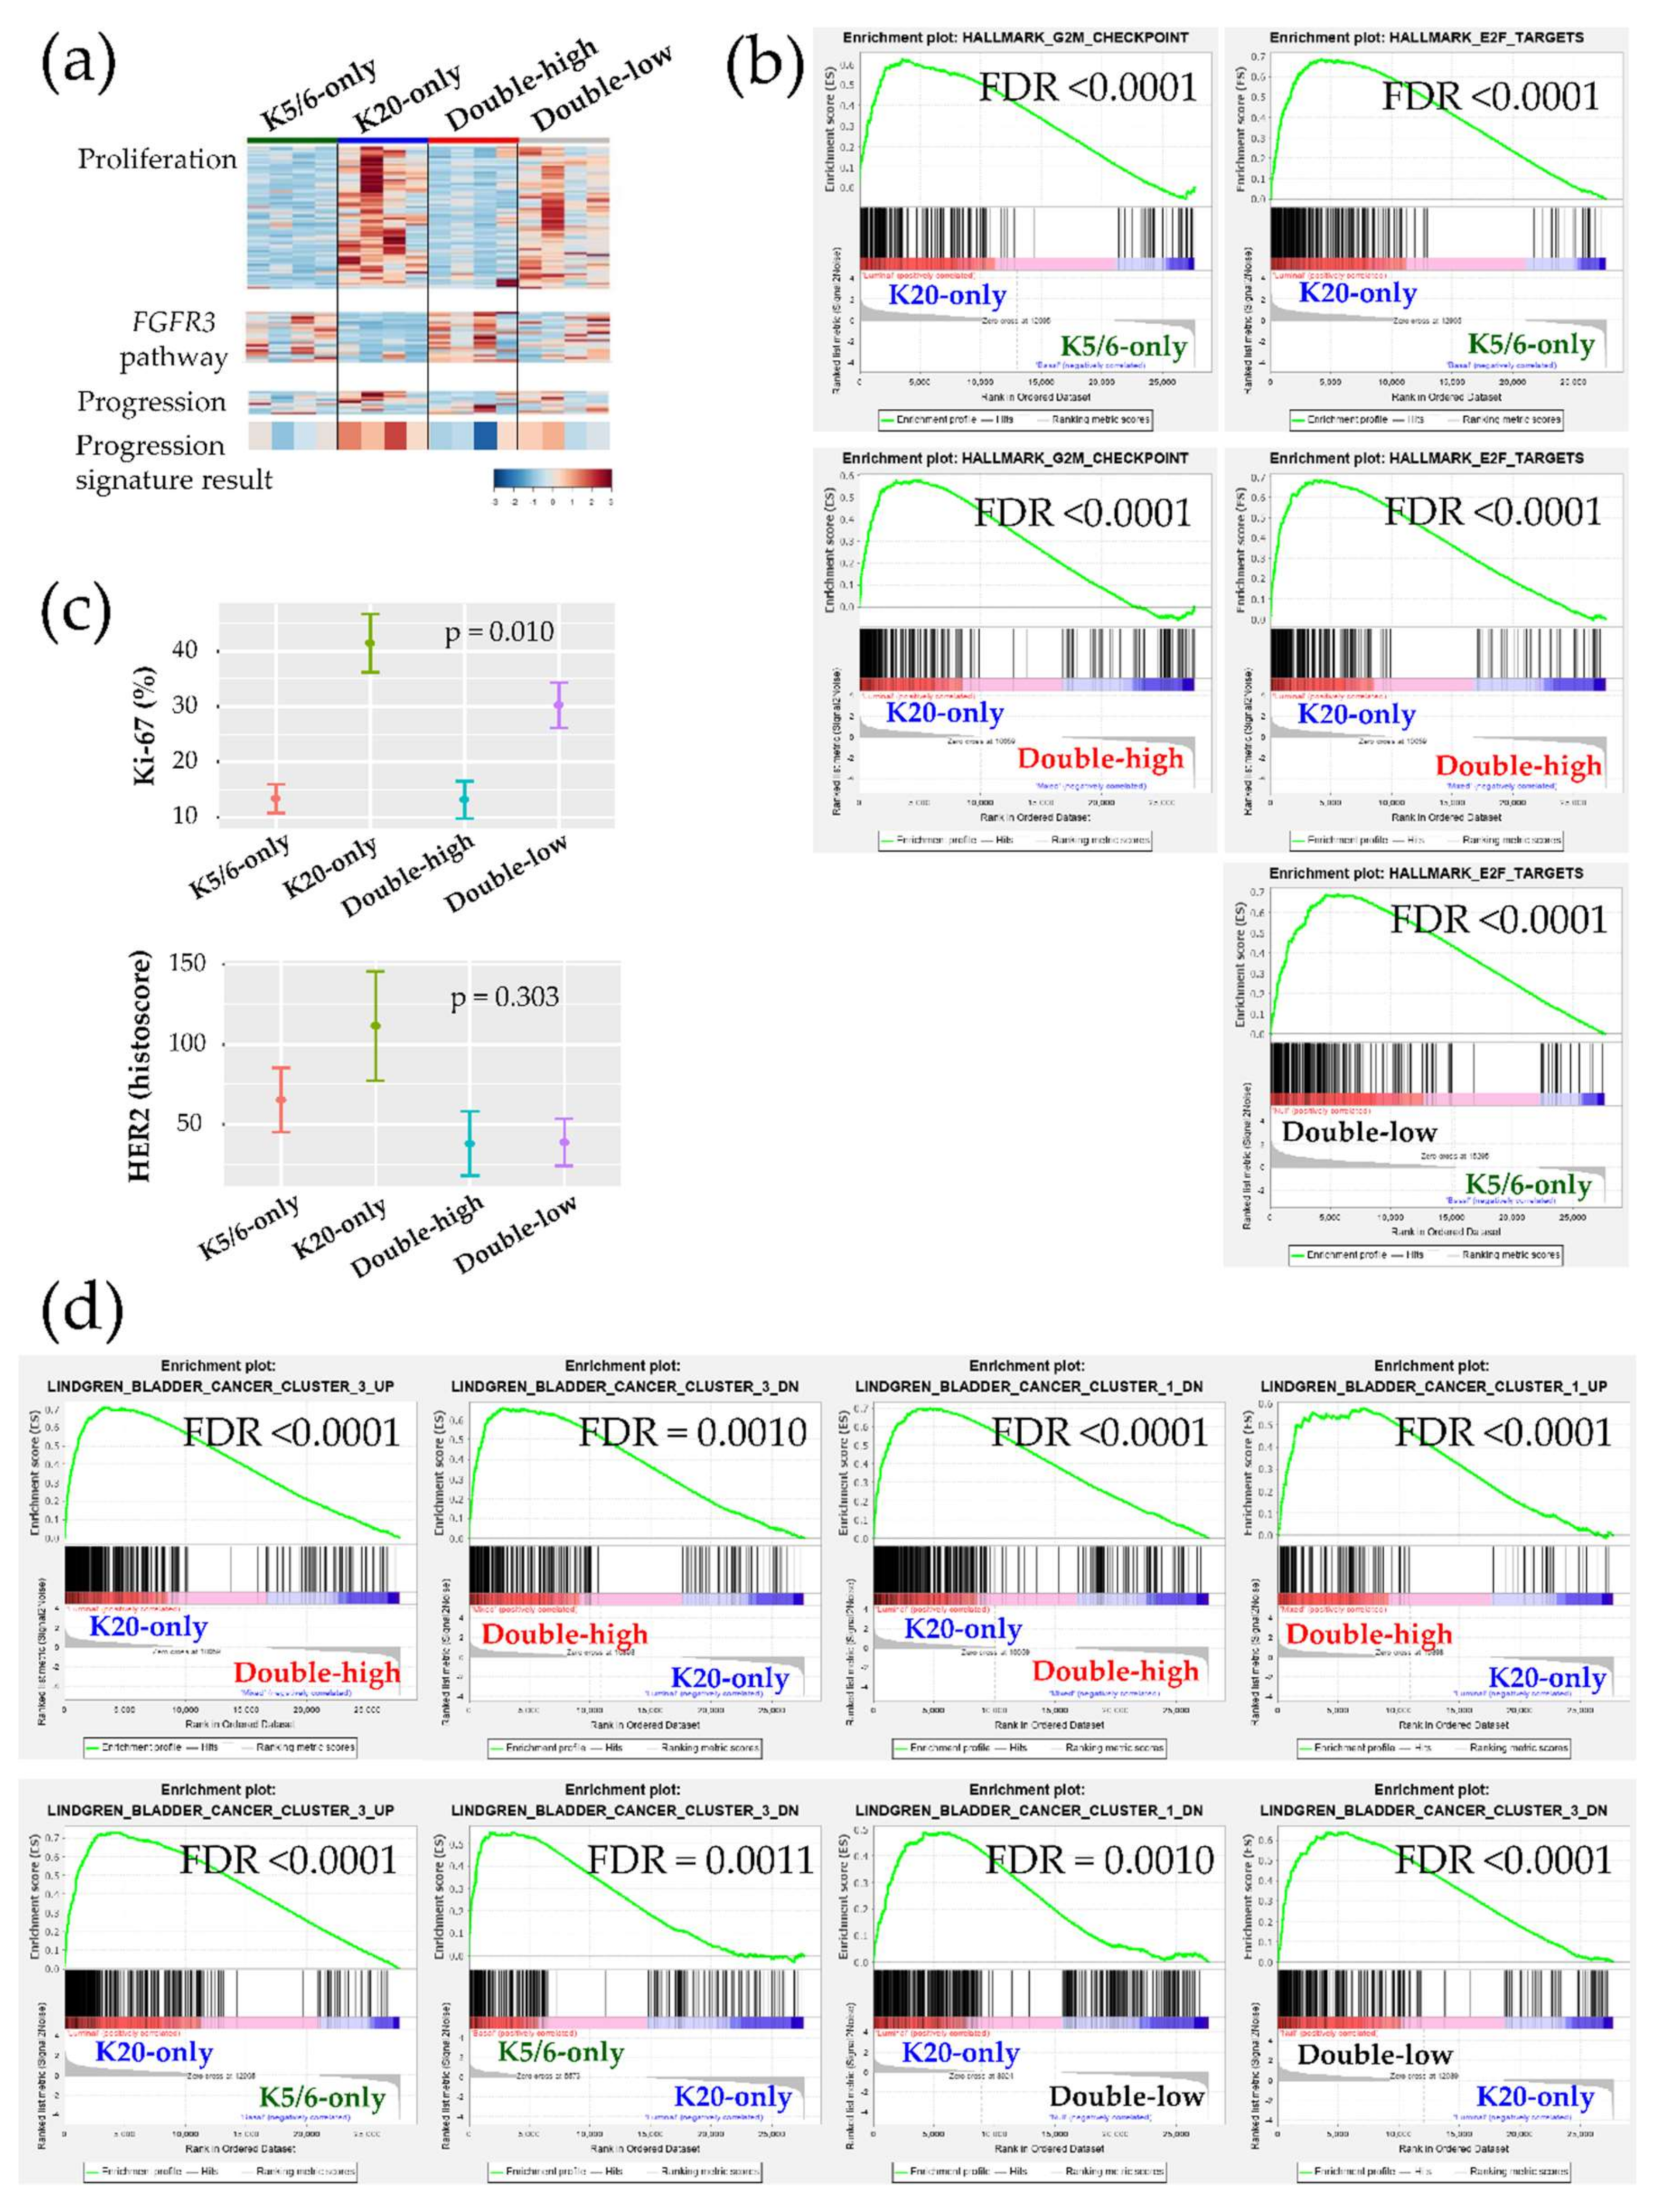
2.3. Ingenuity Pathway Analysis and Gene Set Enrichment Analysis
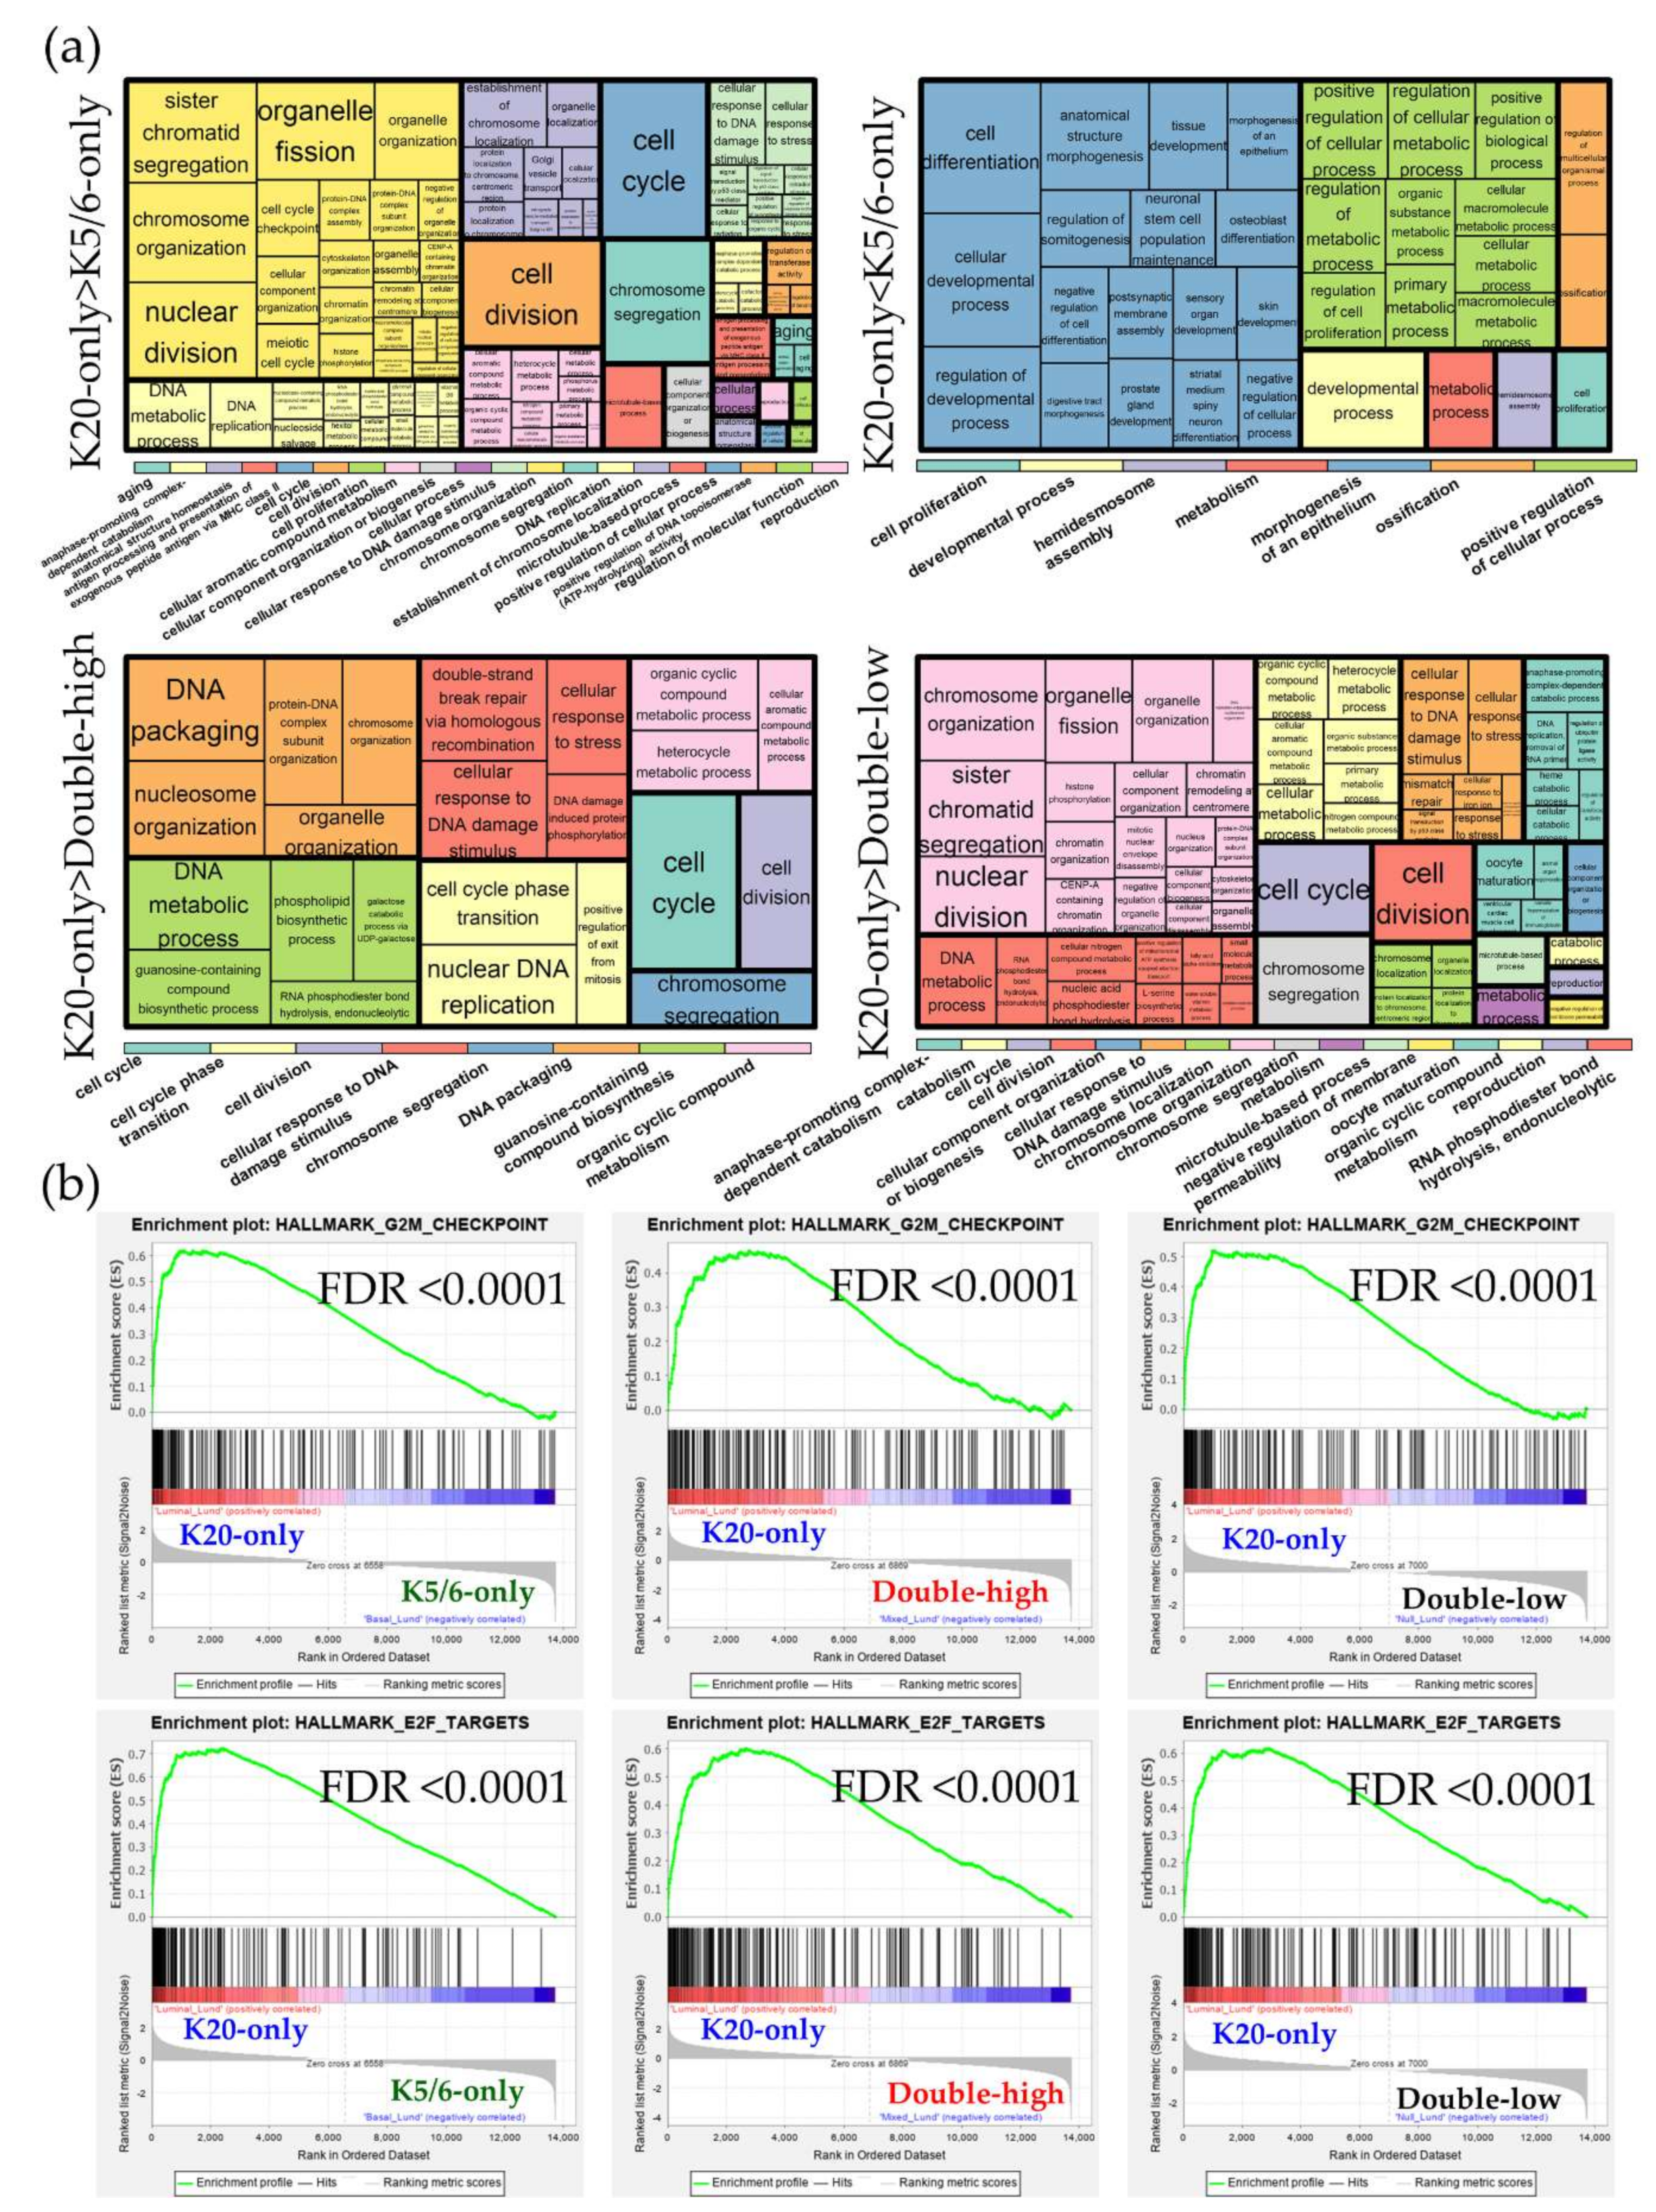
2.4. Validation Using the Public Gene-Expression Dataset
3. Discussion
4. Materials and Methods
4.1. Specimen Selection for RNA Sequencing Using Immunohistochemical Staining for K5/6 and K20
4.2. RNA Sequencing
4.3. Differentially Expressed Genes and Functional Analyses
4.4. Statistical Analysis
5. Conclusions
Supplementary Materials
Author Contributions
Funding
Conflicts of Interest
Abbreviations
| NMIBC | Non-muscle-invasive bladder cancer |
| MIBC | Muscle-invasive bladder cancer |
| IHC | Immunohistochemical |
| NMIUTUC | Non-muscle-invasive upper tract urothelial carcinoma |
| MAPK | Mitogen-activated protein kinase |
| DEG | Differentially expressed gene |
| GO | Gene ontology |
| KEGG | Kyoto Encyclopedia of Genes and Genomes |
| IPA | Ingenuity Pathway Analysis |
| GSEA | Gene Set Enrichment Analysis |
| FDR | False discovery rate |
References
- Antoni, S.; Ferlay, J.; Soerjomataram, I.; Znaor, A.; Jemal, A.; Bray, F. Bladder cancer incidence and mortality: A global overview and recent trends. Eur. Urol. 2017, 71, 96–108. [Google Scholar] [CrossRef] [PubMed]
- Babjuk, M.; Burger, M.; Comperat, E.M.; Gontero, P.; Mostafid, A.H.; Palou, J.; Van Rhijn, B.W.G.; Roupret, M.; Shariat, S.F.; Sylvester, R.; et al. European Association of Urology guidelines on non-muscle-invasive bladder cancer (TaT1 and carcinoma in situ)—2019 update. Eur. Urol. 2019, 76, 639–657. [Google Scholar] [CrossRef] [PubMed]
- Chang, S.S.; Boorjian, S.A.; Chou, R.; Clark, P.E.; Daneshmand, S.; Konety, B.R.; Pruthi, R.; Quale, D.Z.; Ritch, C.R.; Seigne, J.D.; et al. Diagnosis and treatment of non-muscle invasive bladder cancer: AUA/SUO guideline. J. Urol. 2016, 196, 1021–1029. [Google Scholar] [CrossRef] [PubMed]
- Sjodahl, G.; Eriksson, P.; Patschan, O.; Marzouka, N.A.; Jakobsson, L.; Bernardo, C.; Lovgren, K.; Chebil, G.; Zwarthoff, E.; Liedberg, F.; et al. Molecular changes during progression from nonmuscle invasive to advanced urothelial carcinoma. Int. J. Cancer 2020, 146, 2636–2647. [Google Scholar] [CrossRef] [PubMed]
- Sjodahl, G.; Lauss, M.; Lovgren, K.; Chebil, G.; Gudjonsson, S.; Veerla, S.; Patschan, O.; Aine, M.; Ferno, M.; Ringner, M.; et al. A molecular taxonomy for urothelial carcinoma. Clin. Cancer Res. 2012, 18, 3377–3386. [Google Scholar] [CrossRef]
- Hedegaard, J.; Lamy, P.; Nordentoft, I.; Algaba, F.; Hoyer, S.; Ulhoi, B.P.; Vang, S.; Reinert, T.; Hermann, G.G.; Mogensen, K.; et al. Comprehensive transcriptional analysis of early-stage urothelial carcinoma. Cancer Cell 2016, 30, 27–42. [Google Scholar] [CrossRef]
- Hurst, C.D.; Alder, O.; Platt, F.M.; Droop, A.; Stead, L.F.; Burns, J.E.; Burghel, G.J.; Jain, S.; Klimczak, L.J.; Lindsay, H.; et al. Genomic subtypes of non-invasive bladder cancer with distinct metabolic profile and female gender bias in KDM6A mutation frequency. Cancer Cell 2017, 32, 701–715.e7. [Google Scholar] [CrossRef]
- Lindgren, D.; Liedberg, F.; Andersson, A.; Chebil, G.; Gudjonsson, S.; Borg, A.; Mansson, W.; Fioretos, T.; Hoglund, M. Molecular characterization of early-stage bladder carcinomas by expression profiles, FGFR3 mutation status, and loss of 9q. Oncogene 2006, 25, 2685–2696. [Google Scholar] [CrossRef][Green Version]
- Patschan, O.; Sjodahl, G.; Chebil, G.; Lovgren, K.; Lauss, M.; Gudjonsson, S.; Kollberg, P.; Eriksson, P.; Aine, M.; Mansson, W.; et al. A molecular pathologic framework for risk stratification of stage T1 urothelial carcinoma. Eur. Urol. 2015, 68, 824–832. [Google Scholar] [CrossRef]
- Breyer, J.; Wirtz, R.M.; Otto, W.; Erben, P.; Kriegmair, M.C.; Stoehr, R.; Eckstein, M.; Eidt, S.; Denzinger, S.; Burger, M.; et al. In stage pT1 non-muscle-invasive bladder cancer (NMIBC), high KRT20 and low KRT5 mRNA expression identify the luminal subtype and predict recurrence and survival. Virchows Arch. 2017, 470, 267–274. [Google Scholar] [CrossRef]
- Rebola, J.; Aguiar, P.; Blanca, A.; Montironi, R.; Cimadamore, A.; Cheng, L.; Henriques, V.; Lobato-Faria, P.; Lopez-Beltran, A. Predicting outcomes in non-muscle invasive (Ta/T1) bladder cancer: The role of molecular grade based on luminal/basal phenotype. Virchows Arch. 2019, 475, 445–455. [Google Scholar] [CrossRef] [PubMed]
- Jung, M.; Kim, B.; Moon, K.C. Immunohistochemistry of cytokeratin (CK) 5/6, CD44 and CK20 as prognostic biomarkers of non-muscle-invasive papillary upper tract urothelial carcinoma. Histopathology 2019, 74, 483–493. [Google Scholar] [CrossRef] [PubMed]
- Jung, M.; Lee, J.H.; Kim, B.; Park, J.H.; Moon, K.C. Transcriptional analysis of immunohistochemically defined subgroups of non-muscle-invasive papillary high-grade upper tract urothelial carcinoma. Int. J. Mol. Sci. 2019, 20, 570. [Google Scholar] [CrossRef] [PubMed]
- Lerner, S.P.; McConkey, D.J.; Hoadley, K.A.; Chan, K.S.; Kim, W.Y.; Radvanyi, F.; Hoglund, M.; Real, F.X. Bladder cancer molecular taxonomy: Summary from a consensus meeting. Bladder Cancer 2016, 2, 37–47. [Google Scholar] [CrossRef] [PubMed]
- Rosenberg, J.E.; Hoffman-Censits, J.; Powles, T.; Van der Heijden, M.S.; Balar, A.V.; Necchi, A.; Dawson, N.; O’Donnell, P.H.; Balmanoukian, A.; Loriot, Y.; et al. Atezolizumab in patients with locally advanced and metastatic urothelial carcinoma who have progressed following treatment with platinum-based chemotherapy: A single-arm, multicentre, phase 2 trial. Lancet 2016, 387, 1909–1920. [Google Scholar] [CrossRef]
- Seiler, R.; Ashab, H.A.D.; Erho, N.; Van Rhijn, B.W.G.; Winters, B.; Douglas, J.; Van Kessel, K.E.; Fransen van de Putte, E.E.; Sommerlad, M.; Wang, N.Q.; et al. Impact of molecular subtypes in muscle-invasive bladder cancer on predicting response and survival after neoadjuvant chemotherapy. Eur. Urol. 2017, 72, 544–554. [Google Scholar] [CrossRef]
- Sjodahl, G.; Lovgren, K.; Lauss, M.; Patschan, O.; Gudjonsson, S.; Chebil, G.; Aine, M.; Eriksson, P.; Mansson, W.; Lindgren, D.; et al. Toward a molecular pathologic classification of urothelial carcinoma. Am. J. Pathol. 2013, 183, 681–691. [Google Scholar] [CrossRef]
- Sjodahl, G.; Eriksson, P.; Liedberg, F.; Hoglund, M. Molecular classification of urothelial carcinoma: Global mRNA classification versus tumour-cell phenotype classification. J. Pathol. 2017, 242, 113–125. [Google Scholar] [CrossRef]
- Desai, S.; Lim, S.D.; Jimenez, R.E.; Chun, T.; Keane, T.E.; McKenney, J.K.; Zavala-Pompa, A.; Cohen, C.; Young, R.H.; Amin, M.B. Relationship of cytokeratin 20 and CD44 protein expression with WHO/ISUP grade in pTa and pT1 papillary urothelial neoplasia. Mod. Pathol. 2000, 13, 1315–1323. [Google Scholar] [CrossRef]
- Choi, W.; Porten, S.; Kim, S.; Willis, D.; Plimack, E.R.; Hoffman-Censits, J.; Roth, B.; Cheng, T.; Tran, M.; Lee, I.L.; et al. Identification of distinct basal and luminal subtypes of muscle-invasive bladder cancer with different sensitivities to frontline chemotherapy. Cancer Cell 2014, 25, 152–165. [Google Scholar] [CrossRef]
- Tan, T.Z.; Rouanne, M.; Tan, K.T.; Huang, R.Y.; Thiery, J.P. Molecular Subtypes of Urothelial Bladder Cancer: Results from a Meta-cohort Analysis of 2411 Tumors. Eur. Urol. 2019, 75, 423–432. [Google Scholar] [CrossRef]
- Dyrskjot, L.; Reinert, T.; Novoradovsky, A.; Zuiverloon, T.C.; Beukers, W.; Zwarthoff, E.; Malats, N.; Real, F.X.; Segersten, U.; Malmstrom, P.U.; et al. Analysis of molecular intra-patient variation and delineation of a prognostic 12-gene signature in non-muscle invasive bladder cancer; technology transfer from microarrays to PCR. Br. J. Cancer 2012, 107, 1392–1398. [Google Scholar] [CrossRef] [PubMed]
- Tsantoulis, P.K.; Gorgoulis, V.G. Involvement of E2F transcription factor family in cancer. Eur. J. Cancer 2005, 41, 2403–2414. [Google Scholar] [CrossRef]
- Santos, M.; Martinez-Fernandez, M.; Duenas, M.; Garcia-Escudero, R.; Alfaya, B.; Villacampa, F.; Saiz-Ladera, C.; Costa, C.; Oteo, M.; Duarte, J.; et al. In vivo disruption of an Rb-E2F-Ezh2 signaling loop causes bladder cancer. Cancer Res. 2014, 74, 6565–6577. [Google Scholar] [CrossRef]
- Lindgren, D.; Sjodahl, G.; Lauss, M.; Staaf, J.; Chebil, G.; Lovgren, K.; Gudjonsson, S.; Liedberg, F.; Patschan, O.; Mansson, W.; et al. Integrated genomic and gene expression profiling identifies two major genomic circuits in urothelial carcinoma. PLoS ONE 2012, 7, e38863. [Google Scholar] [CrossRef] [PubMed]
- Loriot, Y.; Necchi, A.; Park, S.H.; Garcia-Donas, J.; Huddart, R.; Burgess, E.; Fleming, M.; Rezazadeh, A.; Mellado, B.; Varlamov, S.; et al. Erdafitinib in locally advanced or metastatic urothelial carcinoma. N. Engl. J. Med. 2019, 381, 338–348. [Google Scholar] [CrossRef]
- Stroggilos, R.; Mokou, M.; Latosinska, A.; Makridakis, M.; Lygirou, V.; Mavrogeorgis, E.; Drekolias, D.; Frantzi, M.; Mullen, W.; Fragkoulis, C.; et al. Proteome-based classification of nonmuscle invasive bladder cancer. Int. J. Cancer 2020, 146, 281–294. [Google Scholar] [CrossRef]
- Jung, M.; Jang, I.; Kim, K.; Moon, K.C. CK14 expression identifies a basal/squamous-like type of papillary non-muscle-invasive upper tract urothelial carcinoma. Front. Oncol. 2020, 10, 623. [Google Scholar] [CrossRef] [PubMed]
- Schnitzler, T.; Ortiz-Bruchle, N.; Schneider, U.; Lurje, I.; Guricova, K.; Buchner, A.; Schulz, G.B.; Heidenreich, A.; Gaisa, N.T.; Knuchel, R.; et al. Pure high-grade papillary urothelial bladder cancer: A luminal-like subgroup with potential for targeted therapy. Cell. Oncol. 2020. [Google Scholar] [CrossRef]
- Dadhania, V.; Zhang, M.; Zhang, L.; Bondaruk, J.; Majewski, T.; Siefker-Radtke, A.; Guo, C.C.; Dinney, C.; Cogdell, D.E.; Zhang, S.; et al. Meta-analysis of the luminal and basal subtypes of bladder cancer and the identification of signature immunohistochemical markers for clinical use. EBioMedicine 2016, 12, 105–117. [Google Scholar] [CrossRef]
- Bankhead, P.; Loughrey, M.B.; Fernandez, J.A.; Dombrowski, Y.; McArt, D.G.; Dunne, P.D.; McQuaid, S.; Gray, R.T.; Murray, L.J.; Coleman, H.G.; et al. QuPath: Open source software for digital pathology image analysis. Sci. Rep. 2017, 7, 16878. [Google Scholar] [CrossRef]
- Jones, J.C.; Siebold, A.P.; Livi, C.B.; Lucas, A.B. SureSelectXT RNA Direct: A technique for expression analysis through sequencing of target-enriched FFPE total RNA. Methods Mol. Biol. 2018, 1783, 81–104. [Google Scholar] [PubMed]
- Martin, J.A.; Wang, Z. Next-generation transcriptome assembly. Nat. Rev. Genet. 2011, 12, 671–682. [Google Scholar] [CrossRef] [PubMed]
- Bolger, A.M.; Lohse, M.; Usadel, B. Trimmomatic: A flexible trimmer for Illumina sequence data. Bioinformatics 2014, 30, 2114–2120. [Google Scholar] [CrossRef]
- Kim, D.; Paggi, J.M.; Park, C.; Bennett, C.; Salzberg, S.L. Graph-based genome alignment and genotyping with HISAT2 and HISAT-genotype. Nat. Biotechnol. 2019, 37, 907–915. [Google Scholar] [CrossRef]
- Pertea, M.; Pertea, G.M.; Antonescu, C.M.; Chang, T.C.; Mendell, J.T.; Salzberg, S.L. StringTie enables improved reconstruction of a transcriptome from RNA-seq reads. Nat. Biotechnol. 2015, 33, 290–295. [Google Scholar] [CrossRef]
- Subramanian, A.; Tamayo, P.; Mootha, V.K.; Mukherjee, S.; Ebert, B.L.; Gillette, M.A.; Paulovich, A.; Pomeroy, S.L.; Golub, T.R.; Lander, E.S.; et al. Gene set enrichment analysis: A knowledge-based approach for interpreting genome-wide expression profiles. Proc. Natl. Acad. Sci. USA 2005, 102, 15545–15550. [Google Scholar] [CrossRef] [PubMed]
- Supek, F.; Bosnjak, M.; Skunca, N.; Smuc, T. REVIGO summarizes and visualizes long lists of gene ontology terms. PLoS ONE 2011, 6, e21800. [Google Scholar] [CrossRef]
- Kramer, A.; Green, J.; Pollard, J., Jr.; Tugendreich, S. Causal analysis approaches in Ingenuity Pathway Analysis. Bioinformatics 2014, 30, 523–530. [Google Scholar] [CrossRef]
- Chun, H.; Keles, S. Sparse partial least squares regression for simultaneous dimension reduction and variable selection. J. R. Stat. Soc. Ser. B Stat. Methodol. 2010, 72, 3–25. [Google Scholar] [CrossRef]
- Cawley, G.C.; Talbot, N.L. Gene selection in cancer classification using sparse logistic regression with Bayesian regularization. Bioinformatics 2006, 22, 2348–2355. [Google Scholar] [CrossRef] [PubMed]
- Friedman, J.; Hastie, T.; Tibshirani, R. Regularization Paths for Generalized Linear Models via Coordinate Descent. J. Stat. Softw. 2010, 33, 1–22. [Google Scholar] [CrossRef] [PubMed]
- Chen, M.; Hildebrandt, M.A.; Clague, J.; Kamat, A.M.; Picornell, A.; Chang, J.; Zhang, X.; Izzo, J.; Yang, H.; Lin, J.; et al. Genetic variations in the sonic hedgehog pathway affect clinical outcomes in non-muscle-invasive bladder cancer. Cancer Prev. Res. 2010, 3, 1235–1245. [Google Scholar] [CrossRef] [PubMed][Green Version]


| Category | Predicted Result | Upregulated Group | z-Score 1 | FDR 2 |
|---|---|---|---|---|
| K20-only vs. K5/6-only group | ||||
| Upstream | RABL6 | K20-only | 2.530 | 5.9 × 10⁻⁴ |
| Upstream | ID2 | K20-only | 2.208 | 5.5 × 10⁻³ |
| Upstream | EFNA4 | K20-only | 2.449 | 1.9 × 10⁻² |
| Upstream | PPARGC1A | K20-only | 3.125 | 1.9 × 10⁻² |
| Upstream | EFNA3 | K20-only | 2.449 | 1.9 × 10⁻² |
| Upstream | EFNA5 | K20-only | 2.449 | 2.2 × 10⁻² |
| Upstream | TP53 | K5/6-only | 2.752 | 1.0 × 10⁻⁷ |
| Upstream | TP63 | K5/6-only | 2.213 | 3.3 × 10⁻⁶ |
| Upstream | TGFB1 | K5/6-only | 4.169 | 2.3 × 10⁻⁵ |
| Upstream | PGR | K5/6-only | 2.288 | 8.8 × 10⁻⁵ |
| Upstream | CDKN2A | K5/6-only | 2.701 | 2.8 × 10⁻⁴ |
| Upstream | KDM5B | K5/6-only | 3.143 | 3.3 × 10⁻⁴ |
| Upstream | BRCA1 | K5/6-only | 2.063 | 3.7 × 10⁻⁴ |
| Upstream | RAF1 | K5/6-only | 3.385 | 3.7 × 10⁻⁴ |
| Upstream | CDKN1A | K5/6-only | 2.408 | 4.6 × 10⁻⁴ |
| Upstream | RB1 | K5/6-only | 2.134 | 6.8 × 10⁻⁴ |
| Upstream | SMARCA4 | K5/6-only | 2.959 | 7.6 × 10⁻⁴ |
| Upstream | NUPR1 | K5/6-only | 3.413 | 8.5 × 10⁻⁴ |
| Upstream | IKBKB | K5/6-only | 2.016 | 1.7 × 10⁻³ |
| Upstream | EGF | K5/6-only | 2.089 | 2.0 × 10⁻³ |
| Upstream | HIF1A | K5/6-only | 2.059 | 3.2 × 10⁻³ |
| Upstream | TGF beta | K5/6-only | 2.288 | 3.4 × 10⁻³ |
| Upstream | FSHB | K5/6-only | 2.190 | 6.4 × 10⁻³ |
| Upstream | FGF2 | K5/6-only | 3.083 | 8.0 × 10⁻³ |
| Upstream | JAG1 | K5/6-only | 2.646 | 8.1 × 10⁻³ |
| Upstream | PDGF BB | K5/6-only | 2.652 | 8.9 × 10⁻³ |
| Upstream | IGF1 | K5/6-only | 2.083 | 9.8 × 10⁻³ |
| Upstream | CG | K5/6-only | 2.332 | 1.2 × 10⁻² |
| Upstream | JUN | K5/6-only | 2.502 | 1.3 × 10⁻² |
| Upstream | BNIP3L | K5/6-only | 2.630 | 1.9 × 10⁻² |
| Upstream | CTNNB1 | K5/6-only | 2.630 | 2.3 × 10⁻² |
| Upstream | Calcineurin A | K5/6-only | 2.200 | 2.9 × 10⁻² |
| Upstream | EDN1 | K5/6-only | 2.439 | 3.6 × 10⁻² |
| Upstream | ERK1/2 | K5/6-only | 2.163 | 3.7 × 10⁻² |
| Upstream | TGFB3 | K5/6-only | 2.926 | 3.8 × 10⁻² |
| Upstream | STAT3 | K5/6-only | 2.209 | 3.8 × 10⁻² |
| Disease/function | Endocrine gland tumor | K20-only | 2.213 | 3.1 × 10⁻⁸ |
| Disease/function | Congenital anomaly of digit | K20-only | 2.000 | 7.3 × 10⁻³ |
| Disease/function | Invasion of tumor cell lines | K5/6-only | 2.069 | 1.3 × 10⁻⁵ |
| Disease/function | Migration of cells | K5/6-only | 2.102 | 3.4 × 10⁻⁵ |
| Disease/function | Cell movement | K5/6-only | 2.591 | 4.5 × 10⁻⁵ |
| Disease/function | Adhesion of tumor cell lines | K5/6-only | 2.481 | 7.4 × 10⁻⁴ |
| Disease/function | Binding of tumor cell lines | K5/6-only | 2.444 | 8.7 × 10⁻⁴ |
| Disease/function | Attachment of cells | K5/6-only | 2.040 | 1.5 × 10⁻³ |
| Disease/function | Invasion of breast cancer cell lines | K5/6-only | 2.015 | 1.5 × 10⁻³ |
| Disease/function | Cell movement of breast cancer cell lines | K5/6-only | 2.014 | 4.1 × 10⁻³ |
| Disease/function | Apoptosis of prostate cancer cell lines | K5/6-only | 3.467 | 5.9 × 10⁻³ |
| Disease/function | Formation of gamma H2AX nuclear focus | K5/6-only | 2.345 | 6.1 × 10⁻³ |
| Disease/function | Cell movement of endothelial cells | K5/6-only | 2.190 | 6.3 × 10⁻³ |
| Disease/function | Apoptosis of cancer cells | K5/6-only | 2.420 | 7.0 × 10⁻³ |
| Disease/function | Necrosis of tumor | K5/6-only | 2.495 | 7.7 × 10⁻³ |
| Disease/function | Necrosis of prostate cancer cell lines | K5/6-only | 3.223 | 8.2 × 10⁻³ |
| K20-only vs. double-high group | ||||
| Upstream | ERBB2 | K20-only | 3.284 | 7.2 × 10⁻⁴ |
| Upstream | EP400 | K20-only | 2.449 | 1.8 × 10⁻³ |
| Upstream | E2f | K20-only | 2.199 | 2.8 × 10⁻³ |
| Upstream | RABL6 | K20-only | 3.000 | 5.6 × 10⁻³ |
| Upstream | ID2 | K20-only | 2.563 | 5.6 × 10⁻³ |
| Upstream | ID3 | K20-only | 2.157 | 2.1 × 10⁻² |
| Upstream | E2F3 | K20-only | 2.534 | 2.1 × 10⁻² |
| Upstream | MITF | K20-only | 2.575 | 3.0 × 10⁻² |
| Upstream | SREBF2 | K20-only | 2.557 | 4.7 × 10⁻² |
| Upstream | TP53 | Double-high | 3.069 | 2.8 × 10⁻⁸ |
| Upstream | CDKN2A | Double-high | 4.097 | 3.7 × 10⁻⁴ |
| Upstream | CDKN1A | Double-high | 2.729 | 4.5 × 10⁻⁴ |
| Upstream | MLXIPL | Double-high | 3.592 | 1.4 × 10⁻³ |
| Upstream | OGA | Double-high | 3.272 | 2.5 × 10⁻³ |
| Upstream | MYCN | Double-high | 2.385 | 8.1 × 10⁻³ |
| Disease/function | DNA replication | K20-only | 2.159 | 8.8 × 10⁻⁵ |
| Disease/function | Genitourinary adenocarcinoma | K20-only | 2.177 | 1.0 × 10⁻⁴ |
| Disease/function | Proliferation of connective tissue cells | K20-only | 3.115 | 4.2 × 10⁻⁴ |
| Disease/function | Growth of connective tissue | K20-only | 2.790 | 5.5 × 10⁻⁴ |
| Disease/function | Cell proliferation of breast cancer cell lines | K20-only | 2.032 | 2.6 × 10⁻³ |
| Disease/function | Advanced malignant solid tumor | K20-only | 2.228 | 3.6 × 10⁻³ |
| Disease/function | Growth of organism | K20-only | 2.299 | 6.0 × 10⁻³ |
| Disease/function | Advanced lung cancer | K20-only | 2.578 | 6.4 × 10⁻³ |
| Disease/function | Cell cycle progression of tumor cell lines | K20-only | 2.395 | 1.1 × 10⁻² |
| Disease/function | Visceral metastasis | K20-only | 2.594 | 1.3 × 10⁻² |
| Disease/function | Metastatic solid tumor | K20-only | 2.228 | 1.3 × 10⁻² |
| Disease/function | Advanced extracranial solid tumor | K20-only | 2.576 | 1.8 × 10⁻² |
| Disease/function | Cell death of breast cancer cell lines | Double-high | 2.359 | 2.7 × 10⁻⁵ |
| Disease/function | Cell death of tumor cell lines | Double-high | 3.092 | 4.4 × 10⁻⁵ |
| Disease/function | Apoptosis | Double-high | 2.128 | 2.1 × 10⁻⁴ |
| Disease/function | Gastrointestinal tract cancer | Double-high | 2.000 | 1.1 × 10⁻³ |
| Disease/function | Senescence of cells | Double-high | 2.104 | 1.1 × 10⁻³ |
| Disease/function | Cell death of lung cancer cell lines | Double-high | 2.444 | 3.7× 10⁻³ |
| Disease/function | Colon tumor | Double-high | 2.364 | 7.1 × 10⁻³ |
| Disease/function | Proliferation of hematopoietic progenitor cells | Double-high | 2.005 | 1.6 × 10⁻² |
| Disease/function | Colorectal tumor | Double-high | 2.078 | 1.6 × 10⁻² |
| Disease/function | Cytostasis of tumor cell lines | Double-high | 2.145 | 1.8 × 10⁻² |
| K5/6-only vs. double-high group | ||||
| Upstream | EPAS1 | K5/6-only | 2.000 | 3.9 × 10⁻² |
| Disease/function | NA | NA | NA | NA |
| K20-only vs. double-low group | ||||
| Upstream | ID3 | K20-only | 2.213 | 1.2 × 10⁻² |
| Upstream | MYC | K20-only | 2.299 | 1.3 × 10⁻² |
| Upstream | LLGL2 | K20-only | 2.000 | 4.4 × 10⁻² |
| Upstream | ERBB3 | K20-only | 2.588 | 4.7 × 10⁻² |
| Disease/function | Genitourinary tumor | K20-only | 2.017 | 2.1 × 10⁻³ |
| Disease/function | Malignant genitourinary solid tumor | K20-only | 2.139 | 2.1 × 10⁻³ |
| Disease/function | Adenocarcinoma | K20-only | 2.204 | 3.2 × 10⁻³ |
| Disease/function | Anogenital cancer | K20-only | 2.144 | 3.9 × 10⁻³ |
| Disease/function | Incidence of tumor | K20-only | 2.257 | 7.0 × 10⁻³ |
| Disease/function | Carcinoma | K20-only | 2.292 | 7.8 × 10⁻³ |
| Disease/function | Extracranial solid tumor | K20-only | 2.697 | 1.4 × 10⁻² |
| Disease/function | Malignant solid tumor | K20-only | 2.026 | 2.3 × 10⁻² |
| Disease/function | Epithelial–mesenchymal transition of breast cell lines | K20-only | 2.108 | 2.8 × 10⁻² |
| K5/6-only vs. double-low group | ||||
| Upstream | TP53 | K5/6-only | 2.086 | 1.8 × 10⁻⁴ |
| Disease/function | NA | NA | NA | NA |
| Category | Predicted Result | Upregulated Group | z-Score 1 | FDR 2 |
|---|---|---|---|---|
| K20-only_Lund vs. K5/6-only_Lund group | ||||
| Upstream | RABL6 | K20-only | 5.014 | 2.4 × 10⁻²⁷ |
| Upstream | ERBB2 | K20-only | 4.092 | 5.9 × 10⁻²⁴ |
| Upstream | FOXM1 | K20-only | 3.818 | 1.7 × 10⁻¹⁶ |
| Upstream | MITF | K20-only | 3.962 | 7.6 × 10⁻¹⁵ |
| Upstream | FOXO1 | K20-only | 2.493 | 6.7 × 10⁻¹² |
| Upstream | LIN9 | K20-only | 3.130 | 3.6 × 10⁻¹¹ |
| Upstream | AREG | K20-only | 3.195 | 1.3 × 10⁻⁹ |
| Upstream | E2F3 | K20-only | 3.592 | 6.1 × 10⁻⁸ |
| Upstream | E2f | K20-only | 2.449 | 1.4 × 10⁻⁷ |
| Upstream | MYBL2 | K20-only | 2.607 | 3.1 × 10⁻⁷ |
| Upstream | ELAVL1 | K20-only | 3.278 | 2.3 × 10⁻⁵ |
| Upstream | HSPB1 | K20-only | 2.429 | 3.1 × 10⁻⁵ |
| Upstream | RARA | K20-only | 4.000 | 5.4 × 10⁻⁵ |
| Upstream | TAL1 | K20-only | 3.000 | 5.6 × 10⁻⁵ |
| Upstream | KDM1A | K20-only | 3.434 | 7.1 × 10⁻⁵ |
| Upstream | ESR1 | K20-only | 3.601 | 1.0 × 10⁻⁴ |
| Upstream | 26s Proteasome | K20-only | 2.357 | 3.5 × 10⁻⁴ |
| Upstream | BRD4 | K20-only | 2.603 | 3.9 × 10⁻⁴ |
| Upstream | TRAF2 | K20-only | 2.224 | 6.7 × 10⁻⁴ |
| Upstream | NSUN6 | K20-only | 2.449 | 4.3 × 10⁻³ |
| Upstream | S100A6 | K20-only | 2.236 | 6.9 × 10⁻³ |
| Upstream | CREB1 | K20-only | 2.219 | 1.5 × 10⁻² |
| Upstream | TP53 | K5/6-only | 5.972 | 1.4 × 10⁻¹⁴ |
| Upstream | TRPS1 | K5/6-only | 3.742 | 3.4 × 10⁻¹⁴ |
| Upstream | NUPR1 | K5/6-only | 2.592 | 6.7 × 10⁻¹² |
| Upstream | CDKN1A | K5/6-only | 2.783 | 1.4 × 10⁻⁷ |
| Upstream | KDM5B | K5/6-only | 3.487 | 1.5 × 10⁻⁷ |
| Upstream | E2F6 | K5/6-only | 2.236 | 4.3 × 10⁻⁴ |
| Upstream | ATF3 | K5/6-only | 2.369 | 6.0 × 10⁻⁴ |
| Upstream | CTLA4 | K5/6-only | 2.236 | 5.1 × 10⁻³ |
| Upstream | CDKN2A | K5/6-only | 2.433 | 3.4 × 10⁻² |
| Disease/function | M phase | K20-only | 2.142 | 1.2x10⁻¹² |
| Disease/function | Alignment of chromosomes | K20-only | 2.324 | 7.2 × 10⁻¹² |
| Disease/function | M phase of tumor cell lines | K20-only | 2.613 | 5.2 × 10⁻¹⁰ |
| Disease/function | Cytokinesis | K20-only | 2.278 | 2.8 × 10⁻⁸ |
| Disease/function | M phase of cervical cancer cell lines | K20-only | 2.019 | 8.5 × 10⁻⁸ |
| Disease/function | Cytokinesis of tumor cell lines | K20-only | 2.249 | 1.0 × 10⁻⁷ |
| Disease/function | Interphase | K20-only | 2.744 | 2.4 × 10⁻⁷ |
| Disease/function | Cell survival | K20-only | 2.348 | 6.7 × 10⁻⁶ |
| Disease/function | Cell viability of tumor cell lines | K20-only | 2.470 | 1.3 × 10⁻⁵ |
| Disease/function | Cell proliferation of tumor cell lines | K20-only | 2.796 | 5.4 × 10⁻⁵ |
| Disease/function | Cell viability | K20-only | 2.328 | 9.8 × 1−5 |
| Disease/function | G1 phase | K20-only | 2.111 | 1.1 × 10⁻⁴ |
| Disease/function | Mitotic index | K20-only | 2.214 | 5.8 × 10⁻⁴ |
| Disease/function | Cell viability of myeloma cell lines | K20-only | 2.601 | 3.7 × 10⁻³ |
| Disease/function | Interphase of tumor cell lines | K20-only | 2.017 | 6.0 × 10⁻³ |
| Disease/function | Interphase of cervical cancer cell lines | K20-only | 2.392 | 1.8 × 10⁻² |
| Disease/function | Cell viability of lung cancer cell lines | K20-only | 2.100 | 4.7 × 10⁻² |
| Disease/function | Missegregation of chromosomes | K5/6-only | 2.392 | 1.4 × 10⁻³ |
| K20-only_Lund vs. double-high_Lund group | ||||
| Upstream | RABL6 | K20-only | 2.828 | 4.2 × 10⁻⁴ |
| Upstream | ERBB2 | K20-only | 2.219 | 1.2 × 10⁻² |
| Upstream | TGFB1 | K20-only | 2.186 | 4.3 × 10⁻² |
| Disease/function | NA | NA | NA | NA |
| K5/6-only_Lund vs. double-high_Lund group | ||||
| Upstream | KDM5B | K5/6-only | 2.000 | 8.6 × 10⁻³ |
| Upstream | RABL6 | Double-high | 2.236 | 2.2 × 10⁻⁴ |
| Disease/function | NA | NA | NA | NA |
| K20-only_Lund vs. double-low_Lund group | ||||
| Upstream | RABL6 | K20-only | 3.207 | 6.4 × 10⁻¹⁰ |
| Upstream | FOXM1 | K20-only | 3.382 | 7.1 × 10⁻⁸ |
| Upstream | ERBB2 | K20-only | 2.538 | 7.1 × 10⁻⁷ |
| Upstream | MYBL2 | K20-only | 2.412 | 2.3 × 10⁻⁶ |
| Upstream | LIN9 | K20-only | 2.438 | 7.0 × 10⁻⁶ |
| Upstream | AREG | K20-only | 2.132 | 2.9 × 10⁻⁵ |
| Upstream | HIF1A-AS1 | K20-only | 2.236 | 3.6 × 10⁻⁴ |
| Upstream | 26s Proteasome | K20-only | 2.607 | 2.9 × 10⁻³ |
| Upstream | E2F3 | K20-only | 2.646 | 7.3 × 10⁻³ |
| Upstream | RARA | K20-only | 3.000 | 2.1 × 10⁻² |
| Upstream | MITF | K20-only | 2.646 | 2.4 × 10⁻² |
| Upstream | ESR1 | K20-only | 2.718 | 4.8 × 10⁻² |
| Upstream | TRPS1 | Double-low | 2.828 | 7.1 × 10⁻⁷ |
| Upstream | TP53 | Double-low | 3.827 | 3.2 × 10⁻⁶ |
| Upstream | CDKN1A | Double-low | 2.848 | 2.9 × 10⁻⁵ |
| Upstream | CTLA4 | Double-low | 2.236 | 1.3x10⁻³ |
| Upstream | KDM5B | Double-low | 2.823 | 5.3 × 10⁻³ |
| Disease/function | Segregation of chromosomes | K20-only | 2.000 | 4.9 × 10⁻⁴ |
| K5/6-only_Lund vs. double-low_Lund group | ||||
| Upstream | NA | NA | NA | NA |
| Disease/function | NA | NA | NA | NA |
Publisher’s Note: MDPI stays neutral with regard to jurisdictional claims in published maps and institutional affiliations. |
© 2020 by the authors. Licensee MDPI, Basel, Switzerland. This article is an open access article distributed under the terms and conditions of the Creative Commons Attribution (CC BY) license (http://creativecommons.org/licenses/by/4.0/).
Share and Cite
Jung, M.; Jang, I.; Kim, K.; Moon, K.C. Non-Muscle-Invasive Bladder Carcinoma with Respect to Basal Versus Luminal Keratin Expression. Int. J. Mol. Sci. 2020, 21, 7726. https://doi.org/10.3390/ijms21207726
Jung M, Jang I, Kim K, Moon KC. Non-Muscle-Invasive Bladder Carcinoma with Respect to Basal Versus Luminal Keratin Expression. International Journal of Molecular Sciences. 2020; 21(20):7726. https://doi.org/10.3390/ijms21207726
Chicago/Turabian StyleJung, Minsun, Insoon Jang, Kwangsoo Kim, and Kyung Chul Moon. 2020. "Non-Muscle-Invasive Bladder Carcinoma with Respect to Basal Versus Luminal Keratin Expression" International Journal of Molecular Sciences 21, no. 20: 7726. https://doi.org/10.3390/ijms21207726
APA StyleJung, M., Jang, I., Kim, K., & Moon, K. C. (2020). Non-Muscle-Invasive Bladder Carcinoma with Respect to Basal Versus Luminal Keratin Expression. International Journal of Molecular Sciences, 21(20), 7726. https://doi.org/10.3390/ijms21207726