Article

Developmental Methylome of the Medicinal Plant Catharanthus roseus Unravels the Tissue-Specific Control of the Monoterpene Indole Alkaloid Pathway by DNA Methylation

by
Thomas Dugé de Bernonville
1,†,
Stéphane Maury
2,*,†,
Alain Delaunay
2,
Christian Daviaud
3,
Cristian Chaparro
4,
Jörg Tost
3,
Sarah Ellen O’Connor
5 and
Vincent Courdavault
1,*
1
Faculté des Sciences et Techniques, Université de Tours, EA2106 Biomolécules et Biotechnologies Végétales, F-37200 Tours, France
2
INRA, EA1207 USC1328 Laboratoire de Biologie des Ligneux et des Grandes Cultures, Université d’Orléans, F-45067 Orléans, France
3
Laboratoire Epigénétique et Environnement, LEE, Centre National de Recherche en Génomique Humaine, Institut de Biologie François Jacob, F-92265 Evry, France
4
CNRS, IFREMER, UMR5244 Interactions Hôtes-Pathogènes-Environnments, Université de Montpellier, Université de Perpignan Via Domitia, F-66860 Perpignan, France
5
Max Planck Institute for Chemical Ecology, Department of Natural Product Biosynthesis, 07745 Jena, Germany
*
Authors to whom correspondence should be addressed.
These authors contributed equally to this work.
Int. J. Mol. Sci. 2020, 21(17), 6028; https://doi.org/10.3390/ijms21176028
Submission received: 21 July 2020 / Revised: 6 August 2020 / Accepted: 18 August 2020 / Published: 21 August 2020
(This article belongs to the Section Molecular Plant Sciences)

Abstract

:
Catharanthus roseus produces a wide spectrum of monoterpene indole alkaloids (MIAs). MIA biosynthesis requires a tightly coordinated pathway involving more than 30 enzymatic steps that are spatio-temporally and environmentally regulated so that some MIAs specifically accumulate in restricted plant parts. The first regulatory layer involves a complex network of transcription factors from the basic Helix Loop Helix (bHLH) or AP2 families. In the present manuscript, we investigated whether an additional epigenetic layer could control the organ-, developmental- and environmental-specificity of MIA accumulation. We used Whole-Genome Bisulfite Sequencing (WGBS) together with RNA-seq to identify differentially methylated and expressed genes among nine samples reflecting different plant organs and experimental conditions. Tissue specific gene expression was associated with specific methylation signatures depending on cytosine contexts and gene parts. Some genes encoding key enzymatic steps from the MIA pathway were found to be simultaneously differentially expressed and methylated in agreement with the corresponding MIA accumulation. In addition, we found that transcription factors were strikingly concerned by DNA methylation variations. Altogether, our integrative analysis supports an epigenetic regulation of specialized metabolisms in plants and more likely targeting transcription factors which in turn may control the expression of enzyme-encoding genes.

1. Introduction

The Madagascar Periwinkle (Catharanthus roseus (L.) G.Don) is a well-known producer of Monoterpene Indole Alkaloids (MIAs) [1]. Besides the use of some of its MIAs in anticancer chemotherapy, C. roseus has become an important model medicinal plant especially due to the availability of transcriptomic and genomic resources [2,3,4,5]. The common precursor to all MIAs is strictosidine which originates from the condensation of tryptamine with secologanin. Major end product MIAs in C. roseus are catharanthine and vindoline, which are able to dimerize into anhydrovinblastine, a molecule with antineoplastic properties. Interestingly, accumulation of MIAs in C. roseus is highly compartmentalized and displays organ specific patterns. While catharanthine is widespread in the plant, vindoline is restricted to the aerial parts [6]. Its synthesis is also more active in the basal (versus distal) regions of young immature leaves [7]. Vindoline results from the 7-step conversion of tabersonine [8], a molecule that is also produced in virtually all parts of the plant. However, tabersonine is specifically metabolized into vindoline in leaf or alternatively into lochnericine or hörhammericine in roots [9,10]. Tabersonine and catharanthine are converted from a common precursor by specific carboxylesterases named TABERSONINE and CATHARANTHINE SYNTHASE, respectively [11,12]. Adventitious roots obtained from cuttings incubated in water also display a root-like metabolic profile enriched with several tabersonine derivatives. Flowers have been reported to have a very low content in catharanthine and high amounts of serpentine and ajmalicine [13]. In addition to this tissue specificity, it has been shown that C. roseus subjected to herbivory by the Tobacco Hornworm Manduca sexta underwent an increase of MIA accumulation through a two-step process [14]. Folivory is thus accompanied by a fast and local accumulation of strictosidine and by a delayed systemic accumulation of terminal MIAs such as catharanthine and vindoline. Therefore, the MIA pathway in C. roseus appears to be specifically regulated at both developmental and environmental levels. However, the precise nature of the regulatory events remains largely unknown.
At the molecular level, the regulation of MIA biosynthesis is known to operate through major transcription factors. For instance, the upstream iridoid part of the pathway leading to secologanin production is upregulated by two basic Helix-Loop-Helix (bHLH) transcription factors named BIS1 and BIS2 though these transcription factors do not control the accumulation of later alkaloids such as catharanthine or tabersonine [15,16]. However, another bHLH transcription factor, CrMYC2, positively regulates MIA accumulation [17], through the concomitant regulation of the AP2/ERF ORCA transcription factors [18,19]. This illustrates how MIA biosynthesis is tightly coordinated by a complex regulation network [20]. Furthermore, it has recently been shown that vindoline accumulation in leaf is under the positive control of GATA transcription factors, which are in turn degraded by PHYTOCHROME INTERACTING FACTORS in darkness [21]. This complex regulatory network is also shaped by phytohormones that are known to modulate MIA accumulation. For example, it is well established that auxins downregulate the expression of several MIA related genes, while cytokinins and jasmonate promote MIA accumulation (reviewed in [22]).
Epigenetics refers to any non-genetic heritable molecular modification of the genome that may alter gene expression [23]. In addition and/or in combination with transcription factors, epigenetic modifications are known to shape and regulate many aspects of plant development and physiology DNA methylation at cytosine positions is particularly known to influence gene expression, transposon activity, and chromosome interactions [24]. It modulates plant development and response to environmental clues [24,25]. DNA cytosine methylation may occur de novo or by maintenance during replication in the CG, CHG, and CHH contexts (H = A, T or C), within or outside gene bodies and transposable elements (TE) [26]. The global DNA methylation level greatly varies among plant species [25]. However, general methylation in gene bodies appears to be a conserved process in orthologous genes from phylogenetically distant species [27] while methylation in promoters or first intron may control gene expression [24,28,29]. Plant development is controlled by specific DNA methylation patterns, e.g., during ontogenesis, but also in response to environmental stresses [29,30]. It has recently been showed that variation in DNA methylation patterns may affect gene expression in cis and in trans possibly via small RNAs affecting primary and specialized metabolic pathways in Arabidopsis thaliana (L.) [31]. In addition, histone and DNA modifications are likely to shape relationships between cell metabolites and the corresponding gene expression [32].
Specialized metabolic pathways in plants are developmentally and environmentally regulated and an additional epigenetic control has been proposed. For example, apple skin color in some cultivars is due to the accumulation of anthocyanins whose biosynthesis involves enzymes encoded by genes which are differentially methylated at cytosine nucleotides [33]. In addition, hypomethylation of flavonoid related genes has been correlated with increased expression and accumulation of anthocyanins. In non-model plants used in traditional medicine, DNA cytosine methylation has been shown to be an important factor controlling the accumulation of specialized metabolites during in vitro growth. For example, variations in methylation profiles have been shown to vary between wild and cultivated ginseng and were associated with differential specialized metabolite accumulation [34]. In addition, inhibitors of DNA methylation are able to increase phenolic product biosynthesis in Salvia miltiorrhiza (Bunge) hairy root cultures [35]. Finally, a correlation was made between methylation state and Benzoisoquinoline Indole Alkaloids in different organs and cultivars of opium poppy [36]. However, an integrative analysis with multi-omics data is still lacking to establish and precise the role of DNA methylation in the regulation of specialized pathways in medicinal plants.
In the present study, we investigated whether variations in DNA methylation profiles may control the developmental and environmental regulation of the MIA biosynthetic pathway in C. roseus. We analyzed genome-wide DNA methylation comprehensively at single nucleotide resolution by Whole Genome Bisulfite Sequencing (WGBS) focusing on either the entire genome or regions inside/around genes under 9 different conditions (different organs or parts, during their maturation and in response to biotic attack) and compared gene associated methylation profiles to the respective gene expression levels measured by RNA-seq and metabolomic MIA accumulation.

2. Results and Discussion

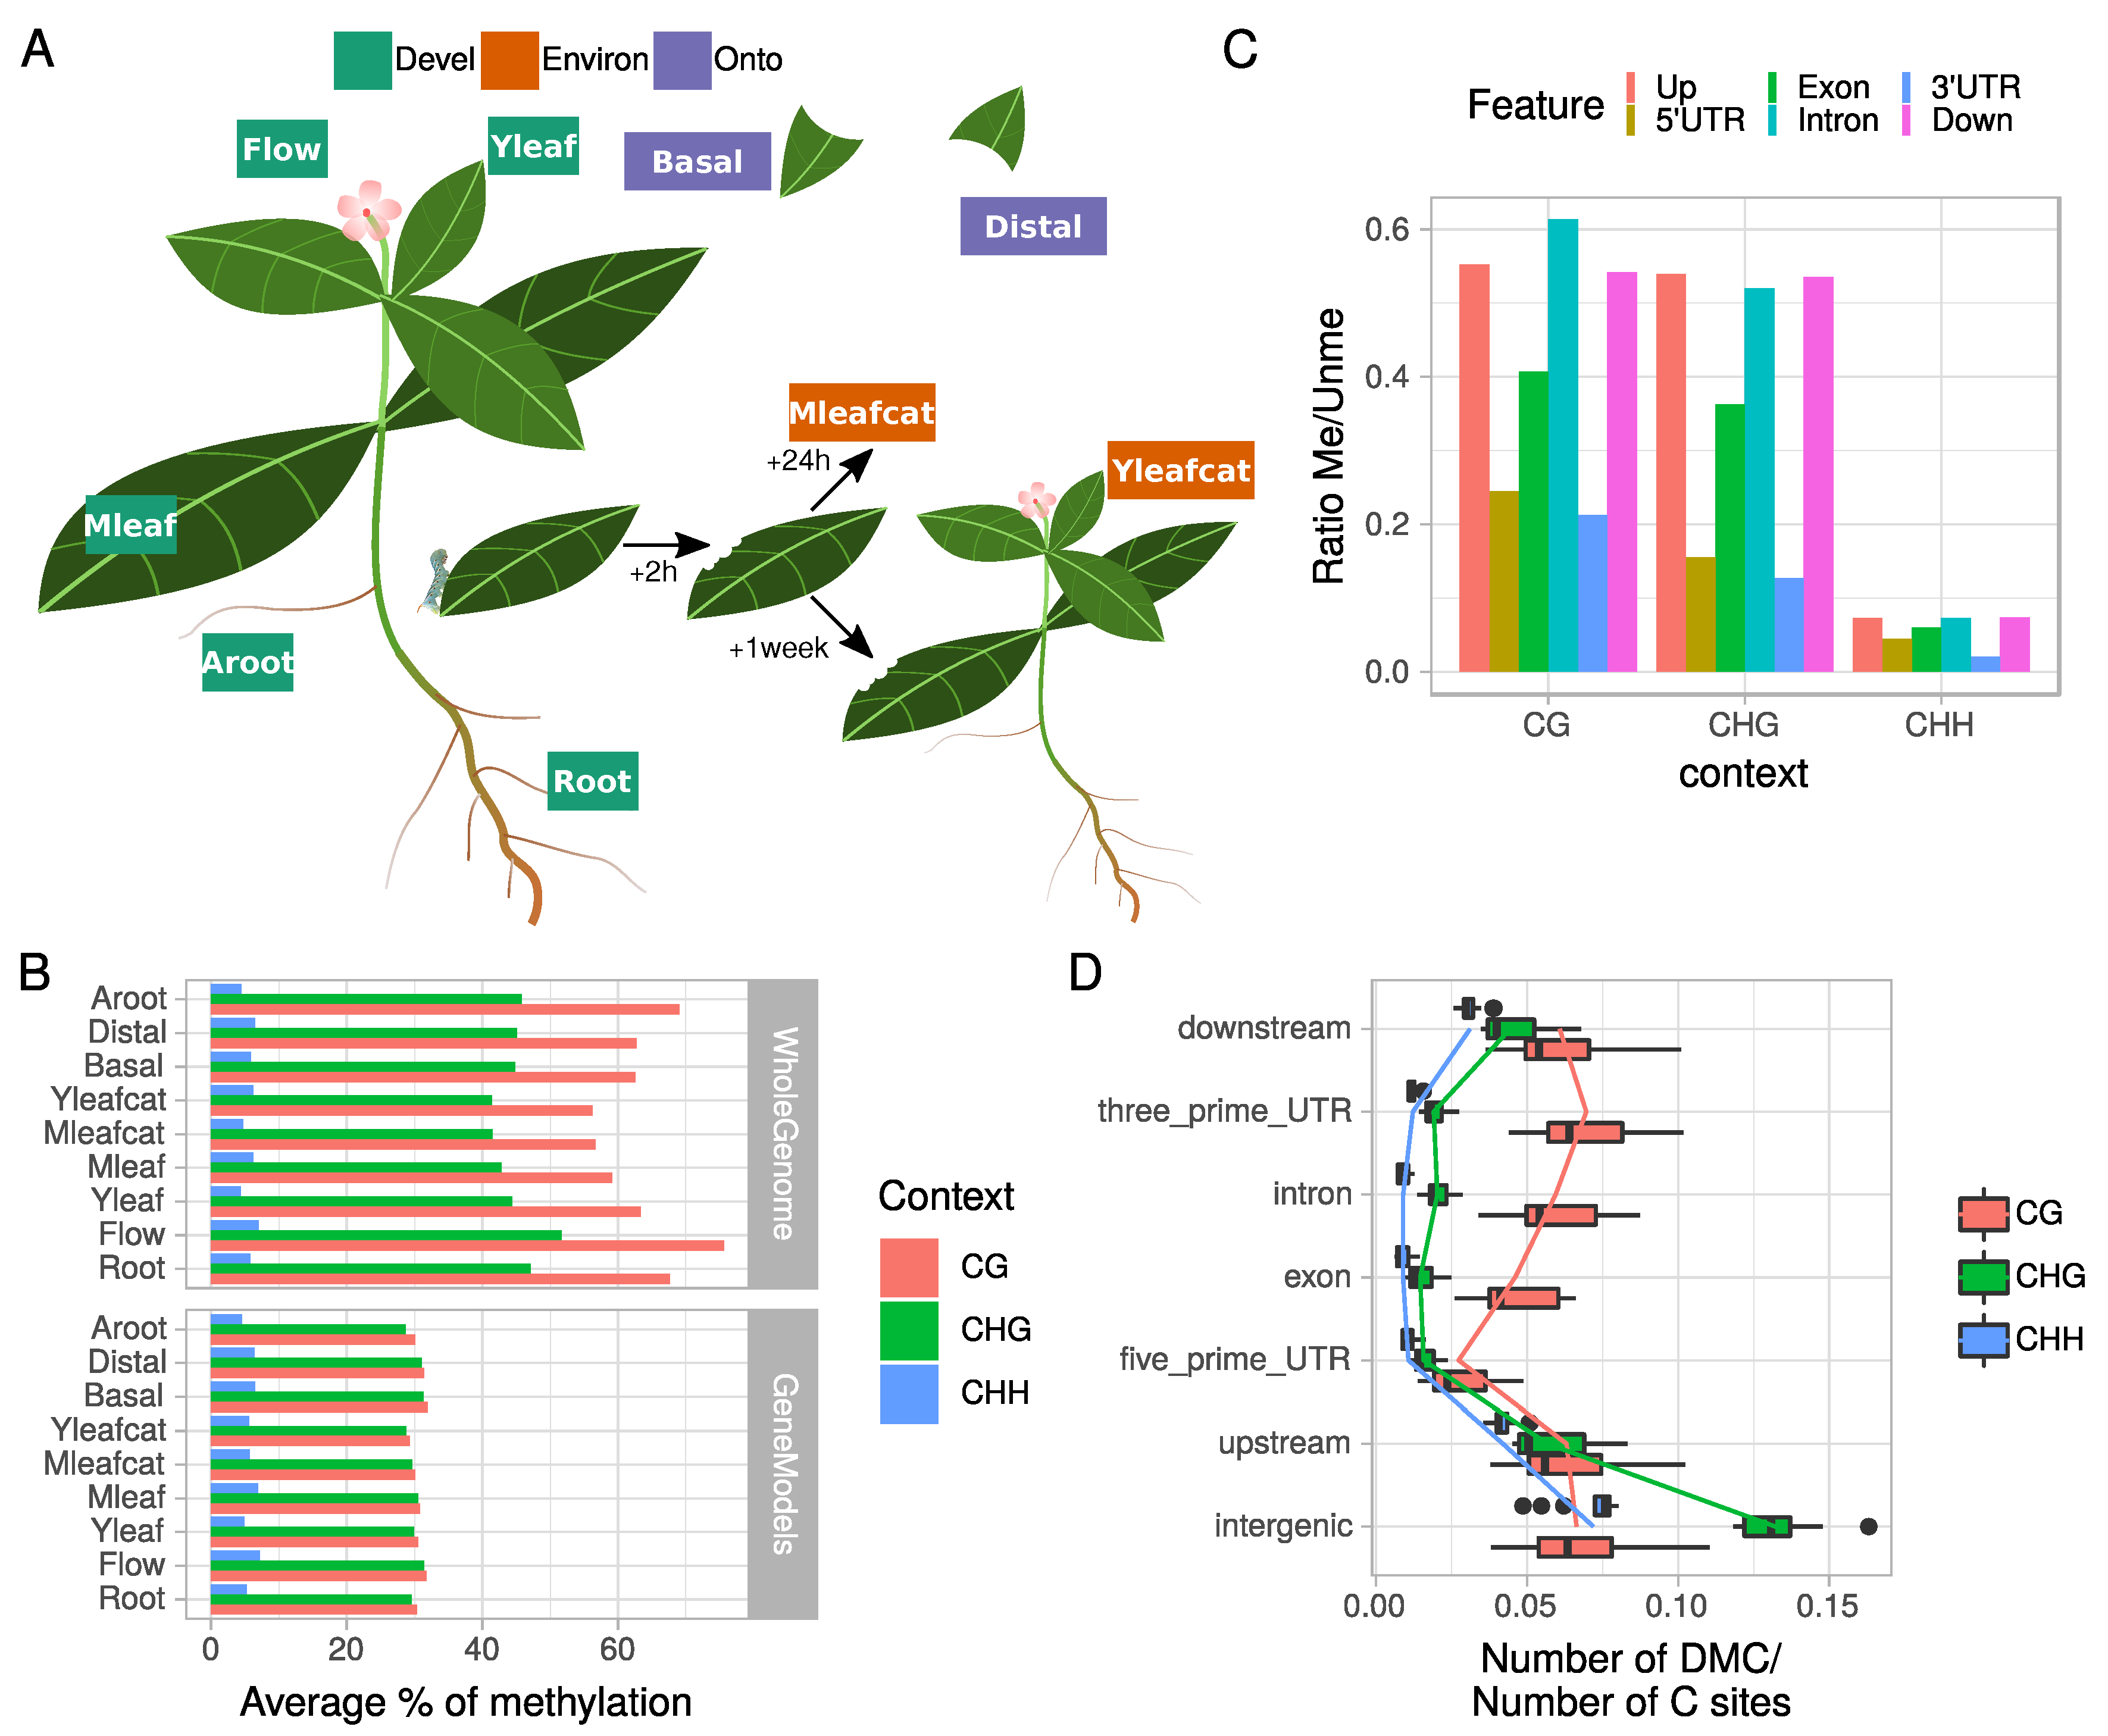
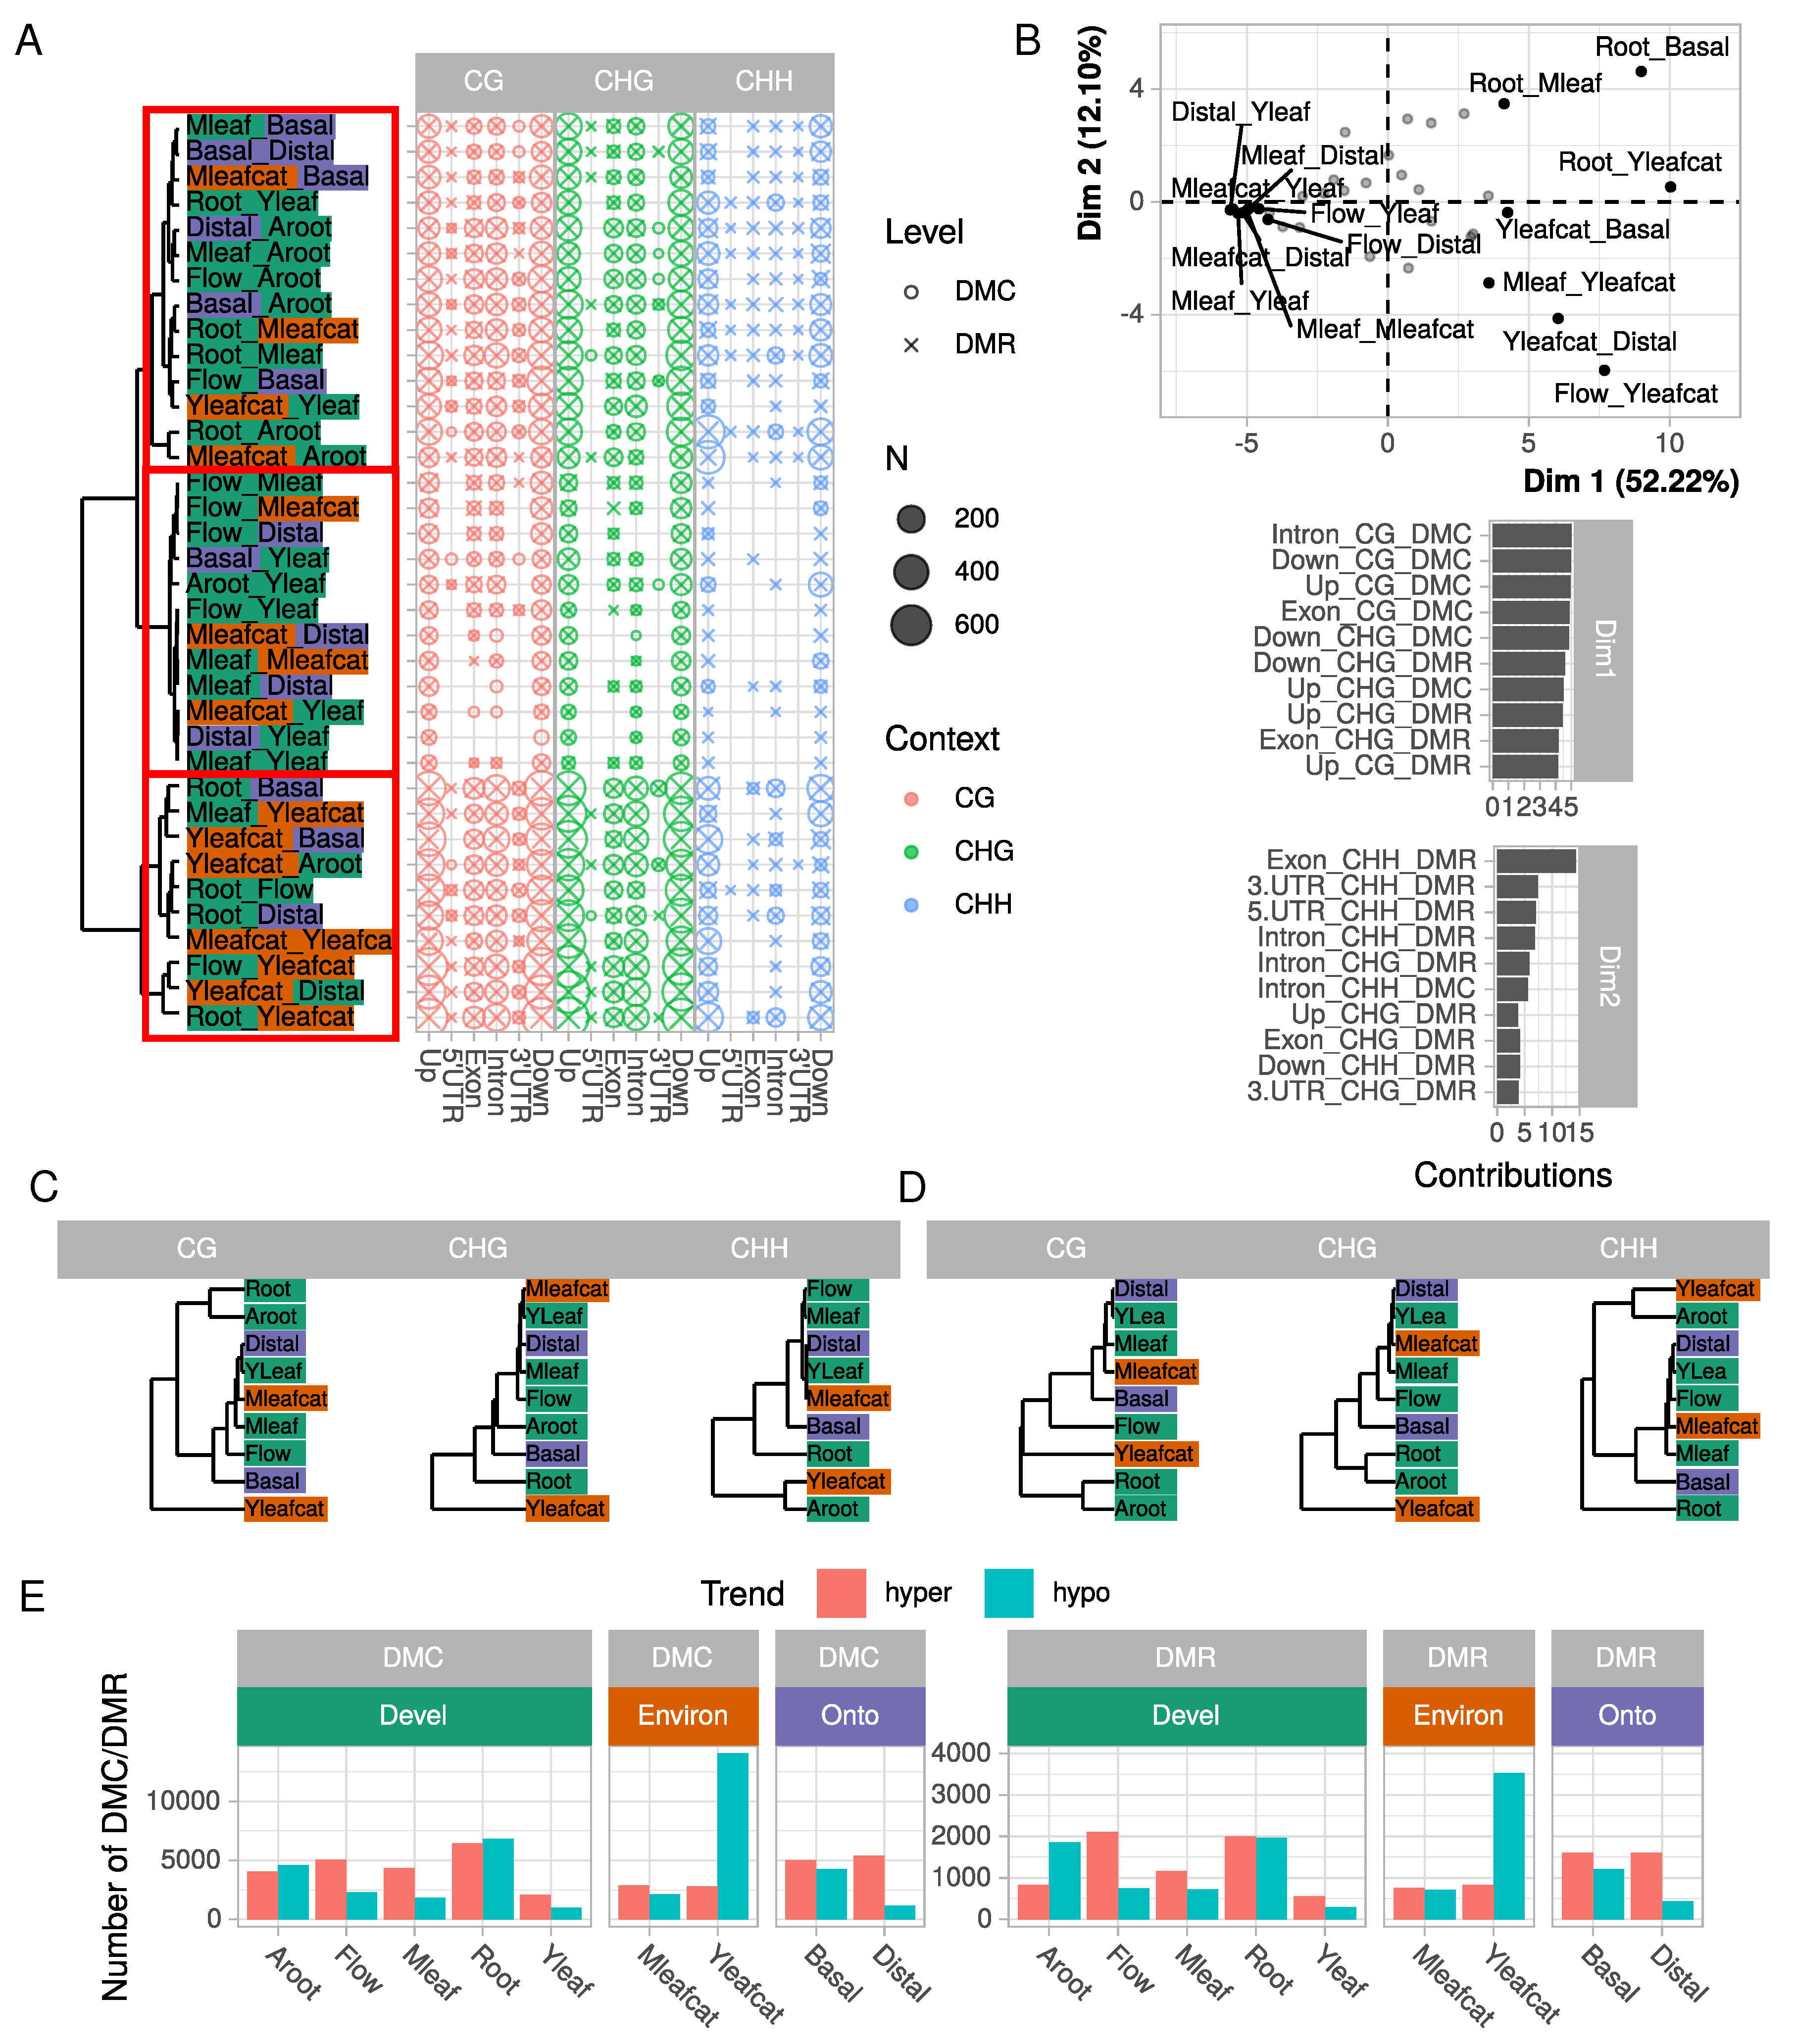
2.1. C. roseus Tissue-Specific Methylome Is Characterized by Context-Dependent Variations within Genes and Their Flanking Regions

Genome-wide methylation profiles may be measured by several techniques relying on high-throughput DNA sequencing methods [37], of which WGBS provides the most comprehensive coverage and can be considered as the current Gold standard technology. Genome-wide cytosine methylation in C. roseus was analyzed using WGBS in organs and conditions reflecting the most pronounced contrasts in qualitative and quantitative MIA accumulation (Figure 1A). The objective was to highlight relationships between gene methylation and expression in main organs such Root, Flower (Flow), Young Leaf (Yleaf), Mature Leaf (Mleaf), and adventitious Roots [10] obtained from stem cuttings (Aroot). Since MIA biosynthesis has been reported to be more active in basal parts of young leaves [7], we separately analyzed basal (Basal) and distal (Distal) parts of young leaves. Due to the important stimulation of the MIA pathway observed in plants subjected to herbivory [14], we also compared two samples from fed plants. The first one corresponds to the intact part of leaves damaged by caterpillars and sampled 24 h after the feeding process (Mleafcat). The second sample corresponds to intact newly emerged leaves collected one week later after an initial attack on older leaves (Yleafcat). The entire genomic sequence of C. roseus as well as a reduced representation on gene models with +/− 5 Kbp around were used to map reads (Figure 1B).
Mapped reads ranged from 33 to 192 millions on the entire genome (about 0.5 Gb; [3]; Figure S1; see the Material and Methods Section for conditions of WGBS analysis). The total number of covered C sites varied but a total of 637,916 sites (520,629 CHH, 63,702 CHG and 53,585 CG) out of 37,315,277 were covered by at least seven reads in all nine samples. Decreasing DNA methylation levels were observed between the CG, CHG, and CHH contexts (Figure 1B) as in many plants [29,38]. Mapping against the gene models followed a similar trend to that observed when focusing on the entire genome but with lower methylation levels and similar methylation percentages for CG and CHG contexts (Figure 1B). The decreased percentage of methylation observed within the gene models (Figure 1B) suggested that intergenic regions were strongly methylated notably in CG context probably in relation to the hypermethylation of TE sequences. This global methylation profile of C. roseus showed little variation among tissues, which is in agreement with previous observations for other plants [29,38], and strongly similar to apple trees [39] and soybean [40]. This suggests no clear relationship with plant phylogenetic or genome size with methylation patterns, while it has been reported that both DNA methylation (CG and CHG mainly) and TE abundance are positively correlated with genome sizes in plants [27,29,38,41].
Methylation in genes showed a specific depletion in both 5’ and 3’ UTRs in the 3 cytosine contexts (Figure 1C). In addition, intergenic regions together with upstream and downstream sequences had a significantly higher number of Differentially Methylated Cytosines (DMC; pair samples comparison for each cytosine) in the CHG and CHH contexts (Wilcoxon rank sum test, p < 1 × 10 5 ) in contrast to the other features related to gene body (Figure 1D). Contrastingly, gene body methylation (exon, intron and 3’UTR) displayed more DMCs in the CG context than in the two other contexts (p < 0.001). This observation suggests a role of gene body methylation in promoting organ differentiation, as it has been found in Brachypodium dystachion (L.) [42]. However, we observed a depletion of DMCs in the CG context within 5’ UTR regions (p < 0.05; Figure 1D) in addition to the global methylation depletion (Figure 1C). Altogether, these data showed that tissue-specific variations of DNA methylation in/around gene models (in terms of DMC numbers) are context and sequence dependent, with high variations in CG for gene body and in CHG/CHH for regulatory sequences (Up and Downstream), and low levels and variation in the 5’UTR (proximal promoter). While there is emerging evidence that differential methylation plays a role in tissue specific gene expression in plants [17,40,43,44], only few studies have measured methylation at single-base resolution for both DMC and DMR analysis [42]. This last report analyzed variation of DNA methylation in two tissues (leaf and floral bud) in the model grass species B. distachyon. They showed that tissues are similar and most of the observed differences (0.5 to 2.5% of DMC/C sites) occurred in the CHG context within TEs and promoters compared to genes. Here, we confirm in seven different tissue types weak global variations in DNA methylation but with an increased range of affected sites (5 to 13% DMC/C sites). We also highlight that these variations are significantly affecting sequences within or flanking genes in a context-dependent way. For example, we found that promoter regions composed of both 5’UTR and Upstream sequences displayed opposite patterns of methylation and variations in a tissue-specific context analysis.
Focusing on reads mapped onto gene models (+/− 5 Kpb), we further analyzed the differentially methylated cytosines (DMCs) and regions (DMRs) in the different comparisons (Figure 2A). In all comparisons considered among the nine samples, many more DMCs were found in the CG (16,024) and CHG (17,432) contexts than in the CHH context (4667). This difference was however less pronounced at the DMR level (CG: 4374; CHG: 4508; CHH: 2604). Detection of differential methylation at the DMR level has the advantage of integrating several single loci and is probably more robust as reducing stochastic DNA methylation variation and better reflecting the overall DNA methylation status of a genomic region. Here, DMRs in the CG and CHG contexts seemed to encompass many DMCs, as suggested by the difference in DMC and DMR numbers. Large variations were observed in the number of DMCs or DMRs depending on the biological comparison considered. For example, a total of 3202 DMCs were identified between Root and Yleafcat, while only 95 were detected between Distal and Yleaf.
Three clusters of comparisons clearly emerged from the number of DMCs/DMRs (red boxes in Figure 2A): a first group containing the Yleafcat sample displaying many DMCs/DMRs in the CG and CHG context (bottom part of the tree in Figure 2A), a second containing Flow, Yleaf, and Mleaf with fewer DMCs/DMRs and a third group (top part of the tree) with a higher rate of differential methylation in the CHH context. The comparisons could indeed be efficiently separated according to their number of DMC/DMR by a principal component analysis (PCA, Figure 2B). The strongest differences concerned the number of DMCs in the CG (notably DMCs CG in introns) and to a lower extent CHG contexts (highest contribution of the corresponding variable to dimension 1 which represented 52% of the total variance) and clearly separated comparisons involving Root or Yleafcat samples (on the right part of the plot) to the others (on the left part). Dimension 2 represented less variance (12%), and was correlated with the number of DMRs in the CHH context in exons. It thus separated comparisons such as Flow vs. Yleafcat from Root vs. Mleaf for example. Interestingly, this analysis revealed specific patterns in differential methylation across samples, which could be further classified according to their methylation profiles (Figure 2C,D). Indeed, the hierarchical clustering obtained from the number of DMCs/DMRs differed according to the context considered. In contrast, the hierarchical clustering obtained from differentially expressed genes (DEGs) (Figure S2) strongly segregated the five main tissues (Root, Adventitious root, Flower, Mature, and Young leaves). The DMR clustering in CG, CHH and to a lower extent CHG separate organs (Root, Adventitious root, Flower, and leaves samples), although less pronounced, but also one condition (Yleafcat). However, we found a constant group containing Mleaf, Mleafcat, Yleaf, and Distal samples. Fewer DMC/DMR were detected among these samples (Figure 2A).
From a biological point-of-view, these observations indicate that minor changes in cytosine methylation status occurred between Mleaf and Yleaf but also in the mature leaves challenged by caterpillars, Mleafcat vs. Mleaf. By contrast, Aroot, Yleafcat, Root, and Basal samples generally formed separate groups in the hierarchical clustering. These samples were generally associated with more DMCs/DMRs, suggesting they are associated with particular methylation states that may reflect their organ function or response to biotic stress. Indeed, while all samples exhibited similar numbers of hypo or hyper methylated DMCs or DMRs, a large number of hypomethylated DMCs and DMRs were detected when comparing the Yleafcat sample to the other samples (Figure 2E). This specificity can explain the clustering of Yleafcat in our analysis (Figure 2C, D) but also supports a recent report about the depletion in the folate content that decreases global DNA methylation levels, while promoting plant resistance to a bacterial pathogen [45,46]. Thus, folate plays an essential role in the biosynthesis of a precursor of S-adenosylmethionine, the primary methyl group donor for most biological methylations [45,46]. Whether a particular depletion in folate content occurred in Yleafcat remains to be determined, it might be related to the activation of a systemic defense response due to an early folivory event.
Altogether, using 36 pairwise comparisons, our data support the idea that tissue-specific variations in methylation do not occur at random but are rather context-dependent and target specific parts of gene and flanking sequences. In addition, our integrative analysis (Figure 2) using PCA and clustering unraveled the significance of CG methylation for tissue-specificity, and CHG and CHH to a lower extent, besides questioning relationships with differential gene expression (Figure S2).

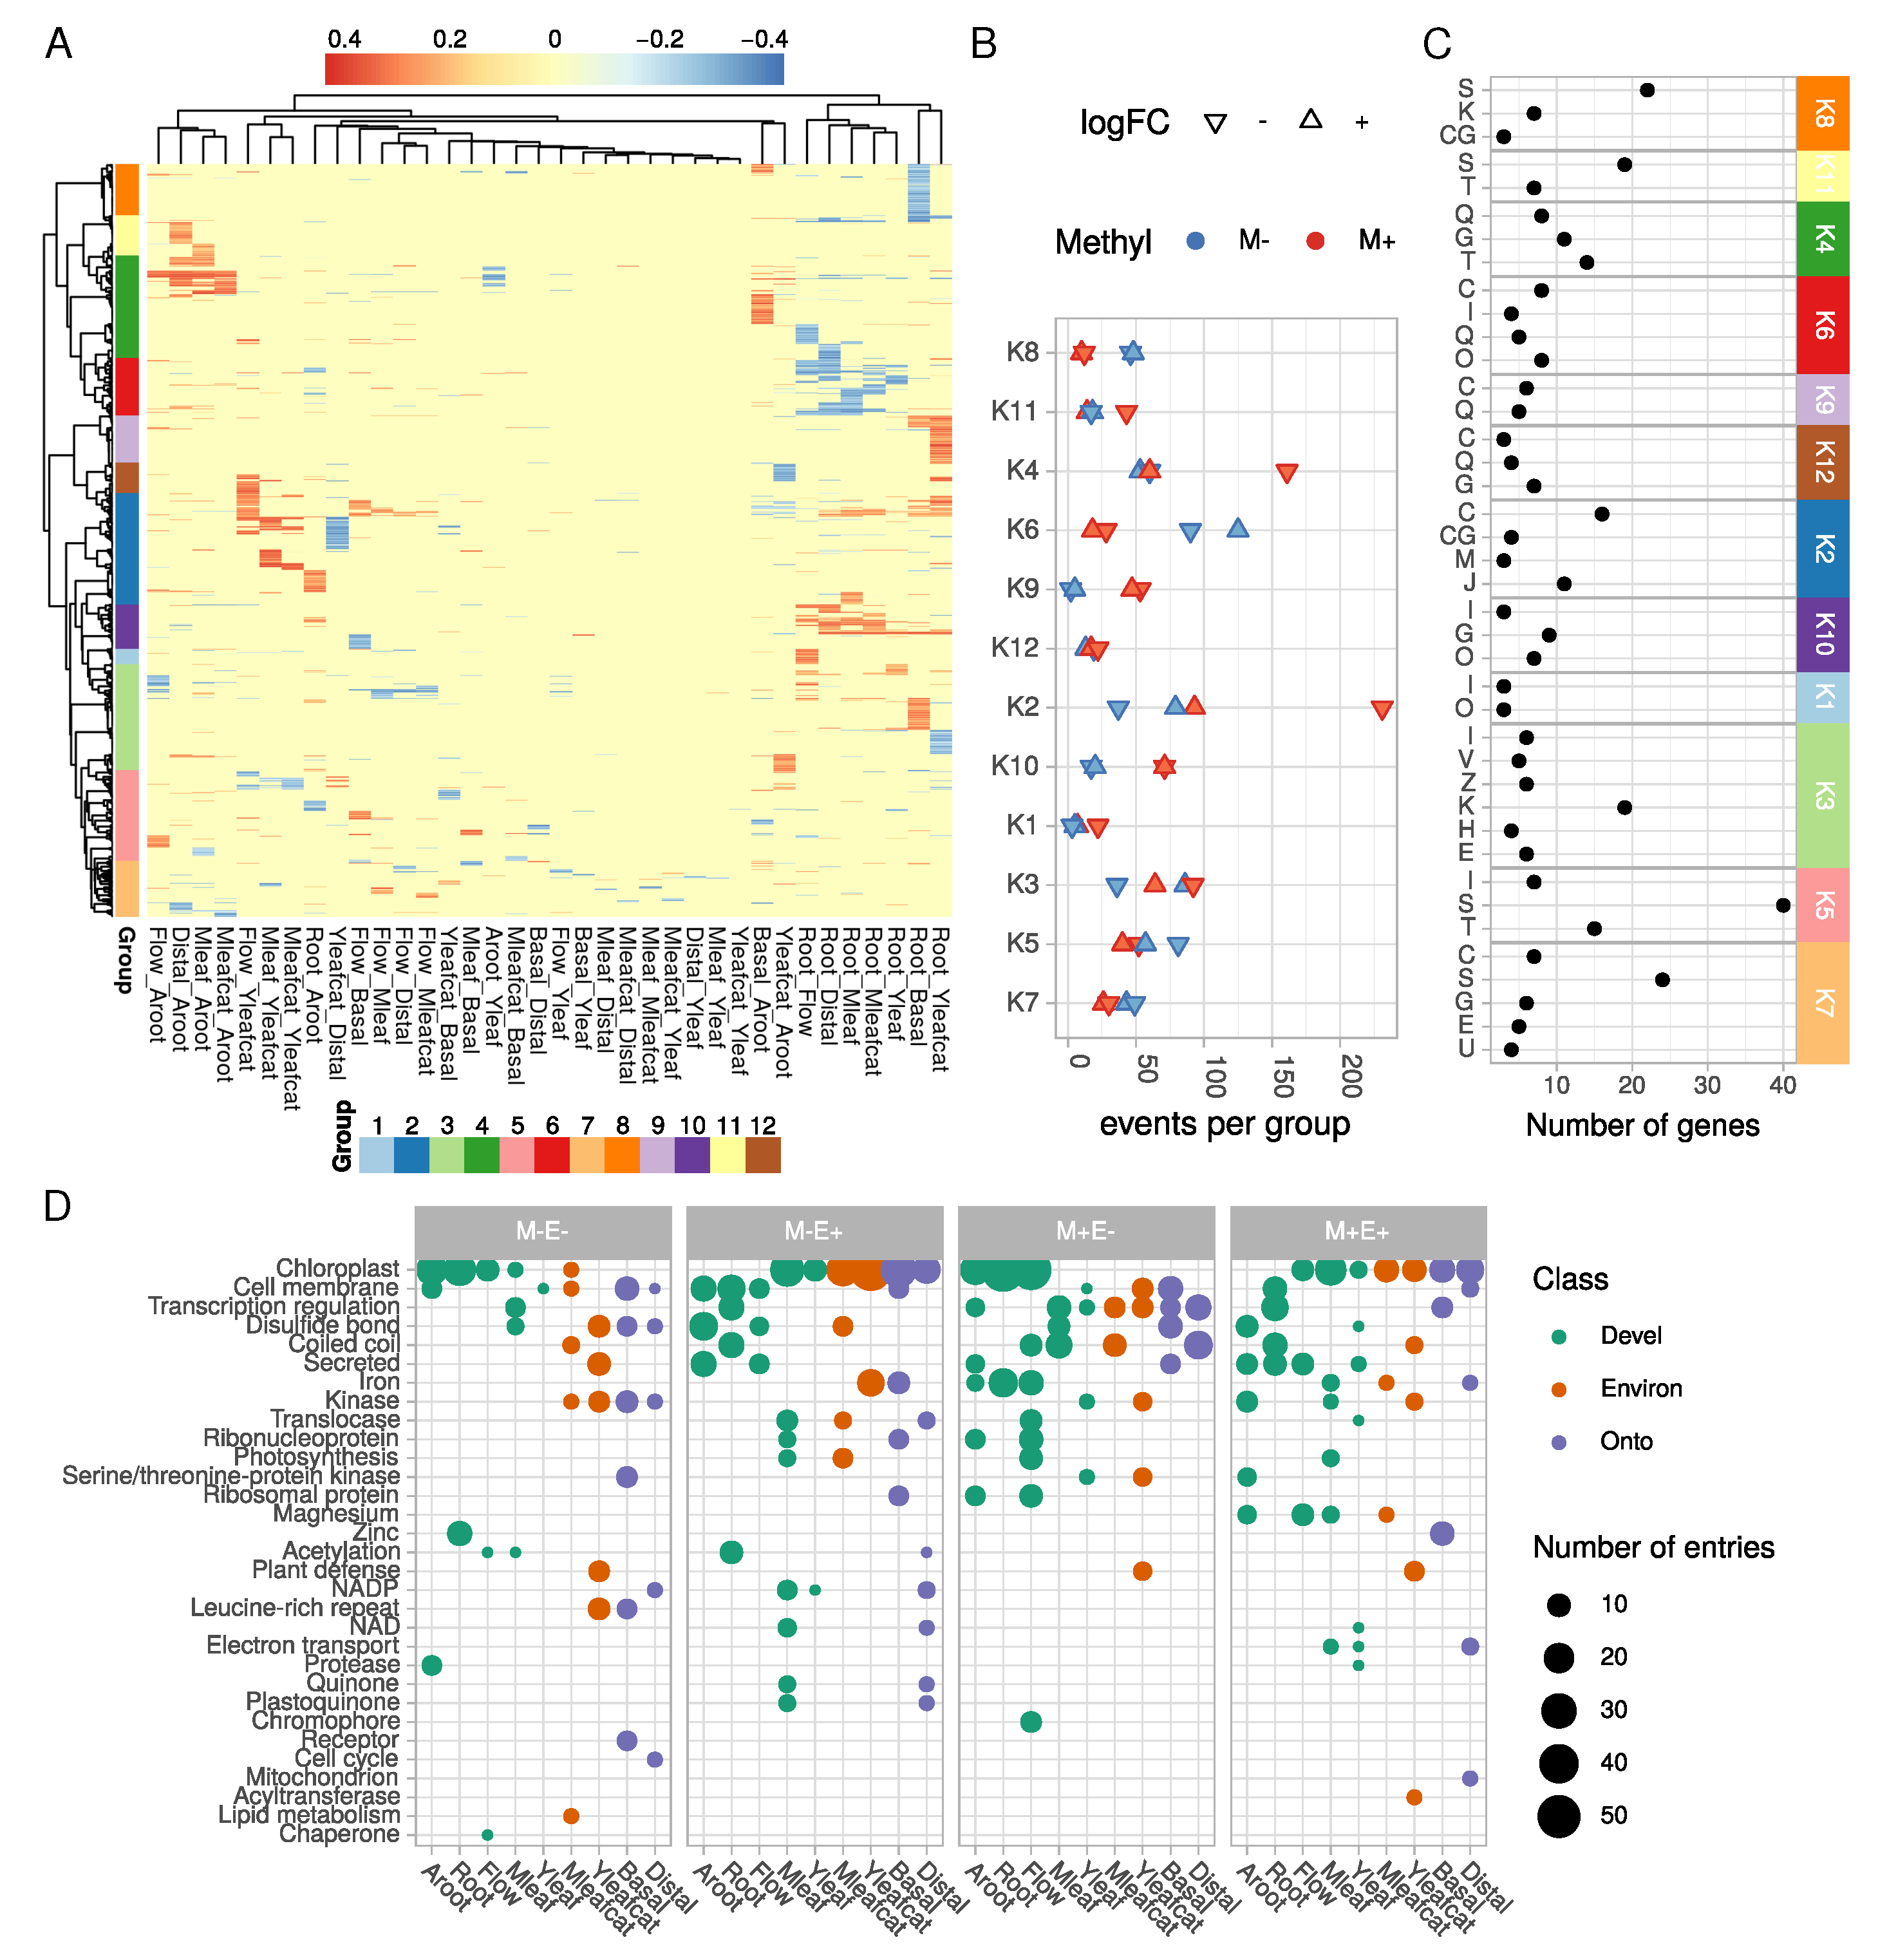
2.2. Tissue-Specific Covariations between Context-Dependent DNA Methylation and Differential Gene Expression May Affect Cellular and Physiological Functions

We next evaluated whether differential DNA methylation correlated with gene expression (Figure 3; Supplmentary Figure S3). A total of 18,839 genes were differentially expressed in at least one comparison (Figure 3A). All comparisons combined, differential methylation concerned 4866 and 3234 gene models at the DMC and DMR levels, respectively. The ratio between the number of genes that were only differentially methylated (DM) and those being simultaneously differentially expressed and methylated (thereafter named DEM) varied across comparisons. Firstly, it was neither linked to the total number of DEGs nor to the total number of DMCs/DMRs (Figure 3A). For example, the highest number of DEGs was found in comparisons between roots and aerial organs, but these comparisons did not display the largest number of DMCs/DMRs. Among gene models displaying DMCs, 22%, 16%, and 28% in the CG, CHG and CHH context, respectively, were also differentially expressed. The lower value in the CHG context was significant (Student’s t-test, p < 0.01) and indicated a lower overlap between differential expression and methylation in this context at the DMC level. Similarly, 28%, 21%, and 27% of the genes harboring DMRs in the CG, CHG, and CHH context, respectively, were also differentially expressed. Such ratios are in accordance with those found in other plants such as Brachypodium [42] where differential CG methylation explained between 1% and 9% of variation of tissue-specific variation in gene expression, soybean [40], or poplar [47]. By contrast, in rice subjected to cadmium stress, a larger overlap between DEG and DMCs/DMRs (>50%) has been detected in aerial parts of the plants [48].
We found that DNA methylation profiles of DEMs differed slightly from that of DM genes (Figure 3B; Figure S3A). It appeared that DNA methylation was higher in differentially expressed genes. Indeed, the absolute difference of averaged methylation levels between DEMs and DM genes significantly differed from 0 in almost all contexts and gene features except UTRs (Wilcoxon rank sum test), while differences among contexts or among features were not significant. This may indicate that methylation of DEM genes may potentially occur in all features and that methylation levels may rather influence gene expression. This observation is somewhat similar to a recent study which used machine learning based algorithms to predict whether a gene is differentially expressed according to its methylation profile [49].
Overall, the relationships between gene expression and methylation level are complex [24,28,50,51]. Correlation may switch from positive to negative values according to environmental variations such as recently described in palm roots exposed to high salinity [52]. In our dataset, we found a significant and negative correlation between methylation in the CG context and gene expression at both DMC and DMR levels (Figure 3C,D; see, for example, CG in introns, Figure S3B. A similar observation has been made in other plant species such as in tea [53]. DMCs/DMRs in the CHH context were globally less frequent in gene bodies and no clear cut relationship emerged between expression and methylation in the upstream or downstream regions. The strong positive correlations observed in Figure 3C within the CHH context are due to few occurrences (e.g., 2 points in exon, 4 in introns). The situation was less contrasted in the upstream and downstream regions of gene models, with more genes showing a positive relationship between methylation and expression (Figure S3B). Whether these observations go beyond a simple correlation remains a matter of debate [54].
Within gene bodies, methylation was more frequently observed in introns and exons than in UTRs and inverse correlations between methylation level and logFC of expression clearly appeared. Although the role of gene body methylation still remains unclear [54], a recent report suggested it may maintain gene expression consistent among cells in A. thaliana roots [55]. Concerning tissue-specificity, our data are in agreement with previous reports showing that CG methylation covaries with differential gene expression between tissues explaining up to 9% of the variation [42]. Similarly, tissue-specific gene expression patterns have been found to be negatively correlated with both gene body and promoter methylation in poplar [44].
We next focused on DMRs and averaged them per gene loci to identify genes that were simultaneously differentially expressed and methylated in the same comparison. According to methylation differences between samples, we were able to detect 12 groups (from K1 to K12) using a correlation-based clustering with a dynamic tree cut [56] (Figure 4A). These groups contained specific gene sets with specific DNA methylation and expression profiles (Figure 4B). Gene functions were functionally analyzed by mapping genes to the Gene Ontology (GO) for each comparison separately (Figure S4). Functions for each of the 12 groups were also analyzed by GO enrichment analysis (Figure S5) as well as by using eggNOG mapping (Figure 4C). The lists of DEMs per cluster and per comparison are given in Tables S1 and S2, respectively, and summarized using their most represented UNIPROT keywords regarding their levels of methylation and expression (Figure 4B). The following sections describe the most relevant biological process where DEMs were identified in the different comparisons.

2.2.1. Photosynthesis

Functional annotation with eggNOG revealed that many genes related to Energy production and conversion (group C, Figure 4C) were differentially methylated in several groups (K2, K6, K7 and K9 especially). Behind this wide-scale annotation, functions related to photosynthesis were found. Our dataset indeed suggests a strong control of the photosynthesis process by DNA methylation. GO term enrichment (Figures S4 and S5) clearly revealed a significant over-representation of genes related to photosynthesis in comparisons involving roots and flowers. We found a good correlation between hypomethylation and increased expression for these genes (Figure 4B and Table S2). It is therefore likely that the establishment of photosynthesis in green tissues may be triggered by a strong hypomethylation of photosynthesis-related genes. Such an epigenetic control of nuclear photosynthesis-related genes has already been observed in Sycamore (Acer pseudoplatanus (L.)) suspension cells [57] and in Chinese white Poplar (Populus x tomentosa (Carrière)) [58]. A recent study also observed a strong correlation between hypomethylation of photosynthesis-related genes and over expression of the corresponding gene in young apple seedlings [59]. Hence, control of this physiological process by DNA cytosine methylation could be a conserved regulatory mechanism. Chloroplast related genes were downregulated while being hypermethylated in roots, flowers, and adventitious roots (Figure 4D). Contrastingly, these genes showed higher expression levels in green tissues accompanied by an hypomethylated state. In fact, mature leaves were expectedly enriched with photosynthesis related genes that were hypomethylated in this tissue. Caterpillar-challenged mature leaves had a slightly modified profile in contrast to mature leaves, with less genes related to photosynthesis. This may be explained by the general reduction in photosynthesis during herbivory or response to wound mediated by the Jasmonic Acid signaling pathway [14,60].

2.2.2. Defense Response

It is well-established that salicylic acid treatments or challenges with phytopathogens trigger strong modification of the DNA methylation state [61,62]. In our dataset, the GO term “defense response” was found to be significantly enriched in several comparisons (Figure S4). For instance, a large reprogramming in the plant defense system characterized the Yleafcat sample (Figure 4D). These leaves were collected from plants one week after having been fed by caterpillars. In this organ, an important increase of MIA has previously been found in contrast to control leaves, suggesting a systemic activation of the plant defense system. DEMs genes in this Yleafcat sample particularly corresponded to transcription factors and kinases (Figure 4D and Table S2). Interestingly, we found an ortholog (CRO_T110712) of the A. thaliana flavin-containing monooxygenase FMO1 (At1g19250), which is known to regulate systemic acquired resistance in distal organs [63]. Its ortholog in C. roseus was significantly higher expressed and hypomethylated in the Yleafcat vs. Distal comparison. In addition, several defense-related genes were overexpressed and hypermethylated in roots, including two LRR encoding genes, CRO_T111352 and CRO_T110750, and a transcriptional activator of Pathogenesis-related gene transcriptional activator CRO_T108223 (Figure S4 and Table S1).

2.2.3. Cell Signaling

Several significantly enriched GO terms were related to signaling and regulation of transcription (Figure S5). For example, genes encoding transcription factors such as DIVARICATA (CRO_T102972) and TCP8 (CRO_T111367) were hypomethylated and higher expressed in roots relative to aerial organs (leaf distal part, flower, and mature leaf). A similar pattern was found for an ortholog of A. thaliana BHLH32 (AIG1) (CRO_T104017) known to be involved in root initiation [64]. Two auxin related genes overexpressed in roots were found (an Auxin efflux carrier component 1, CRO_T110218, and a Serine/threonine-protein kinase D6PKL2, CRO_T110370), as well as a cytokinin response regulator (ARR6, CRO_T102339) and an ethylene response factor (CRF4, CRO_T101572). Homologs of transcription factors such as ethylene related AtRAV1 or zinc finger ZAT9 were overexpressed and hypomethylated in adventitious roots. Similar modifications were also found for an UGT74E2 ortholog (CRO_T110662), which is known to regulate A. thaliana architecture by modifying auxin fluxes [65]. Such modifications in the DNA methylation levels may control the global auxin signaling pathway [66].

2.2.4. Specialized Metabolism

Several genes related to secondary metabolism were identified to be more expressed and hypomethylated in adventitious roots (groups K4 and K11, Figure 4). A CYP72-encoding gene (CRO_T103884) potentially related to the secoiridoid metabolism was particularly overexpressed in adventitious roots vs. distal leaf parts. Two potentially MIA related genes were overexpressed and hypermethylated in roots in contrast to green tissues, an acetyltransferase (CRO_T108440) and an ethylene response factor named ORCA2 (CRO_T110365). Some specialized metabolism-related genes were overexpressed and hypomethylated in roots in contrast to basal leaf parts, as we found for a CYP72 (CRO_T106493), a CROCETIN GLUCOSYLTRANSFERASE (CRO_T108522), and a 7-DEOXYLOGANETIN GLUCOSYLTRANSFERASE LIKE (CRO_T106923).
Altogether, these functional analyses demonstrate that differentially methylated and expressed genes can be clustered into 12 functional groups reflecting broad processes such as stress response, photosynthesis, hormone signaling, and specialized metabolism. These clusters are in good agreement with the nature and characteristics of each sample and may participate in their cellular and physiological tissue-specificity.

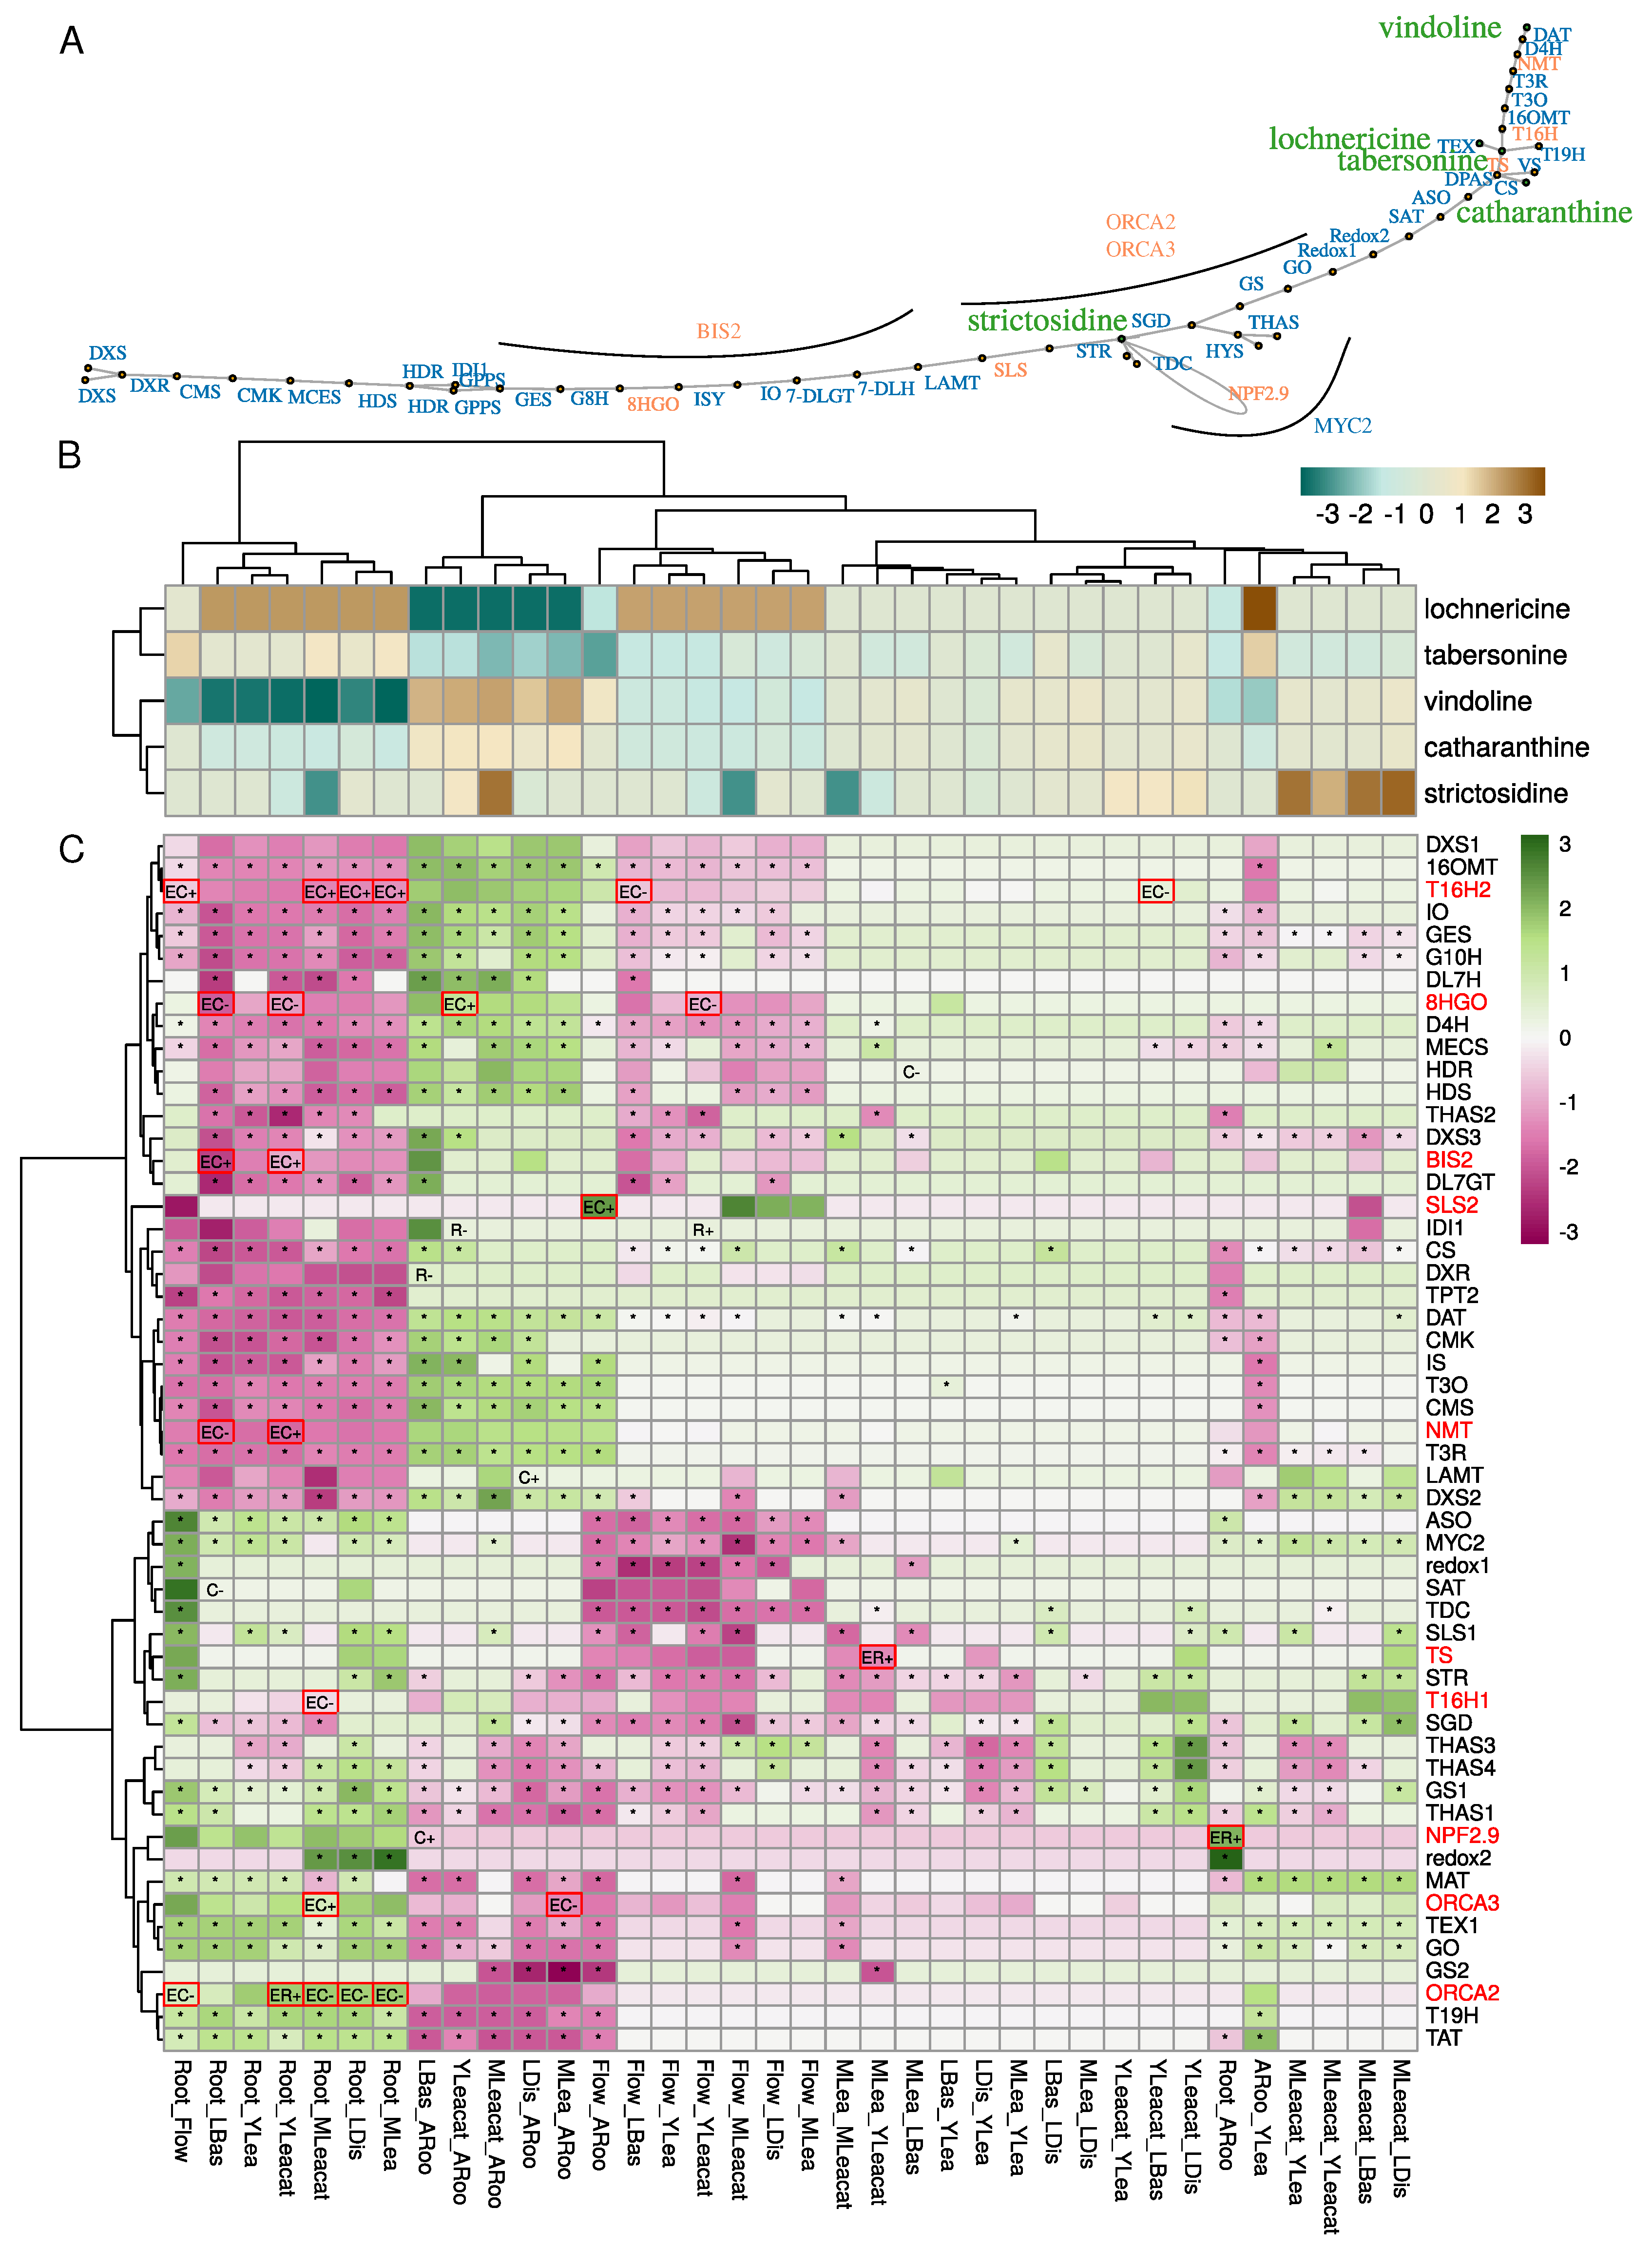
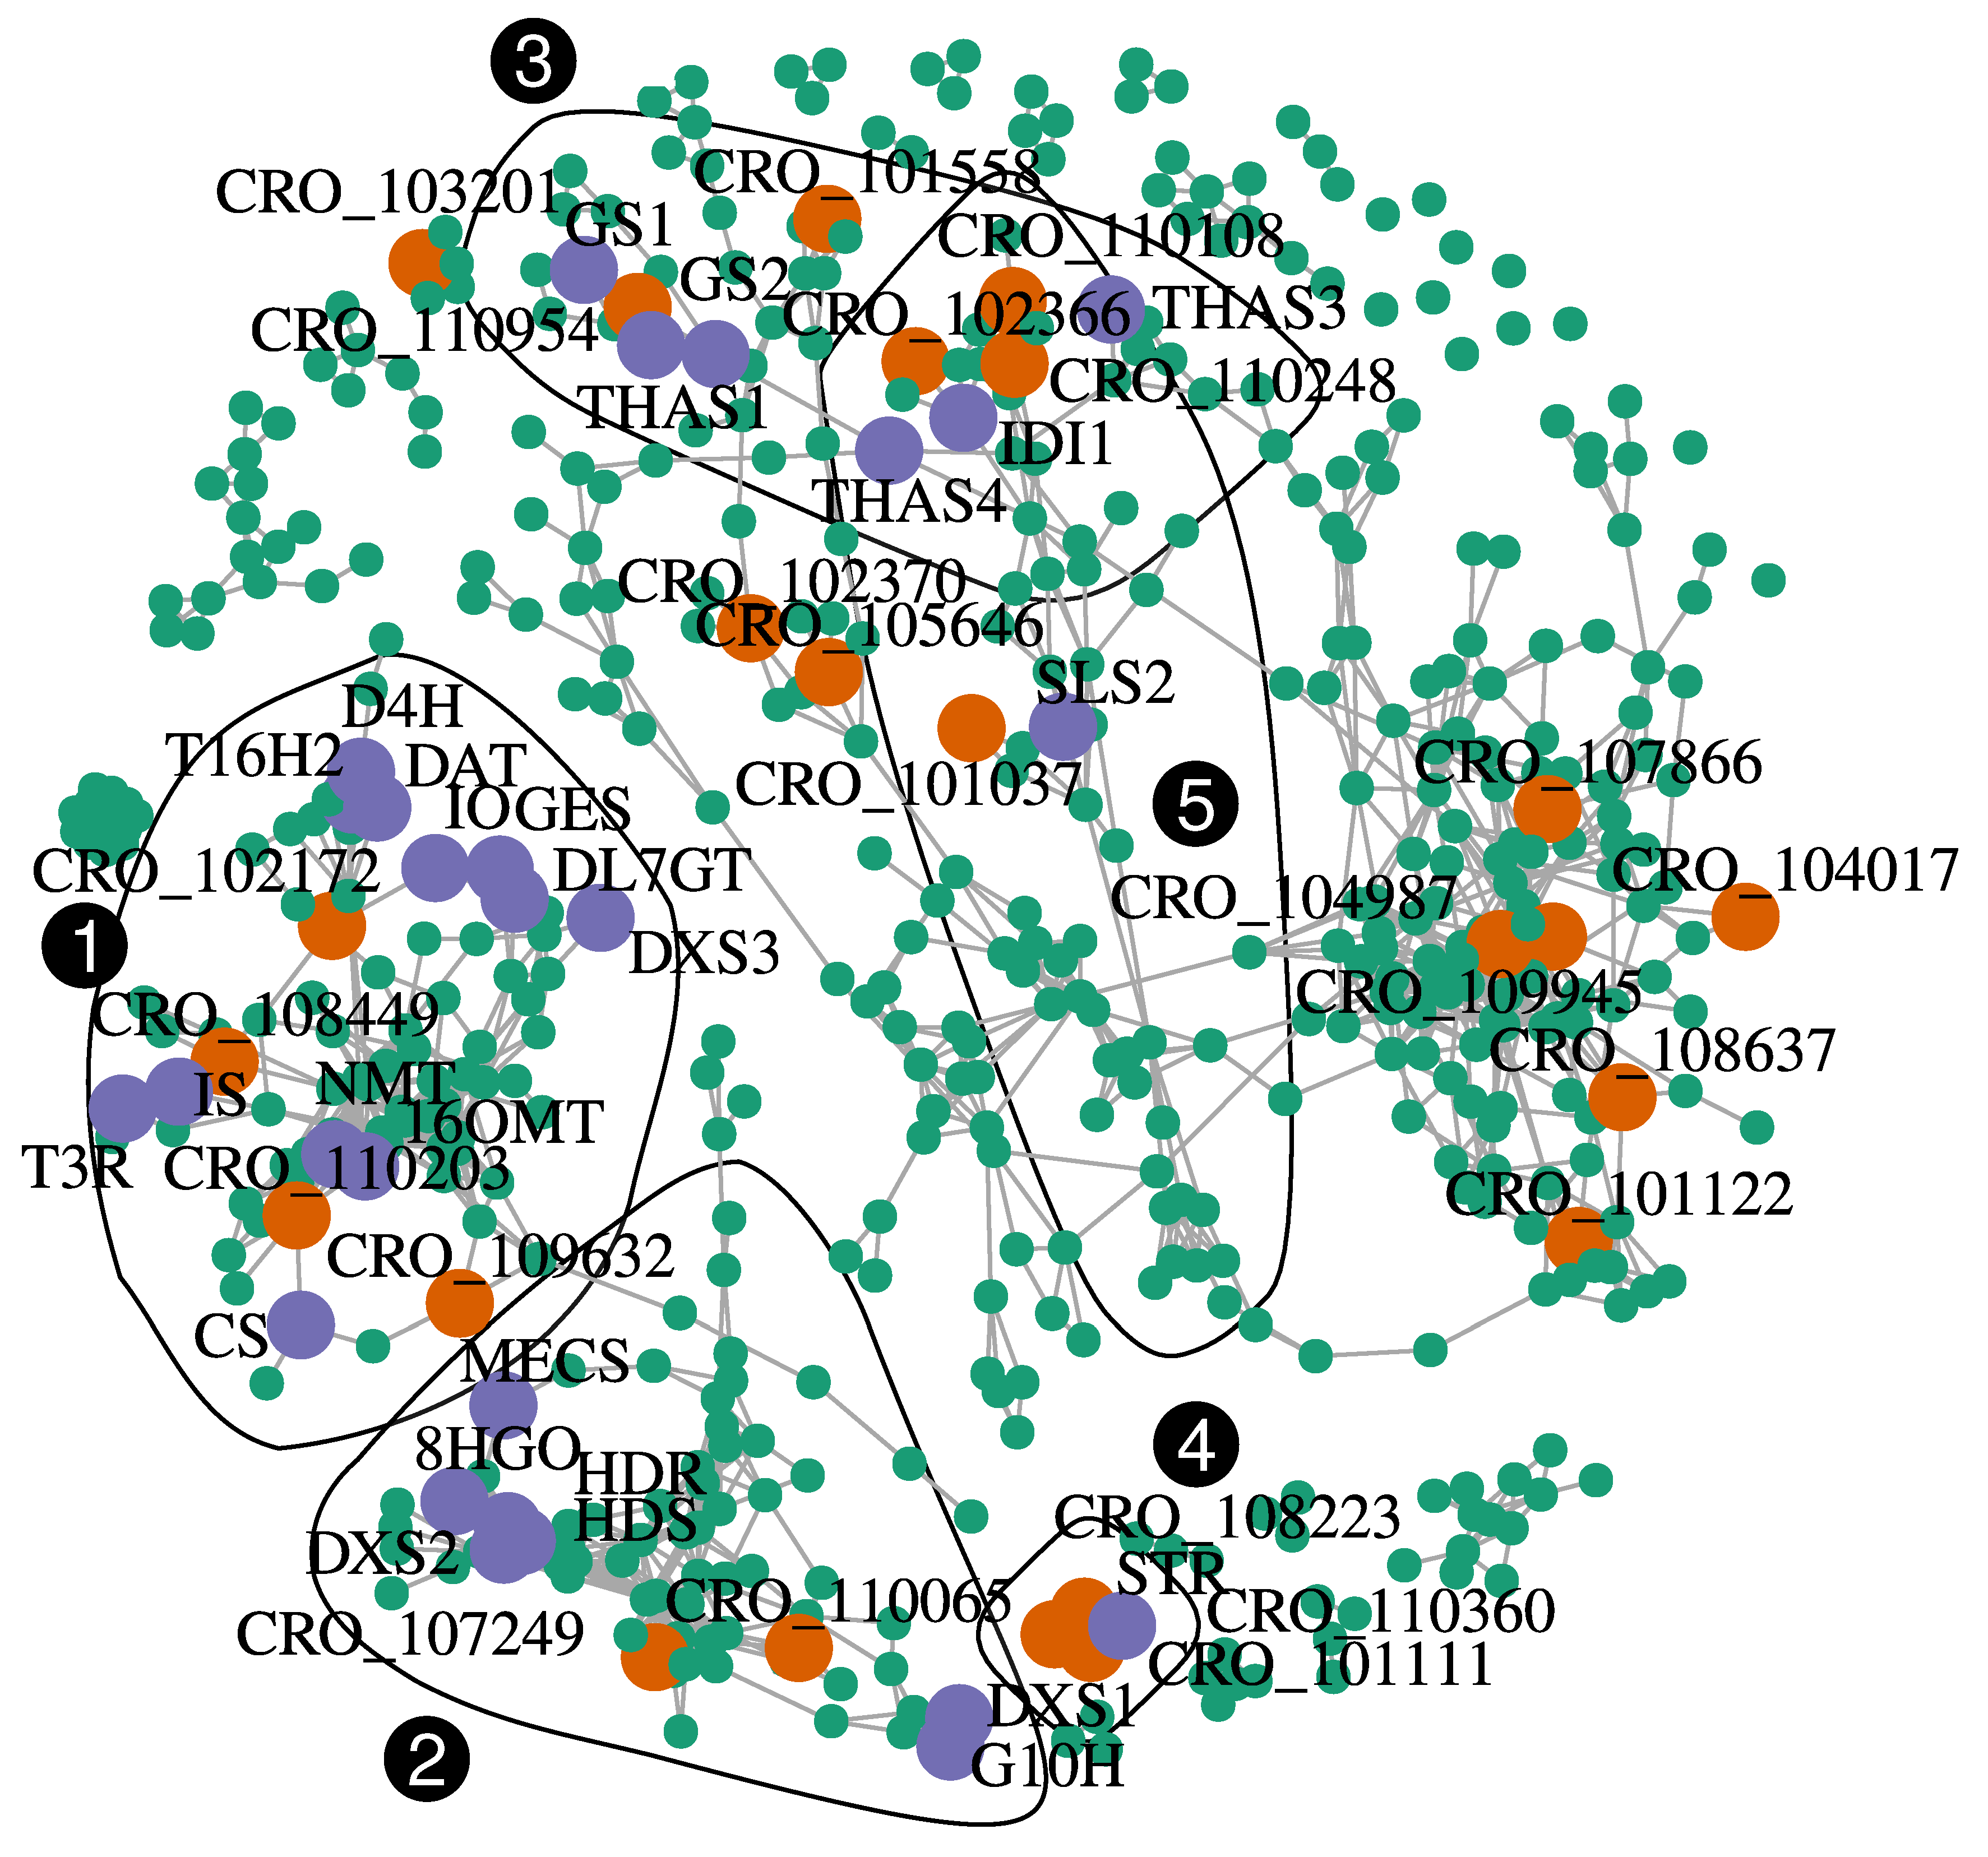
2.3. Control of the Monoterpene Indole Alkaloid (MIA) Pathway Involves Variations in DNA Methylation in Genes Encoding Enzymes and Transcription Factors

C. roseus accumulates many MIAs following an organ- and tissue-specific distribution (Figure 5A,B). Results from previous LC-MS analyses of alkaloid content revealed for instance that major MIAs in aerial parts are vindoline and catharanthine. Tabersonine derivatives such as lochnericine are more specific to roots. Expression profiles of MIA related genes correlate well with this spatial separation as illustrated by T19H (encoding the TABERSONINE 19 HYDROXYLASE) and TAT (encoding the 19-HYDROXYTABERSONINE ACETYL-TRANSFERASE) which were clearly more expressed in roots and adventitious roots (Figure 5C). Genes involved in the conversion of tabersonine to vindoline (T16H2, 16OMT, T3O, T3R, NMT, D4H and DAT) were more strongly expressed in green organs, but not in flowers in agreement with vindoline accumulation [6]. Some genes were also strongly induced in Mleafcat, such as LAMT (encoding the LOGANIC ACID METHYLTRANSFERASE) and SGD (encoding the STRICTOSIDINE GLUCOSIDASE). Due to their contrasted expression, we focused specifically on the methylation status of MIA genes to determine whether DNA methylation might participate in regulating their expression levels.
MIA genes clearly display specific expression profiles and many were differentially expressed in the conditions investigated here (Figure 5C). We found 10 MIA genes out of 55 that were simultaneously differentially methylated and expressed (Figure 5C) and distributed along the MIA pathway (Figure 5A). Most of the differentially methylated loci were found in the upstream or downstream parts of gene models (Figure S6). Eight MIA genes contained DMCs (8HGO, SLS2, T16H1, T16H2, and NMT), as well as the three transcription factors (BIS2, ORCA2, and ORCA3) and four MIA genes contained DMRs (a strictosidine transporter NPF2.9, TS, NMT and ORCA2). Correlations between methylation and expression levels were globally negative (DMC: Pearson’s correlation coefficient −0.55, p = 0.002; DMR –0.95, p = 0.0002), suggesting a strong negative impact of DNA methylation on MIA gene expression. BIS2 encoding gene was hypermethylated in the CHG context in roots relative to Basal and YLeacat, while showing high expression levels in these two samples. T16H2 followed a similar pattern in roots (hypermethylated, less expressed) relative to flower, Distal, and Mleaf.
Among the DEM genes, the TABERSONINE SYNTHASE (CRO_110304 = TS) was more strongly expressed in young leaves from previously attacked plants (YLeafcat) in contrast to mature leaves (MLea). This gene belonged to group K2 (Figure 4) and was hypomethylated in Yleafcat in the downstream part (Figure S6). This is in accordance with the higher accumulation of vindoline in young leaves collected from previously challenged plants (Figure 5B). Indeed, the lower tabersonine accumulation in these tissues may be related to the increased expression of genes from the vindoline pathway and the resulting conversion of tabersonine into vindoline (Figure 5C). The gene encoding the transcription factor ORCA2 displayed two DMRs in the upstream and downstream regions, respectively (Figure S6). The hypermethylation in these regions corresponded to a higher expression in roots vs. mature leaves (Mleaf), attacked mature leaves (Mleafcat), and young leaves from previously fed plants (Yleafcat). ORCA2 was indeed very weakly expressed in these green tissues. On the other hand, NMT was hypomethylated and more strongly expressed in young leaves from fed plants in contrast to roots. Because vindoline biosynthesis is inactive in roots and stimulated in Yleafcat (Figure 5B), its hypomethylation could be a mechanism to increase expression of vindoline biosynthetic pathway genes during the establishment of a systemic defense response.
In comparison with the hypomethylated state of flavonoid biosynthetic genes increasing both their expression and anthocyanin accumulation in apple fruit skin [33], methylation of MIA genes may appear as limited. A recent study has reported an inverse correlation between a P450 encoding gene methylation level and its expression [67]. Expression was induced upon Jasmonic Acid elicitation in seedlings of Platycodon grandiflorus and related to a higher accumulation of the triterpenoid saponin platycoside. Again, this was unlikely the case for the MIA in C. roseus. We may however envision that central transcription factors may be epigenetically regulated and which in turn control the expression of multiple downstream genes. Accordingly, we found three MIA-related transcription factors among our DEMs (Figure 5). In addition, we investigated whether other transcription factors in our DEMs may be co-expressed with MIA genes. Pairwise Spearman correlations between MIA and all DEM genes were calculated and relationships with a Spearman’s rho > 0.95 were kept for final network construction and visualization (Figure 6; Table 1).
MIA genes formed at least three tightly connected groups. A first one (community 1) containing the vindoline-related genes T16H2, 16OMT, T3R, NMT, D4H, and DAT. Co-expressed to these genes were also found many genes related to the seco-iridoid branch (GES, IS, IO, and DL7GT). The second one (community 2) contained genes related to terpene precursors (DXS1, DXS2, HDS, HDR, and MECS), seco-iridoids (G10H and 8HGO). The third main group contained genes encoding strictosidine aglycone processing (GS1, GS2, THAS1, THAS3, and THAS4). A total of 24 transcription factors were found in the co-expression network (Table 1). In the first group (community 1, Table S3), four transcription factors were found to be co-expressed with the MIA genes indicated above: a regulator of phloem development (CRO_T102172), a bHLH (CRO_T109632), a positive regulator of gibberellin action (CRO_T108449), and a WUSCHEL-related homeobox protein encoding gene (CRO_T110203). We also found three transcription factors co-expressed with the second main group: 2 bHLH (CRO_T107249 and CRO_T110065) associated with pollen maturation in A. thaliana and a Myb-related protein (CRO_T107392). These two groups were tightly connected with the regulation of developmental processes. This suggests a strong coordination between MIA biosynthesis and the plant developmental program, as it has been previously observed [68]. Only one transcription factor was co-expressed with the third community containing genes encoding enzymes using strictosidine aglycones as substrate, a bHLH transcription factor (CRO_T110954). In addition to these three communities, we found that ORCA3 and STR were strongly co-expressed (Figure 6). This was expected because it has previously been shown that MYC2 promotes STR expression through ORCA2 and ORCA3 [17,69]. In this small community, two other transcriptional activators were detected, a bHLH (CRO_T101111), and a Pathogenesis-Related gene transcriptional activator (CRO_T108223). Similarly to ORCAs, the latter also binds to the GCC box of defense related genes. Among the four transcription factors co-expressed with SLS2, and IDI1, two genes encoded bHLH (CRO_T102366 and CRO_T110248). Interestingly, CRO_T110248 is an ortholog of A. thaliana ICE1 which codes a factor promoting stomatal differentiation in epidermis [70]. Because enzymatic steps in the MIA pathway are located in leaf epidermis after the DL7GT step, it might be relevant that late steps leading to strictosidine (LAMT, SLS, and STR) may be also developmentally regulated.
Altogether, our data show that a substantial number (10 out 55) of the MIA genes are differentially methylated and expressed. These genes exhibited strong correlation between DNA methylation and expression changes in agreement with the tissue-specific MIA accumulations. They also include critical enzymes of the pathway described as bottlenecks for MIA synthesis including 8HGO, SLS, and T16H [6,71,72]. This is also the case for NPF2.9 which controls strictosidine export from the vacuole [73]. Strictosidine is the precursor of all downstream MIAs and controlling its subcellular distribution could help to control the pathway activity. Biosynthesis of catharanthine and tabersonine only differs in the last step which is catalyzed either by the CATHARANTINE SYNTHASE (CS) or the TABERSONINE SYNTHASE (TS) [11,74]. Hence, a tight regulation of this last step may help to redirect metabolic fluxes towards either catharanthine or tabersonine and its associated derivatives such as vindoline. The hypomethylation and overexpression of TS in young leaves from previously fed plants could thus be an important regulation mechanism to control such fluxes as a plant defense response. TS has been shown to interact more strongly with the previous enzymes DPAS (DEHYDROPRECONDYLOCARPINE ACETATE SYNTHASE) than CS [11], reinforcing its crucial and possibly regulatory role in this bifurcation. In addition to this direct regulation of expression of biosynthesis-related genes by differential methylation, we found the concomitant differential methylation and expression of three major transcription factors controlling the MIA pathway. This suggests that DNA methylation may modulate MIA pathway activity by acting on upstream regulatory components. Complementary to this, 24 co-expressed transcription factors were among DEM genes suggesting a possible involvement in controlling the tissue-specificity of the MIA pathway.

3. Materials and Methods

3.1. Plant Material

Catharanthus roseus plants (cv. Apricot Sunstorm) were grown in a greenhouse under artificial light with a photoperiod of 16 h/8 h at 28 ° C/23 ° C. Different plant parts were collected (Figure 1; Table 2) and snap-frozen in liquid nitrogen and stored at −80 ° C before processing. When possible, all samples were taken from the same plants and at least 10 biological replicates were prepared from ca. 3 month-old plantlets. Roots (Root) were quickly washed with sterile ultrapure water and dried before freezing. Old root parts (showing a brown aspect and strongly lignified) were discarded. Flower buds (Flow) were collected together with their peduncles. Mature (Mleaf) and young leaves (Yleaf) corresponded to the third and first fully expanded leaves respectively. Basal (Basal) and distal (Distal) parts were obtained by splitting young leaves in half. Herbivory treatments were performed as previously described [14]. Manduca sexta caterpillars (L3 stage) were dropped on third expanded leaves and allowed to feed for three hours and subsequently removed. Plants were kept if at least 25% of the attacked leaf was removed by the caterpillars. On one hand, damaged mature leaves were collected 24 h after the attack (Mleafcat). On the other hand, plants were maintained in the greenhouse and the first fully expanded leaf was collected one week after (Yleafcat). Adventitious roots were obtained from cuttings as described in [10]. Briefly, shoots were cut from their roots and maintained in tap water until white and soft adventitious roots appeared (usually within one month).

3.2. Whole Genome Bisulfite Sequencing (WGBS)

DNA was extracted from at least 10 individuals per sample type using the modified Trizol (Life Technologies) procedure involving the Back Extraction Buffer according to the manufacturer’s recommendations. The molarity of the samples was assessed by qPCR using the KAPA Library Quantification Kit from Roche and the size of samples was determined with the LabChip GX Touch Nucleic Acid Analyzer and the HT DNA 1K/12K/High sensitivity chip from PerkinElmer. Samples were pooled in equimolar conditions for library preparation. Whole-genome bisulfite sequencing was performed with the Ovation Ultralow Methyl-Seq System from NuGEN following the published procedure (http://www.nugen.com/products/ovation-ultralow-methyl-seq-library-systems) adapted from [75]. The resulting DNA library was purified and bisulfite converted. A qPCR assay was used to determine the optimal number of PCR amplification cycles (between 10 and 15 cycles) required to obtain a high diversity library with minimal duplicated reads prior to final library amplification. The sequencing was performed with paired ends (2 × 150 bp) on an Illumina HiSeq4000 platform. Raw data were stored in FASTQ files (SRA record is under the reference PRJNA635601, see Table 2).

3.3. Epigenomics Data Generation and Analysis

The bioinformatics pipeline used in this study is adapted from the ENCODE pipeline (https://www.encodeproject.org/wgbs/) and installed in a Galaxy framework (http://bioinfo.univ-perp.fr/, Perpignan, France). First, quality control and cleaning of the raw data were carried out by only considering nucleotides with a quality score over 26, and reads which had more than 95% of their nucleotides over this quality threshold. The second step was the alignment of the WGBS reads on the latest available genome sequence (https://doi.org/10.5061/dryad.08vv50n) [3] by using BISMARK (version 0.16.3, [77] and Bowtie 2 tools (version 2.1.0; [78]). Due to sequenced genome quality (2090 scaffolds in version 2, N residues in intergenic sequences), BSMAP version 2.74 [79,80] was used to measure DNA methylation levels at each cytosine site on a reduced representation consisting on gene models (34,363) including 5 Kbp flanking regions. All data were processed in R [81]. Multidimensional scaling was performed using only sites covered by at least seven reads were kept as recommended in the EdgeR differential methylation detection procedure [82]. Differential methylation in pairwise sample comparisons was detected following the DSS procedure [83]. It models the biological variation using neighboring C sites as pseudo-replicates and automatically adjusts library coverage differences. DMC were kept when the differential methylation p-value was below 0.05 (gene-wise Wald test on two-group comparisons). DMR were detected when at least 3 DMC were present in the same region of at least 50 bp. In addition, we summarized DMR at the gene levels by averaging methylation differences to give more robustness to the analysis [42] (Figure 4A and Figure 5).

3.4. Transcriptome Analysis

Gene expression was obtained from previously published RNA-seq data as well as new samples (flowers, basal, and distal parts of young leaves, deposited as project accession number PRJEB38854, see Table 2). RNA were obtained from plants as described above using a Trizol-based extraction [14]. Libraries prepared with the Illumina TruSeq RNA Library Prep Kit v2 were sequenced by Eurofins Genomics using the Illumina HiSeq2000/2500 technology, in the paired-end mode (2 × 100 pb). Sequencing runs yield a total of 25,352,619, 20,959,861, and 17,313,293 reads for samples ERR4235477, ERR4235478, and ERR4235479, respectively. Reads were first trimmed with FastP v0.20 [84] using default parameters and next pseudo-aligned on transcripts predicted from the second C. roseus genome version [3] and quantification was performed with Salmon v0.14 [85]. Differentially expressed genes were identified using the EdgeR R package [86], using a biological coefficient of variation of 0.2. Genes were considered as differentially expressed if the p-value of the exact test on the binomial fit were below 0.05.

3.5. Metabolite Analysis

Alkaloid content in samples depicted in Figure 5B was obtained from a meta-analysis of our previously published results. Briefly, flash-frozen samples were lyophilized and extracted in methanol. Strictosidine, tabersonine, lochnericine, vindoline, and catharanthine were quantified on the same cultivar (Apricot Sunstorm) in the diverse tissue types [6,10,14] using a LC-MS/MS apparatus. Identification was confirmed by retention times and mass spectra of authentic standards.

3.6. Statistical Procedures

All analyses were made within the R programming language [81]. Tables were all used in the data.table format [87]. All graphs were made with the ggplot2 package [88], together with the ggdendro [89] and ggrepel [90] extensions. The PCA in Figure 2 was constructed with the FactoMineR package [91]. Correlations in Figure 3C,D were calculated with the Pearson coefficient and tested with Pearson’s product moment correlation coefficient. Heatmaps were plotted with the pheatmap package [92]. Hierarchical trees were constructed with the Ward agglomeration criterion on Euclidean distances. Groups of DEM in Figure 4 were detected using a dynamic tree cutting algorithm [56] with a minimum cluster size of 30. Functional analysis of genes was performed by transferring annotations from Uniprot homologs (blastx, [93]) or using the eggNOG mapper [94]. Functional term (GO or Uniprot keywords) enrichment was tested using a hypergeometric distribution Figures S4 and S5). P-values were adjusted using the Bonferroni correction. The gene co-expression network (Figure 6) was constructed using a Spearman’s rho-based distance matrix and the igraph package [95]. Significant correlations were retained if rho > 0.95. When applicable, differences between treatments were calculated using the Student’s t-test or the non-parametric Wilcoxon rank sum test.

4. Conclusions

Our present study reports the first methylome using WGBS for the medicinal plant C. roseus with DNA methylation signatures specific to organs, ontogenesis, and environmental variations and their relationship with gene expression and MIA accumulation. Focusing on genes whose methylation state and expression levels varied significantly between samples, we found significant relationships depending on cytosine context and gene parts between DNA methylation and expression. In particular, variation of DNA methylation up- and downstream of genes as well as on CG (introns) or CHH (exons) sites may participate in modulating tissue-specific gene expression. This was clearly the case for the 12 functional detected gene groups involved in photosynthesis, stress response, hormone signaling, and specialized metabolism in agreement with the nature and characteristics of each tissue. This was also the case for the MIA pathway where 10 genes were found whose differential methylation and expression correlated with the tissue/organ/developmental/environmental specific MIA accumulations and their critical roles in MIA synthesis. These genes correspond to enzymes and to the three major transcription factors of the MIA pathways. In addition, 24 co-expressed transcription factors were identified and may participate in controlling the tissue-specificity of the MIA pathway. Therefore, DNA cytosine methylation seems to directly regulate expression of genes encoding enzymes and transcription factors, which in turn may indirectly promote or inhibit the expression of downstream MIA-related genes. While our integrative analysis supports a role of DNA methylation in the developmental and environmental control of specialized metabolisms in plants, other epigenetic modifications such as those targeting histones and non-coding RNAs deserve further investigations. The potential coordination between epigenetics and hormonal controls [96] for specialized metabolisms is also a future challenge and notably in the frame of improving the production of secondary metabolites for pharmaceutical applications using plant biotechnologies.

Supplementary Materials

The following are available online at https://www.mdpi.com/1422-0067/21/17/6028/s1, Table S1: Annotation of differentially expressed and methylated (DEM) genes per group, Table S2: Annotation of differentially expressed and methylated (DEM) genes per comparison, Table S3: Annotation of differentially expressed and methylated (DEM) gene co-expressed with MIA genes, Figure S1: Number of WGBS reads per sample, Figure S2: Classification of samples according to the number of DEGs, Figure S3: Differences in DNA methylation profiles of DEM and DM genes and relation between DNA methylation and expression, Figure S4: Functional characterization of differentially expressed and methylated (DEM) genes by comparison, Figure S5: Functional characterization of differentially expressed and methylated (DEM) genes by cluster, Figure S6: Locations of DMC and DMR in differentially expressed and methylated genes in the MIA pathway.

Author Contributions

Conceptualization, V.C., S.E.O., and S.M.; methodology, V.C., S.M., and A.D.; validation, C.D., J.T., and C.C.; formal analysis, T.D.d.B.; investigation, T.D.d.B. and S.M.; data curation, T.D.d.B., A.D., C.D., J.T., and C.C.; writing—original draft preparation, T.D.d.B. and S.M.; writing—review and editing, V.C., S.E.O., J.T., and C.C.; visualization, T.D.d.B. and S.M.; supervision, V.C. and S.M.; funding acquisition, V.C. and S.M. All authors have read and agreed to the published version of the manuscript

Funding

This research was funded by the “Région Centre Val de Loire” (France, ABISAL, and CatharSIS grants) and the University of Tours.

Acknowledgments

We also thank Jean-Louis Rouet and Laurent Catherine for access and support to the CCSC computing resources (Cascimodot Federation, CNRS, Orléans). We acknowledge the GenOuest bioinformatics core facility (https://www.genouest.org) and the IHPE Galaxy Perpignan (https://bioinfo.univ-perp.fr/) for providing the computing infrastructure. Hao Wu is acknowledged for his help with the DSS package, Elisabeth Huguet and Karine Musset for the help with the caterpillar experiments and Florent Lafontaine for the technical help with DNA extraction. We thank Anne-Laure Le Gac, Régis Fichot, Christoph Grunau, and the collaborative GDR3E network (https://rtp-3e.wixsite.com/rt3e) for helpful discussions concerning methylome analysis.

Conflicts of Interest

The authors declare no conflict of interest. The funders had no role in the design of the study; in the collection, analyses, or interpretation of data; in the writing of the manuscript, or in the decision to publish the results.

Abbreviations

The following abbreviations are used in this manuscript:
WGBSWhole-Genome Bisulfite Sequencing
DMCDifferentially Methylated Cytosine
DMRDifferentially Methylated Region
DMDifferentially Methylated
DEGDifferentially Expressed Gene
DEMDifferentially Expressed and Methylated
MIAMonoterpene Indole Alkaloid
GOGene Ontology

References

  1. Courdavault, V.; Papon, N.; Clastre, M.; Giglioli-Guivarc’h, N.; St-Pierre, B.; Burlat, V. A look inside an alkaloid multisite plant: The Catharanthus logistics. Curr. Opin. Plant Biol. 2014, 19, 43–50. [Google Scholar] [CrossRef]
  2. Dugé de Bernonville, T.; Clastre, M.; Besseau, S.; Oudin, A.; Burlat, V.; Glévarec, G.; Lanoue, A.; Papon, N.; Giglioli-Guivarc’h, N.; St-Pierre, B.; et al. Phytochemical genomics of the Madagascar periwinkle: Unravelling the last twists of the alkaloid engine. Phytochemistry 2015, 113, 9–23. [Google Scholar] [CrossRef]
  3. Franke, J.; Kim, J.; Hamilton, J.P.; Zhao, D.; Pham, G.M.; Wiegert-Rininger, K.; Crisovan, E.; Newton, L.; Vaillancourt, B.; Tatsis, E.; et al. Gene discovery in gelsemium highlights conserved gene clusters in monoterpene indole alkaloid biosynthesis. Chembiochem 2019, 20, 83–87. [Google Scholar] [CrossRef] [Green Version]
  4. Kellner, F.; Kim, J.; Clavijo, B.J.; Hamilton, J.P.; Childs, K.L.; Vaillancourt, B.; Cepela, J.; Habermann, M.; Steuernagel, B.; Clissold, L.; et al. Genome-guided investigation of plant natural product biosynthesis. Plant J. Cell Mol. Biol. 2015, 82, 680–692. [Google Scholar] [CrossRef]
  5. She, J.; Yan, H.; Yang, J.; Xu, W.; Su, Z. croFGD: Catharanthus roseus Functional Genomics Database. Front. Genet. 2019, 10, 238. [Google Scholar] [CrossRef] [PubMed] [Green Version]
  6. Besseau, S.; Kellner, F.; Lanoue, A.; Thamm, A.M.K.; Salim, V.; Schneider, B.; Geu-Flores, F.; Höfer, R.; Guirimand, G.; Guihur, A.; et al. A pair of tabersonine 16-hydroxylases initiates the synthesis of vindoline in an organ-dependent manner in Catharanthus roseus. Plant Physiol. 2013, 163, 1792–1803. [Google Scholar] [CrossRef] [Green Version]
  7. St-Pierre, B.; Vazquez-Flota, F.; De Luca, V. Multicellular compartmentation of catharanthus roseus alkaloid biosynthesis predicts intercellular translocation of a pathway intermediate. Plant Cell 1999, 11, 887–900. [Google Scholar] [CrossRef] [Green Version]
  8. Qu, Y.; Easson, M.L.A.E.; Froese, J.; Simionescu, R.; Hudlicky, T.; De Luca, V. Completion of the seven-step pathway from tabersonine to the anticancer drug precursor vindoline and its assembly in yeast. Proc. Natl. Acad. Sci. USA 2015, 112, 6224–6229. [Google Scholar] [CrossRef] [Green Version]
  9. Carqueijeiro, I.; Brown, S.; Chung, K.; Dang, T.T.; Walia, M.; Besseau, S.; Dugé de Bernonville, T.; Oudin, A.; Lanoue, A.; Billet, K.; et al. Two Tabersonine 6,7-Epoxidases Initiate Lochnericine-Derived Alkaloid Biosynthesis in Catharanthus roseus. Plant Physiol. 2018, 177, 1473–1486. [Google Scholar] [CrossRef] [Green Version]
  10. Carqueijeiro, I.; Dugé de Bernonville, T.; Lanoue, A.; Dang, T.T.; Teijaro, C.N.; Paetz, C.; Billet, K.; Mosquera, A.; Oudin, A.; Besseau, S.; et al. A BAHD acyltransferase catalyzing 19-O-acetylation of tabersonine derivatives in roots of Catharanthus roseus enables combinatorial synthesis of monoterpene indole alkaloids. Plant J. Cell Mol. Biol. 2018, 94, 469–484. [Google Scholar] [CrossRef] [Green Version]
  11. Caputi, L.; Franke, J.; Farrow, S.C.; Chung, K.; Payne, R.M.E.; Nguyen, T.D.; Dang, T.T.T.; Soares Teto Carqueijeiro, I.; Koudounas, K.; Dugé de Bernonville, T.; et al. Missing enzymes in the biosynthesis of the anticancer drug vinblastine in Madagascar periwinkle. Science 2018, 360, 1235–1239. [Google Scholar] [CrossRef] [Green Version]
  12. Qu, Y.; Easson, M.E.A.M.; Simionescu, R.; Hajicek, J.; Thamm, A.M.K.; Salim, V.; De Luca, V. Solution of the multistep pathway for assembly of corynanthean, strychnos, iboga, and aspidosperma monoterpenoid indole alkaloids from 19E-geissoschizine. Proc. Natl. Acad. Sci. USA 2018, 115, 3180–3185. [Google Scholar] [CrossRef] [Green Version]
  13. Srivastava, S.; Pandey, R.; Kumar, S.; Nautiyal, C.S. Correspondence between flowers and leaves in terpenoid indole alkaloid metabolism of the phytoplasma-infected Catharanthus roseus plants. Protoplasma 2014, 251, 1307–1320. [Google Scholar] [CrossRef]
  14. Dugé de Bernonville, T.; Carqueijeiro, I.; Lanoue, A.; Lafontaine, F.; Sánchez Bel, P.; Liesecke, F.; Musset, K.; Oudin, A.; Glévarec, G.; Pichon, O.; et al. Folivory elicits a strong defense reaction in Catharanthus roseus: Metabolomic and transcriptomic analyses reveal distinct local and systemic responses. Sci. Rep. 2017, 7, 40453. [Google Scholar] [CrossRef]
  15. Van Moerkercke, A.; Steensma, P.; Schweizer, F.; Pollier, J.; Gariboldi, I.; Payne, R.; Vanden Bossche, R.; Miettinen, K.; Espoz, J.; Purnama, P.C.; et al. The bHLH transcription factor BIS1 controls the iridoid branch of the monoterpenoid indole alkaloid pathway in Catharanthus roseus. Proc. Natl. Acad. Sci. USA 2015, 112, 8130–8135. [Google Scholar] [CrossRef] [Green Version]
  16. Van Moerkercke, A.; Steensma, P.; Gariboldi, I.; Espoz, J.; Purnama, P.C.; Schweizer, F.; Miettinen, K.; Vanden Bossche, R.; De Clercq, R.; Memelink, J.; et al. The basic helix-loop-helix transcription factor BIS2 is essential for monoterpenoid indole alkaloid production in the medicinal plant Catharanthus roseus. Plant J. Cell Mol. Biol. 2016, 88, 3–12. [Google Scholar] [CrossRef] [Green Version]
  17. Zhang, H.; Hedhili, S.; Montiel, G.; Zhang, Y.; Chatel, G.; Pré, M.; Gantet, P.; Memelink, J. The basic helix-loop-helix transcription factor CrMYC2 controls the jasmonate-responsive expression of the ORCA genes that regulate alkaloid biosynthesis in Catharanthus roseus. Plant J. Cell Mol. Biol. 2011, 67, 61–71. [Google Scholar] [CrossRef]
  18. Menke, F.L.; Champion, A.; Kijne, J.W.; Memelink, J. A novel jasmonate- and elicitor-responsive element in the periwinkle secondary metabolite biosynthetic gene Str interacts with a jasmonate- and elicitor-inducible AP2-domain transcription factor, ORCA2. EMBO J. 1999, 18, 4455–4463. [Google Scholar] [CrossRef] [PubMed] [Green Version]
  19. Van der Fits, L.; Memelink, J. ORCA3, a jasmonate-responsive transcriptional regulator of plant primary and secondary metabolism. Science 2000, 289, 295–297. [Google Scholar] [CrossRef] [PubMed]
  20. Paul, P.; Singh, S.K.; Patra, B.; Sui, X.; Pattanaik, S.; Yuan, L. A differentially regulated AP2/ERF transcription factor gene cluster acts downstream of a MAP kinase cascade to modulate terpenoid indole alkaloid biosynthesis in Catharanthus roseus. New Phytol. 2017, 213, 1107–1123. [Google Scholar] [CrossRef] [PubMed]
  21. Liu, Y.; Patra, B.; Pattanaik, S.; Wang, Y.; Yuan, L. GATA and Phytochrome Interacting Factor Transcription Factors Regulate Light-Induced Vindoline Biosynthesis in Catharanthus roseus. Plant Physiol. 2019, 180, 1336–1350. [Google Scholar] [CrossRef] [PubMed] [Green Version]
  22. Zhu, J.; Wang, M.; Wen, W.; Yu, R. Biosynthesis and regulation of terpenoid indole alkaloids in Catharanthus roseus. Pharmacogn. Rev. 2015, 9, 24–28. [Google Scholar] [CrossRef] [PubMed] [Green Version]
  23. Meyer, P. Epigenetics—A historical perspective. In Plant Epigenetics Coming of Age for Breeding Applications; Elsevier: Amsterdam, The Netherlands, 2018; Volume 88, pp. 1–19. [Google Scholar]
  24. Zhang, H.; Lang, Z.; Zhu, J.K. Dynamics and function of DNA methylation in plants. Nat. Reviews. Mol. Cell Biol. 2018, 19, 489–506. [Google Scholar] [CrossRef] [PubMed]
  25. Vidalis, A.; Živković, D.; Wardenaar, R.; Roquis, D.; Tellier, A.; Johannes, F. Methylome evolution in plants. Genome Biol. 2016, 17, 264. [Google Scholar] [CrossRef] [Green Version]
  26. Bewick, A.J.; Schmitz, R.J. Gene body DNA methylation in plants. Curr. Opin. Plant Biol. 2017, 36, 103–110. [Google Scholar] [CrossRef] [Green Version]
  27. Takuno, S.; Ran, J.H.; Gaut, B.S. Evolutionary patterns of genic DNA methylation vary across land plants. Nat. Plants 2016, 2, 15222. [Google Scholar] [CrossRef]
  28. Anastasiadi, D.; Esteve-Codina, A.; Piferrer, F. Consistent inverse correlation between DNA methylation of the first intron and gene expression across tissues and species. Epigenetics Chromatin 2018, 11, 37. [Google Scholar] [CrossRef]
  29. Bartels, A.; Han, Q.; Nair, P.; Stacey, L.; Gaynier, H.; Mosley, M.; Huang, Q.Q.; Pearson, J.K.; Hsieh, T.F.; An, Y.Q.C.; et al. Dynamic DNA methylation in plant growth and development. Int. J. Mol. Sci. 2018, 19, 2144. [Google Scholar] [CrossRef] [Green Version]
  30. Bouyer, D.; Kramdi, A.; Kassam, M.; Heese, M.; Schnittger, A.; Roudier, F.; Colot, V. DNA methylation dynamics during early plant life. Genome Biol. 2017, 18, 179. [Google Scholar] [CrossRef]
  31. Kooke, R.; Morgado, L.; Becker, F.; van Eekelen, H.; Hazarika, R.; Zheng, Q.; de Vos, R.C.H.; Johannes, F.; Keurentjes, J.J.B. Epigenetic mapping of the Arabidopsis metabolome reveals mediators of the epigenotype-phenotype map. Genome Res. 2019, 29, 96–106. [Google Scholar] [CrossRef] [Green Version]
  32. Leung, J.; Gaudin, V. Who Rules the Cell? An Epi-Tale of Histone, DNA, RNA, and the Metabolic Deep State. Front. Plant Sci. 2020, 11, 181. [Google Scholar] [CrossRef] [PubMed] [Green Version]
  33. Li, W.F.; Ning, G.X.; Mao, J.; Guo, Z.G.; Zhou, Q.; Chen, B.H. Whole-genome DNA methylation patterns and complex associations with gene expression associated with anthocyanin biosynthesis in apple fruit skin. Planta 2019, 250, 1833–1847. [Google Scholar] [CrossRef] [PubMed]
  34. Hao, D.C.; Xiao, P.G. Deep in shadows: Epigenetic and epigenomic regulations of medicinal plants. Chin. Herbal Med. 2018. [Google Scholar] [CrossRef]
  35. Yang, D.; Huang, Z.; Jin, W.; Xia, P.; Jia, Q.; Yang, Z.; Hou, Z.; Zhang, H.; Ji, W.; Han, R. DNA methylation: A new regulator of phenolic acids biosynthesis in Salvia miltiorrhiza. Ind. Crops Prod. 2018, 124, 402–411. [Google Scholar] [CrossRef]
  36. Bulut, B.; Aydinli, Z.; Türktaş-Erken, M. MSAP analysis reveals diverse epigenetic statuses in opium poppy varieties with different benzyisoquinoline alkaloid content. Turk. J. Biol. Turk Biyol. Derg. Sci. Tech. Res. Counc. Turk. 2020, 44, 103–109. [Google Scholar] [CrossRef]
  37. Yong, W.S.; Hsu, F.M.; Chen, P.Y. Profiling genome-wide DNA methylation. Epigenetics Chromatin 2016, 9, 26. [Google Scholar] [CrossRef] [Green Version]
  38. Niederhuth, C.E.; Bewick, A.J.; Ji, L.; Alabady, M.S.; Kim, K.D.; Li, Q.; Rohr, N.A.; Rambani, A.; Burke, J.M.; Udall, J.A.; et al. Widespread natural variation of DNA methylation within angiosperms. Genome Biol. 2016, 17, 194. [Google Scholar] [CrossRef] [Green Version]
  39. Xu, J.; Zhou, S.; Gong, X.; Song, Y.; van Nocker, S.; Ma, F.; Guan, Q. Single-base methylome analysis reveals dynamic epigenomic differences associated with water deficit in apple. Plant Biotechnol. J. 2018, 16, 672–687. [Google Scholar] [CrossRef]
  40. Song, Q.X.; Lu, X.; Li, Q.T.; Chen, H.; Hu, X.Y.; Ma, B.; Zhang, W.K.; Chen, S.Y.; Zhang, J.S. Genome-wide analysis of DNA methylation in soybean. Mol. Plant 2013, 6, 1961–1974. [Google Scholar] [CrossRef] [Green Version]
  41. Ausin, I.; Feng, S.; Yu, C.; Liu, W.; Kuo, H.Y.; Jacobsen, E.L.; Zhai, J.; Gallego-Bartolome, J.; Wang, L.; Egertsdotter, U.; et al. DNA methylome of the 20-gigabase Norway spruce genome. Proc. Natl. Acad. Sci. USA 2016, 113, E8106–E8113. [Google Scholar] [CrossRef] [Green Version]
  42. Roessler, K.; Takuno, S.; Gaut, B.S. CG Methylation Covaries with Differential Gene Expression between Leaf and Floral Bud Tissues of Brachypodium distachyon. PLoS ONE 2016, 11, e0150002. [Google Scholar] [CrossRef] [Green Version]
  43. Candaele, J.; Demuynck, K.; Mosoti, D.; Beemster, G.T.S.; Inzé, D.; Nelissen, H. Differential methylation during maize leaf growth targets developmentally regulated genes. Plant Physiol. 2014, 164, 1350–1364. [Google Scholar] [CrossRef] [Green Version]
  44. Vining, K.J.; Pomraning, K.R.; Wilhelm, L.J.; Priest, H.D.; Pellegrini, M.; Mockler, T.C.; Freitag, M.; Strauss, S.H. Dynamic DNA cytosine methylation in the Populus trichocarpa genome: Tissue-level variation and relationship to gene expression. BMC Genom. 2012, 13, 27. [Google Scholar] [CrossRef] [PubMed] [Green Version]
  45. González, B.; Vera, P. Folate Metabolism Interferes with Plant Immunity through 1C Methionine Synthase-Directed Genome-wide DNA Methylation Enhancement. Mol. Plant 2019, 12, 1227–1242. [Google Scholar] [CrossRef] [PubMed]
  46. Lindermayr, C.; Rudolf, E.E.; Durner, J.; Groth, M. Interactions between metabolism and chromatin in plant models. Molecular Metabolism 2020, 38, 100951. [Google Scholar] [CrossRef] [PubMed]
  47. Lafon-Placette, C.; Le Gac, A.L.; Chauveau, D.; Segura, V.; Delaunay, A.; Lesage-Descauses, M.C.; Hummel, I.; Cohen, D.; Jesson, B.; Le Thiec, D.; et al. Changes in the epigenome and transcriptome of the poplar shoot apical meristem in response to water availability affect preferentially hormone pathways. J. Exp. Bot. 2018, 69, 537–551. [Google Scholar] [CrossRef]
  48. Feng, S.J.; Liu, X.S.; Tao, H.; Tan, S.K.; Chu, S.S.; Oono, Y.; Zhang, X.D.; Chen, J.; Yang, Z.M. Variation of DNA methylation patterns associated with gene expression in rice (Oryza sativa) exposed to cadmium. Plant Cell Environ. 2016, 39, 2629–2649. [Google Scholar] [CrossRef]
  49. N’Diaye, A.; Byrns, B.; Cory, A.T.; Nilsen, K.T.; Walkowiak, S.; Sharpe, A.; Robinson, S.J.; Pozniak, C.J. Machine learning analyses of methylation profiles uncovers tissue-specific gene expression patterns in wheat. Plant Genome 2020. [Google Scholar] [CrossRef]
  50. Niederhuth, C.E.; Schmitz, R.J. Putting DNA methylation in context: From genomes to gene expression in plants. Biochim. Et Biophys. Acta Gene Regul. Mech. 2017, 1860, 149–156. [Google Scholar] [CrossRef] [Green Version]
  51. Zhang, Y.; Wendte, J.M.; Ji, L.; Schmitz, R.J. Natural variation in DNA methylation homeostasis and the emergence of epialleles. Proc. Natl. Acad. Sci. USA 2020, 117, 4874–4884. [Google Scholar] [CrossRef]
  52. Al-Harrasi, I.; Al-Yahyai, R.; Yaish, M.W. Differential DNA methylation and transcription profiles in date palm roots exposed to salinity. PLoS ONE 2018, 13, e0191492. [Google Scholar] [CrossRef] [PubMed] [Green Version]
  53. Wang, L.; Shi, Y.; Chang, X.; Jing, S.; Zhang, Q.; You, C.; Yuan, H.; Wang, H. DNA methylome analysis provides evidence that the expansion of the tea genome is linked to TE bursts. Plant Biotechnol. J. 2019, 17, 826–835. [Google Scholar] [CrossRef] [PubMed] [Green Version]
  54. Bewick, A.J.; Zhang, Y.; Wendte, J.M.; Zhang, X.; Schmitz, R.J. Evolutionary and experimental loss of gene body methylation and its consequence to gene expression. G3 Bethesda Md. 2019, 9, 2441–2445. [Google Scholar] [CrossRef] [PubMed] [Green Version]
  55. Horvath, R.; Laenen, B.; Takuno, S.; Slotte, T. Single-cell expression noise and gene-body methylation in Arabidopsis thaliana. Heredity 2019, 123, 81–91. [Google Scholar] [CrossRef] [PubMed] [Green Version]
  56. Langfelder, P.; Zhang, B.; Horvath, S. Defining clusters from a hierarchical cluster tree: The Dynamic Tree Cut package for R. Bioinformatics 2008, 24, 719–720. [Google Scholar] [CrossRef]
  57. Ngernprasirtsiri, J.; Kobayashi, H.; Akazawa, T. Transcriptional regulation and DNA methylation of nuclear genes for photosynthesis in nongreen plant cells. Proc. Natl. Acad. Sci. USA 1989, 86, 7919–7923. [Google Scholar] [CrossRef] [Green Version]
  58. Ma, K.; Song, Y.; Jiang, X.; Zhang, Z.; Li, B.; Zhang, D. Photosynthetic response to genome methylation affects the growth of Chinese white poplar. Tree Genet. Genomes 2012, 8, 1407–1421. [Google Scholar] [CrossRef]
  59. Perrin, A.; Daccord, N.; Roquis, D.; Celton, J.M.; Vergne, E.; Bucher, E. Divergent DNA methylation signatures of juvenile seedlings, grafts and adult apple trees. Epigenomes 2020, 4, 4. [Google Scholar] [CrossRef] [Green Version]
  60. Attaran, E.; Major, I.T.; Cruz, J.A.; Rosa, B.A.; Koo, A.J.K.; Chen, J.; Kramer, D.M.; He, S.Y.; Howe, G.A. Temporal dynamics of growth and photosynthesis suppression in response to jasmonate signaling. Plant Physiol. 2014, 165, 1302–1314. [Google Scholar] [CrossRef] [Green Version]
  61. Dowen, R.H.; Pelizzola, M.; Schmitz, R.J.; Lister, R.; Dowen, J.M.; Nery, J.R.; Dixon, J.E.; Ecker, J.R. Widespread dynamic DNA methylation in response to biotic stress. Proc. Natl. Acad. Sci. USA 2012, 109, E2183–E2191. [Google Scholar] [CrossRef] [Green Version]
  62. Ngom, B.; Mamati, E.; Goudiaby, M.F.; Kimatu, J.; Sarr, I.; Diouf, D.; Kane, N.A. Methylation analysis revealed salicylic acid affects pearl millet defense through external cytosine DNA demethylation. J. Plant Interact. 2018, 13, 288–293. [Google Scholar] [CrossRef]
  63. Koch, M.; Vorwerk, S.; Masur, C.; Sharifi-Sirchi, G.; Olivieri, N.; Schlaich, N.L. A role for a flavin-containing mono-oxygenase in resistance against microbial pathogens in Arabidopsis. Plant J. Cell Mol. Biol. 2006, 47, 629–639. [Google Scholar] [CrossRef] [PubMed]
  64. Schlereth, A.; Möller, B.; Liu, W.; Kientz, M.; Flipse, J.; Rademacher, E.H.; Schmid, M.; Jürgens, G.; Weijers, D. MONOPTEROS controls embryonic root initiation by regulating a mobile transcription factor. Nature 2010, 464, 913–916. [Google Scholar] [CrossRef] [PubMed]
  65. Tognetti, V.B.; Van Aken, O.; Morreel, K.; Vandenbroucke, K.; van de Cotte, B.; De Clercq, I.; Chiwocha, S.; Fenske, R.; Prinsen, E.; Boerjan, W.; et al. Perturbation of indole-3-butyric acid homeostasis by the UDP-glucosyltransferase UGT74E2 modulates Arabidopsis architecture and water stress tolerance. Plant Cell 2010, 22, 2660–2679. [Google Scholar] [CrossRef] [PubMed] [Green Version]
  66. Yamamuro, C.; Zhu, J.K.; Yang, Z. Epigenetic modifications and plant hormone action. Mol. Plant 2016, 9, 57–70. [Google Scholar] [CrossRef] [Green Version]
  67. Kim, J.; Kang, S.H.; Park, S.G.; Yang, T.J.; Lee, Y.; Kim, O.T.; Chung, O.; Lee, J.; Choi, J.P.; Kwon, S.J.; et al. Whole-genome, transcriptome, and methylome analyses provide insights into the evolution of platycoside biosynthesis in Platycodon grandiflorus, a medicinal plant. Hortic. Res. 2020, 7, 112. [Google Scholar] [CrossRef]
  68. Colinas, M.; Goossens, A. Combinatorial transcriptional control of plant specialized metabolism. Trends Plant Sci. 2018, 23, 324–336. [Google Scholar] [CrossRef]
  69. Van der Fits, L.; Memelink, J. The jasmonate-inducible AP2/ERF-domain transcription factor ORCA3 activates gene expression via interaction with a jasmonate-responsive promoter element. Plant J. Cell Mol. Biol. 2001, 25, 43–53. [Google Scholar] [CrossRef]
  70. Kanaoka, M.M.; Pillitteri, L.J.; Fujii, H.; Yoshida, Y.; Bogenschutz, N.L.; Takabayashi, J.; Zhu, J.K.; Torii, K.U. SCREAM/ICE1 and SCREAM2 specify three cell-state transitional steps leading to arabidopsis stomatal differentiation. Plant Cell 2008, 20, 1775–1785. [Google Scholar] [CrossRef] [Green Version]
  71. Billingsley, J.M.; DeNicola, A.B.; Barber, J.S.; Tang, M.C.; Horecka, J.; Chu, A.; Garg, N.K.; Tang, Y. Engineering the biocatalytic selectivity of iridoid production in Saccharomyces cerevisiae. Metab. Eng. 2017, 44, 117–125. [Google Scholar] [CrossRef]
  72. Dugé de Bernonville, T.; Foureau, E.; Parage, C.; Lanoue, A.; Clastre, M.; Londono, M.A.; Oudin, A.; Houillé, B.; Papon, N.; Besseau, S.; et al. Characterization of a second secologanin synthase isoform producing both secologanin and secoxyloganin allows enhanced de novo assembly of a Catharanthus roseus transcriptome. BMC Genom. 2015, 16, 619. [Google Scholar] [CrossRef] [PubMed] [Green Version]
  73. Payne, R.M.E.; Xu, D.; Foureau, E.; Teto Carqueijeiro, M.I.S.; Oudin, A.; Bernonville, T.D.D.; Novak, V.; Burow, M.; Olsen, C.E.; Jones, D.M.; et al. An NPF transporter exports a central monoterpene indole alkaloid intermediate from the vacuole. Nat. Plants 2017, 3, 16208. [Google Scholar] [CrossRef] [PubMed]
  74. Qu, Y.; Safonova, O.; De Luca, V. Completion of the canonical pathway for assembly of anticancer drugs vincristine/vinblastine in Catharanthus roseus. Plant J. Cell Mol. Biol. 2019, 97, 257–266. [Google Scholar] [CrossRef] [PubMed] [Green Version]
  75. Daviaud, C.; Renault, V.; Mauger, F.; Deleuze, J.F.; Tost, J. Whole-Genome Bisulfite Sequencing Using the Ovation®Ultralow Methyl-Seq Protocol. Methods Mol. Biol. 2018, 1708, 83–104. [Google Scholar] [CrossRef] [PubMed]
  76. Verma, M.; Ghangal, R.; Sharma, R.; Sinha, A.K.; Jain, M. Transcriptome analysis of Catharanthus roseus for gene discovery and expression profiling. PLoS ONE 2014, 9, e103583. [Google Scholar] [CrossRef] [Green Version]
  77. Krueger, F.; Andrews, S.R. Bismark: A flexible aligner and methylation caller for Bisulfite-Seq applications. Bioinformatics 2011, 27, 1571–1572. [Google Scholar] [CrossRef]
  78. Langmead, B.; Salzberg, S.L. Fast gapped-read alignment with Bowtie 2. Nat. Methods 2012, 9, 357–359. [Google Scholar] [CrossRef] [Green Version]
  79. Xi, Y.; Li, W. BSMAP: Whole genome bisulfite sequence MAPping program. BMC Bioinform. 2009, 10, 232. [Google Scholar] [CrossRef] [Green Version]
  80. Grehl, C.; Wagner, M.; Lemnian, I.; Glaser, B.; Grosse, I. Performance of Mapping Approaches for Whole-Genome Bisulfite Sequencing Data in Crop Plants. Front. Plant Sci. 2020, 11, 176. [Google Scholar] [CrossRef] [Green Version]
  81. R Core Team. R: A Language and Environment for Statistical Computing. 2020. Available online: http://www.R-project.org/ (accessed on 20 August 2020).
  82. Chen, Y.; Pal, B.; Visvader, J.E.; Smyth, G.K. Differential methylation analysis of reduced representation bisulfite sequencing experiments using edgeR. F1000Research 2017, 6, 2055. [Google Scholar] [CrossRef]
  83. Wu, H.; Xu, T.; Feng, H.; Chen, L.; Li, B.; Yao, B.; Qin, Z.; Jin, P.; Conneely, K.N. Detection of differentially methylated regions from whole-genome bisulfite sequencing data without replicates. Nucleic Acids Res. 2015, 43, e141. [Google Scholar] [CrossRef] [PubMed] [Green Version]
  84. Chen, S.; Zhou, Y.; Chen, Y.; Gu, J. fastp: An ultra-fast all-in-one FASTQ preprocessor. Bioinformatics 2018, 34, i884–i890. [Google Scholar] [CrossRef] [PubMed]
  85. Patro, R.; Duggal, G.; Love, M.I.; Irizarry, R.A.; Kingsford, C. Salmon provides fast and bias-aware quantification of transcript expression. Nat. Methods 2017, 14, 417–419. [Google Scholar] [CrossRef] [PubMed] [Green Version]
  86. Robinson, M.D.; McCarthy, D.J.; Smyth, G.K. edgeR: A Bioconductor package for differential expression analysis of digital gene expression data. Bioinformatics 2010, 26, 139–140. [Google Scholar] [CrossRef] [PubMed] [Green Version]
  87. Dowle, M.; Srinivasan, A. Data.Table: Extension of ‘data.frame’. 2019. Available online: http://CRAN.R-project.org/package=data.table (accessed on 20 August 2020).
  88. Wickham, H. ggplot2-Elegant Graphics for Data Analysis, 2nd ed.; Springer International Publishing: Cham, Switzerland, 2016. [Google Scholar] [CrossRef]
  89. De Vries, A.; Ripley, B.D. ggdendro: Create Dendrograms and Tree Diagrams Using ’ggplot2’. 2016. Available online: http://CRAN.R-project.org/package=ggdendro (accessed on 20 August 2020).
  90. Slowikowski, K. ggrepel: Automatically Position Non-Overlapping Text Labels with ’ggplot2’. 2019. Available online: http://CRAN.R-project.org/package=ggrepel (accessed on 20 August 2020).
  91. Lê, S.; Josse, J.; Husson, F. FactoMineR: An R package for multivariate analysis. J. Stat. Softw. 2008, 25. [Google Scholar] [CrossRef] [Green Version]
  92. Kolde, R. Pheatmap: Pretty Heatmaps. 2019. Available online: http://CRAN.R-project.org/package=pheatmap (accessed on 20 August 2020).
  93. Camacho, C.; Coulouris, G.; Avagyan, V.; Ma, N.; Papadopoulos, J.; Bealer, K.; Madden, T.L. BLAST+: Architecture and applications. BMC Bioinform. 2009, 10, 421. [Google Scholar] [CrossRef] [Green Version]
  94. Huerta-Cepas, J.; Forslund, K.; Coelho, L.P.; Szklarczyk, D.; Jensen, L.J.; von Mering, C.; Bork, P. Fast Genome-Wide Functional Annotation through Orthology Assignment by eggNOG-Mapper. Mol. Biol. Evol. 2017, 34, 2115–2122. [Google Scholar] [CrossRef] [Green Version]
  95. Csardi, G.; Nepusz, T. The igraph software package for complex network research. Int. J. 2006, 1695, 1–9. [Google Scholar]
  96. Maury, S.; Sow, M.D.; Le Gac, A.L.; Genitoni, J.; Lafon-Placette, C.; Mozgova, I. Phytohormone and chromatin crosstalk: The missing link for developmental plasticity? Front. Plant Sci. 2019, 10, 395. [Google Scholar] [CrossRef]
Figure 1. Overview of theC. roseusexperimental design for the WGBS and methylome data. (A) Nine samples reflecting developmental variation within distinct organs (Leaf, Flower, Root or Adventitious Root) or during leaf ontogenesis (young versus mature; or basal versus distal) and environmental effects on leaf after direct (mature leaf 24 h post folivory) or indirect (distance young leaf 1 week post folivory) biotic attacks were chosen to characterize whole genome cytosine methylation profiles. Flow = Flower; Aroot = Adventitious root; Mleaf = Mature leaf; Yleaf = Young leaf; Basal = Basal part of leaf; Distal = Distal part of leaf; Mleafcat = Mature leaf post folivory by caterpillars; Yleafcat = Young leaf from subjected plants 1 week after folivory on mature leaves. (B) Average % of cytosine methylation in the whole genome or gene model targeted approaches. (C) Average cytosine methylation levels of different gene features in each cytosine context for the whole genome approach (D) ratio between the number of differentially methylated cytosines (DMC) and number of cytosine sites per feature and cytosine contexts (CG, CHG, or CHH). In the whole genome approach, DMCs were retained if the difference in methylation between the two samples considered was >25%.
Ijms 21 06028 g001
Figure 2. Classification of samples according to DMC and DMR numbers and contexts. (A) number of DMC and DMR in all 36 pairwise comparisons, for each context and gene model feature. Comparisons were clustered using an Euclidean distance calculated on the number of DMCs/DMRs and the Ward agglomeration criterion. (B) principal component analysis of DMC/DMR number. Comparisons are projected on the two first dimensions but names are indicated only for the 15 highest contributions. For both dimensions, the five highest variable contributions are represented below. (C,D) samples clustered according to the numbers of DMC and DMR, respectively. Euclidean distances were calculated on square matrices containing samples in rows and columns. Clustering was constructed according to Ward agglomeration criterion; (E) number of hyper- and hypo-methylated DMCs/DMRs for each sample compared with all eight others.
Ijms 21 06028 g002
Figure 3. Relationship between differential methylation and differential expression. (A) number of differentially expressed genes (DEG), and number of gene models harboring at least one DMC or one DMR. A DM (differentially methylated) locus corresponds to a non-DEG with at least one DMC or DMR, while a DEM (differentially expressed and methylated) locus corresponds to a DEG with at least one DMC or DMR. Numbers correspond to the % of DEM/DM. Please note the differences in scale on the x-axis; (B) methylation differences of DEM or DM genes were averaged per comparison, context and gene feature. Differences between averages were calculated to highlight variation in methylation profiles between DEM and DM genes. The boxplots summarize data from all comparisons using absolute values of average differences. Asterisks denote statistical significant differences (Wilcoxon rank sum test, Bonferroni corrected p-values, ***: p < 0.001). (C,D) Pearson correlation coefficients (PCC) measuring the correlation between a gene expression log2FC and its methylation state (“.” p < 0.1, “*” p < 0.05, “**” p < 0.01, “***” p < 0.001) at the DMC and DMR levels, respectively. Numbers in cells correspond to the number of points used to calculate correlations.
Ijms 21 06028 g003
Figure 4. Characterization of differentially expressed and methylated (DEM) genes. (A) heatmap of DNA methylation differences for each differentially expressed and methylated gene model and each comparison. Cell color is proportional to the methylation difference (blue to red scale). Comparisons and gene loci are clustered according to the Euclidean distance and the Ward’s aggregation criterion. (B) for each group in (A) DEM events (one gene in one comparison) were counted for each trend (over/under expressed (logFC) and hypo/hyper methylated (Methyl)). (C) EggNOG functional annotation of gene clusters from the heatmap in A. Only enriched classes are shown (hypergeometric test, Bonferroni ajdusted-p-value < 0.05). A, RNA processing and modification; B, Chromatin structure and dynamics; C, Energy production and conversion; D, Cell cycle control, cell division, chromosome partitioning; E, Amino acid transport and metabolism; F, Nucleotide transport and metabolism; G, Carbohydrate transport and metabolism; H, Coenzyme transport and metabolism; I, Lipid transport and metabolism; J, Translation, ribosomal structure and biogenesis; K, Transcription; L, Replication, recombination and repair; M, Cell wall/membrane/envelope biogenesis; N, Cell motility; O, Post-translational modification, protein turnover, and chaperones; P, Inorganic ion transport and metabolism; Q, Secondary metabolites biosynthesis, transport, and catabolism; R, General function prediction only; S, Function unknown; T, Signal transduction mechanisms; U, Intracellular trafficking, secretion, and vesicular transport; V, Defense mechanisms; W, Extracellular structures; Y, Nuclear structure; Z, Cytoskeleton. (D) most represented Uniprot keywords for DEM genes in for each sample and methylation/expression profile. For each sample, all nine comparisons were made to identify gene sets following one the four profiles: M-E-, hypomethylated and decreased expression; M-E+, hypomethylated and overexpressed; M+E-, hypermethylated and decreased expression; M+E+, hypermethylated and overexpressed. Each corresponding Uniprot entry was mapped to Uniprot keywords, which were then summarized for each sample.
Ijms 21 06028 g004
Figure 5. Methylation and expression variation in the MIA pathway. (A) MIA pathway. Differentially methylated genes are indicated in orange. Transcription factors BIS, ORCA2/3, and MYC2 are positioned close to their known targets. (B) Analysis of differential accumulation of metabolites. Each cell in the table represents the log10 transformed ratios of metabolite between samples. (C) differential expression analysis of genes involved in the MIA pathway. Cells show scaled log2 fold changes. *, differentially expressed (Sample1_Sample2). C−, hypomethylated DMC in sample1; C+, hypermethylated DMC in sample1. R-, hypomethylated DMR in sample1; R+ hypermethylated DMR in sample1. When a “E” is indicated before, it indicates that the gene is both differentially methylated and expressed. Differentially expressed and methylated genes (EC or ER) are surrounded by red boxes and their names indicated in red.
Ijms 21 06028 g005
Figure 6. Co-expression network (Spearman’s rho correlation-based) visualizing transcriptional relationships among MIA genes and other differentially methylated and expressed genes detected in this study. MIA genes are indicated by purple points and black labels, while differentially expressed and methylated genes are indicated in turquoise or orange if they code potential transcription factors (Table 1). Genes are connected by grey segments if their Spearman’s rho coefficient was above 0.95. Black polygons correspond to communities detected with a fast greedy modularity optimization based algorithm. Only communities containing at least one MIA gene are shown. Numbers in white in black circles correspond to community identification numbers.
Ijms 21 06028 g006
Table 1. Description of differentially expressed and methylated transcription factors co-expressed with MIA genes. Expression LogFC and methylation differences are given for the most contrasting comparison.
Locus TagBest Hit in Uniprot Database (blastx)% ide-ValueComparisonLogFCMethylation Difference
Community 1 (GES, IS, IO, and DL7GT, T16H2, 16OMT, T3R, NMT, D4H, and DAT, vindoline-related community)
CRO_T102172DOF56_ARATH, Dof zinc finger protein DOF5.6 (AtDOF5.6)71.774 × 10 43 Distal vs. Aroot2.540.31
CRO_T109632BH048_ARATH, Transcription factor bHLH48 (AtbHLH48)40.553 × 10 49 Root vs. Basal−2.270.29
CRO_T110203WOX1_ARATH, WUSCHEL-related homeobox 156.954 × 10 43 Root vs. Yleafcat−9.160.22
Community 2 (DXS1, DXS2, HDS, HDR, MECS, G10H, and 8HGO; terpene precursor community)
CRO_T107249UNE10_ARATH, Transcription factor UNE10 (AtbHLH16) (bHLH 16)52.715 × 10 25 Root vs. Mleaf−8.760.19
CRO_T107392MYB06_ANTMA, Myb-related protein 30661.433 × 10 85 Root vs. Flower−6.72−0.29
CRO_T110065UNE10_ARATH, Transcription factor UNE10 (AtbHLH16) (bHLH 16)46.132 × 10 51 Yleafcat vs. Aroot2.440.24
Community 3 (GS1, GS2, THAS1, THAS3, and THAS4, strictosidine aglycone acting enzymes)
CRO_T110954BH113_ARATH, Transcription factor bHLH113 (AtbHLH113)42.741 × 10 39 Yleafcat vs. Aroot−1.850.18
Community 4 (ORCA3 and STR; control of strictosidine accumulation)
CRO_T101111BH030_ARATH, Transcription factor bHLH30 (AtbHLH30)40.185 × 10 30 Root vs. Basal2.92−0.28
CRO_T108223PTI6_SOLLC, Pathogenesis-related genes transcriptional activator PTI659.513 × 10 39 Root vs. Yleafcat5.660.26
Community 5 (SLS2 and IDI1)
CRO_T101037PCF5_ORYSJ, Transcription factor PCF585.924 × 10 35 Flower vs. Yleafcat3.72−0.29
CRO_T102366BH079_ARATH, Transcription factor bHLH79 (AtbHLH79) (bHLH 79)57.192 × 10 80 Flower vs. Aroot5.46−0.24
CRO_T110108YAB1_ARATH, Axial regulator YABBY 1 (Fl-54)65.123 × 10 82 Mleafcat vs. Yleafcat−2.41−0.32
CRO_T110248ICE1_ARATH, Transcription factor ICE1 (AtbHLH116)60.622 × 10 102 Flower vs. Mleafcat1.74−0.26
Table 2. WGBS and RNA-seq data.
SampleAccessionReferenceProject Accession Number
Root
WGBS
RNA-seq
SRR11932631
SRR1271858
This study
[76]
PRJNA635601
PRJNA246273
Adventitious root
WGBS
RNA-seq
SRR11932632
ERR2112587
This study
[10]
PRJNA635601
PRJEB22378
Young Leaf
WGBS
RNA-seq
SRR11932629
ERR1512377
This study
[14]
PRJNA635601
PRJEB14626
Mature Leaf
WGBS
RNA-seq
SRR11932637
ERR1512375
This study
[14]
PRJNA635601
PRJEB14626
Mature leaf 24 h post folivory
WGBS
RNA-seq
SRR11932636
ERR1512373
This study
[14]
PRJNA635601
PRJEB14626
Young leaf from folivory subjected plants
WGBS
RNA-seq
SRR11932635
ERR1512376
This study
[14]
PRJNA635601
PRJEB14626
Flower
WGBS
RNA-seq
SRR11932630
ERR4235477
This study
This study
PRJNA635601
PRJEB38854
Young Leaf basal part
WGBS
RNA-seq
SRR11932634
ERR4235478
This study
This study
PRJNA635601
PRJEB38854
Young Leaf distal part
WGBS
RNA-seq
SRR11932633
ERR4235479
This study
This study
PRJNA635601
PRJEB38854

