Abstract
The release of nucleotides during necrosis or apoptosis has been described to have both proinflammatory and anti-inflammatory effect on the surrounding cells. Here we describe how low concentrations of UTP and ATP applied during macrophage priming enhance IL-1β production when subsequently the NLRP3 inflammasome is activated in murine resident peritoneal macrophages. Deficiency or pharmacological inhibition of the purinergic receptor P2Y2 reverted the increase of IL-1β release induced by nucleotides. IL-1β increase was found dependent on the expression of Il1b gene and probably involving JNK activity. On the contrary, nucleotides decreased the production of a different proinflammatory cytokines such as TNF-α. These results suggest that nucleotides could shape the response of macrophages to obtain a unique proinflammatory signature that might be relevant in unrevealing specific inflammatory conditions.
1. Introduction
The control of the maturation and release of the proinflammatory cytokine interleukin (IL)-1β and IL-18 in macrophages by the NLRP3 inflammasome complex is a tightly controlled two-step process. An initial signal primes the production of the immature form of the cytokines and NLRP3. A second signal induces activation of the NLRP3 inflammasome complex with the subsequent activation of caspase-1 and the processing and release into the extracellular space of IL-1β and IL-18 by a pyroptotic process involving the cleavage of gasdermin D [1,2,3]. In human monocytes, an alternative pathway activates the NLRP3 inflammasome without the requirement of a second stimulat [4,5]. The second signal necessary to activate NLRP3 inflammasome can be achieved by different stimuli, being the activation of the purinergic P2X receptor 7 (P2X7R) by a concentration of extracellular ATP (eATP) in the mM range among the most common used [6]. We have recently found that activation of P2X7R before priming signal 1, leads to a mitochondrial damage and a later defect on NLRP3 activation [7], highlighting the different pathways associated to P2X7R signaling. Extracellular nucleotides such as ATP are indicative of cellular distress, released in small amounts during apoptosis or in faster, larger amounts during sudden cell death like necrosis or pyroptosis [3,8,9]. In this regard, extracellular nucleotides have been implicated in several inflammatory processes either promoting or reducing the inflammatory response depending on the context [10,11].
Depending the type of nucleotide and its concentration, extracellular nucleotides, and their direct degradation products, bind to different purinergic receptors, including adenosine receptors, metabotropic P2Y and ionotropic P2X receptors, providing a wide variety of immune responses depending on the ligand interaction that goes beyond P2X7R activating the NLRP3 inflammasome [11]. Therefore, it is expected that nucleotides will activate different purinergic receptors expressed in the target cell resulting in different intracellular signaling pathways. This concept led us to hypothesize that initial lower concentration of nucleotides, that do not trigger P2X7R, may regulate NLRP3 inflammasome activity prior its full activation, modulating the overall inflammatory response, beyond the role of P2X7R downmodulating inflammasome response [7]. To test this hypothesis, we employed murine residential peritoneal macrophages (RPMs), a tissue resident macrophage involved in cell clearance during steady-state conditions as well as in inflammatory responses [12,13]. Expression of different purinergic receptors by these cells makes this type of macrophage an excellent model to study the role of nucleotides on NLRP3 inflammasome activation. We found that when RPMs were cultured with nucleotides at μM concentrations that do not trigger P2X7R in the presence of LPS, there was an increase in IL-1β release after NLRP3 activation, and an increase of IL-6 whereas a decrease in TNF-α production in response to the LPS priming. Blockade of purinergic P2Y2 receptor (P2Y2R) reverted IL-1β levels back to amounts obtained only with LPS, whereas decrease production of TNF-α was due to adenosine receptor activity originated from ATP degradation into adenosine. Our data indicates that nucleotides contribute at different levels to a distinct and unique pro-inflammatory signature, which may be important for future anti-inflammatory therapies.
2. Results
2.1. ATP and UTP Nucleotides Enhance IL-1β Production by Macrophages
Murine RPMs primed with a combination of LPS with ATP and UTP (NTPs) released higher amounts of IL-1β when NLRP3 inflammasome was activated compared to macrophages only primed with LPS (Figure 1A,B). The increase on IL-1β release was observed using either nigericin or ATP as second signal to induce the activation of the NLRP3 inflammasome (Figure 1B). We then found that the observed increase in IL-1β was the mature p17 form of IL-1β (Figure 1C). This increase was not observed when NLRP3 was activated in THP-1 or bone marrow derived macrophages and cells were priming in the presence of NTPs (Figure 1B).
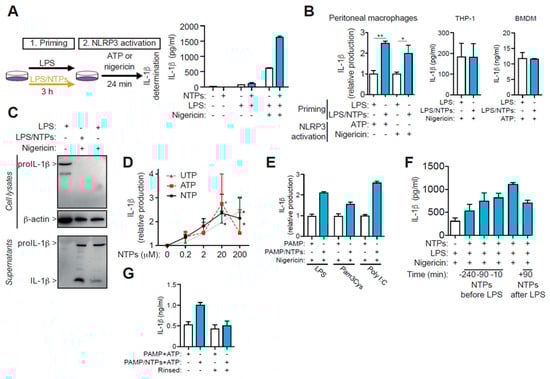
Figure 1.
Nucleotides increase LPS-primed IL-1β production. (A) Schematic representation of the protocol employed to activate the NLRP3 inflammasome (left). Representative analysis of IL-1β produced by peritoneal macrophages (RPM) plated in duplicates at 0.3 × 10⁶ cell/mL and primed with LPS, in the absence (white) or presence (blue) of 100 μM ATP and UTP (NTPs) for 3h and then the NLRP3 inflammasome was activated with nigericin; bars indicate +SD. (B) IL-1β production from RPMs, mouse bone marrow derived macrophages (BMDM) or THP-1 cells primed with LPS in the absence (white bars) or presence (blue bars) of nucleotides when NLRP3 was activated with ATP or nigericin as indicated; average +SEM of 12 and eight experiments, respectively, is shown for RPMs, one representative experiment out of n = 3 different experiments for BMDM and n = 2 for THP-1. (C) Representative analysis by Western blot of cell lysate and supernatants of macrophages primed with LPS only (left and right lanes) or LPS with NTPs (middle lane) and then activated with nigericin as indicated. (D) Dose-response effect of nucleotides priming with LPS on IL-1β production as indicated in (A); data is normalized to IL-1β production of RPMs primed with LPS absence of nucleotides and shows the average of three experiments +SEM. (E) IL-1β production in supernatants from RPMs primed with the indicated PAMP in the presence (blue bars) or absence (white bars) of NTPs (20 μM UTP/ATP) for 3 h and following NLRP3 activation with nigericin. One experiment +SD out of three is shown. (F) Kinetic analysis on IL-1β production when NTPs were added prior (negative values) at the same time or after (positive values) cells were primed with LPS and after 3 h NLRP3 was activated with nigericin; a representative experiment out of 2–4 is shown, bars indicate +SD. (G) Resting RPMs were primed with NTPs (20 μM UTP/ATP) or not for 10 min. before adding LPS, then cells rinsed (right pair of columns) or not (left pair of columns). LPS was then added for 3h and NLPR3 inflammasome was activated using 3 mM of ATP for 24 min. Supernatants from both conditions were compared for IL-1β production. A representative experiment of three is shown with SD. * = p < 0.05 or ** = p < 0.01 significance.
Individual or combination of ATP and UTP nucleotides increased in a dose-dependent manner the release of IL-1β, with a peaking effect around 20 μM (Figure 1D). Interestingly, no clear synergistic or additive effects were observed when ATP and UTP were combined compared with single nucleotide treatment (Figure 1D), suggesting a common receptor for both nucleotides. Therefore, 20 μM concentration was selected to be used throughout the course of this study unless otherwise mentioned.
Stimulation with different pathogen associated molecular patterns (PAMP) moieties like Poly I:C or Pam3Cys instead of LPS, when combined with nucleotides, resulted in similar upregulation in the release of IL-1β after NLRP3 was activated (Figure 1E). Addition of nucleotides at different time points, before or after LPS, to macrophages showed that the maximal potency was reached when nucleotides were combined with LPS at the same time (Figure 1F). Interestingly, when macrophages were initially incubated with NTPs, then rinsed and incubated with LPS without addition of nucleotides, the release of IL-1β after NLRP3 stimulation remained similar to cells treated only with LPS (Figure 1G), suggesting a requirement for both LPS and nucleotide signals to synergize in order to increase the production of IL-1β.
2.2. Nucleotides Increase Il1b Gene Expression, but Do not Affect NLRP3 Priming nor Activation
We then found that NTPs priming did not affect other outcomes of NLRP3 inflammasome activation, and the release of IL-18, pyroptosis (as measured by LDH release), or the percentage of ASC-specking macrophages, were not increased (Figure 2A–C). Furthermore, similar caspase-1 p10 subunit was detected on the supernatants of macrophages primed with NTPs (Figure 2D). Also, gene expression of inflammasome components Nlrp3, Pycard, Casp1 or Il18 was not increased when LPS priming was performed in the presence of NTPs (Figure 2E). NLRP3 protein expression was also not altered when NTPs were added during LPS priming (Figure 2F). However, pro-IL-1β protein increased in macrophages stimulated with LPS and NTPs (Figure 2F). This increase in IL-1β protein, was also confirmed at transcriptional level (Figure 2G), suggesting that the enhanced release of IL-1β after NLRP3 activation could be due to an increase in gene expression.
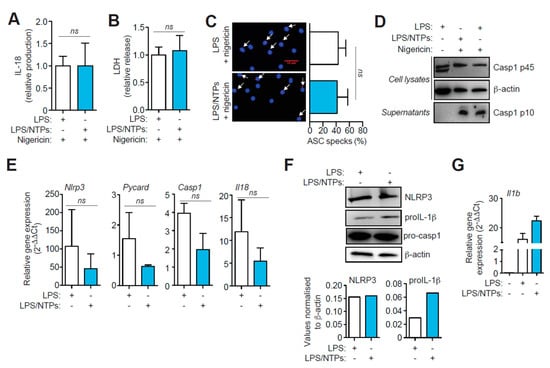
Figure 2.
Nucleotides prime Il1b production but do not affect NLRP3 inflammasome activation. (A) ELISA of IL-18 produced by peritoneal macrophages (RPMs) primed with LPS in the absence or presence of nucleotides (NTPs: 20 μM UTP/ATP) and then activated with nigericin. Average of four experiments is shown +SEM, corresponding to an average of 87.8 pg/mL of IL-18 in LPS + nigericin condition. (B) LDH release analysis from RPMs treated as in (A). Normalized average +SEM of 16 experiments is shown. (C) RPMs treated as in (A) and stained for ASC (red) and nuclei (DAPI, blue) (left panels). White arrows indicate ASC specking macrophages. Red bar indicates scale (30 μm). Quantification of the percentage of ASC specking macrophages of three fields from duplicates experiments (right panels); graph represents the average of five experiments +SEM. (D) Representative analysis by Western blot of cell lysate and supernatants of macrophages primed with LPS only (left and right lanes) or LPS with NTPs (middle lane) and then activated with nigericin as indicated; β-actin loading control is the same shown in Figure 1C, as there are the same blots shown in that figure but revealed with anti-caspase-1 antibody. (E) qPCR of the indicated genes after 3 h with LPS (white bars) or LPS+NTPs (blue bars) to Hprt1 housekeeping gene expression and represented as 2-ΔΔCt values; average of 3 experiments is shown +SD. (F) Western blot for NLRP3, IL-1β, pro-caspase-1 and β-actin from cells treated as in (D) (top panel); normalized expression of NLRP3 and IL-1β to β-actin expression (bottom panel). (G) qPCR analysis of Il1b gene from cells treated as in (D). A representative experiment with duplicates out of 3 experiments performed is shown +SD. ns = not significative.
2.3. Nucleotides Induce a Specific Proinflammatory Signature during LPS Priming
Production of inflammasome-independent cytokines like IL-6 and TNF-α was also analyzed in the supernatants of RPMs stimulated for 3 h in the presence of LPS alone or LPS with nucleotides. Nucleotides induced a decrease in TNF-α production, whereas secretion of IL-6 was increased (Figure 3A). Gene expression analysis indicated that TNF-α transcription was also decreased when nucleotides were incubated with LPS (Figure 3B). However, IL-6 gene expression remained unchanged (Figure 3B), indicating that nucleotides did not interfere with IL-6 gene transcription.
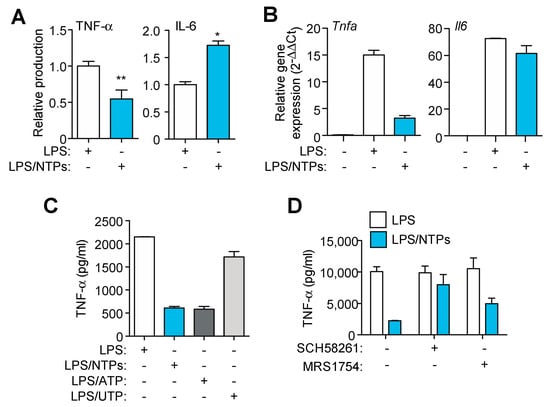
Figure 3.
Nucleotides decrease TNF-α while increase IL-6 production. (A) ELISA for TNF-α and IL-6 in supernatants from peritoneal macrophages (RPMs) treated with LPS for 3 h in the presence (blue bars) or absence (white bars) of nucleotides (NTPs: 20 μM UTP/ATP) without activating the NLRP3 inflammasome. Normalized data shows average +SEM from eleven (TNF-α) and seven (IL-6) experiments. (B) qPCR analysis of TNF-α and IL-6 from RPMs treated as in (A); a representative experiment of three is shown +SD. (C) ELISA for TNF-α from cells treated as in (A), but combining nucleotides or separating them as indicated, one representative experiment out of three is shown +SD. (D) Supernatants from RPMs pretreated with the indicated inhibitors before being activated were analyzed for TNF-α; a representative experiment out of two is shown +SD. * = p < 0.05 or ** = p < 0.01 significance.
Since adenosine receptors have already been described to be involved in decreasing TNF-α mediated inflammatory response [10], we sought to confirm that the observed decrease in TNF-α was due to the conversion of ATP to adenosine. First we confirmed that TNF-α was only decreased when ATP and not UTP was used during LPS priming (Figure 3C), pointing to a degradation of ATP into adenosine as a putative cause. Second, we found that when the inhibitor of adenosine A2A receptor SCH58261 and A2B receptor MRS1754 were used, the decrease in TNF-α production induced by nucleotides was reverted (Figure 3D). Adenosine inhibition did not affected IL-6 release enhanced by nucleotides (not shown). These data indicate that nucleotides induce a specific proinflammatory signature, with some proinflammatory cytokines increased (IL-1β, IL-6) whereas others (TNF-α) are decreased.
2.4. Nucleotides Activate P2Y2 Purinergic Receptor to Increase IL-1β Production
To further characterize the putative purinergic receptor(s) responsible for the observed increase in IL-1β, we initially performed a qPCR analysis of purinergic receptors expression in RPMs (Figure 4A), finding elevated expression of P2rx4, P2rx7, and also of P2ry2, P2ry6, P2ry12, P2ry13 and P2ry14. The use of ATP-γS, an ATP analog that cannot be degraded but also an agonist of purinergic receptors, confirmed that ATP, and not a degradation product, was responsible for the increase in IL-1β (Figure 4B).
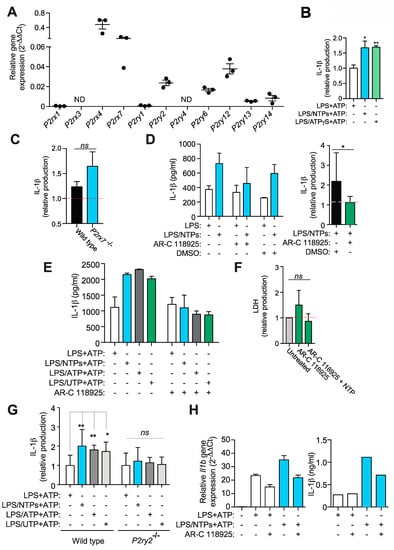
Figure 4.
Nucleotides signal through P2Y2R to increase IL-1β production. (A) Expression by qPCR of purinergic receptors from resting peritoneal macrophages (RPMs) from three experiments +SEM. (B) RPMs were treated with NTPs (blue bar, 20 μM UTP/ATP) or ATP-γS (green bar) for 10 min before adding LPS for 3 h and then NLPR3 inflammasome was activated using 3 mM ATP for 24 min. Supernatants collected were analyzed for IL-1β production. Average of three experiments +SEM is shown. (C) Normalized IL-1β release from wild type or P2rx7−/− RPM primed with LPS+NTPs and then activated with nigericin; relative values to RPM primed with LPS alone and then treated with nigericin (red dotted line). Average of three experiments +SEM is shown. (D) A representative experiment of five showing IL-1β production +SD by RPMs pretreated with or without the P2Y2R inhibitor AR-C118925xx or DMSO vehicle as indicated before priming with LPS in the presence (blue bars) or absence (white bars) of nucleotides (NTPs: 20 μM UTP/ATP) and then activated for NLRP3 with 3 mM ATP (left panel). Average of seven experiments is shown on graph on the right side +SEM. Dashed line indicates normalized IL-1β production value to LPS without nucleotides. (E) IL-1β ELISA from RPMs supernatants primed with LPS alone (white bars) or together NTP (blue bars, 20 μM UTP/ATP), ATP (grey bars) or UTP (green bars) before NLRP3 activation with 3 mM ATP. One experiment out of three is shown +SD. (F) Extracellular LDH as a marker of cell death from RPMs treated with AR-C118925xx in the presence or absence of NTPs. (G) IL-1β ELISA analysis of supernatants from wild type or P2ry2−/− RPMs stimulated as in (E); an average +SEM from samples of seven experiments is shown. Data was normalized to LPS alone. (H) Supernatants from RPMs treated as in (D) were analyzed for IL-1β by ELISA and compared with the expression of Il1b gene by qPCR from the same RPMs cell lysates obtained before NLRP3 activation; a representative experiment of 2 is shown +SD. * = p < 0.05 or ** = p < 0.01 significance; ns = not significative; ND: Not detected.
Knowing that either ATP or UTP were able to induce the increase in IL-1β production (Figure 1D), we first rule out the involvement of the P2X7R (Figure 4C). RPMs express P2ry2 (Figure 4A), the only purinergic receptor expressed in RPMs able to respond to both nucleotides, so we tested the blockade of this receptor with the specific inhibitor AR-C118925xx. As shown in Figure 4D, RPMs treated with AR-C118925xx prior LPS and NTPs challenge reduced the amount of IL-1β produced after P2X7R activation to levels similar to those induced with only LPS. When NLRP3 was activated by nigericin, AR-C118925xx was also able to decrease IL-1β release when cells were incubated with LPS and nucleotides (not shown).
Treatment with AR-C118925xx inhibited the increase induced by LPS and ATP alone or LPS and UTP alone (Figure 4E), without inducing cytotoxicity (Figure 4F), indicating that no other purinergic receptor was involved. Similarly, AR-C118925xx was able to slightly decrease IL-6 production enhanced by NTPs (not shown), suggesting that P2Y2R and not adenosine receptors could have a role in IL-6 release, as has been shown for other cytokines [14]. We further confirmed the role of P2Y2R in this effect when macrophages isolated from animals deficient in this receptor were compared with wild type counterparts and found that nucleotides treatment during LPS priming were not able to affect the release of IL-1β (Figure 4G). P2Y2R was also found responsible to the increase in Il1b gene expression when nucleotides were present during LPS priming (Figure 4H).
2.5. P2Y2R-Induced JNK Activation is Responsible for Increased in IL-1β Production
P2Y2 receptor is a seven transmembrane receptor that belongs to the G-protein coupled receptor family. Some of these receptors signal through a mechanism that involves activation of phospholipase C (PLC) and intracellular calcium release [15]. However, when RPMs were pretreated with inhibitors of PLC (U73122) or intracellular calcium was blocked with BAPTA-AM or depleted with thapsigargin, the specific increase in IL-1β induced by nucleotides was not reduced (Figure 5A and data not shown). Moreover, cells treated with U73122 and then stimulated with LPS and NTPs for a short period of time (25 min), to avoid cytotoxicity or loss of inhibition, presented higher levels of Il1b gene expression when compared to LPS alone (Figure 5B). Similarly, inhibition of the PI3K pathway with LY294002 or wortmannin did not block the nucleotides specific increase of IL-1β (data not shown).
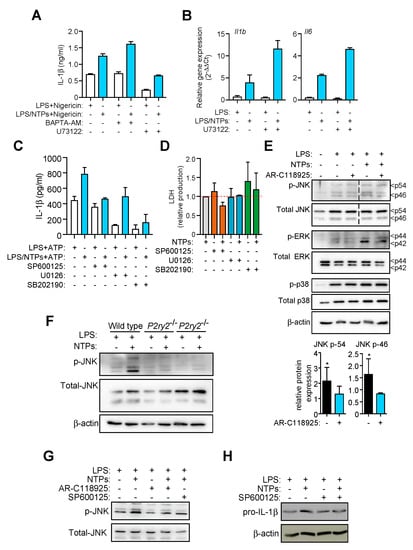
Figure 5.
Nucleotides induce an increase in MAPK JNK activity to enhance IL-1β production. (A) IL-1β ELISA in supernatants from resting peritoneal macrophages (RPMs) pretreated with BAPTA-AM at 13 μM or the PLC inhibitor U73122 at 2.5 μM for 20 min prior LPS priming with (blue bars) or without (white bars) NTPs (20 μM UTP/ATP) and then NLRP3 was activated with nigericin. A representative experiment of five is shown with +SD. (B) Expression by qPCR analysis of Il1b and Il6 genes from mRNA extracted from RPMs preincubated or not with U73122 at 5 μM for 20 min and then primed with LPS with or without NTPs (20 μM UTP/ATP) for 2 h. Graph shows one experiment of two represented as relative gene expression normalized to Hprt1 expression +SD. (C) IL-1β ELISA from peritoneal macrophages (RPMs) supernatants pretreated or not with the indicated JNK, ERK1/2, or p38 (SP600125, U0126, or SB202190 respectively) inhibitor for 20 min prior LPS priming with (blue bars) or without (white bars) nucleotides (NTPs: 20 μM UTP/ATP) for 3 h following NLRP3 activation with 3 mM ATP. One representative experiment out of 3 is shown +SD. (D) Extracellular LDH as a marker of cell death from RPMs treated with SP600125, U0126 or SB202190, in the presence or absence of NTPs. Average of four (SP600125) or two (U0126, SB202190) experiments +SEM is shown. (E) Lysates from RPMs pretreated with AR-C118925xx inhibitor and stimulated for 25 min with LPS with NTPs (20 μM UTP/ATP) were analyzed for MAPK levels by western blot (top). Dashed line indicates lanes were eliminated from the image to compose the final picture. One experiment out of 3 is shown. Quantification of band intensity of four experiments +SEM of phospho-JNK p-54 and p-46 normalized to total JNK is shown (bottom). (F) RPMs cell lysates from wild-type or P2ry2−/− mice were analyzed by western blot for the indicated proteins; one experiment out of 2 is shown. (G) Lysates from RPMs pretreated with or without AR-C118925xx or SP600125 inhibitor for 20 min and then stimulated for 25 min with LPS or LPS+NTPs (20 μM UTP/ATP) were analyzed for JNK protein levels by western blot. (H) Lysates from RPMs pretreated with or without SP600125 inhibitor for 20 min and then stimulated for 2 h with LPS or LPS+NTPs (20 μM UTP/ATP) were analyzed for pro-IL-1β and β-actin protein levels by western blot. * = p < 0.05 significance.
Considering we had observed an increase in Il1b expression (Figure 2) we explored common pathways between P2Y2R and Toll-like receptors (TLRs) that will result in a transcriptional upregulation. In this regard, mitogen-activated protein kinase (MAPK) activity is found downstream activation of TLRs and purinergic P2Y receptors [16,17,18]. This prompted us to study the effect of nucleotide treatment on the classical ERK1/2, p38 and JNK MAPKs. When specific inhibitors against JNK, ERK1/2 and p38 MAPK (SP600125, U0126 and SB202190 respectively) were used, only the inhibition of JNK reduced the nucleotide-specific increase in IL-1β (Figure 5C), whereas the inhibition of ERK1/2 and p38 MAPKs presented a blockage of IL-1β production independently of the nucleotide treatment. The use of nucleotides alone induced no phosphorylation in JNK (not shown) supporting the idea that nucleotides need to synergize with LPS in order to enhance Il1b expression (Figure 1G). The inhibitory effect of MAPK blockers was not due to a cytotoxic effect, since they did not increase LDH release (Figure 5D) and no morphological changes were observed in the cultured macrophages (not shown).
Interestingly, we then found that nucleotides acting through P2Y2R were able to increase the phosphorylation of JNK and ERK when combined with LPS (Figure 5E). However, nucleotides did not affect p38 phosphorylation (Figure 5E). Macrophages from mice deficient in P2Y2R confirmed that nucleotides triggering this receptor were important for JNK phosphorylation (Figure 5F). Inhibition of P2Y2R with AR-C118925xx resulted in a reduced JNK phosphorylation pattern similar to that obtained with the JNK inhibitor SP600125 (Figure 5G). Interestingly, JNK inhibition also prevented pro-IL-1β enhancement induced by NTPs (Figure 5H). In our system, we also observed that addition of fetal bovine serum to the cell culture, a well-known JNK activator, when cells were stimulated only with LPS, increases basal JNK phosphorylation and production of IL-1β is equal in conditions with or without NTPs (not shown), supporting our results relating JNK activity to IL-1β production.
2.6. High Cell Density Disables Nucleotide-Induced IL-1β Production
MAPK signaling is dependent on multiple factors, including stress and survival signals as well as intercellular contact. Since we did not observe any effect on macrophage viability during activation or inhibition of MAPK, we decided to study their signaling on different cell confluences. Macrophages seeded at high cellular concentration (>106/mL) resulted in low differences in IL-1β release between cells primed only with LPS or with LPS and nucleotides (Figure 6A). Only when cells were plated at lower concentration (<0.5 × 10⁶/mL) the enhancing action of NTPs in IL-1β release was observed (Figure 6A).
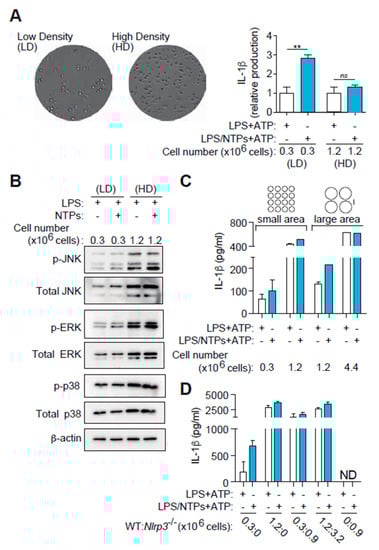
Figure 6.
High cell density induces and increase in basal MAPK signaling overriding nucleotide effect on IL-1β production. (A) Differential interference contrast (DIC) images from cells plated at low density (LD, left side) or high density (HD, right) on a p24 well plate and stimulated for 2 h with LPS. Graph on the right shows the average of seven experiments +SEM of IL-1β detected by ELISA in supernatants from peritoneal macrophages (RPMs) plated at the indicated concentrations and LPS-primed with (blue bars) or without (white bars) NTPs (20 μM UTP/ATP) for 3 h and then NLRP3 was activated with 3 mM ATP (right plot). Data is normalized to LPS values (white bars). Average of 9 experiments +SEM is shown. (B) Western blot for MAPK in RPMs lysates plated at LD or HD and stimulated for 25 min with LPS alone or with NTPs as indicated. One experiment out of two is shown. (C) IL-1β ELISA in RPMs supernatants plated at LD or HD in p96 plate (small area) or p24 plate wells (large area) and stimulated as in (A); a representative experiment out of three is shown +SD. (D) RPMs from wild-type mice were plated in wells of the same area size at LD or HD. RPMs from NLRP3-deficient mice were used to complement confluence as in HD (third column pair) or in saturated conditions (fourth column pair). An experiment out of 3 is shown +SD. ** = p < 0.01 significance; ns: non-significant; ND: Not detected.
We hypothesized that MAPK activity would be different when cells were plated at high density compared to low density to explain the differences. We proceeded to compare MAPK activation in macrophages plated at low cellular density (0.3 × 10⁶/mL) vs. high cellular density (1.2 × 10⁶/mL). As shown in Figure 6B, both MAPK levels and activity were increased when macrophages were cultured at high cell density and no increase in phosphorylation was observed when NTPs were incubated with LPS. This may be indicating that intercellular contacts in high cellular density already induce a signal through JNK that nucleotides cannot boost further up.
To confirm the importance of cell density in IL-1β production, we first changed not only cell concentration in the same plate, but we also changed plating area while maintaining the same amount of cells used at high cell density. For this purpose, we cultured 1.2 × 10⁶ macrophages in 96-well plates (small area, high density) and compared to the same quantity of macrophages cultured in 24-well plates (large area, small density) from the same plastic source brand. Figure 6C shows that nucleotides failed to enhance IL-1β production from macrophages in 96 well plates but were again able to increase IL-1β release when cultured in 24 well plates at low density.
As a final approach to confirm the importance of cell density in IL-1β production, we co-cultured inflammasome competent wild-type macrophages with NLRP3 inflammasome or caspase-1/11 deficient macrophages. Figure 6D shows that increasing cell density of a constant number of wild-type macrophages with the addition of NLRP3-deficient macrophages resulted in an increased IL-1β production independently of nucleotide signaling. This compensation was also observed when caspase-1/11 deficient macrophages were employed (data not shown).
Altogether, our results suggest that macrophages in the presence of PAMPs respond to nucleotides activating JNK through P2Y2R engagement, increasing IL-1β levels only in low cell density conditions. When cells are cultured in high density, macrophages produce more IL-1β as a consequence of increased basal JNK activity, rendering nucleotide signaling inefficient.
3. Discussion
Macrophages are important immune cells to control the initiation of the inflammatory response due to the expression of a wide array of receptors [19], and therefore are highly sensitive to stimulation with PAMP or DAMP moieties that will induce production of pro-IL-1β cytokine as well as activation of the NLRP3 inflammasome to generate the maturation of this cytokine [20]. Nucleotides control at different levels the inflammasome-related production of IL-1β and IL-18, however there are reports indicating nucleotides could either induce or inhibit their production [21,22]. The idea that nucleotides influence the NLRP3 inflammasome through purinergic receptors other than P2X7 receptor has already been suggested and reviewed [23,24], but this hypothesis require better characterization, which prompted us to analyze in detail the effect of different nucleotides on macrophages. In this study, we describe that when murine peritoneal macrophages were primed with endotoxin in the presence of low nucleotide concentrations (in the range of 2–200 μM), such as ATP and/or UTP, there is an induction of IL-1β production through P2Y2R after NLRP3 activation, whereas caspase-1 activation, IL-18 production, ASC speck formation and pyroptosis remained unchanged. This effect is most probably explained by an increase in Il1b gene expression induced by P2Y2R controlling JNK signaling, and not in changes in NLRP3 activity. On the contrary, when extracellular ATP concentration rises to the mM range and P2X7R activates before macrophage priming with endotoxin, we recently found that the activity of NLRP3 inflammasome is reduced [7].
Extracellular ATP is able to activate a wide range of purinergic receptors in target cells, and its concentration will dictate the type of receptor activated [25]. While low concentrations of ATP activate P2Y receptors and P2X1–6 receptors, higher concentrations are needed to activate P2X7R [25]. P2X7R is linked to different signaling pathways, and its activation could contribute not only to the activation of the NLRP3 inflammasome, but also affects the cellular energy metabolism, host-pathogen interactions and cell death [26].
Interestingly, other inflammasome-independent proinflammatory cytokines, like IL-6 and TNF-α, were increased and decreased respectively, indicating a specific inflammatory response of macrophages when confronted to PAMPs and nucleotides. Decrease of TNF-α has already been described when adenosine receptors are activated together with LPS [10,27], and our study also confirmed adenosine receptors as responsible for TNF-α decrease, probably due to ATP degradation to adenosine. The fact that nucleotides imprint a specific inflammatory signature in macrophages has important consequences for anti-inflammatory treatment therapies in diseases such as inflammatory bowel disease, autoimmune arthritis, cardiovascular diseases, cancer or even obesity [28,29,30,31]. IL-6 is found increased after nucleotide treatment, suggesting that P2Y2R could favor the release of cytokines, similarly to the effect of P2Y2R found to be able to release MCP-1 without altering the mRNA levels [14].
Our study found P2X4 receptor as highly expressed in mouse peritoneal macrophages, as has been previously reported [32]. However, the relatively high expression of p2yr2 gene as well as response to low concentrations of ATP or UTP directed us to target P2Y2R as the sensor responsible for the observed increase in IL-1β. Nonetheless, we cannot rule out a combined effect of different purinergic receptors affecting the increase of IL-1β, whose effect is reduced if one of the receptor’s signaling, as P2Y2R, is absent or blocked. In fact, P2X4 receptor has been implicated in IL-1β release [33,34] and could also modulate the increase of IL-1β when ATP was applied to the macrophages. We found that the inhibition or genetic deficiency of P2Y2R restored NLRP3-dependent IL-1β release to levels obtained only with LPS priming. Given that P2Y2R signaling affects pro-IL-1β synthesis, the increase in IL-1β production should not be restricted to the activation of NLRP3, but also could affect other inflammasome activation, such as NLRC4. However, the differential presence of P2Y2R in different type of macrophages will shape the response to ATP or UTP, since this effect is not present in THP1 or BMDM. This could be due to either a lack of P2Y2R receptor or membrane expression or P2Y2R might not be similarly coupled to JNK signaling and differently coupled to other pathways. The role of P2Y2R is unclear in the inflammatory processes, with paradoxical reports. P2Y2R has been involved in cell clearance processes and thus helping maintaining homeostasis [8]. However, P2Y2R has also been shown to be involved in pro-inflammatory responses [35,36]. Recently, it has been described that P2Y2R is required to induce IL-1β production in irradiated tumor cells by a pannexin-1-dependent mechanism [37], although the downstream P2Y2R signaling is unknown, it would suggest a physiological context in which macrophages would show a pro-inflammatory response as indicated in this manuscript. P2Y2R, as many G protein-coupled receptors, signals through PI3K, PLC activation and a subsequent intracellular calcium release [14], although the exact mechanism remains unclear [38,39]. However, we have not observed a requirement for PI3K, PLC or intracellular calcium signaling when P2Y2R increased IL-1β production, suggesting an alternative pathway of the classical P2Y2R activation, as it has been described for endothelial cells [40]. Similarly, PLC-independent mechanisms by which P2Y2R can modify cytokine production in macrophages have also been described [14], although the exact mechanism remains unclear.
The observation that Il1b gene expression was increased by P2Y2R activation prompt us to test other pathways that were also downstream purinergic receptors and induced Il1b gene transcription, and MAPK have been recently found downstream purinergic receptors in human monocytes [41,42]. We found that inhibition of JNK MAPK resulted in a decrease in nucleotide-induced IL-1β, whereas inhibition of the other two classical MAPK, ERK1/2 and p38, resulted in a general IL-1β decrease, but did not affect P2Y2R-increased IL-1β release. The importance of JNK activity in IL-1β production by macrophages has already been described for the activation of the inflammasome by calcium crystals [43] or palmitate [44]. Increased NLRP3 activation by ATP or UTP has also been described; however, P2Y2R was not responsible for this activation [45]. Furthermore, JNK has been implicated in the direct activation of NLRP3 inflammasome by phosphorylating its PYD domain and favoring ASC engagement [46]. Our results confirm that P2Y2R was not affecting the activation of NLRP3, but enhanced Il1b transcription by JNK activation, and this model is not incompatible with a direct NLRP3 phosphorylation.
We also describe how nucleotides influence macrophage response depending on cell density. A common approach used in experiments to assess inflammasome activation is to set cell cultures at full confluence. However, macrophages in vivo are present more dispersed in steady state conditions or even during pathological settings, with some exceptions as parasite infections, foreign object presence, granulomas and some tumor locations, where they aggregate at high concentration. It is therefore of interest to analyze the function of macrophages at low densities. We have found that IL-1β production can be enhanced by nucleotides only when macrophages are cultured at low concentration. This effect correlates with an increased JNK activation in cells at high concentration. Signaling through JNK (originally named stress activated protein kinase) in macrophages is linked to inflammation [47]. High cell density cultures provide neighboring cells with important interactions that resulted in an important increase in MAPK activity (and probably other pathways) and possible more stable signals sustained in time than the activation of P2Y2R. As a consequence, much higher IL-1β production is obtained from high density cultures, even when high density is reached supplementing NLRP3-deficient macrophages to low density wild type macrophages.
In summary, future studies to further examine the role of extracellular nucleotides and P2Y2R signaling during in vivo inflammatory conditions, as well as their potential as novel receptors to treat inflammation are warranted.
4. Materials and Methods
4.1. Reagents
ATP, UTP, adenosine 5′-o-(3-thiotriphosphate) tetralithium salt (ATP-γS), and nigericin were purchased from Sigma-Aldrich (St. Louis, MO, USA). AR-C118925xx, SP600125, SB202190, U0126, U73122, SCH58261, MRS1754, BAPTA-AM, thapsigargin, wortmannin were purchased from Tocris Bioscience (Bio-techne, Bristol, UK).
4.2. Animals
C57BL/6 (wild-type) mice were purchased from Harlan Laboratories (Indianapolis, IN, USA) and bred in the local animal facility. NLRP3-, Caspase-1/11- and P2X7R-deficient (Nlrp3−/−, Casp1/11−/− and P2rx7−/− respectively) [48,49] mice in C57BL/6 background were bred in our facilities. For all experiments, mice aged 8–24 weeks were used, in accordance with the University Hospital Virgen Arrixaca animal experimentation guidelines, and the Spanish national (RD 1201/2005 and Law 32/2007) and European Union (86/609/EEC and 2010/63/EU) legislation. According to the cited legislation, local ethics committee review or approval is not needed, because the mice were killed by CO2 inhalation and used to obtain peritoneal lavage or tissues. No procedure was undertaken to live animals that compromised animal welfare.
4.3. Isolation and Culture of Macrophages
Resident peritoneal macrophages (RPMs) were isolated from resting C57/BL6 mice peritoneal cavity previously euthanized with CO2 by lavage using cold PBS with 2 mM EDTA. Macrophages were further enriched by magnetic depletion of CD19+ and CD5+ cells using magnetic microbeads (Miltenyi Biotech, Bergisch Gladbach, Germany). To confirm macrophage enrichment, initial tests of samples before and after magnetic bead purification were analyzed by flow cytometry for expression of F4/80 (antiF4/80-alexa488, clone BM8, BioLegend, San Diego, CA, USA), MHC-II (anti-MHC-PE conjugated, clone M5/114.15.2, eBiosciences, San Diego, CA, USA) or CD19 (PE-conjugated, clone eBio1D3, eBiosciences) and analyzed in a FACSCanto cytometer (BD Biosciences, San Diego, CA, USA). Cells were plated at 0.3 × 10⁶ cell/mL (low density) or 1.2 × 10⁶ cell/mL (high density) for 1 h in RPMI-1640 media (Life Technologies, Carlsbad, CA, USA) with 10 mM HEPES and 2 mM L-glutamine (BioWhittaker—Lonza, Basel, Switzerland) (supplemented RPMI) and complemented with 5% fetal bovine serum (FBS, Life Technologies). Plate wells were then rinsed with pre-warmed PBS to remove non-adherent cells and further enrich the macrophage culture. Cells were then cultured for a minimum of 2 h in supplemented RPMI with 0.5% endotoxin free, sterile filtered bovine serum albumin (Sigma). Bone marrow derived macrophages (BMDM) were differentiated for 7 days in the presence of L-cell media as already described [50]. Differentiation of THP-1 cells was performed in RPMI media supplemented with 10% FBS and 0.2 μM PMA for 4 h, then media was replaced with fresh media with FBS without PMA and cells were incubated overnight. Cells were then rinsed and media without FBS was added for cell stimulation.
Cells were stimulated for 3 h with either 200 ng/mL of ultrapure LPS from E. coli 0111:B (InvivoGen, San Diego, CA, USA), 2 μg/mL of Pam3CSK4 (InvivoGen) or 20 μg/mL of Poly I:C (InvivoGen) in the presence or absence of 20 μM of ATP and/or 20 μM of UTP, unless otherwise indicated. Supernatants from this initial priming step were recovered when needed for cytokine detection, and plates were rinsed with PBS and then with physiological buffer (147 NaCl, 10 HEPES, 13 D-glucose, 2 KCl, 2 CaCl2, and 1 MgCl2; pH 7.4, all in mM concentration). Finally, cells were stimulated with physiological buffer containing or not 3 mM of ATP or 5 μM nigericin, for 24 min, and then supernatants were recovered, cleared and stored at −80 °C.
4.4. LDH Determination
Pyroptosis was analyzed by measurement of released lactate dehydrogenase (LDH) in the supernatants using the Cytotoxicity Detection kit (Roche, Barcelona, Spain) following the manufacturer’s instructions, and expressed as percentage of total cell LDH content, using samples from cells lysed in 1% Triton X-100 buffer.
4.5. ELISA
Supernatants from cultured macrophages in duplicate wells were cleared at 500× g to remove any remaining cell. IL-1β was analyzed with Affimetrix’ Ready-Set-Go (BioLegend) ELISA kit. TNF-α, IL-6 and IL-18 were analyzed by Quantikine ELISA (R&D, Biotechne, Minneapolis, MN, USA).
4.6. Microscopy
RPMs were seeded at the desired concentration (0.4 × 10⁶ or 1.2 × 10⁶ cell/mL) onto coverslips with RPMI media with 5% FBS. After being activated with 5 μM nigericin, 3 mM ATP, cells were fixed in 2% paraformaldehyde. Cells were blocked with autologous serum and stained with primary anti-ASC (HASC-71, BioLegend) and secondary donkey anti-mouse AlexaFluor488 (Molecular Probes, Thermo Fisher Scientific, Waltham, MA, USA) and mounted on slides with DAPI-containing mounting medium (Prolong diamond antifade, Life Technologies). Images were acquired with an Eclipse Ti microscope (Nikon, Tokyo, Japan) equipped with a 10× (numerical aperture, 0.30) or 20× S Plan Fluor objective (numerical aperture, 0.45) and a digital Sight DS-QiMc camera (Nikon) and 387 nm/447 nm and 482 nm/536 nm filter sets (Semrock, Lake Forest, IL, USA).
4.7. Quantitative Reverse Transcriptase-PCR Analysis
mRNA was obtained using the RNeasy Mini kit (Qiagen, Venlo, The Netherlands) as per manufacturer instructions. Quantitative PCR was performed using SYBR Premix ExTaq (Takara, Göteborg, Sweden). Specific primers were purchased from Qiagen (QuantiTech Primer Assays). For each primer set, the efficiency was >95%, and a single product was obtained on melt curve analysis. The presented relative gene expression levels were calculated using the 2ΔΔCt method normalizing to the endogenous Hprt1 expression levels, as a house keeping control, for each treatment, and the fold increase in expression was relative to the smallest expression level or to the control basal levels.
4.8. Western Blot Analysis
Cells were plated at 0.3 × 10⁶ cell/mL (low density) or 1.2 × 10⁶ cell/mL (high density) were rinsed with cold PBS and lysed in 1% NP40 buffer supplemented with protease inhibitor cocktail (Sigma-Aldrich) and phosphatase inhibitor (PhosSTOP, Roche). Cell lysates and supernatants were resolved in 12% acrylamide SDS-PAGE gels and blotted into a PVDF membrane for mIL-1β (H-153, Santa Cruz, Dallas, TX, USA), NLRP3 (Cryo-2 AG-20B-0014, Adipogen, Liestal Switzerland) or anti MAPK antibodies anti-Phospho JNK (Thr183,Tyr 185, Cat. 9251S), anti-JNK (Cat. 9252S), anti-Phospho-p44/42 (phospho-Erk1/2) (Thr202, Tyr 204, Cat. 4377), anti-p44/42 (Erk1/2), anti-phospho p38 (Thr 180/Tyr 185, Cat. 9211) or anti-p38 (Cat. 9212) (all from Cell Signaling Technology, Danvers, MA, USA). Primary antibody incubation was performed overnight in 3% bovine serum albumin (Sigma-Aldrich) or 5% w/v Difco skim milk (BD Biosciences). Primary antibodies were revealed using the corresponding secondary anti-mouse, or anti-rabbit IgG-peroxidase horseradish linked (GE-Healthcare, Munich, Germany). Analysis of protein bands was performed using Image Lab software (Bio-Rad Laboratories, Hercules, CA, USA), and values were normalized to β-actin.
4.9. Statistical Analysis
Data is shown with +SEM or +SD as indicated. For some experiments (mainly ELISAs) data was normalized dividing tests values by that obtained by control (i.e., LPS only, or no inhibitor control), thus, control test was given value “1” and the tests results are proportional to that control. In other experiments, due to large differences in the potency of the response of the cells in the different repeated experiments, we show a representative experiment of the replicates. Statistical analysis was performed using Prism software (GraphPad Inc., La Jolla, CA, USA) by testing two-way ANOVA with Sidak’s multiple comparison test for multiple comparisons or by multiple t-test between 2 groups.
Author Contributions
Conceived and designed the experiments: G.d.l.R., P.P. Performed the experiments: G.d.l.R., A.I.G., M.C.B. Analyzed the data: G.d.l.R., P.P. Wrote the paper: G.d.l.R., P.P. All authors have read and agreed to the published version of the manuscript.
Funding
This work was supported by Ministerio de Economía, Industria y Competitividad (grant SAF2017-88276-R), Fundación Séneca (grants 20859/PI/18 and 21081/PDC/19), and the European Research Council (ERC-2013-CoG grant 614578).
Acknowledgments
The authors are grateful to Miguel Diaz Hernandez at the Department of Biochemistry and Molecular Biology, Universidad Complutense de Madrid, for providing P2ry2−/− mice.
Conflicts of Interest
The authors declare no conflict of interest. The funders had no role in the design of the study; in the collection, analyses, or interpretation of data; in the writing of the manuscript, or in the decision to publish the results.
Abbreviations
| ATP-γS | Adenosine 5′-O-(3-thiotriphosphate) |
| BMDM | Bone marrow derived macrophages |
| eATP | Extracellular adenosine 5’-triphosphate |
| IL | Interleukin |
| LDH | Lactate dehydrogenase |
| LPS | Lipopolysaccharide |
| MAPK | Mitogen-activated protein kinase |
| NTPs | Nucleotides, in this work a mixture of ATP and UTP |
| P2X7R | Purinergic P2X receptor 7 |
| P2Y2R | Purinergic P2Y2 receptor |
| PAMP | Pathogen associated molecular patterns |
| PLC | Phospholipase C |
| RPMs | Residential peritoneal macrophages |
| TLR | Toll-like receptors |
References
- He, W.-T.; Wan, H.; Hu, L.; Chen, P.; Wang, X.; Huang, Z.; Yang, Z.-H.; Zhong, C.-Q.; Han, J. Gasdermin D is an executor of pyroptosis and required for interleukin-1β secretion. Cell Res. 2015, 25, 1285–1298. [Google Scholar] [CrossRef]
- Strowig, T.; Henao-Mejia, J.; Elinav, E.; Flavell, R. Inflammasomes in health and disease. Nat. 2012, 481, 278–286. [Google Scholar] [CrossRef]
- Brož, P.; Pelegrin, P.; Shao, F. The gasdermins, a protein family executing cell death and inflammation. Nat. Rev. Immunol. 2019, 20, 143–157. [Google Scholar] [CrossRef]
- Gaidt, M.M.; Ebert, T.S.; Chauhan, D.; Schmidt, T.; Schmid-Burgk, J.L.; Rapino, F.; Robertson, A.A.; Cooper, M.A.; Graf, T.; Hornung, V. Human Monocytes Engage an Alternative Inflammasome Pathway. Immunity 2016, 44, 833–846. [Google Scholar] [CrossRef]
- Semino, C.; Carta, S.; Gattorno, M.; Sitia, R.; Rubartelli, A. Progressive waves of IL-1β release by primary human monocytes via sequential activation of vesicular and gasdermin D-mediated secretory pathways. Cell Death Dis. 2018, 9, 1088. [Google Scholar] [CrossRef]
- Surprenant, A.; Rassendren, F.; Kawashima, E.; North, R.A.; Buell, G. The cytolytic P2Z receptor for extracellular ATP identified as a P2X receptor (P2X7). Science 1996, 272, 735–738. [Google Scholar] [CrossRef]
- Martinez-García, J.J.; Martínez-Banaclocha, H.; Angosto-Bazarra, D.; De Torre-Minguela, C.; Baroja-Mazo, A.; Alarcón-Vila, C.; Martinez-Alarcon, L.; Amores-Iniesta, J.; Martín-Sánchez, F.; Ercole, G.A.; et al. P2X7 receptor induces mitochondrial failure in monocytes and compromises NLRP3 inflammasome activation during sepsis. Nat. Commun. 2019, 10, 1–14. [Google Scholar] [CrossRef]
- Elliott, M.R.; Chekeni, F.B.; Trampont, P.C.; Lazarowski, E.R.; Kadl, A.; Walk, S.F.; Park, D.; Woodson, R.I.; Ostankovitch, M.; Sharma, P.; et al. Nucleotides released by apoptotic cells act as a find-me signal to promote phagocytic clearance. Nature 2009, 461, 282–286. [Google Scholar] [CrossRef] [PubMed]
- Ghiringhelli, F.; Apetoh, L.; Tesniere, A.; Aymeric, L.; Ma, Y.; Ortiz, C.; Vermaelen, K.; Panaretakis, T.; Mignot, G.; Ullrich, E.; et al. Activation of the NLRP3 inflammasome in dendritic cells induces IL-1β–dependent adaptive immunity against tumors. Nat. Med. 2009, 15, 1170–1178. [Google Scholar] [CrossRef]
- Hamidzadeh, K.; Mosser, D.M. Purinergic Signaling to Terminate TLR Responses in Macrophages. Front. Immunol. 2016, 7, 197. [Google Scholar] [CrossRef]
- Cekic, C.; Linden, J. Purinergic regulation of the immune system. Nat. Rev. Immunol. 2016, 16, 177–192. [Google Scholar] [CrossRef] [PubMed]
- Wang, J.; Kubes, P. A Reservoir of Mature Cavity Macrophages that Can Rapidly Invade Visceral Organs to Affect Tissue Repair. Cell 2016, 165, 668–678. [Google Scholar] [CrossRef]
- Ghosn, E.E.B.; Cassado, A.A.; Govoni, G.R.; Fukuhara, T.; Yang, Y.; Monack, D.M.; Bortoluci, K.R.; Almeida, S.; Herzenberg, L.A.; Herzenberg, L.A. Two physically, functionally, and developmentally distinct peritoneal macrophage subsets. Proc. Natl. Acad. Sci. USA 2010, 107, 2568–2573. [Google Scholar] [CrossRef]
- Stokes, L.; Surprenant, A. Purinergic P2Y2 receptors induce increased MCP-1/CCL2 synthesis and release from rat alveolar and peritoneal macrophages. J. Immunol. 2007, 179, 6016–6023. [Google Scholar] [CrossRef] [PubMed]
- Ivar, K.V.; Harden, T.K. Molecular Pharmacology, Physiology, and Structure of the P2Y Receptors. Adv. Pharmacol. 2011, 61, 373–415. [Google Scholar] [CrossRef]
- Kawai, T.; Akira, S. Signaling to NF-κB by Toll-like receptors. Trends Mol. Med. 2007, 13, 460–469. [Google Scholar] [CrossRef]
- Dixon, C.J.; White, P.J.; Hall, J.F.; Kingston, S.; Boarder, M.R. Regulation of Human Hepatocytes by P2Y Receptors: Control of Glycogen Phosphorylase, Ca2+, and Mitogen-Activated Protein Kinases. J. Pharmacol. Exp. Ther. 2005, 313, 1305–1313. [Google Scholar] [CrossRef]
- Hao, Y.; Liang, J.F.; Chow, A.W.; Cheung, W.-T.; Ko, W.-H. P2Y6 Receptor-Mediated Proinflammatory Signaling in Human Bronchial Epithelia. PLoS ONE 2014, 9, e106235. [Google Scholar] [CrossRef]
- Taylor, P.R.; Martínez-Pomares, L.; Stacey, M.; Lin, H.-H.; Brown, G.D.; Gordon, S. MACROPHAGE RECEPTORS AND IMMUNE RECOGNITION. Annu. Rev. Immunol. 2005, 23, 901–944. [Google Scholar] [CrossRef]
- Mariathasan, S.; Weiss, D.S.; Newton, K.; McBride, J.; O’Rourke, K.; Roose-Girma, M.; Lee, W.P.; Weinrauch, Y.; Monack, D.M.; Dixit, V.M. Cryopyrin activates the inflammasome in response to toxins and ATP. Nature 2006, 440, 228–232. [Google Scholar] [CrossRef]
- Ouyang, X.; Ghani, A.; Malik, A.; Wilder, T.; Colegio, O.; Flavell, R.A.; Cronstein, B.; Mehal, W. Adenosine is required for sustained inflammasome activation via the A₂A receptor and the HIF-1α pathway. Nat. Commun. 2013, 4, 2909. [Google Scholar] [CrossRef] [PubMed]
- Sipka, S.; Kovács, I.; Szántó, S.; Szegedi, G.; Brugós, L.; Bruckner, G.; József, S.A. Adenosine inhibits the release of interleukin-1beta in activated human peripheral mononuclear cells. Cytokine 2005, 31, 258–263. [Google Scholar] [CrossRef] [PubMed]
- Uratsuji, H.; Tada, Y.; Kawashima, T.; Kamata, M.; Hau, C.S.; Asano, Y.; Sugaya, M.; Kadono, T.; Asahina, A.; Sato, S.; et al. P2Y6 Receptor Signaling Pathway Mediates Inflammatory Responses Induced by Monosodium Urate Crystals. J. Immunol. 2011, 188, 436–444. [Google Scholar] [CrossRef]
- Gombault, A.; Baron, L.; Couillin, I. ATP release and purinergic signaling in NLRP3 inflammasome activation. Front. Immunol. 2013, 3, 1–6. [Google Scholar] [CrossRef] [PubMed]
- Surprenant, A.; North, R.A. Signaling at Purinergic P2X Receptors. Annu. Rev. Physiol. 2009, 71, 333–359. [Google Scholar] [CrossRef] [PubMed]
- Di Virgilio, F.; Ben, D.D.; Sarti, A.C.; Giuliani, A.L.; Falzoni, S. The P2X7 Receptor in Infection and Inflammation. Immunity 2017, 47, 15–31. [Google Scholar] [CrossRef] [PubMed]
- Murphy, P.S.; Wang, J.; Bhagwat, S.; Munger, J.; Janssen, W.J.; Wright, T.W.; Elliott, M.R. CD73 regulates anti-inflammatory signaling between apoptotic cells and endotoxin-conditioned tissue macrophages. Cell Death Differ. 2017, 24, 559–570. [Google Scholar] [CrossRef] [PubMed]
- Vounotrypidis, P.; Kouklakis, G.; Anagnostopoulos, K.; Zezos, P.; Polychronidis, A.; Maltezos, E.; Efremidou, E.; Pitiakoudis, M.; Lyratzopoulos, N. Interleukin-1 associations in inflammatory bowel disease and the enteropathic seronegative spondylarthritis. Autoimmun. Highlights 2013, 4, 87–94. [Google Scholar] [CrossRef]
- Dinarello, C.A.; Simon, A.; van der Meer, J.W.M. Treating inflammation by blocking interleukin-1 in a broad spectrum of diseases. Nat. Rev. Drug Discov. 2012, 11, 633–652. [Google Scholar] [CrossRef]
- Zitvogel, L.; Kepp, O.; Galluzzi, L.; Kroemer, G. Inflammasomes in carcinogenesis and anticancer immune responses. Nat. Immunol. 2012, 13, 343–351. [Google Scholar] [CrossRef]
- Wen, H.; Ting, J.P.-Y.; O’Neill, L.A.J. A role for the NLRP3 inflammasome in metabolic diseases—Did Warburg miss inflammation? Nat. Immunol. 2012, 13, 352–357. [Google Scholar] [CrossRef] [PubMed]
- A Sim, J.; Park, C.-K.; Oh, S.B.; Evans, R.J.; A North, R. P2X1and P2X4receptor currents in mouse macrophages. Br. J. Pharmacol. 2007, 152, 1283–1290. [Google Scholar] [CrossRef] [PubMed]
- Sakaki, H.; Fujiwaki, T.; Tsukimoto, M.; Kawano, A.; Harada, H.; Kojima, S. P2X4 receptor regulates P2X7 receptor-dependent IL-1β and IL-18 release in mouse bone marrow-derived dendritic cells. Biochem. Biophys. Res. Commun. 2013, 432, 406–411. [Google Scholar] [CrossRef] [PubMed]
- Hung, S.-C.; Choi, C.H.; Najwane, S.-S.; Larry, J.; Kalina, R.A.; Hanen, S.; Özlem, Y.; David, M.O. P2X4 Assembles with P2X7 and Pannexin-1 in Gingival Epithelial Cells and Modulates ATP-induced Reactive Oxygen Species Production and Inflammasome Activation. PLoS ONE 2013, 8, e70210. [Google Scholar] [CrossRef]
- Stachon, P.; Geis, S.; Peikert, A.; Heidenreich, A.; Michel, N.A.; Ünal, F.; Hoppe, N.; Dufner, B.; Schulte, L.; Marchini, T.; et al. Extracellular ATP Induces Vascular Inflammation and Atherosclerosis via Purinergic Receptor Y2in MiceHighlights. Arter. Thromb. Vasc. Boil. 2016, 36, 1577–1586. [Google Scholar] [CrossRef] [PubMed]
- Adamson, S.E.; Montgomery, G.; Seaman, S.A.; Peirce-Cottler, S.M.; Leitinger, N. Myeloid P2Y2 receptor promotes acute inflammation but is dispensable for chronic high-fat diet-induced metabolic dysfunction. Purinergic Signal. 2017, 14, 19–26. [Google Scholar] [CrossRef]
- Jin, H.; Ko, Y.S.; Kim, H.J. P2Y2R-mediated inflammasome activation is involved in tumor progression in breast cancer cells and in radiotherapy-resistant breast cancer. Int. J. Oncol. 2018, 53, 1953–1966. [Google Scholar] [CrossRef]
- Del Rey, A.; Renigunta, V.; Dalpke, A.H.; Leipziger, J.; Matos, J.E.; Robaye, B.; Zuzarte, M.; Kavelaars, A.; Hanley, P.J. Knock-out Mice Reveal the Contributions of P2Y and P2X Receptors to Nucleotide-induced Ca2+ Signaling in Macrophages. J. Biol. Chem. 2006, 281, 35147–35155. [Google Scholar] [CrossRef]
- Isfort, K.; Ebert, F.; Bornhorst, J.; Sargin, S.; Kardakaris, R.; Pasparakis, M.; Bähler, M.; Schwerdtle, T.; Schwab, A.; Hanley, P.J. Real-time Imaging Reveals That P2Y2 and P2Y12 Receptor Agonists Are Not Chemoattractants and Macrophage Chemotaxis to Complement C5a Is Phosphatidylinositol 3-Kinase (PI3K)- and p38 Mitogen-activated Protein Kinase (MAPK)-independent. J. Biol. Chem. 2011, 286, 44776–44787. [Google Scholar] [CrossRef]
- Ding, L.; Ma, W.; Littmann, T.; Camp, R.; Shen, J. The P2Y2 Nucleotide Receptor Mediates Tissue Factor Expression in Human Coronary Artery Endothelial Cells. J. Biol. Chem. 2011, 286, 27027–27038. [Google Scholar] [CrossRef]
- Lee, A.H.; Ledderose, C.; Li, X.; Slubowski, C.J.; Sueyoshi, K.; Staudenmaier, L.; Bao, Y.; Zhang, J.; Junger, W.G. Adenosine Triphosphate Release is Required for Toll-Like Receptor-Induced Monocyte/Macrophage Activation, Inflammasome Signaling, Interleukin-1β Production, and the Host Immune Response to Infection. Crit. Care Med. 2018, 46, e1183–e1189. [Google Scholar] [CrossRef] [PubMed]
- Sueyoshi, K.; Ledderose, C.; Shen, Y.; Lee, A.H.; Shapiro, N.I.; Junger, W.G. Lipopolysaccharide suppresses T cells by generating extracellular ATP that impairs their mitochondrial function via P2Y11 receptors. J. Biol. Chem. 2019, 294, 6283–6293. [Google Scholar] [CrossRef] [PubMed]
- Campillo-Gimenez, L.; Renaudin, F.; Jalabert, M.; Gras, P.; Gosset, M.; Rey, C.; Sarda, S.; Collet, C.; Cohen-Solal, M.; Combes, C.; et al. Inflammatory Potential of Four Different Phases of Calcium Pyrophosphate Relies on NF-κB Activation and MAPK Pathways. Front. Immunol. 2018, 9, 2248. [Google Scholar] [CrossRef] [PubMed]
- Riera-Borrull, M.; Cuevas, V.D.; Alonso, B.; Vega, M.A.; Joven, J.; Izquierdo, E.; Corbí, A.L. Palmitate Conditions Macrophages for Enhanced Responses toward Inflammatory Stimuli via JNK Activation. J. Immunol. 2017, 199, 3858–3869. [Google Scholar] [CrossRef] [PubMed]
- Riteau, N.; Baron, L.; Villeret, B.; Guillou, N.; Savigny, F.; Ryffel, B.; Rassendren, F.; Le Bert, M.; Gombault, A.; Couillin, I. ATP release and purinergic signaling: A common pathway for particle-mediated inflammasome activation. Cell Death Dis. 2012, 3, e403. [Google Scholar] [CrossRef] [PubMed]
- Song, N.; Liu, Z.-S.; Xue, W.; Bai, Z.-F.; Wang, Q.-Y.; Dai, J.; Liu, X.; Huang, Y.-J.; Cai, H.; Zhan, X.-Y.; et al. NLRP3 Phosphorylation Is an Essential Priming Event for Inflammasome Activation. Mol. Cell 2017, 68, 185–197.e6. [Google Scholar] [CrossRef] [PubMed]
- Han, M.S.; Jung, D.Y.; Morel, C.; Lakhani, S.; Kim, J.K.; Flavell, R.A.; Davis, R.J. JNK Expression by Macrophages Promotes Obesity-Induced Insulin Resistance and Inflammation. Science 2012, 339, 218–222. [Google Scholar] [CrossRef]
- Martinon, F.; Pétrilli, V.; Mayor, A.; Tardivel, A.; Tschopp, J. Gout-associated uric acid crystals activate the NALP3 inflammasome. Nature 2006, 440, 237–241. [Google Scholar] [CrossRef]
- Labasi, J.M.; Petrushova, N.; Donovan, C.; McCurdy, S.; Lira, P.; Payette, M.M.; Brissette, W.; Wicks, J.R.; Audoly, L.; Gabel, C.A. Absence of the P2X7 receptor alters leukocyte function and attenuates an inflammatory response. J. Immunol. 2002, 168, 6436–6445. [Google Scholar] [CrossRef]
- Compan, V.; Martín-Sánchez, F.; Baroja-Mazo, A.; Lopez-Castejon, G.; Gomez, A.I.; Verkhratsky, A.; Brough, D.; Pelegrin, P. Apoptosis-associated speck-like protein containing a CARD forms specks but does not activate caspase-1 in the absence of NLRP3 during macrophage swelling. J. Immunol. 2014, 194, 1261–1273. [Google Scholar] [CrossRef]


© 2020 by the authors. Licensee MDPI, Basel, Switzerland. This article is an open access article distributed under the terms and conditions of the Creative Commons Attribution (CC BY) license (http://creativecommons.org/licenses/by/4.0/).