Article

Honey-Mediated Wound Healing: H2O2 Entry through AQP3 Determines Extracellular Ca2+ Influx

1
DiSIT—Dipartimento di Scienze e Innovazione Tecnologica, University of Piemonte Orientale, Viale Teresa Michel 11, 15121 Alessandria, Italy
2
Department of Molecular Medicine, University of Pavia, 27100 Pavia, Italy
3
Department of Biology and Biotechnology “L. Spallanzani”, University of Pavia, 27100 Pavia, Italy
4
DiSIT—Dipartimento di Scienze e Innovazione Tecnologica, University of Piemonte Orientale, Piazza Sant’Eusebio 5, 13100 Vercelli, Italy
*
Author to whom correspondence should be addressed.
Int. J. Mol. Sci. 2019, 20(3), 764; https://doi.org/10.3390/ijms20030764
Submission received: 4 December 2018 / Revised: 22 January 2019 / Accepted: 2 February 2019 / Published: 11 February 2019
(This article belongs to the Special Issue New Innovations in Wound Healing and Repair)

Abstract

:
Since Biblical times, honey has been utilized in “folk medicine”, and in recent decades the positive qualities of honey have been re-discovered and are gaining acceptance. Scientific literature states that honey has been successfully utilized on infections not responding to classic antiseptic and antibiotic therapy, because of its intrinsic H2O2 production. In our study, we demonstrated the involvement of H2O2 as a main mediator of honey regenerative effects on an immortalized human keratinocyte cell line. We observed that this extracellularly released H2O2 could pass across the plasma membrane through a specific aquaporin (i.e., AQP3). Once in the cytoplasm H2O2, in turn, induces the entry of extracellular Ca2+ through Melastatin Transient Receptor Potential 2 (TRPM2) and Orai1 channels. Honey-induced extracellular Ca2+ entry results in wound healing, which is consistent with the role played by Ca2+ signaling in tissue regeneration. This is the first report showing that honey exposure increases intracellular Ca2+ concentration ([Ca2+]i), due to H2O2 production and redox regulation of Ca2+-permeable ion channels, opening up a new horizon for the utilization of the honey as a beneficial tool.

Graphical Abstract

1. Introduction

Wound healing is of countless significance for skin medicine and a precise focus is set on natural compounds.
Honey has been utilized as medicine in many cultures for a long time [1]. Honey is primarily a sugar-rich food source for bees. There are at least about 200 compounds described in honey, and it consists of water, mainly sugars, and other substances such as organic acids, proteins (enzymes), vitamins (i.e., niacin, vitamin B6, thiamine, riboflavin and pantothenic acid), minerals (including copper, calcium, etc.) [2].
In spite of a wide amount of literature about honey clinical practices, the subjacent mechanisms of action are still largely unclear. Accumulating records propose the contribution of specific physiological mechanisms, such as angiogenesis, granulation, and epithelialization [3].
We have recently elucidated the modulatory effects of different honey types in an in vitro model of keratinocytes and fibroblasts [4]. Our data have shown that honey treatments are poorly cytotoxic on skin cells, confirming that honey can be used safely not only for external applications on healthy skin, but also as a dressing on wounds. In addition, data coming from scratch wound observations as well as from cell migration assays have shown beyond any reasonable doubt that honey produces a striking increase of the wound repair abilities of keratinocytes and fibroblasts [4]. Taken together, our previous observations consistently suggest that honey is generally active in helping wound closure, thus confirming a bulk of anecdotal and scientific evidence [5,6].
The high concentrations of sugars (about 80%) combined with less than 1% of water causes osmotic stress preventing microorganism growth. Moreover, already during the 1960s, hydrogen peroxide (H2O2) was recognized as a major antibacterial compound present in honey. In fact, honey continuously provides H2O2, which is generated by glucose oxidase-mediated conversion of glucose [7].
Specific aquaporins (AQPs) facilitate the passive diffusion of H2O2 across the biological membranes [8]. AQP-mediated transmembrane transport of H2O2 is of physiological importance for further downstream signaling events, such as the onset of intracellular Ca2+ signals [8].
In wound healing, cellular reactions to injury are associated with an increase in intracellular Ca2+ concentration ([Ca2+]i) which activates multiple Ca2+-dependent processes associated to tissue regeneration, including proliferation, motility and differentiation [9,10,11]. Accordingly, Ca2+ has a main role in cellular homeostasis and is utilized by a plethora of extracellular cues to finely regulate cell fate [12,13,14]. Recent studies have demonstrated that also H2O2 may signal through an increase in [Ca2+]i by activating Ca2+-permeable channels located either on the endoplasmic reticulum (ER) [15], the largest endogenous Ca2+ reservoir, or on the plasma membrane. Accordingly, H2O2 has been found to induce extracellular Ca2+ entry though Orai1 and Melastatin Transient Receptor Potential 2 (TRPM2) [16,17,18,19]. Notably, AQPs have long been known to regulate the [Ca2+]i by modulating the osmotic gradient across the plasma membrane [20]. However, it is still unclear whether AQPs influence intracellular Ca2+ dynamics by mediating extracellular H2O2 entry.
Herein, we sought to investigate the functional interaction among extracellular H2O2, AQPs and plasmalemmal Ca2+-permeable channels in honey-induced skin regeneration. Our findings shed novel light on the intracellular mechanisms by which honey uses reactive oxygen species (ROS) to induce wound closure and hint at H2O2 as a key signaling messenger to induce tissue remodeling due to its ability to trigger intracellular Ca2+ signals.

2. Results

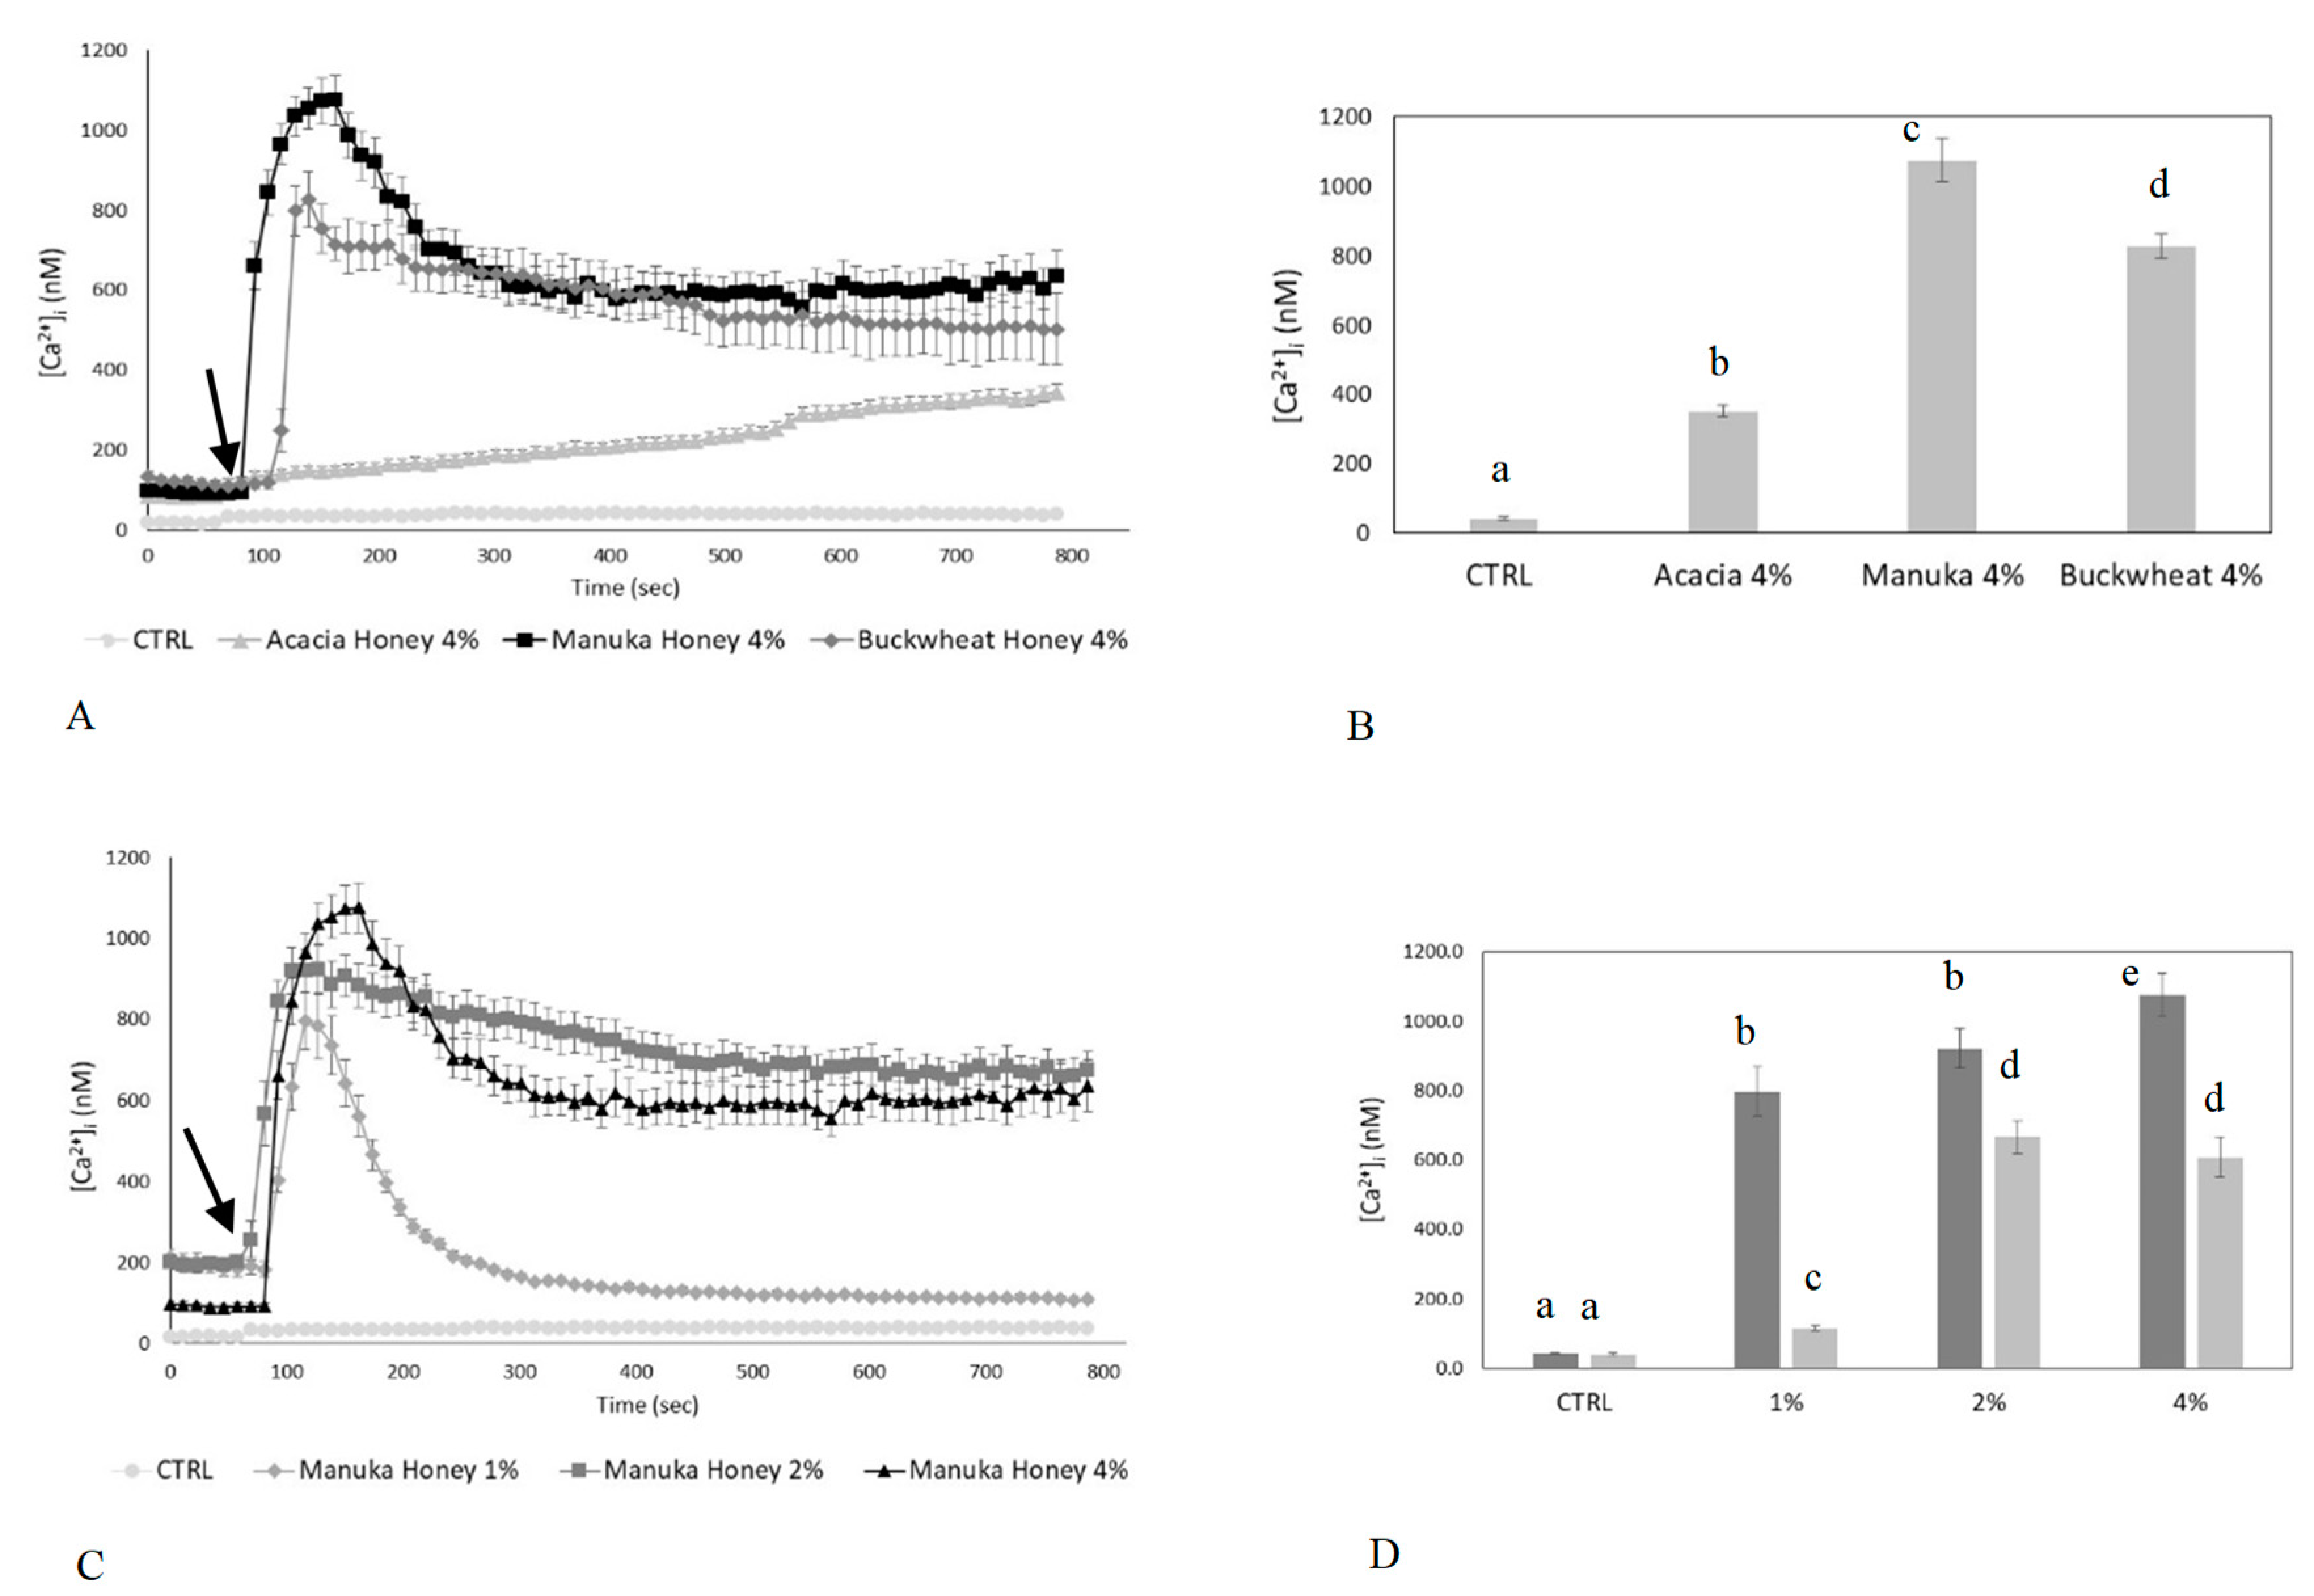
2.1. Honey Induces Ca2+ Signals in a Dose-Dependent Manner

First at all, we decided to investigate if different honey types are able to induce variations in [Ca2+]i. Therefore, we assessed intracellular Ca2+ variations induced after honey exposure, by using time-lapse confocal microscopy imaging of HaCaT cells loaded with the fluorescent Ca2+ probe Fluo-3/AM. For honey concentration of 4% v/v, the calcein-AM cytotoxicity assay carried out on HaCaT cells previously demonstrated that this dose did not affect cell viability [4].
Preliminary observations showed that the [Ca2+]i, sampled at 10-s intervals, did not undergo spontaneous oscillations in control conditions (Figure 1A). The analysis of confocal imaging of Fluo-3/AM loaded cells exposed to 4% v/v honey samples revealed that manuka honey triggered a single, large [Ca2+]i spike. The spike started a few seconds after honey exposure, reached a peak within 60–90 s, and decayed to a plateau level of intermediate amplitude in approximately 100–200 s (Figure 1A,B).
Then, we tested the effects on [Ca2+]i after treatment with other honey samples, i.e., buckwheat and acacia honey type (Figure 1A,B). Buckwheat honey triggered a biphasic increase in [Ca2+]i which was similar to that induced by manuka honey, but displayed a lower amplitude (Figure 1A,B). Conversely, acacia honey evoked a slow increase in [Ca2+]i which was significantly (p < 0.05) reduced as compared to manuka- and acacia-induced intracellular Ca2+ variations (Figure 1A,B). Based on these evidences, we reasoned that manuka honey was the most suitable type of honey to investigate the role of intracellular Ca2+ signaling in honey-induced wound repair. We also evaluated the dose-response relationship of the Ca2+ response to manuka honey by examining a range of concentrations (1, 2 and 4% v/v). As shown in Figure 1C,D, 4% v/v manuka honey induced the largest increase in [Ca2+]i in HaCaT cells and was, therefore, employed throughout the remainder of this investigation (Figure 1C,D).

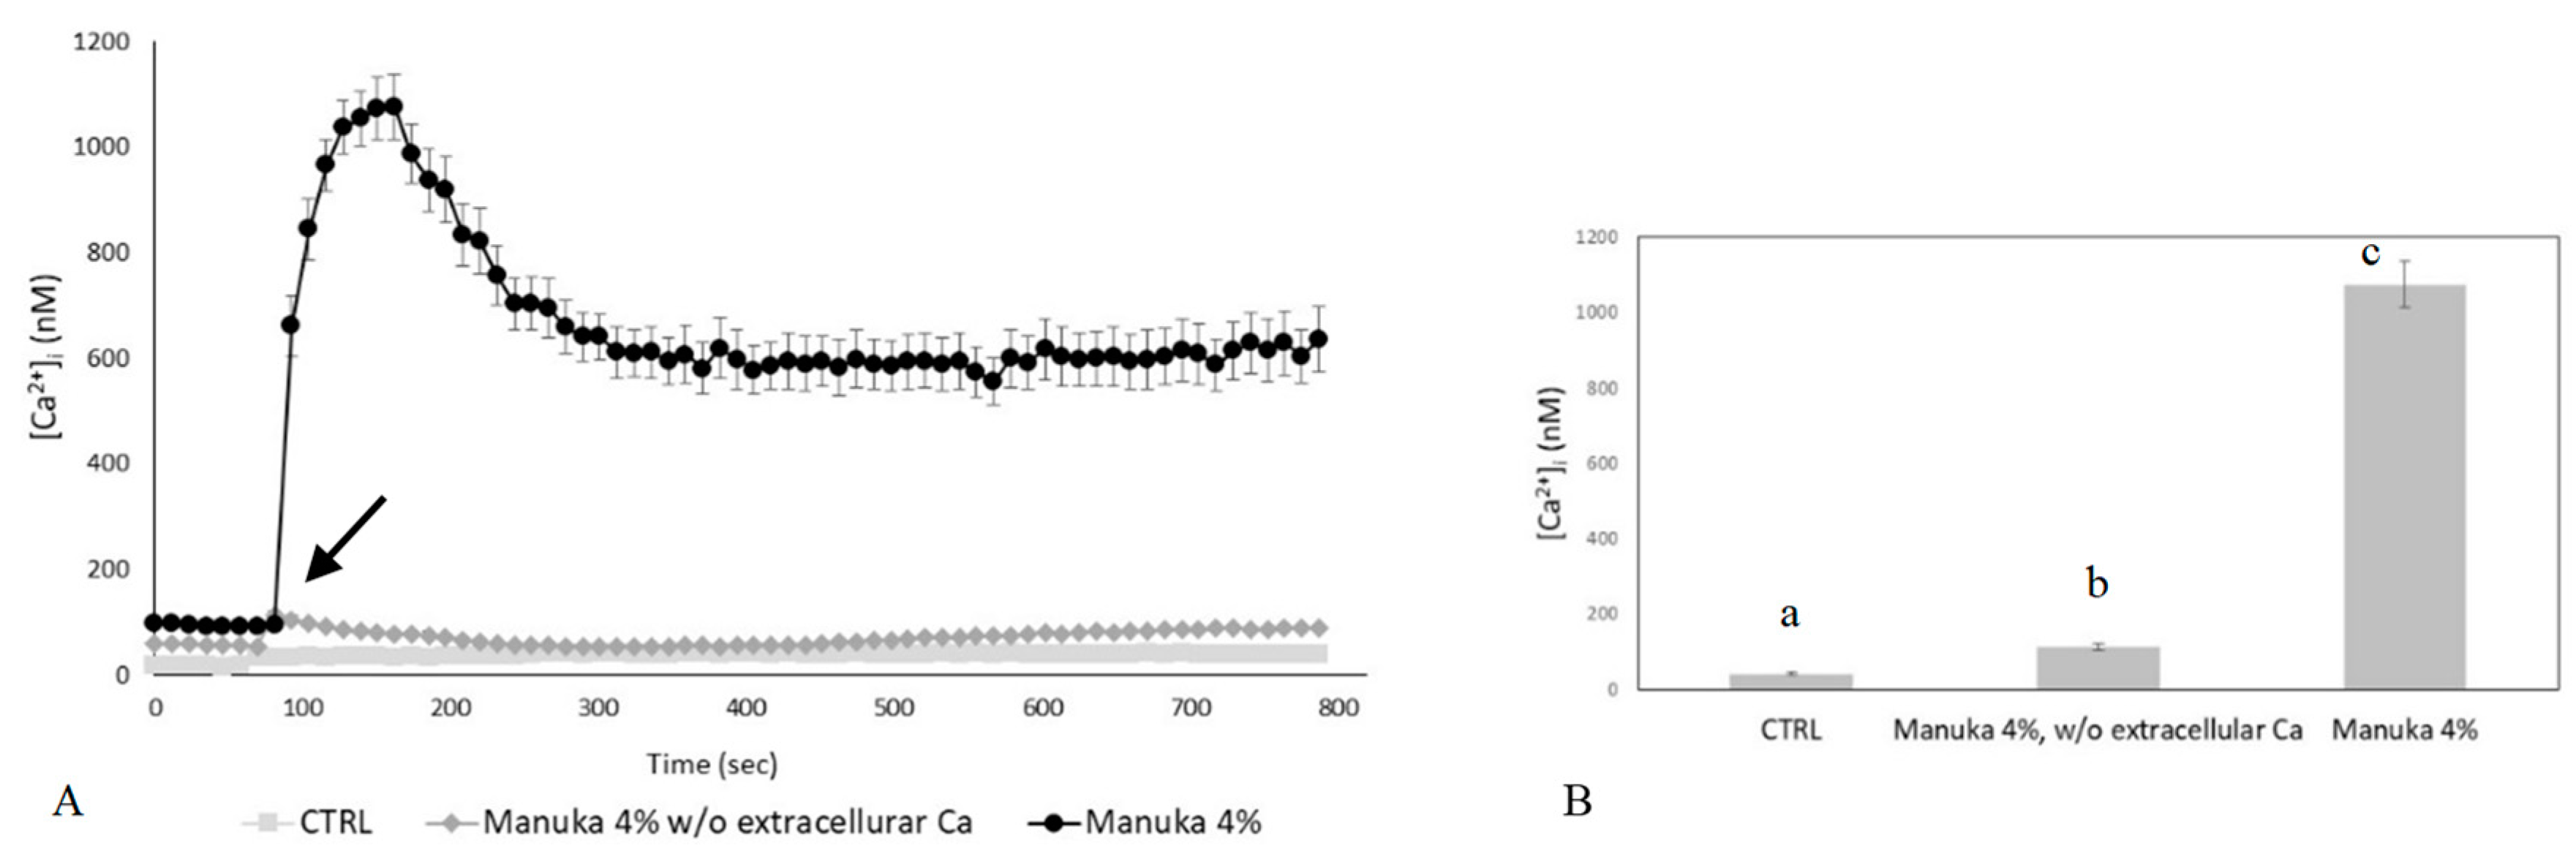
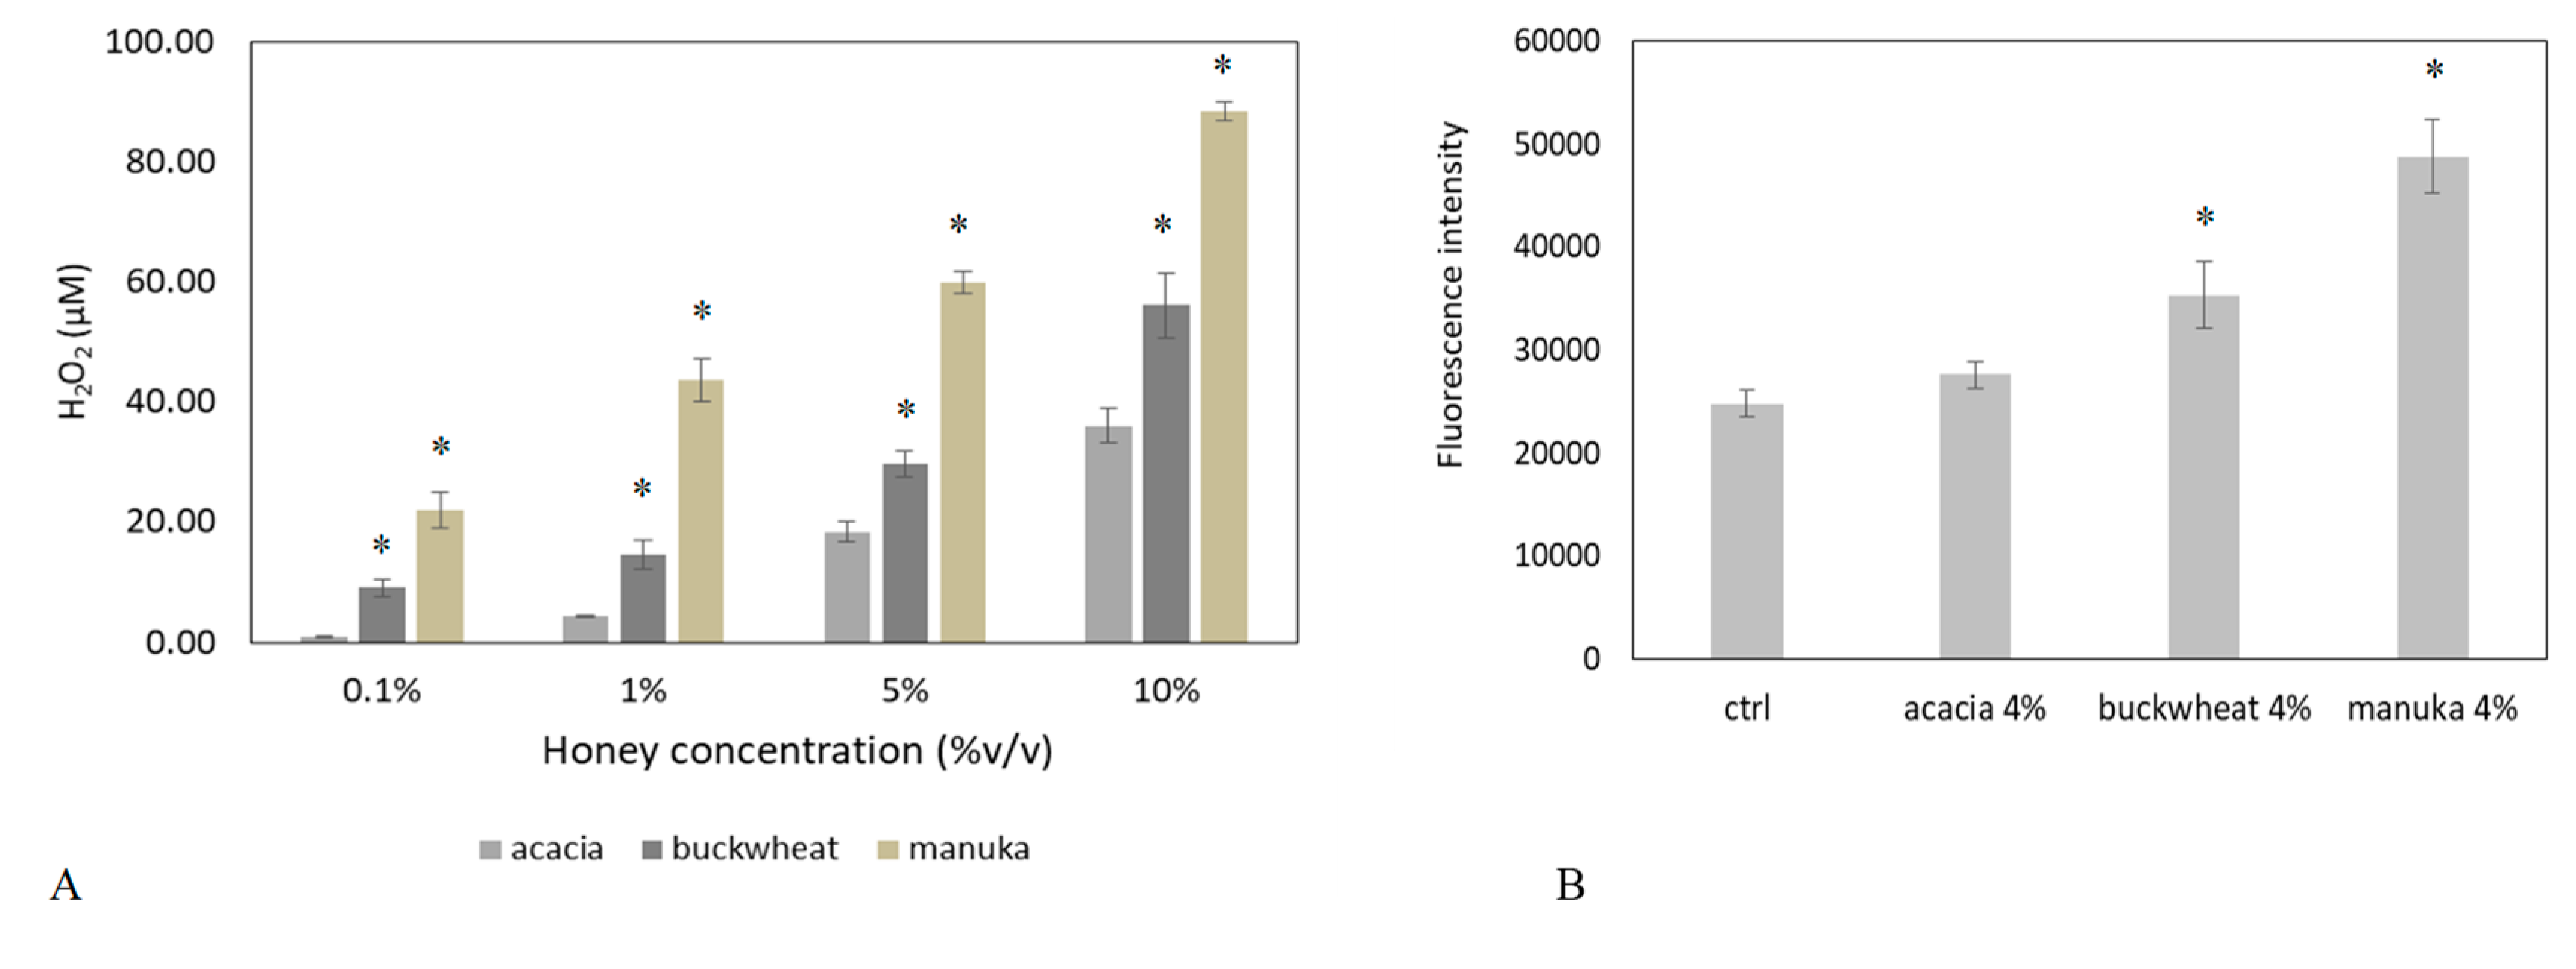
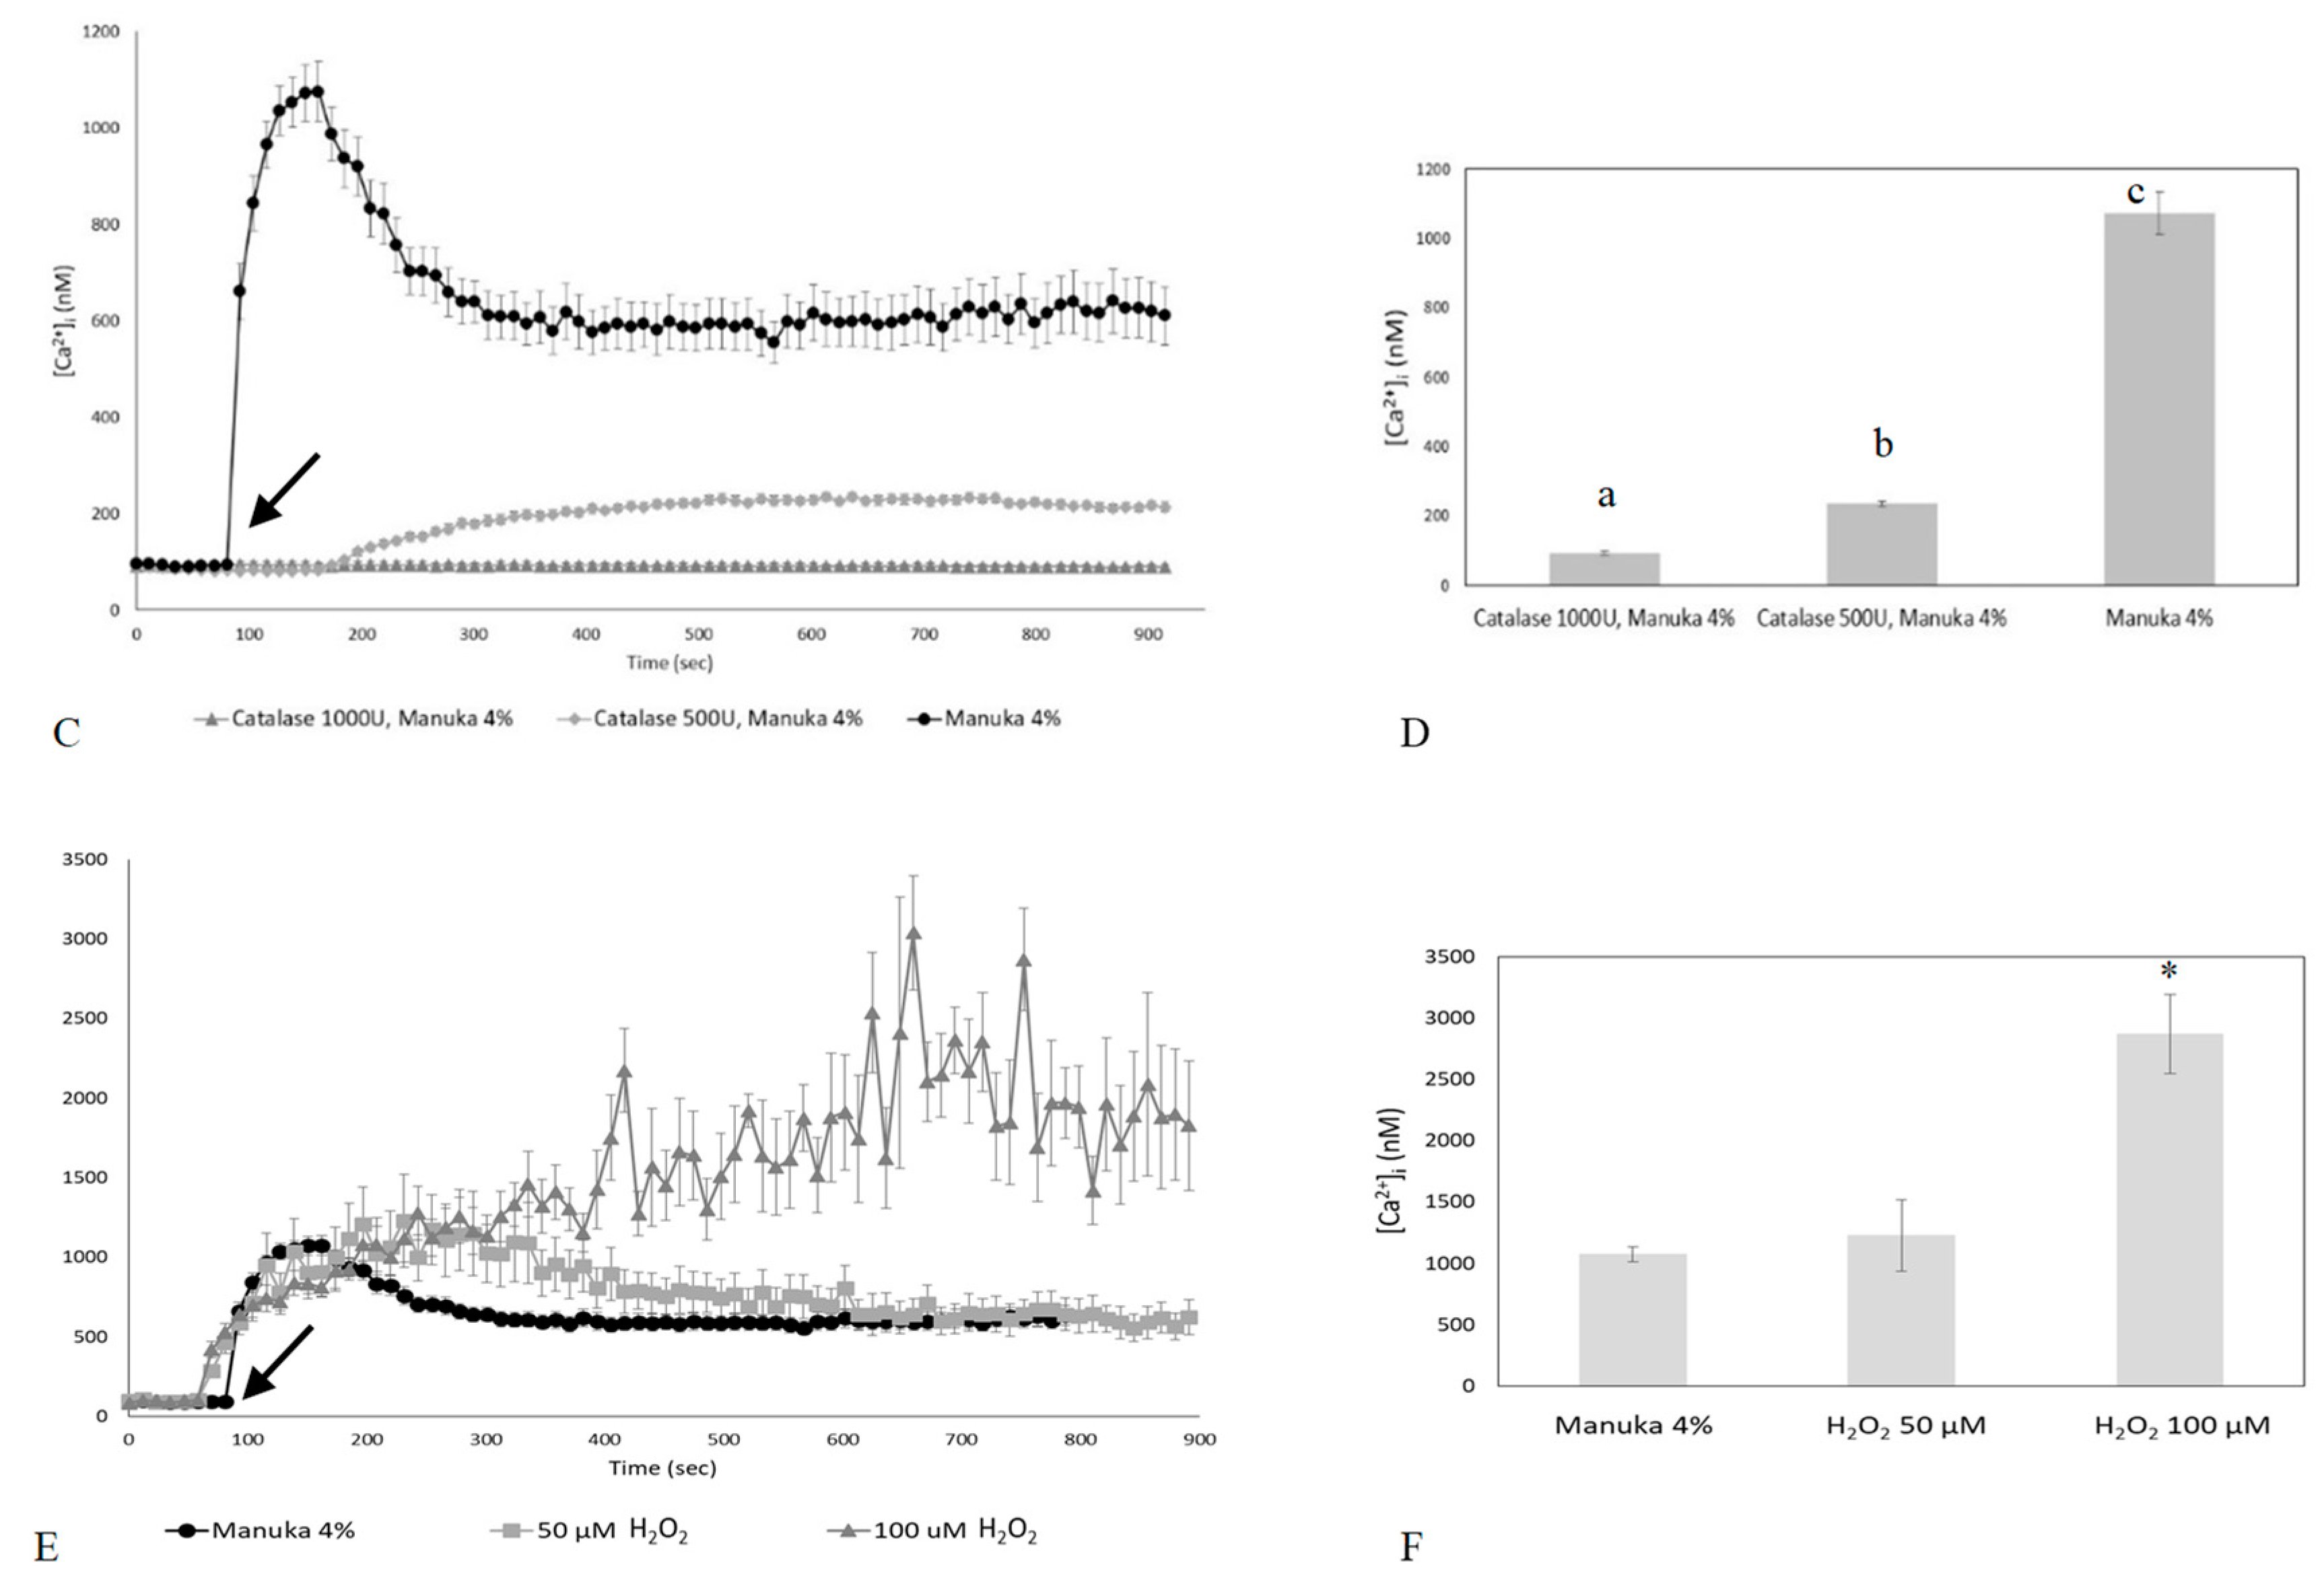
2.2. The Ca2+ Response to Manuka Honey Requires Extracellular Ca2+ Entry and the Intracellular Production of Hydrogen Peroxide

Intracellular Ca2+ signals can be generated by the opening of Ca2+-permeable channels which are located either on the plasma membrane or are embedded within the membrane of intracellular organelles, such as the ER [12,14]. We found that the Ca2+ response to 4% v/v manuka honey disappeared in Ca2+-free medium (Figure 2A,B). Therefore, extracellular Ca2+ entry is the main pathway underlying-induced elevation in [Ca2+]i in HaCaT cells. It is already known that honey samples induce H2O2 production in cell cultures, thereby causing an increase in intracellular H2O2 levels [16]. By using the xylenol orange assay, we evaluated the dose-dependent production of H2O2 induced by the different honey types (i.e., acacia, buckwheat and manuka, Figure 3A). 5% manuka honey releases in the culture medium around 50 µM H2O2. We also explored intracellular ROS levels by recording the fluorescence of DHR-123 loaded HaCaT cells in a microplate reader. As shown in Figure 3B, 4% v/v manuka honey induced a sustained rise in intracellular ROS levels.
We then evaluated whether the addition of exogenous catalase (CAT), which scavenges H2O2, reduces manuka honey-induced Ca2+ signals. Confocal imaging showed that, pre-treatment of cells with different doses of CAT, reduces (500 U) or abrogates (1000 U) the Ca2+ response to manuka honey (Figure 3C,D). Therefore, H2O2 is the most likely candidate to trigger manuka honey-induced Ca2+ signaling. To further corroborate this notion, we assessed the Ca2+ variations induced by 50 and 100 µM H2O2. Confocal imaging showed that 50 µM H2O2 induces a biphasic increase in [Ca2+]i similar to that induced by manuka honey, although the time to peak was slightly slower and the early phase of the plateau phase slightly higher. 100 µM H2O2 triggered a progressive and sustained rise of [Ca2+]i, reaching values that were remarkably higher than those achieved by manuka honey and not compatible with cell survival (Figure 3E,F).

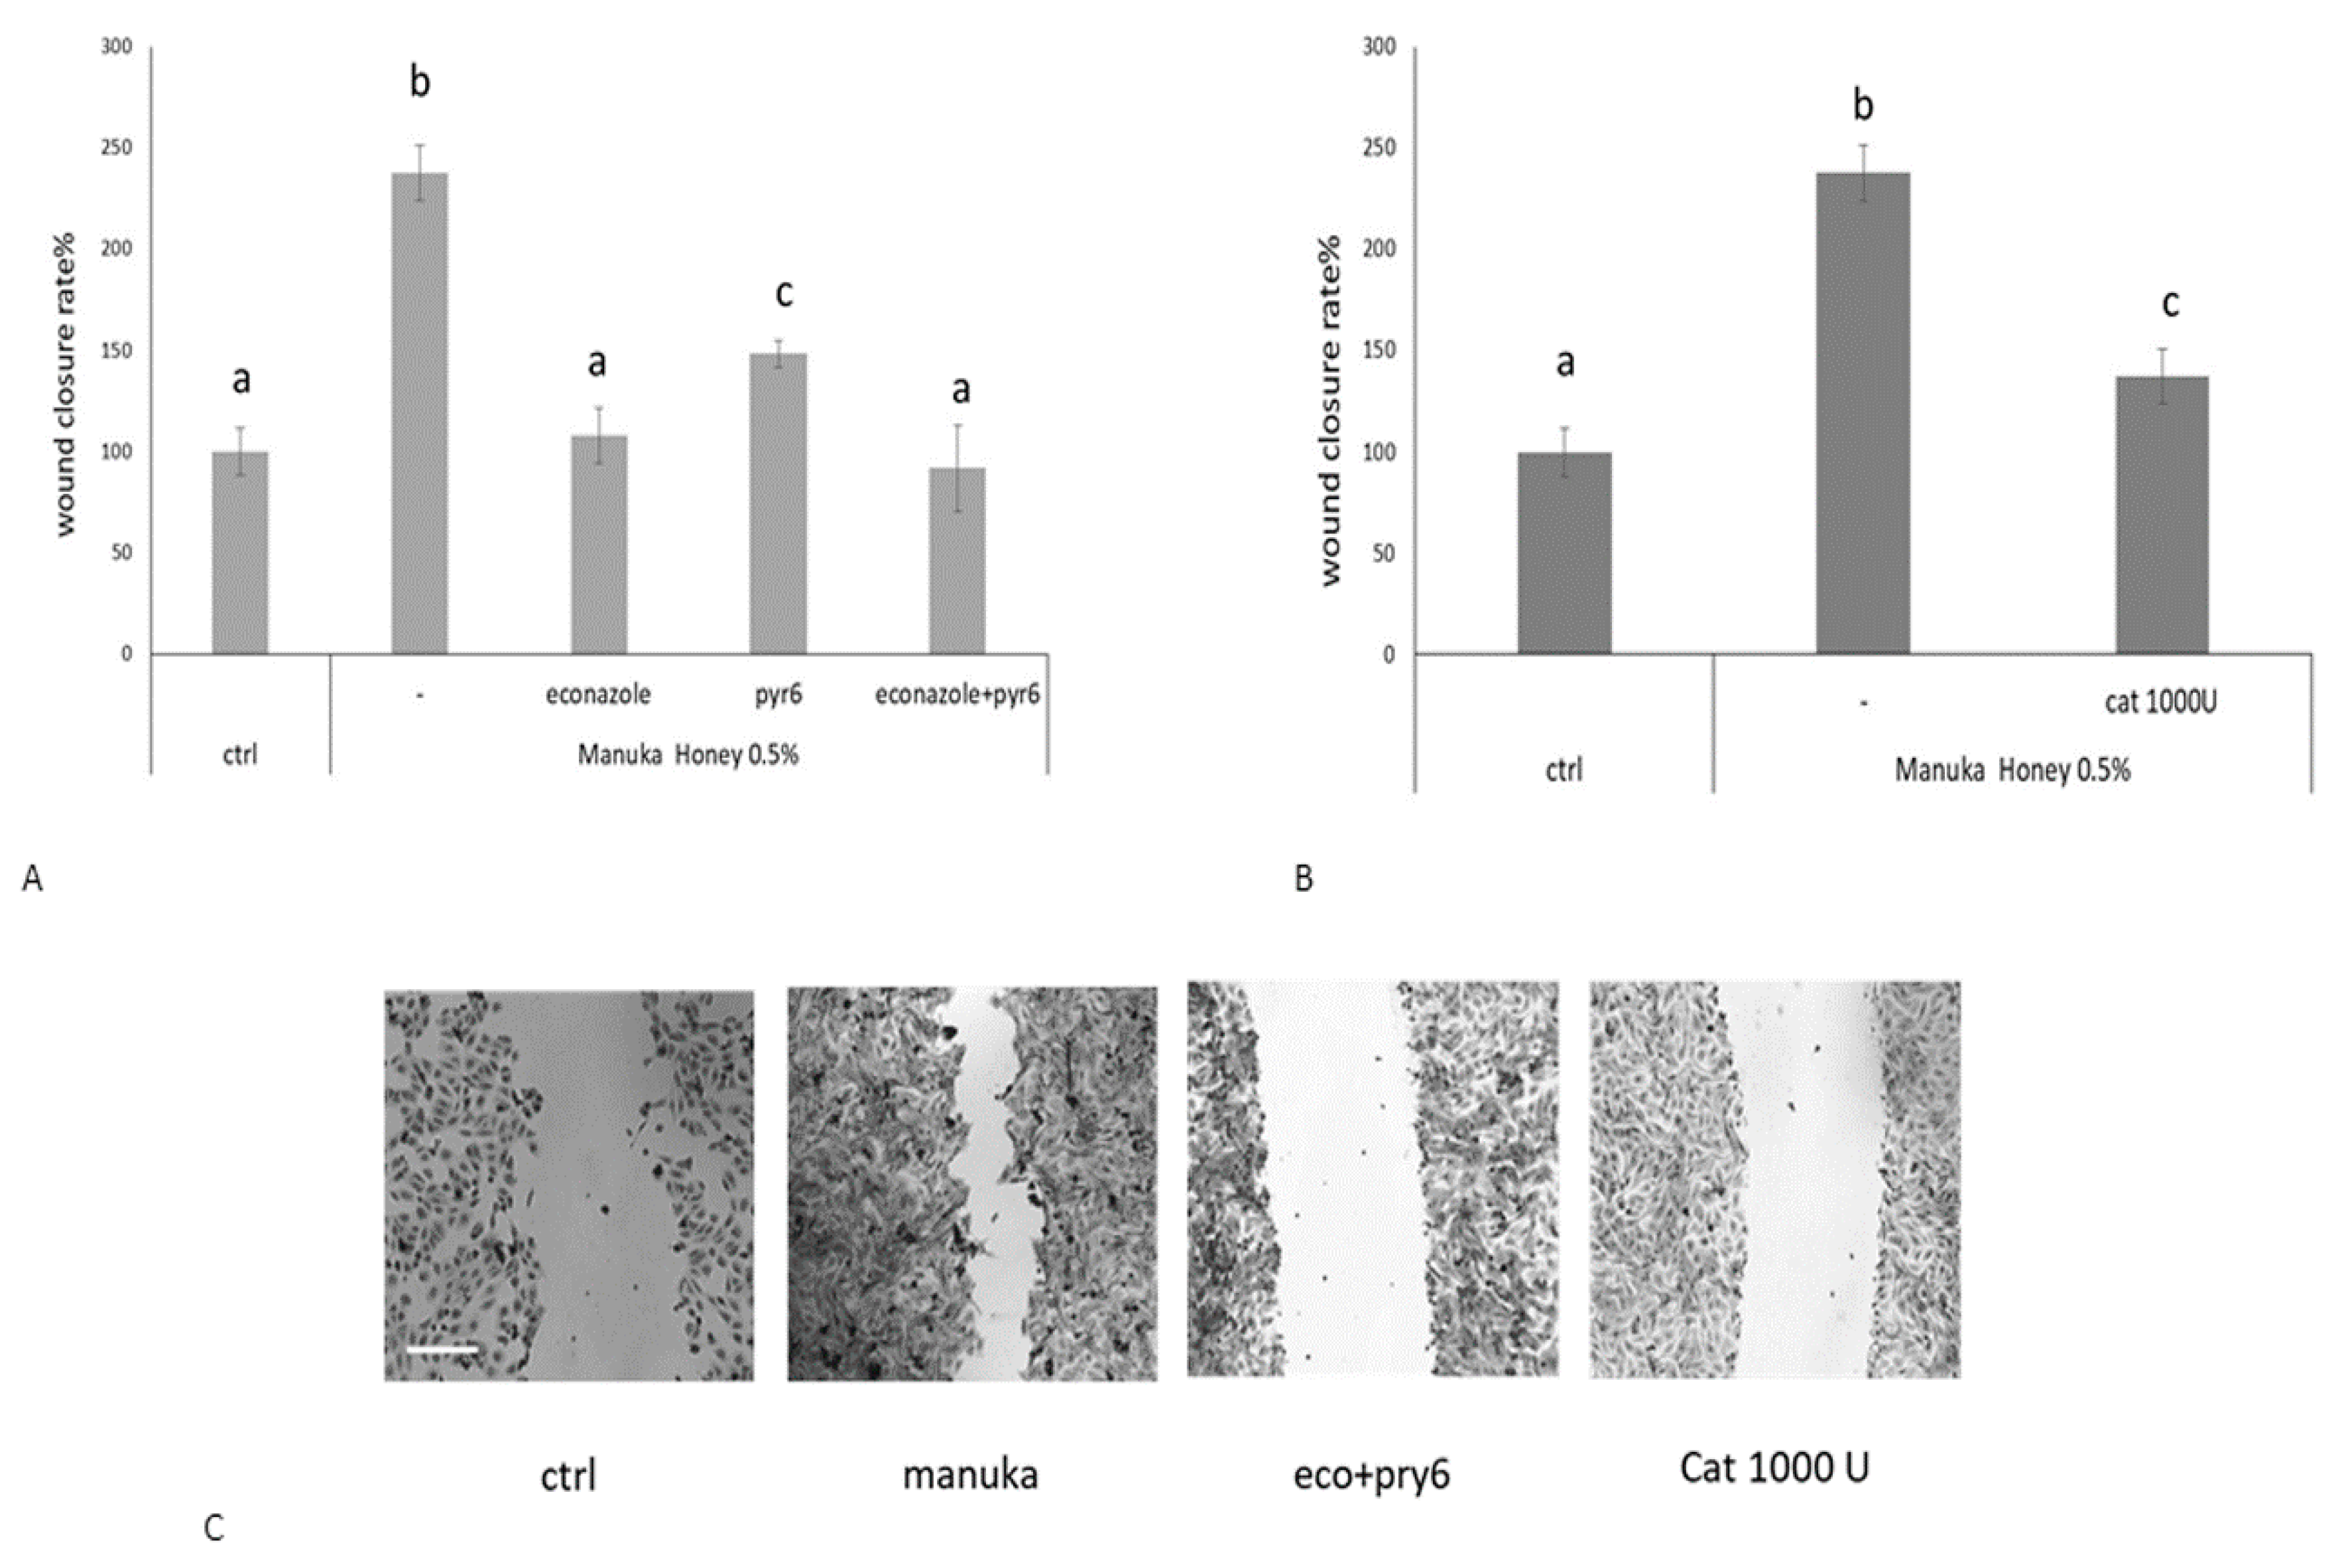
2.3. Role of Specific Inhibitors of Ca2+ Entry

To disclose the mechanism(s) responsible for of the Ca2+ response to manuka honey, we focused on the role of TRPM2 and Orai1. Accordingly, H2O2 has long been known to activate TRPM2 [17,18]; in addition, recent studies revealed that H2O2 may also activate Orai1-dependent Ca2+ entry [21,22]. Confocal imaging showed that HaCaT cell preincubation with econazole, a TRPM2 inhibitor [23,24], was able to reduce the [Ca2+]i increase caused by manuka exposure. Econazole (10 µM, 30 min) significantly (p < 0.05) reduced the amplitude of both the peak and the plateau phase of the Ca2+ response to manuka honey (Figure 4A,B). As econazole is not selective to TRPM2 channels, we down-regulated its expression with a specific RNAi selectively targeting TRPM2 (Figure 4D), and observed an almost complete abrogation of the Ca2+ response to manuka honey exposure (Figure 4E,F).
Likewise, Pyr6 (1 µM, 30 min), a selective inhibitor of Orai1 channels, caused a significant decrease of both phases of manuka honey-induced elevation in [Ca2+]i (Figure 4A,B). As Pyr6 selectively targets Orai1, but not TRP channels [11,22,25], we did not silence Orai1. These data strongly suggest that TRPM2 and Orai1 mediate manuka honey-induced extracellular Ca2+ entry. In agreement with this hypothesis, when HaCaT cells were pretreated with both econazole and Pyr6, the Ca2+ response to manuka honey was fully abrogated. Cell incubation with vehicle DMSO, used alone, was ineffective on intracellular Ca2+ dynamics (not shown).
In order to extend at molecular levels the findings obtained during Ca2+ imaging recordings, we used qPCR to confirm that Stim1-2, Orai1-3 and TRPM2 transcripts are expressed in HaCaT cells (Figure 4C).

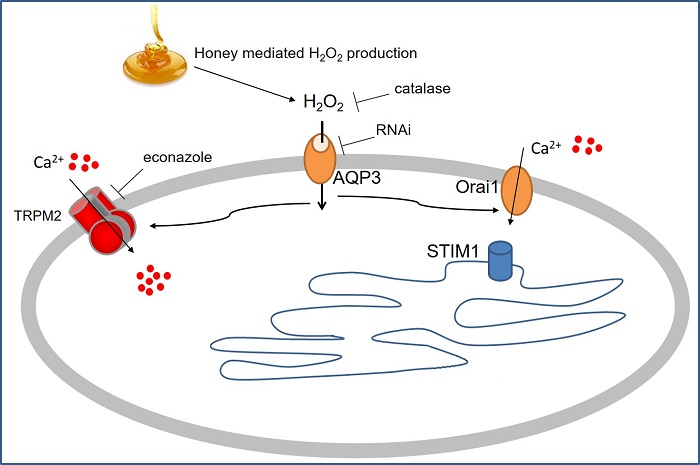
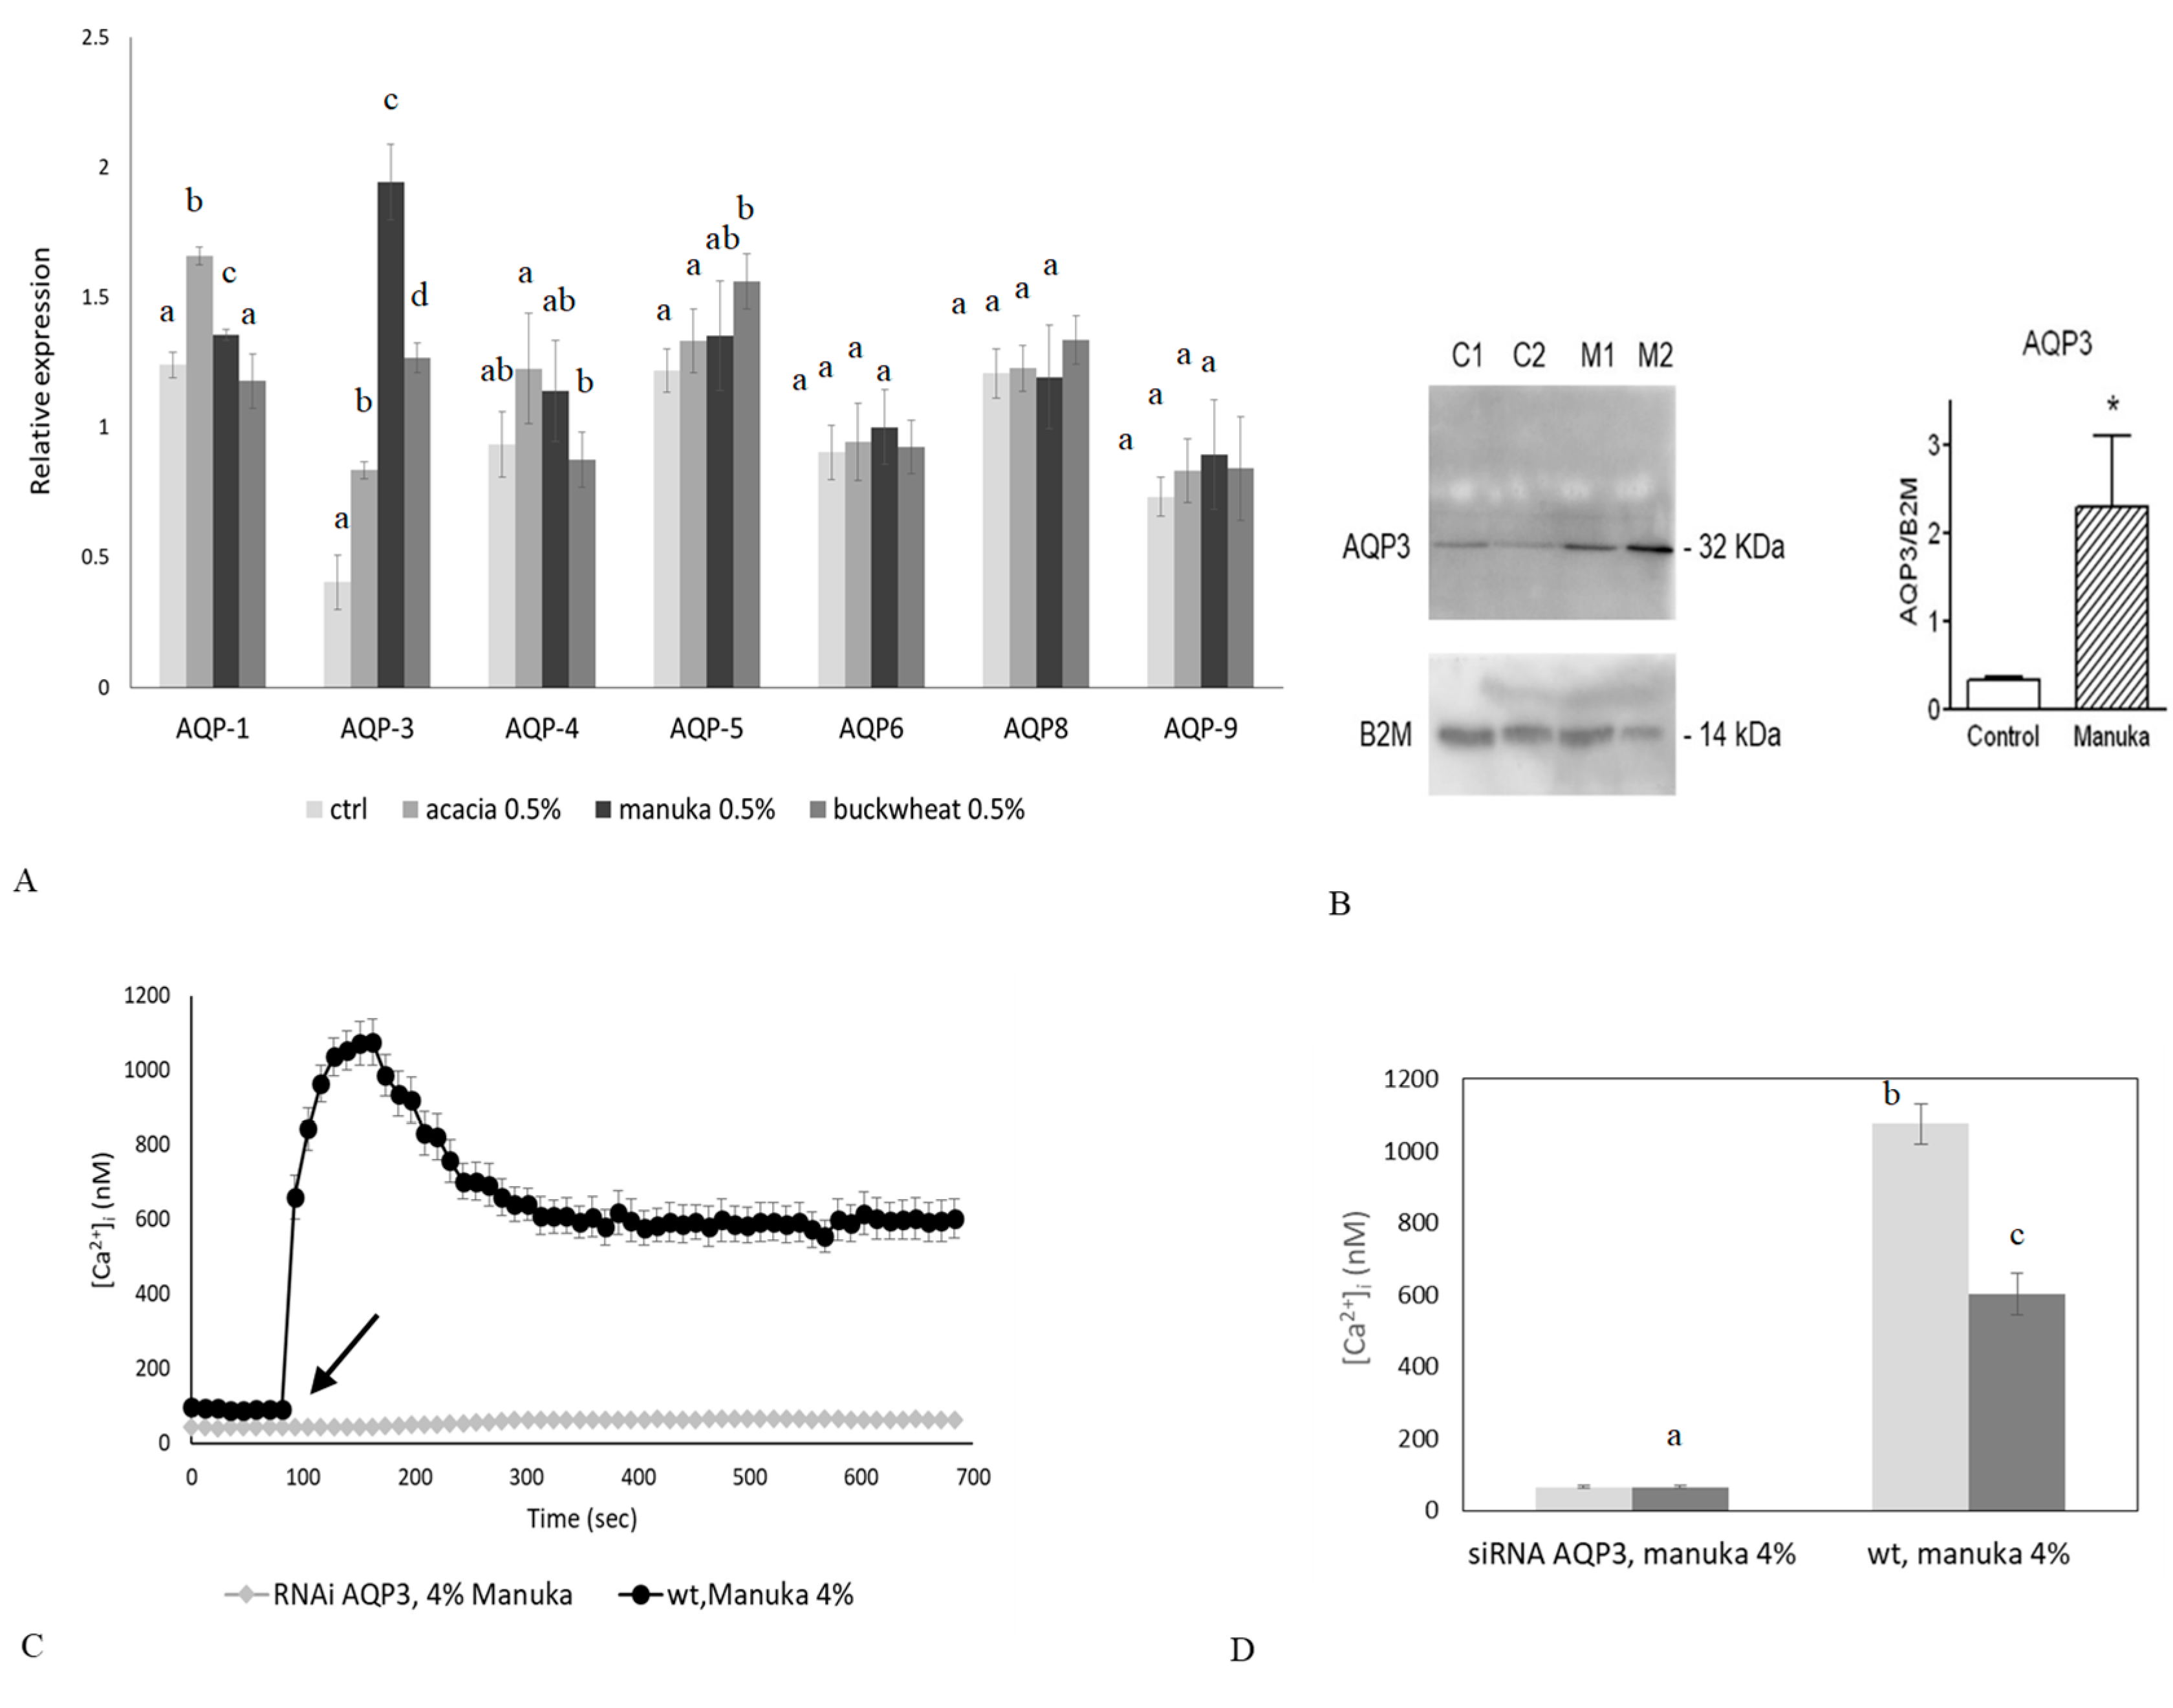
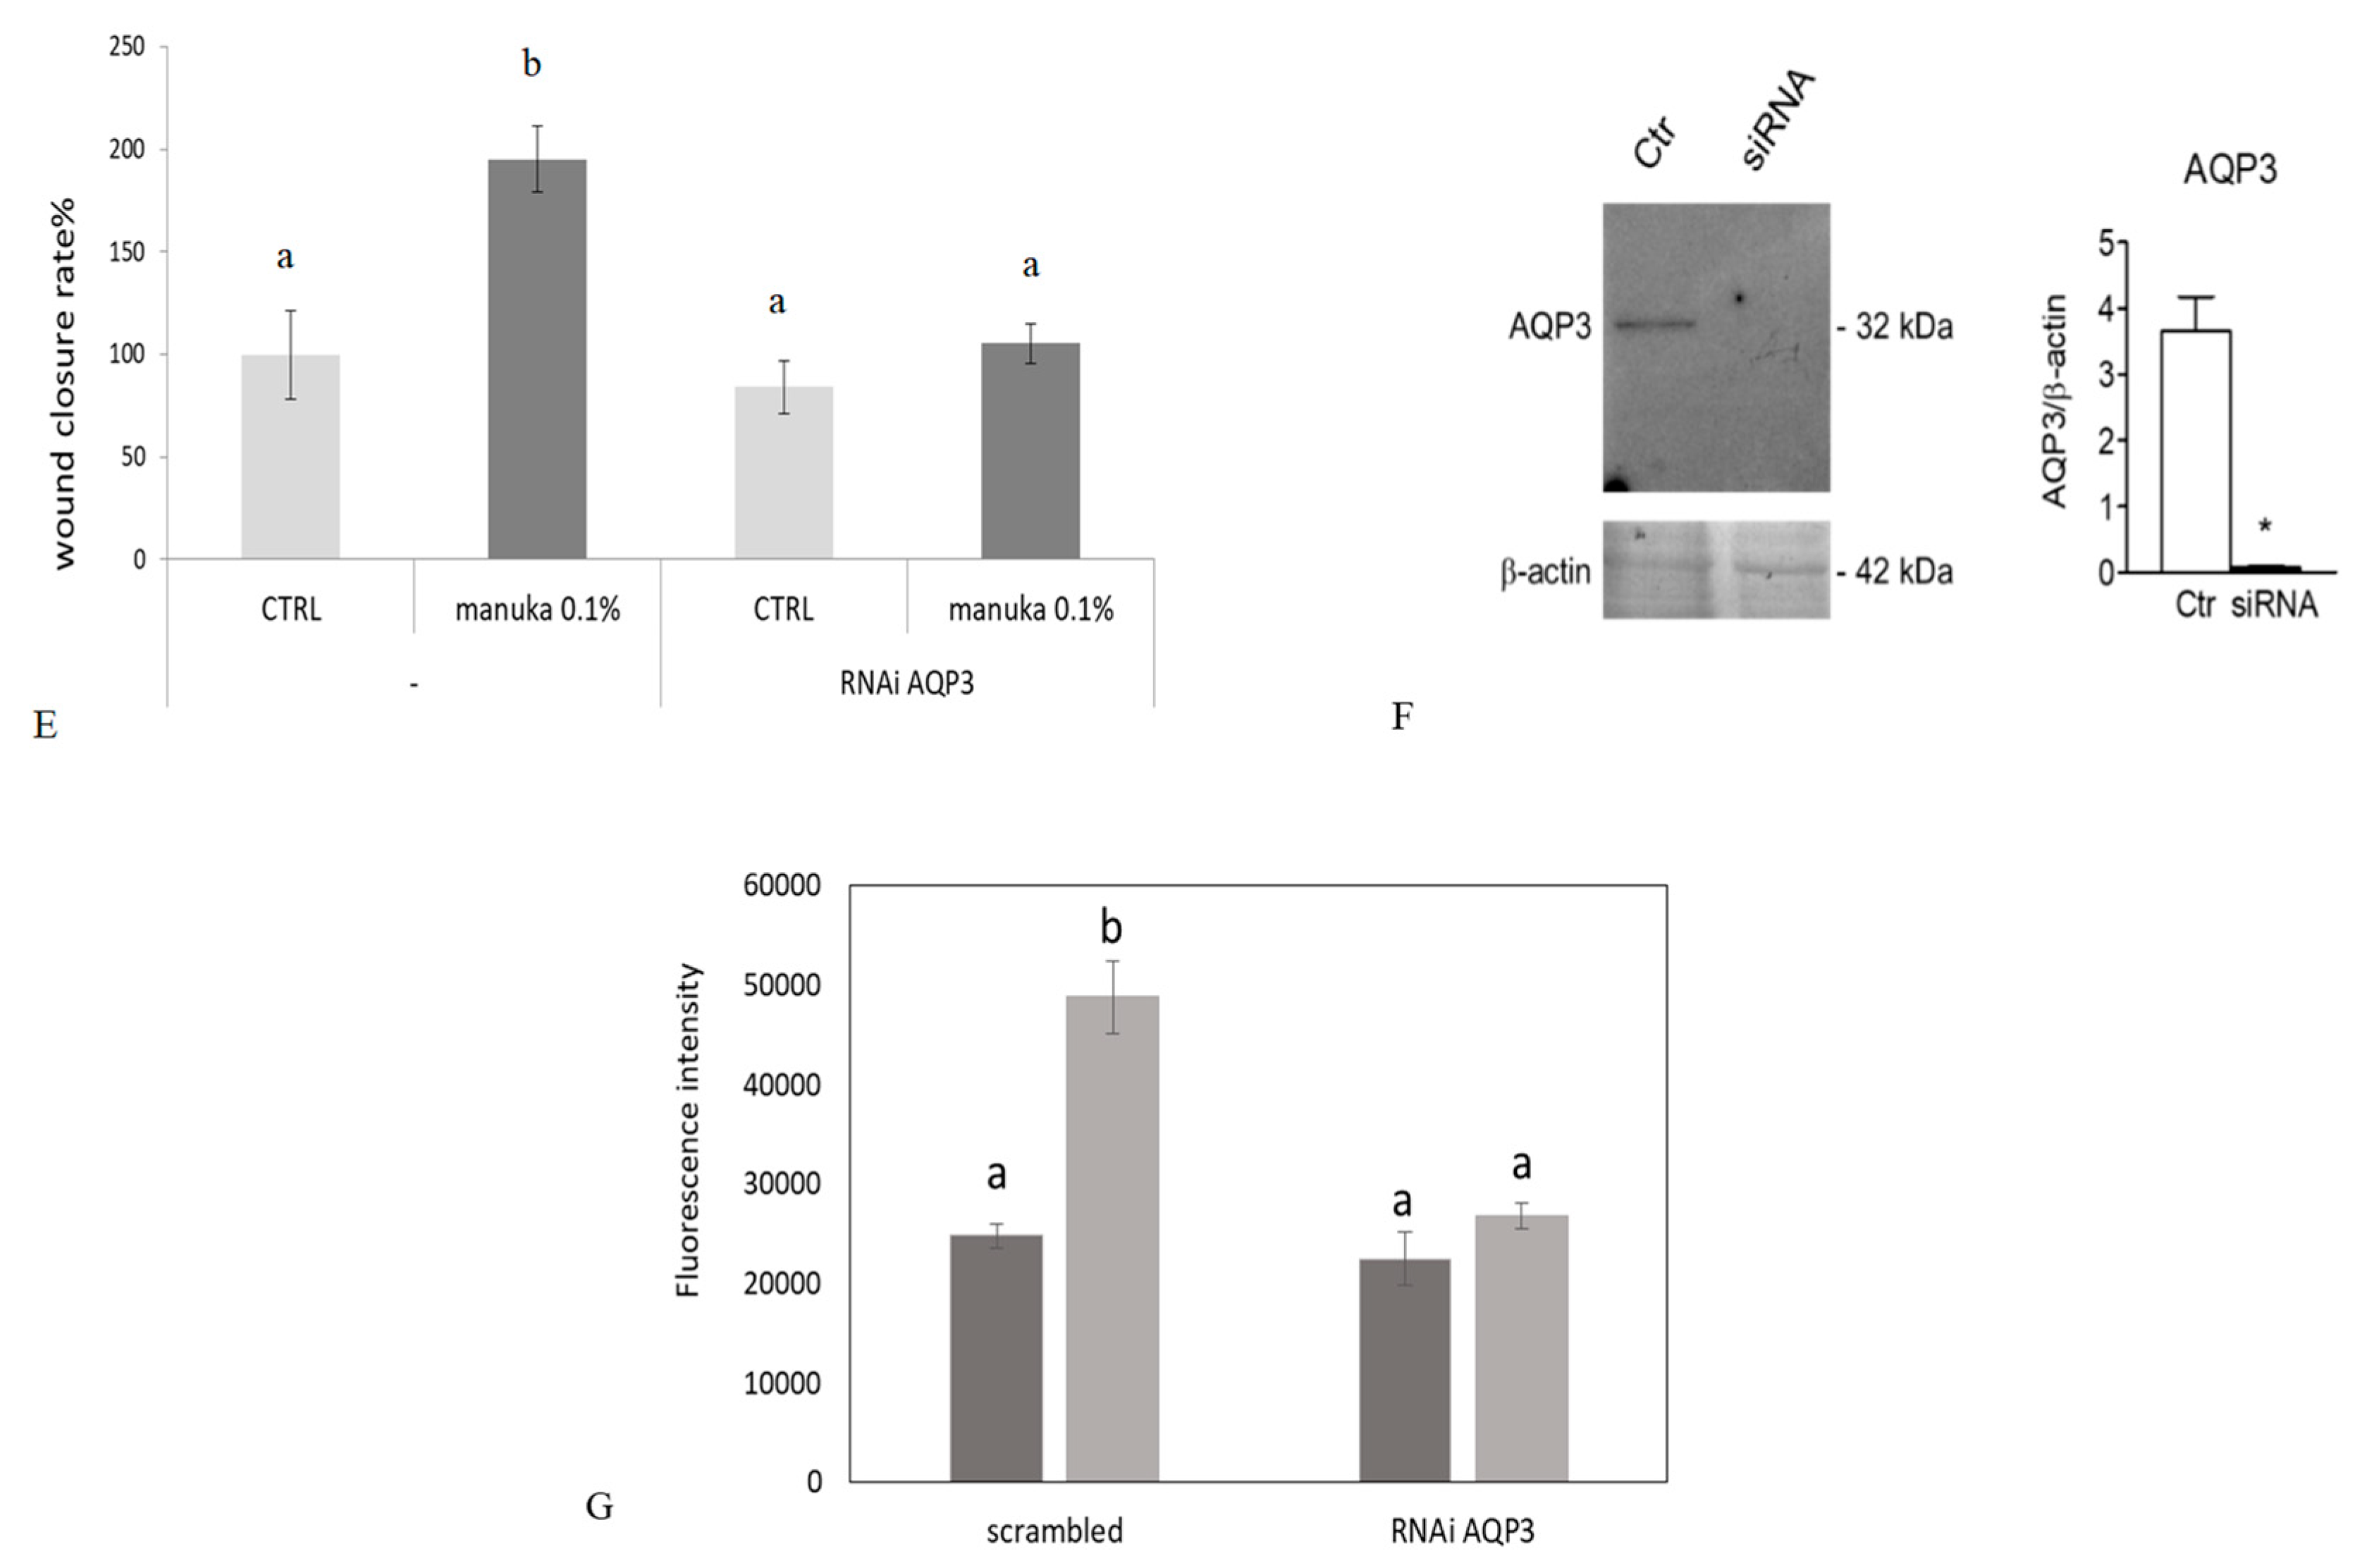
2.4. Role of AQP3 in H2O2 Influx

As discussed in Section 2.2, the Ca2+ response to manuka honey requires an increase in intracellular ROS levels which follows H2O2 liberation in the culture medium. Therefore, we hypothesized that, once released in the extracellular milieu, H2O2 diffuses across the plasma membrane to increase intracellular ROS concentration and activate external Ca2+ entry. AQPs are integral membrane proteins acting as channels in the transfer of water across the membrane, playing an important role in skin hydration [26,27,28]. In addition, AQP3 is able to mediate the transport of H2O2 in different tissues and conditions [29,30,31]. Therefore, we first decided to quantify the basal expression of some AQPs and to assess the variation in their expression levels after honey exposure, by means of qPCR analysis and immunoblotting. In Figure 5A,B, we analyzed the basal expression of AQP-1, -3, -4, -5, -6, -8 and -9 transcripts in keratinocytes, but only the expression of AQP3 was remarkable enhanced after honey exposure, in particular after treatment with manuka honey. Immunoblotting results confirmed the AQP3 upregulation after manuka treatment. Therefore, we decided to investigate the role of AQP3 as a mediator of H2O2 signaling in the Ca2+ response to manuka honey by using a specific RNAi. As expected, silencing of AQP3 prevented the increase in intracellular ROS despite manuka honey exposure (Figure 5G), thereby completely abrogating the rapid increase in [Ca2+]i (Figure 5C,D).
To assess the role played by AQP3 in manuka honey-induced wound repair, we performed the scratch wound assay after silencing of AQP3 by RNAi (as shown in Figure 5F). In silenced keratinocytes (see Figure 5E), despite honey treatment, we could not observe any significant variation in the rate of wound closure, confirming the pivotal role of AQP3 in mediating wound closure.
To disclose the functional role of manuka honey-induced Ca2+ signals in tissue regeneration, we performed the scratch wound assay in presence or not of econazole and Pyr6 (Figure 6A,C). We observed that these inhibitors significantly reduced the wound healing rate, thereby confirming the role of TRPM2 and Orai1 in manuka honey-dependent tissue regeneration. Moreover, also CAT significantly (p < 0.05) reduced manuka honey-induced wound repair, in agreement with the role played by H2O2 in TRPM2 and ORA1 activation (Figure 6B,C).

3. Discussion

The essential role of intracellular Ca2+ in wound repair and regeneration processes has been suggested by in vitro studies on scratch wounded layers of fibroblasts and endothelial cells [10,32].
Even more striking evidence has come from an in vitro study on HaCaT keratinocytes, showing that the cell-permeant Ca2+ chelator BAPTA inhibits both the wound closure and chemoattraction effects [33].
Wound-induced intracellular Ca2+ waves have been also observed in endothelial cells [34], whereas [Ca2+]i rises have been found to promote cell growth and movement in endothelial repair [35]. Finally, in vivo evidence of the regulatory role of [Ca2+]i in wound healing comes from the finding of high calmodulin levels in mitotic basal keratinocytes during the proliferative phase of rat wounds [36].
However, until now, no data are available about component(s) (other than antibacterial) of the honey able to induce/accelerate wound healing. Honey samples are able to release, also in in vitro conditions, H2O2 [37], and this H2O2 can contribute to their antibacterial properties [38].
In our study, we demonstrated the involvement of H2O2 as a main mediator of honey regenerative effects on HaCaT cells, a spontaneously immortalized human keratinocyte line
We confirmed that this extracellularly released H2O2 could pass across the plasma membrane through a specific aquaporin (i.e., AQP3). AQP3 has been already demonstrated to play a pivotal role in hydration of mammalian skin as well as in the regulation of proliferation and differentiation of keratinocytes [27]. Once in the cytoplasm, H2O2 induces the entry of extracellular Ca2+ through TRPM2 and Orai1 channels by a ROS-dependent mechanism [39]. The following pieces of evidence support this model. First, manuka honey failed to elicit a detectable increase in [Ca2+]i in the absence of extracellular Ca2+. Second, the Ca2+ response to manuka honey was mimicked by 50 µM H2O2 and inhibited in a dose-dependent manner by CAT, an H2O2 scavenger. Accordingly, honey samples may release H2O2 that is produced by the enzyme glucose oxidase and is responsible for the antiseptic effect of honey dressing [40]. Despite the production of H2O2 by honey, a harmful oxidizing effect is not observed on skin cells due to the honey polyphenolic component, which can antagonize this pro-oxidant action. In agreement with this hypothesis, the use of generic fluorescent H2O2 indicators revealed local sites of H2O2 production within the cytoplasm, including ER, mitochondria and plasma membrane [41,42,43]. This mechanism could also explain the different kinetics and amplitude of the Ca2+ response induced by the three different types of honey we probed. Accordingly, the H2O2-releasing ability is manuka > buckwheat >> acacia. Third, genetic silencing of AQP3 with a selective RNAi prevented the increase in intracellular ROS levels and abrogated the Ca2+ response to manuka honey. Accordingly, AQP3 has recently been shown to mediate H2O2 uptake and accumulation within the cytosolic leaflet of the plasma membrane, thereby generating a signaling nanodomain that could gate adjacent H2O2-sensitive channels [41]. Conversely, AQP3 is not permeable to extracellular Ca2+, while there is not report about the recruitment of an intracellular signaling pathway leading to H2O2 production upon honey exposure. These data, therefore, strongly suggest that AQP3 mediates H2O2 entry into the cytosplasm. Fourth, H2O2 may activate both TRPM2- and Orai1-mediated extracellular Ca2+ entry by acting from the cytosolic side. As to TRPM2, it is still unclear whether H2O2 directly gates TRPM2 [44] or does so by inducing ADP ribose (ADPr) mobilization from mitochondria [45,46]. H2O2 could then facilitate ADPr-dependent TRPM2 activation [45]. Orai1, in turn, mediates the so-called store-operated Ca2+ entry (SOCE), which is activated upon depletion of the ER Ca2+ store [25]. The drop in ER Ca2+ levels is sensed by STIM1, an ER-resident single-pass protein which oligomerizes and redistributes towards ER-plasma membrane junctions, known as puncta, thereby binding to and gating ORAI1 [25]. In agreement with our observations, earlier studies revealed that H2O2 may activate Orai1 by promoting Stim1 oligomerization and relocalization from perinuclear ER to plasma membrane puncta through S-glutathionylation of cysteine 56 in COS7 cells [47]. Likewise, H2O2 was found to stimulate Orai1 in a Stim1-dependent manner in HEK293 and DT40 cells [21] and in coronary vascular smooth muscle cells [22].
Honey-induced Ca2+ entry through TRPM2 and Orai1 channels, in turn, accelerated wound closure in human keratinocytes. We have recently demonstrated that honey boosted the rate of wound repair in HaCaT cells by promoting migration rather than proliferation [48]. Of note, we found that honey-induced wound closure was inhibited by BAPTA, a membrane permeable buffer of intracellular Ca2+ levels [4,10,49], and PD98059, which selectively blocks the extracellular signal-regulated kinase (ERK) pathway [5,50]. Herein, we demonstrated that honey-induced wound healing was severely inhibited by blocking extracellular Ca2+ entry by the genetic suppression of AQP3 (which prevents H2O2 entry), H2O2 scavenging (with CAT) and the pharmacological blockade of TRPM2 and Orai1 channels (with econazole and Pyr6, respectively). Therefore, TRPM2 and Orai1 provide the major sources of Ca2+ to recruit the Ca2+-dependent machinery driving HaCaT cell migration. Other works have demonstrated that intracellular Ca2+ signaling may induce cell migration by engaging the ERK pathway [10,50,51,52,53]. For instance, ORAI1-mediated Ca2+ entry stimulated human melanoma cell migration by recruiting Ca2+/Calmodulin-dependent kinase II (CaMKII) to induce Raf-1 phosphorylation, thereby activating the ERK pathway [53]. Likewise, TRPM2 has been shown to drive migration in several cell types [54,55], although the downstream signaling machinery remains to be elucidated.
In conclusion, we demonstrated that the presence of H2O2 in the extracellular space (due to honey’s glucose oxidase enzymatic activity [7]) causes a change in the intracellular levels of Ca2+.
The present results can be explained by the following model (see Figure 7):
  • Honey produces H2O2 in the extracellular space
  • AQP3 mediates the H2O2 entry in to the cytosol [41]
  • H2O2 activates TRPM2 and Orai1 determining Ca2+ entry [56] from the outside that induces wound closure.
This is the first report showing that honey exposure affects [Ca2+]i regulation, due to H2O2 production and redox regulation of ion channels.
These data lay the foundations for scientific and rational use of honey as a wound repair agent, with the understanding of cellular and molecular mechanisms underlying the effects on skin cells.
Moreover, our observations open up a new horizon for the use of the honey as a beneficial tool in the management of skin disorder by the modulation of aquaporin expression.

4. Materials and Methods

4.1. Honey Samples

Honey samples were obtained from Yamada Apiculture Center, Inc., Tomata-Gun, Okayama (Japan).

4.2. Cell Culture and Reagents

All reagents were from Sigma-Aldrich (St. Louis, MO, USA), unless otherwise indicated.
HaCaT cells are immortalized human skin keratinocytes that mimic many properties of normal epidermal keratinocytes, are not invasive, and can differentiate under appropriate experimental conditions [33].
Cells were maintained at 37 °C, 5% CO2, in DMEM supplemented with 10% foetal bovine serum (FBS, Euroclone, Milan, Italy) and 1% antibiotic mixture.

4.3. Measurements of Free Cytosolic Ca2+ Concentration ([Ca2+]i)

HaCaT cells were plated on glass-base dishes (Iwaki Glass, Inc., Tokyo, Japan). They were allowed to settle overnight, and then loaded with the cell-permeant, fluorescent calcium probe Fluo-3/AM (20 mM) in the dark at 37 °C for 30 min. The loading buffer is composed of (mM) 10 HEPES pH 7.4, 10 glucose, 140 NaCl, 2 CaCl2, 1 MgCl2, 5 KCl. For Ca2+-free experiments, this ion was omitted from the loading buffer [57,58].
After probe loading and washing, cells were analyzed through confocal time-lapse analysis, using a Zeiss LSM 510 confocal system interfaced with a Zeiss Axiovert 100 M microscope (Carl Zeiss Inc., Oberkochen, Germany).
Excitation was obtained by the 488 nm line of an Ar laser, and emission was collected using a 505–550 bandpass filter. The laser power was reduced to 15% in order to lower probe bleaching.
Confocal imaging was performed with a resolution of 512 × 512 pixels at 256 intensity values, with a framing rate of 1 frame/5 s.
Several cells were viewed together through a 20× Plan-Neofluar Zeiss objective (0.5 NA). Fluo-3/AM fluorescence was analyzed in digitized images as the average value over defined contours of individual cells, using the ROI-mean tool of the Zeiss LSM 510 2.01 software (Carl Zeiss Microscopy, Feldbach, Switzerland). Fluo-3 calibration was achieved by the following Equation (1) [59].
Ca2+ = Kd × (FFmin)/(Fmax − F)
where Kd = 400 nmol/L. Fmax and Fmin are maximum and minimum fluorescence intensities obtained by Fluo-3/AM calibration after cell exposure to 500 μM A23187 for about 10 min, followed by addition of 20 mM EDTA.

4.4. H2O2 Assays

The formation of H2O2 induced by manuka in culture medium was determined by xylenol orange, a colorimetric assay, as previously described [58,60].

4.5. Measurement of Intracellular ROS

Intracellular levels of ROS were assessed using the fluorescent dye precursor dihydrorhodamine (DHR) 123, which is converted to fluorescent rhodamine 123 upon reaction with ROS. Cells were seeded in 96-well plates, allowed to settle overnight, and loaded for 30 min at room temperature in the dark with DHR-123 (30 µM) in a loading buffer consisting of (mM) 10 glucose, 10 Hepes, 140 NaCl, 2 CaCl2, 1 MgCl2, and 5 KCl, pH 7.4. Cells were then washed with loading buffer and fluorescence collected in a fluorescence microplate reader, by using 485-nm excitation and 530-nm emission filters. Data of ROS production were expressed as fluorescence arbitrary units [58].

4.6. Quantitative Reverse Transcriptase PCR (qRT-PCR) and RNA Interference (siRNA)

Cells were settled in multi-well plates for 24 h and then subjected to the indicated experimental conditions. NucleoSpin RNAII Kit (Macherey-Nagel, Düren, Germany) was then utilized to extract total RNA. Complementary DNA was synthesized from RNA using the Transcriptor First Strand cDNA Synthesis Kit (Roche Diagnostics GmbH, Penzberg, Germany).
qRT-PCR was performed using Power Sybr Green Mastermix (Ambion Austin, TX, USA) and KiCqStart® SYBR® Green Primers (Sigma-Aldrich, Table 1) in a CFX384 Real-Time PCR Detection System (Bio-Rad Laboratories, Hercules, CA, USA). Gene expression was measured by the ∆∆Ct method.
For AQP3, RNAi was performed by transfecting cells with 5 µM siRNA oligonucleotides (Sigma-Aldrich, Table 2) or with equimolar scramble siRNA by using the N-ter Nanoparticle siRNA Transfection System (Sigma-Aldrich).
For TRPM2, RNAi was performed using esiRNA (esiRNA Human TRPM2, cat. no. EHU133821, Sigma-Aldrich).
Scramble siRNA was obtained using commercial non-targeting siRNA (MISSION siRNA Universal Negative Control).
Cells were collected at 24 h after transfection and used for the experiments.

4.7. Immunoblotting

Cells were lysed in RIPA buffer (supplemented with a protease and phosphatase inhibitor cocktail) and homogenates were solubilized in Laemmli buffer [61]. 15–30 μg solubilized proteins were subjected to 12.5% SDS-polyacrilamide gel electrophoresis and transferred to the Hybond-P PVDF Membrane (GE Healthcare, Chicago, IL, USA) by electroelution. The membranes were incubated overnight with anti-AQP3 antibody produced in rabbit (SAB5200111; Sigma, Italy) diluted 1:1000 in TBS and 0.1% Tween-20. The membranes were washed and incubated for 1 h with goat anti-rabbit IgG antibody, peroxidase conjugated (AP132P; Millipore, Burlington, MA, USA) diluted 1:100,000 in blocking solution. The bands were detected with ECL™ Select western blotting detection system (GE Healthcare). Pre-stained molecular weight markers (ab116028, Abcam) were used to estimate the molecular weight of the bands. Blots were stripped and re-probed with RabMAb anti β-2-microglobulin antibody ([EP2978Y] ab75853; Abcam, 1:10000) or with anti β-actin polyclonal antibody (Cat.n. AB-81599; Immunological sciences, USA, 1:2000) as housekeeping.

4.8. Scratch Wound Test

Scratch wounds were made in confluent layers HaCaT cells by using a sterile 0.1–10 µL pipette tip. After washing away suspended cells, cultures were refed with complete medium in the presence of honey for 24 h. After cell exposures, cells were fixed in 3.7% formaldehyde in PBS for 30 min, stained for 30 min at room temperature with 0.1% toluidine blue. The width of the wound space was assessed at wounding and at the end of treatments, using an inverted microscope (Leica Microsystems, Wetzlar, Germany) equipped with a digital camera. Digitized pictures of wounds were analyzed using the NIH Image J software. In a typical experiment, each group consisted of three different plates, i.e., a total of six wounds. Four measurements of wound width were made for each wound at randomly chosen points. Wound closure was measured as the difference between wound width at 0 h and at 24 h. Measurements were made by a single observer unaware of the treatments. Wound closure rates were determined as the difference between wound width at 0 and 24 h. The value of the control was set at 100 percent in order to obtain wound closure rate %.

4.9. Statistical Analysis

Data were analyzed by using the Instat software package (GraphPad Software, Inc, San Diego, CA, USA).

Author Contributions

S.M., U.L, M.P., F.M., and E.R. planned the research, made the experiments and analyzed the data. S.M. and E.R. carried out the confocal experiments. U.L. performed aquaporins experiments. F.M. and E.R. conceived the project, designed the research and wrote the manuscript. All authors provided intellectual input.

Funding

This research was funded (to S.M.) by Yamada Research Grant (2016) and by financial support (to E.R.) of the University del Piemonte Orientale (Ricerca Locale 2015).

Conflicts of Interest

The authors declare no conflicts of interest.

References

  1. Zumla, A.; Lulat, A. Honey—A remedy rediscovered. J. R. Soc. Med. 1989, 82, 384–385. [Google Scholar] [CrossRef]
  2. da Silva, P.M.; Gauche, C.; Gonzaga, L.V.; Costa, A.C.; Fett, R. Honey: Chemical composition, stability and authenticity. Food Chem. 2016, 196, 309–323. [Google Scholar] [CrossRef] [PubMed]
  3. Ranzato, E.; Burlando, B. Signaling pathways in wound repair. In Wound Healing: Process, Phases and Promoting; Middleton, J.E., Ed.; Nova Publishers Inc.: New York, NY, USA, 2011; Volume 7, pp. 123–135. [Google Scholar]
  4. Ranzato, E.; Martinotti, S.; Burlando, B. Epithelial mesenchymal transition traits in honey-driven keratinocyte wound healing: Comparison among different honeys. Wound Repair Regen. 2012, 20, 778–785. [Google Scholar] [CrossRef]
  5. Ranzato, E.; Martinotti, S.; Burlando, B. Honey exposure stimulates wound repair of human dermal fibroblasts. Burn. Trauma 2013, 1, 32–38. [Google Scholar] [CrossRef] [PubMed]
  6. Martinotti, S.; Ranzato, E. Honey, Wound Repair and Regenerative Medicine. J. Funct. Biomater. 2018, 9, 34. [Google Scholar] [CrossRef]
  7. Mandal, M.D.; Mandal, S. Honey: Its medicinal property and antibacterial activity. Asian Pac. J. Trop. Biomed. 2011, 1, 154–160. [Google Scholar] [CrossRef]
  8. Gorlach, A.; Bertram, K.; Hudecova, S.; Krizanova, O. Calcium and ROS: A mutual interplay. Redox Biol. 2015, 6, 260–271. [Google Scholar] [CrossRef] [Green Version]
  9. Zhao, Z.; Walczysko, P.; Zhao, M. Intracellular Ca2+ stores are essential for injury induced Ca2+ signaling and re-endothelialization. J. Cell Physiol. 2008, 214, 595–603. [Google Scholar] [CrossRef] [PubMed]
  10. Ranzato, E.; Mazzucco, L.; Patrone, M.; Burlando, B. Platelet lysate promotes in vitro wound scratch closure of human dermal fibroblasts: Different roles of cell calcium, P38, ERK and PI3K/AKT. J. Cell. Mol. Med. 2009, 13, 2030–2038. [Google Scholar] [CrossRef]
  11. Moccia, F.; Tanzi, F.; Munaron, L. Endothelial remodelling and intracellular calcium machinery. Curr. Mol. Med. 2014, 14, 457–480. [Google Scholar]
  12. Berridge, M.J.; Bootman, M.D.; Roderick, H.L. Calcium signalling: Dynamics, homeostasis and remodelling. Nat. Rev. Mol. Cell Biol. 2003, 4, 517–529. [Google Scholar] [CrossRef]
  13. Clapham, D.E. Calcium signaling. Cell 1995, 80, 259–268. [Google Scholar] [CrossRef] [Green Version]
  14. Clapham, D.E. Calcium signaling. Cell 2007, 131, 1047–1058. [Google Scholar] [CrossRef]
  15. Hu, Q.; Corda, S.; Zweier, J.L.; Capogrossi, M.C.; Ziegelstein, R.C. Hydrogen peroxide induces intracellular calcium oscillations in human aortic endothelial cells. Circulation 1998, 97, 268–275. [Google Scholar] [CrossRef] [PubMed]
  16. Bang, L.M.; Buntting, C.; Molan, P. The effect of dilution on the rate of hydrogen peroxide production in honey and its implications for wound healing. J. Altern. Complement. Med. 2003, 9, 267–273. [Google Scholar] [CrossRef] [PubMed]
  17. Hecquet, C.M.; Ahmmed, G.U.; Vogel, S.M.; Malik, A.B. Role of TRPM2 channel in mediating H2O2-induced Ca2+ entry and endothelial hyperpermeability. Circ. Res. 2008, 102, 347–355. [Google Scholar] [CrossRef] [PubMed]
  18. Faouzi, M.; Penner, R. Trpm2. Handb. Exp. Pharm. 2014, 222, 403–426. [Google Scholar]
  19. Winterbourn, C.C. Biological Production, Detection and Fate of Hydrogen Peroxide. Antioxid. Redox Signal 2018, 29, 541–551. [Google Scholar] [CrossRef]
  20. Kong, H.; Fan, Y.; Xie, J.; Ding, J.; Sha, L.; Shi, X.; Sun, X.; Hu, G. AQP4 knockout impairs proliferation, migration and neuronal differentiation of adult neural stem cells. J. Cell Sci. 2008, 121, 4029–4036. [Google Scholar] [CrossRef] [Green Version]
  21. Grupe, M.; Myers, G.; Penner, R.; Fleig, A. Activation of store-operated I(CRAC) by hydrogen peroxide. Cell Calcium 2010, 48, 1–9. [Google Scholar] [CrossRef]
  22. Santiago, E.; Climent, B.; Munoz, M.; Garcia-Sacristan, A.; Rivera, L.; Prieto, D. Hydrogen peroxide activates store-operated Ca(2+) entry in coronary arteries. Br. J. Pharm. 2015, 172, 5318–5332. [Google Scholar]
  23. Oda, S.; Uchida, K.; Wang, X.Y.; Lee, J.; Shimada, Y.; Tominaga, M.; Kadowaki, M. TRPM2 contributes to antigen-stimulated Ca2+ influx in mucosal mast cells. Pflug. Arch. Eur. J. Phys. 2013, 465, 1023–1030. [Google Scholar] [CrossRef] [PubMed]
  24. Malara, A.; Fresia, C.; Di Buduo, C.A.; Soprano, P.M.; Moccia, F.; Balduini, C.; Zocchi, E.; De Flora, A.; Balduini, A. The Plant Hormone Abscisic Acid Is a Prosurvival Factor in Human and Murine Megakaryocytes. J. Biol. Chem. 2017, 292, 3239–3251. [Google Scholar] [CrossRef] [Green Version]
  25. Prakriya, M.; Lewis, R.S. Store-Operated Calcium Channels. Physiol. Rev. 2015, 95, 1383–1436. [Google Scholar] [CrossRef] [PubMed] [Green Version]
  26. Hara-Chikuma, M.; Verkman, A.S. Roles of aquaporin-3 in the epidermis. J. Investig. Dermatol. 2008, 128, 2145–2151. [Google Scholar] [CrossRef] [PubMed]
  27. Boury-Jamot, M.; Daraspe, J.; Bonte, F.; Perrier, E.; Schnebert, S.; Dumas, M.; Verbavatz, J.M. Skin aquaporins: Function in hydration, wound healing, and skin epidermis homeostasis. Handb. Exp. Pharm. 2009, 190, 205–217. [Google Scholar]
  28. Benga, G. On the definition, nomenclature and classification of water channel proteins (aquaporins and relatives). Mol. Asp. Med. 2012, 33, 514–517. [Google Scholar] [CrossRef] [PubMed]
  29. Hara-Chikuma, M.; Chikuma, S.; Sugiyama, Y.; Kabashima, K.; Verkman, A.S.; Inoue, S.; Miyachi, Y. Chemokine-dependent T cell migration requires aquaporin-3-mediated hydrogen peroxide uptake. J. Exp. Med. 2012, 209, 1743–1752. [Google Scholar] [CrossRef] [PubMed] [Green Version]
  30. Laforenza, U.; Pellavio, G.; Marchetti, A.L.; Omes, C.; Todaro, F.; Gastaldi, G. Aquaporin-Mediated Water and Hydrogen Peroxide Transport Is Involved in Normal Human Spermatozoa Functioning. Int. J. Mol. Sci. 2016, 18, 66. [Google Scholar] [CrossRef] [PubMed]
  31. Thiagarajah, J.R.; Chang, J.; Goettel, J.A.; Verkman, A.S.; Lencer, W.I. Aquaporin-3 mediates hydrogen peroxide-dependent responses to environmental stress in colonic epithelia. Proc. Natl. Acad. Sci. USA 2017, 114, 568–573. [Google Scholar] [CrossRef] [PubMed] [Green Version]
  32. Ranzato, E.; Martinotti, S.; Balbo, V.; Boccafoschi, F.; Patrone, M.; Mazzucco, L.; Burlando, B. Platelet Lysate-Driven in Vitro Wound Healing. Wound Repair Regen. 2009, 17, A78. [Google Scholar]
  33. Ranzato, E.; Patrone, M.; Mazzucco, L.; Burlando, B. Platelet lysate stimulates wound repair of HaCaT keratinocytes. Br. J. Derm. 2008, 159, 537–545. [Google Scholar] [CrossRef] [PubMed]
  34. Berra-Romani, R.; Raqeeb, A.; Avelino-Cruz, J.E.; Moccia, F.; Oldani, A.; Speroni, F.; Taglietti, V.; Tanzi, F. Ca2+ signaling in injured in situ endothelium of rat aorta. Cell Calcium 2008, 44, 298–309. [Google Scholar] [CrossRef] [PubMed]
  35. Sammak, P.J.; Hinman, L.E.; Tran, P.O.T.; Sjaastad, M.D.; Machen, T.E. How do injured cells communicate with the surviving cell monolayer? J. Cell Sci. 1997, 110, 465–475. [Google Scholar] [PubMed]
  36. Lansdown, A.B.; Sampson, B.; Rowe, A. Sequential changes in trace metal, metallothionein and calmodulin concentrations in healing skin wounds. J. Anat. 1999, 195, 375–386. [Google Scholar] [CrossRef] [Green Version]
  37. Martinotti, S.; Ranzato, E. Honey’s healing history. In Cellular and Molecular Mechanisms of Honey Wound Healing; Martinotti, S., Ranzato, E., Eds.; Nova Publishers Inc.: New York, NY, USA, 2014; ISBN 978-1-63117-251-9. [Google Scholar]
  38. Olaitan, P.B.; Adeleke, O.E.; Ola, I.O. Honey: A reservoir for microorganisms and an inhibitory agent for microbes. Afr. Health Sci. 2007, 7, 159–165. [Google Scholar] [PubMed]
  39. Nunes, P.; Demaurex, N. Redox regulation of store-operated Ca2+ entry. Antioxid. Redox Signal 2014, 21, 915–932. [Google Scholar] [CrossRef]
  40. Bucekova, M.; Juricova, V.; Monton, E.; Martinotti, S.; Ranzato, E.; Majtan, J. Microwave processing of honey negatively affects honey antibacterial activity by inactivation of bee-derived glucose oxidase and defensin-1. Food Chem. 2018, 240, 1131–1136. [Google Scholar] [CrossRef]
  41. Miller, E.W.; Dickinson, B.C.; Chang, C.J. Aquaporin-3 mediates hydrogen peroxide uptake to regulate downstream intracellular signaling. Proc. Natl. Acad. Sci. USA 2010, 107, 15681–15686. [Google Scholar] [CrossRef]
  42. Malinouski, M.; Zhou, Y.; Belousov, V.V.; Hatfield, D.L.; Gladyshev, V.N. Hydrogen peroxide probes directed to different cellular compartments. PLoS ONE 2011, 6, e14564. [Google Scholar] [CrossRef]
  43. Marinho, H.S.; Real, C.; Cyrne, L.; Soares, H.; Antunes, F. Hydrogen peroxide sensing, signaling and regulation of transcription factors. Redox Biol. 2014, 2, 535–562. [Google Scholar] [CrossRef] [PubMed] [Green Version]
  44. Wehage, E.; Eisfeld, J.; Heiner, I.; Jungling, E.; Zitt, C.; Luckhoff, A. Activation of the cation channel long transient receptor potential channel 2 (LTRPC2) by hydrogen peroxide. A splice variant reveals a mode of activation independent of ADP-ribose. J. Biol. Chem. 2002, 277, 23150–23156. [Google Scholar] [CrossRef] [PubMed]
  45. Kolisek, M.; Beck, A.; Fleig, A.; Penner, R. Cyclic ADP-ribose and hydrogen peroxide synergize with ADP-ribose in the activation of TRPM2 channels. Mol. Cell 2005, 18, 61–69. [Google Scholar] [CrossRef] [PubMed]
  46. Perraud, A.L.; Takanishi, C.L.; Shen, B.; Kang, S.; Smith, M.K.; Schmitz, C.; Knowles, H.M.; Ferraris, D.; Li, W.; Zhang, J.; et al. Accumulation of free ADP-ribose from mitochondria mediates oxidative stress-induced gating of TRPM2 cation channels. J. Biol. Chem. 2005, 280, 6138–6148. [Google Scholar] [CrossRef] [PubMed]
  47. Hawkins, B.J.; Irrinki, K.M.; Mallilankaraman, K.; Lien, Y.C.; Wang, Y.; Bhanumathy, C.D.; Subbiah, R.; Ritchie, M.F.; Soboloff, J.; Baba, Y.; et al. S-glutathionylation activates STIM1 and alters mitochondrial homeostasis. J. Cell Biol. 2010, 190, 391–405. [Google Scholar] [CrossRef] [PubMed] [Green Version]
  48. Martinotti, S.; Calabrese, G.; Ranzato, E. Honeydew honey: Biological effects on skin cells. Mol. Cell. Biochem. 2017, 435, 185–192. [Google Scholar] [CrossRef] [PubMed]
  49. Cipriani, V.; Ranzato, E.; Balbo, V.; Mazzucco, L.; Cavaletto, M.; Patrone, M. Long-term effect of platelet lysate on primary fibroblasts highlighted with a proteomic approach. J. Tissue Eng. Regen. Med. 2009, 3, 531–538. [Google Scholar] [CrossRef]
  50. Zuccolo, E.; Lim, D.; Kheder, D.A.; Perna, A.; Catarsi, P.; Botta, L.; Rosti, V.; Riboni, L.; Sancini, G.; Tanzi, F.; et al. Acetylcholine induces intracellular Ca(2+) oscillations and nitric oxide release in mouse brain endothelial cells. Cell Calcium 2017, 66, 33–47. [Google Scholar] [CrossRef]
  51. Ranzato, E.; Boccafoschi, F.; Mazzucco, L.; Patrone, M.; Burlando, B. Role of ERK1/2 in platelet lysate-driven endothelial cell repair. J. Cell. Biochem. 2010, 110, 783–793. [Google Scholar] [CrossRef]
  52. Andrikopoulos, P.; Baba, A.; Matsuda, T.; Djamgoz, M.B.A.; Yaqoob, M.M.; Eccles, S.A. Ca2+ Influx through Reverse Mode Na+/Ca2+ Exchange Is Critical for Vascular Endothelial Growth Factor-mediated Extracellular Signal-regulated Kinase (ERK) 1/2 Activation and Angiogenic Functions of Human Endothelial Cells. J. Biol. Chem. 2011, 286, 37919–37931. [Google Scholar] [CrossRef]
  53. Umemura, M.; Baljinnyam, E.; Feske, S.; De Lorenzo, M.S.; Xie, L.H.; Feng, X.; Oda, K.; Makino, A.; Fujita, T.; Yokoyama, U.; et al. Store-operated Ca2+ entry (SOCE) regulates melanoma proliferation and cell migration. PLoS ONE 2014, 9, e89292. [Google Scholar] [CrossRef]
  54. Gelderblom, M.; Melzer, N.; Schattling, B.; Gob, E.; Hicking, G.; Arunachalam, P.; Bittner, S.; Ufer, F.; Herrmann, A.M.; Bernreuther, C.; et al. Transient receptor potential melastatin subfamily member 2 cation channel regulates detrimental immune cell invasion in ischemic stroke. Stroke 2014, 45, 3395–3402. [Google Scholar] [CrossRef] [PubMed]
  55. Mittal, M.; Nepal, S.; Tsukasaki, Y.; Hecquet, C.M.; Soni, D.; Rehman, J.; Tiruppathi, C.; Malik, A.B. Neutrophil Activation of Endothelial Cell-Expressed TRPM2 Mediates Transendothelial Neutrophil Migration and Vascular Injury. Circ. Res. 2017, 121, 1081–1091. [Google Scholar] [CrossRef] [PubMed]
  56. Hecquet, C.M.; Malik, A.B. Role of H2O2-activated TRPM2 calcium channel in oxidant-induced endothelial injury. Thromb. Haemost. 2009, 101, 619–625. [Google Scholar] [CrossRef] [PubMed]
  57. Ranzato, E.; Magnelli, V.; Martinotti, S.; Waheed, Z.; Cain, S.M.; Snutch, T.P.; Marchetti, C.; Burlando, B. Epigallocatechin-3-gallate elicits Ca2+ spike in MCF-7 breast cancer cells: Essential role of Cav3.2 channels. Cell Calcium 2014, 56, 285–295. [Google Scholar] [CrossRef] [PubMed]
  58. Ranzato, E.; Martinotti, S.; Magnelli, V.; Murer, B.; Biffo, S.; Mutti, L.; Burlando, B. Epigallocatechin-3-gallate induces mesothelioma cell death via H2O2-dependent T-type Ca2+ channel opening. J. Cell. Mol. Med. 2012, 16, 2667–2678. [Google Scholar] [CrossRef] [PubMed]
  59. Grynkiewicz, G.; Poenie, M.; Tsien, R.Y. A new generation of Ca2+ indicators with greatly improved fluorescence properties. J. Biol. Chem. 1985, 260, 3440–3450. [Google Scholar] [PubMed]
  60. Ranzato, E.; Biffo, S.; Burlando, B. Selective ascorbate toxicity in malignant mesothelioma: A redox Trojan mechanism. Am. J. Respir. Cell Mol. Biol. 2011, 44, 108–117. [Google Scholar] [CrossRef]
  61. Laemmli, U.K. Cleavage of structural proteins during the assembly of the head of bacteriophage T4. Nature 1970, 227, 680–685. [Google Scholar] [CrossRef] [PubMed]
Figure 1. Honey induces an increase in intracellular Ca2+ concentration in human keratinocytes. (A) [Ca2+]i variations recorded at 10-s intervals, showing no variations in control conditions, and distinct patterns of Ca2+ signaling after exposure to different Honey samples (i.e., Acacia, Manuka, Buckwheat 4% v/v). The arrow indicates the addition of different honey types after 60 s. Data are presented as means ± SEM. of [Ca2+]i traces recorded in different cells. Number of cells: CTRL: 20 cells from 2 experiments (exp); acacia honey: 40 cells from 3 exp; manuka honey: 30 cells from 3 exp; buckwheat honey: 40 cells from 3 exp. (B) Mean ± SEM of the peak Ca2+ response induced by treatment with 4% v/v of different types of honey. Number of cells as in A. Different letters above bars indicate statistical differences determined by One-way ANOVA followed by Dunnet post-test (p < 0.01). (C) Dose-response relationship of the increase in [Ca2+]i induced by different concentration (%) v/v of manuka honey and recorded at 10-s intervals. The arrow indicates the addition of different concentrations of manuka honey after 60 s. Data are means ± SEM of [Ca2+]i traces recorded in different cells. Number of cells: CTRL: 20 cells from 2 exp; 1% v/v manuka honey: 40 cells from 3 exp; 2% v/v manuka honey: 30 cells from 3 exp; 4% v/v manuka honey: 40 cells from 3 exp. (D) Mean ± SEM of the Ca2+ response recorded at the peak (light bars) and at the plateau (dark bars) in the presence of different concentration (%) v/v of manuka money. Number of cells as in (C). Different letters above the bars indicate statistical difference determined by two-way ANOVA followed by Bonferroni’s correction (p < 0.01).
Ijms 20 00764 g001
Figure 2. The Ca2+ response to manuka honey requires extracellular Ca2+ entry. (A) The Ca2+ response to 4% v/v manuka honey was abolished in Ca2+-free medium. Control cells, which were not exposed to the treatment, did not show any change in [Ca2+]i. The arrow indicates the addition of manuka honey after 60 s. Data are means ± SEM of [Ca2+]i traces recorded in different cells. Number of cells: CTRL: 20 cells from 2 exp; manuka honey: 40 cells from 3 exp; manuka honey w/o external Ca2+: 30 cells from 3 exp. (B) Mean ± SEM of the peak Ca2+ response recorded under the designated treatments. Number of cells as in A. Different letters above bars indicate statistical difference determined by One-way ANOVA followed by Dunnet post-test (p < 0.01).
Ijms 20 00764 g002
Figure 3. The Ca2+ response to manuka honey requires the intracellular production of hydrogen peroxide. (A) Production of H2O2 after 10 min incubation with increasing concentrations of distinct honey types. Different asterisks above bars indicate statistical difference determined One-way ANOVA followed by Bonferroni post-test (p < 0.01); (B) Fluorescence values recorded at 10 min in control cells (ctrl), or in cells incubated with different honey samples (i.e., Acacia, Manuka, Buckwheat 4% v/v) (* p < 0.001, Tukey’s test). Data are presented as means ± SD of rhodamine 123 fluorescence expressed in arbitrary units; n = 16 microplate wells from two different experiments. (C) The Ca2+ response to 4% v/v manuka honey is inhibited by Catalase (CAT, 30 min preincubation) in a dose-dependent manner. Data are presented as means ± SEM of [Ca2+]i traces recorded in different cells. The arrow indicates the addition of manuka honey after 60 s. Number of cells: manuka honey: 40 cells from 3 exp; manuka honey + 500 U CAT: 40 cells from 3 exp; manuka honey + 1000 U CAT: 40 cells from 3 exp. (D) Mean ± SEM of the peak Ca2+ response recorded under the designated treatments. Number of cells as in A. Different letters above the bars indicate statistical difference determined by One-way ANOVA followed by Bonferroni post-test (p < 0.01). (E) [Ca2+]i variations induced by 4% v/v manuka honey and by 50 and 100 µM H2O2. Data are presented as means ± SEM of [Ca2+]i traces recorded in different cells. The arrow indicates the addition of different treatments after 60 s. Number of cells: manuka honey: 40 cells from 3 exp; 50 µM H2O2: 30 cells from 3 exp; 100 µM H2O2: 30 cells from 3 exp. (F) Measurements of peak Ca2+ response upon treatment with 4% v/v manuka honey or different H2O2 concentrations. Mean ± SEM of the peak Ca2+ response recorded under the designated treatments. Number of cells as in (E). Different letters above the bars indicate statistical difference determined by One-way ANOVA followed by Dunnet post-test (p < 0.01).
Ijms 20 00764 g003aIjms 20 00764 g003b
Figure 4. The inhibition of TRPM2 and Orai1 channels abolishes manuka honey-induced Ca2+ entry. (A) Manuka honey-induced Ca2+ entry was dramatically reduced in the presence of either 10 µM Econazole or 1 µM Pyr6 (30 min preincubation for each drug) and completely abolished by the simultaneous treatment with both drugs. Manuka honey was added at 4% v/v. The arrow indicates the addition of manuka honey after 60 s. Data are presented as means ± SEM of [Ca2+]i traces recorded in different cells. Number of cells: manuka honey: 40 cells from 3 exp; manuka honey + Econazole 10 µM: 50 cells from 3 exp; manuka honey + Pyr6 1 µM: 50 cells from 3 exp; manuka honey + Econazole 10 µM + Pyr6 1 µM: 50 cells from 3 exp. (B) Mean ± SEM of the Ca2+ response to 4% v/v manuka honey recorded at the peak (light bars) and at the plateau (dark bars) under the designated treatments. Data are presented as means ± SEM of [Ca2+]i measured by confocal imaging at peak maxima. Number of cells as in (A). Different letters above the bars indicate statistical difference determined by Two-way ANOVA with Bonferroni’s correction (p < 0.01). (C) The mRNA quantity of Stim1-2, Orai1-3 and TRPM2 transcripts was determined by qRT-PCR and is represented as mean relative expression ± SD (n = 3). (D) Expression of TRPM2 gene in HaCaT cells after RNAi. The mRNA quantity of TRPM2 was determined by qRT-PCR and is represented as mean relative expression ± SD (n = 3, * p < 0.001, t-test). (E) The Ca2+ response to 4% v/v manuka honey was suppressed in HaCaT cells transfected with a RNAi selectively targeting TRPM2. The arrow indicates the addition of manuka honey after 60 s. Data are presented as means ± SEM of [Ca2+]i traces recorded in different cells. Number of cells: manuka honey: 40 cells from 3 exp; manuka honey after RNAi for TRPM2: 40 cells from 3 exp. (F). Mean ± SEM of the Ca2+ response to 4% v/v manuka honey recorded at the peak (light bars) and at the plateau (dark bars) under the designate treatments. Number of cells as in (E). Different letters above the bars indicate statistical difference determined by two-way ANOVA with Bonferroni’s correction (p < 0.01).
Ijms 20 00764 g004
Figure 5. The genetic silencing of AQP3 abolishes the Ca2+ response to manuka honey and prevents wound closure in vitro. (A) Expression of AQPs genes in HaCaT cells exposed to different honey sample. The mRNA quantity of AQPs was determined by qRT-PCR and is represented as mean relative expression ± SD (n = 3). Different letters above bars indicate statistical difference determined by One-way ANOVA followed by Bonferroni post-test (p < 0.01). (B) Aquaporin-3 (AQP3) protein expression in HaCaT cells after manuka honey exposure. C is control condition, M is manuka honey treatment. Blots representative of three were shown. Lanes were loaded with 30 μg of proteins, probed with anti-AQP3 rabbit polyclonal antibodies and processed as described in Materials and Methods. The same blots were stripped and re-probed with anti-β-2-microglobulin (B2M) polyclonal antibody, as housekeeping. A major band of about 32 kDa was observed (* p < 0.001, t-test). (C) The Ca2+ response to 4% v/v manuka honey was suppressed in HaCaT cells transfected with a RNAi selectively targeting AQP3. The arrow indicates the addition of manuka honey after 60 s. Data are presented as means ± SEM of [Ca2+]i traces recorded in different cells. Number of cells: manuka honey: 40 cells from 3 exp; manuka honey after RNAi for AQP3: 40 cells from 3 exp. (D) Mean ± SEM of the Ca2+ response to 4% v/v manuka honey recorded at the peak (light bars) and at the plateau (dark bars) under the designate treatments. Number of cells as in C. Different letters above bars indicate statistical difference determined by One-way ANOVA followed by Bonferroni post-test (p < 0.01). (E) Effect of AQP3 RNAi on honey-induced scratch wound repair of HaCaT monolayers. Wound closure rate is expressed as the difference between wound width at 0 and 24 h. Data were recorded 24 h after scratch wound healing of cells exposed to 0.1% manuka honey. Bars represent mean ± SEM of wound closure inhibition deriving from two independent experiments, each with n = 20. Different letters on bars indicate significant differences according to Tukey’s test (p < 0.01). (F) Aquaporin-3 (AQP3) protein expression in HaCaT cells after AQP3 RNAi. Blots representative of three were shown. Lanes were loaded with 15 μg of proteins, probed with anti-AQP3 rabbit polyclonal antibodies and processed as described in Materials and Methods. The same blots were stripped and re-probed with anti-β-actin polyclonal antibody, as housekeeping (* p < 0.001, t-test). (G) Fluorescence values recorded at 10 min. in scrambled or silenced (RNAi AQP3) cells, in control conditions (dark bars) or incubated with 4% manuka honey (light bars). Data are presented as means ± SD of rhodamine 123 fluorescence expressed in arbitrary units; n = 16 microplate wells from two different experiments. Different letters on bars indicate significant differences according to Tukey’s test (p < 0.01).
Ijms 20 00764 g005aIjms 20 00764 g005b
Figure 6. Manuka honey-induced wound closure requires hydrogen peroxide and extracellular Ca2+ entry. (A) Effect of different inhibitors on honey-induced scratch wound repair of HaCaT monolayers. Each inhibitor was used according to the procedures, which were previously shown to inhibit manuka honey-induced extracellular Ca2+ entry: 10 μM Econazole, 1 μM Pyr6. We also used (B) 1000 U CAT. Wound closure rate is expressed as the difference between wound width at 0 and 24 h. Data were recorded 24 h after scratch wound healing of cells exposed to 0.5% manuka honey, in the presence or absence of various inhibitors. Bars represent mean ± SEM of wound closure inhibition deriving from two independent experiments, each with n = 20. For each inhibitor, different letters above bars indicate significant differences according to Tukey’s test (p < 0.01). (C) Micrographs of scratch wounded HaCaT monolayers incubated under control conditions or in the presence of manuka honey and inhibitors and then stained with blue toluidine and observed 24 h after wounding. Scale bar, 200 μm.
Ijms 20 00764 g006
Figure 7. Diagram depicting the mechanism of action of manuka honey on HaCaT keratinocytes, as characterized in the study. Data showed that honey could trigger intracellular Ca2+ changes. The levels and profile were dependent on the source of honey and the source of the Ca2+ is extracellular. Honey induced the production of micromolar levels of H2O2. Catalase blocks the Ca2+ response indicating that it is a function of H2O2 production. Pharmacological and genetic (siRNA) inhibition of TRPM2 inhibited the Ca2+ response to honey. Pharmaceutical inhibition of Orai1 also diminished the Ca2+ response to honey. Inhibition of both types of channels completely abrogated the Ca2+ response. Examination of aquaporins expression found that AQP3 was upregulated upon honey exposure. siRNA for AQP3 blocked the Ca2+ increase elicited by honey treatment.
Ijms 20 00764 g007
Table 1. Sequences of primers used for qRT-PCR.
Target GeneForward SequenceReverse Sequence
β-actin5′-TCCCTGGAGAAGAGCTACGA-3′5′-AGCACTGTGTTGGCGTACAG-3′
GADPH5′-AATCCCATCACCATCTTCCA-3′5′-TGGACTCCACGACGTACTCA-3′
AQP15′-TAAGGAGAGGAAAGTTCCAG-3′5′-AAAGGCAGACATACACATAC-3′
AQP35′-CTGTGTATGTGTATGTCTGC-3′5′-TTATGACCTGACTTCACTCC-3′
AQP45′-GCTGTGATTCCAAACGGACTGATC-3′5′-CTGACTCCTGTTGTCCTCCACCTC-3′
AQP55′-GCTGGCACTCTGCATCTTCGC-3′5′-AGGTAGAAGTAAAGGATGGCAGC-3′
AQP65′-ATTGGGATCCACTTCACTG-3′5′-AGTGGACTGTGAACTTCC-3′
AQP85′-GGAGATAAGAGTATCTTGCAC-3′5′-CTTGTCATTGCCAAATTCAG-3′
AQP95′-GTATTGGTAGAAACAGGAGTC-3′5′-GGACAATCAAGATGAACGTG-3′
ORAI15′-ATAAGCATTTCCTGTTCTTCC-3′5′-ACACATGTACACACTCAATG-3′
ORAI25′-ATTCGTATAAATGACCTGCC-3′5′-GTGGTGGTTAGAGGTGAC-3′
ORAI35′-CTATCTTTGGAGGTTCAAGC-3′5′-AGAACAAGTTTGGTGCATAG-3′
STIM15′-AGTGAGGATGAGAAACTCAG-3′5′-GAACTCATCACTTTCTTCCAC-3′
STIM25′-GCTATTGCTAAAGATGAGGC-3′5′-TCCAGAATTTTGTGGTCTAC-3′
TRPM25′-CTACCTGAAGGAGAACTACC-3′5′-CAACCTTATTGCTGATGTCC-3′
Table 2. Sequences of siRNA oligonucleotides.
Target ProteinForward SequenceReverse Sequence
AQP35′-GAGCAGAUCUGAGUGGGCA-3′5′-UGCCCACUCAGAUCUGCUC-3′

