Abstract
Ornamental kale is a popular decorative plant. We identified a peculiar bicolor leaf double haploid line, with green margins and red centers. The development of bicolor leaves can be divided into three stages: S1, S2, and S3. To probe the reason for bicolor formation, we analyzed the anthocyanin and chlorophyll contents, detected the changes in indole-3-acetic acid (IAA), abscisic acid (ABA), gibberellin 3 (GA3), sugar, and starch contents, and identified the differentially expressed genes (DEGs) using RNA-seq. Results showed that the bicolor leaf phenotype is gradually formed with anthocyanin degrading and chlorophyll accumulation. Anthocyanin content is lower in the green margin (S3_S) than in the red center (S3_C) part at S3. IAA content was positively correlated with anthocyanin content during the bicolor leaf development. During anthocyanin degrading from S1 to S2, cinnamate-4-hydroxylase (C4H) and transport inhibitor response 1 (TIR1) were downregulated, while lateral organ boundaries domain 39 (LBD39) was upregulated. Two peroxidases, two β-glucosidases (BGLU), LBD39, LBD37, detoxifying efflux carrier 35 (DTX35), three no apical meristem (NAC) transcription factors (TFs), and 15 WRKY DNA-binding protein (WRKY) TFs were downregulated in S3_S vs. S3_C. The bicolor phenotype was mainly linked to anthocyanin degrading and chlorophyll accumulation, and that anthocyanin degrading resulted from reduced anthocyanin biosynthesis and increased anthocyanin degradation.
1. Introduction
Ornamental kale (Brassica oleracea L. var. acephala) is popular because of its bright color and various leaf shapes. Most ornamental plants bear flowers with various colors and pigmentation patterns, spots, irregular blotches, venation, and others [1]. In other plant species, variegated, striped, transparent, yellow, and spotted leaves are attractive features [2]. Using an isolated microspore culture from the Kamome Red variety (Figure 1a,b), we identified a peculiar bicolor leaf, double haploid (DH) line, Y005-7, of ornamental kale, showing green margins around a red center. The S3 leaf of Y005-7 showed a bicolor leaf, while the S3 leaf of the Kamome Red variety was green. This is a novel ornamental trait with great commercial potential. Thus, to elucidate the mechanism of leaf color formation, it is necessary to investigate the pigment change process.
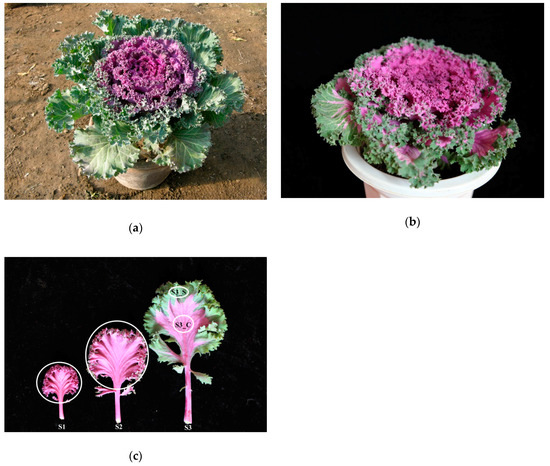
Figure 1.
Phenotype of ‘Y005-7’ and the progenitor. (a) Phenotype of the progenitor. (b) Phenotype of ‘Y005-7’. (c) Phenotype of ‘Y005-7’ at the different developmental stages. The green margin at S3 was denoted as S3_S, and the red center was denoted as S3_C. The white circles denote the sampling sites for RNA extraction, pigment, hormone, sugar, and starch content measurement.
Anthocyanin is a water-soluble pigment. In leaves, it imparts red, pink, blue, purple, and other colors [3]. The anthocyanin biosynthetic pathway is a secondary metabolic process and it has been the subject of extensive study [4,5,6]. This pathway is divided into four stages: the phenylpropanoid pathway stage, polyketide pathway stage, the early biosynthesis stage, and the later biosynthesis stage. The phenylpropanoid pathway generates p-coumaroyl-coenzyme A (CoA) as substrates for anthocyanin biosynthesis. Chalcone synthase (CHS), chalcone isomerase (CHI), flavanone 3-hydroxylase (F3H), and flavonoid 3′-hydroxylase (F3′H) participate in early biosynthesis. The polyketide pathway provides malonyl-CoA for anthocyanin biosynthesis. Flavonol synthase forms flavonol kaempferol. Dihydroflavonol reductase (DFR), leucoanthocyanidin dioxygenase/anthocyanidin synthase (LDOX/ANS), and anthocyanidin reductase (ANR) catalyze the formation of anthocyanin and proanthocyanin [7]. After glycosylation, methylation, and acylation, these compounds are transported to the vacuoles by glutathione-S-transferase (GST), the adenosine triphosphate (ATP)-binding cassette (ABC), and toxic compound extrusion (MATE) Family proteins [8].
The genes involved in the regulation of anthocyanin biosynthesis have also been identified. Both positive and negative regulators of anthocyanin biosynthesis have been described. Members of the R2R3-myeloblastosis (MYB) gene family, basic helix-loop-helix transcription factors, and WD40 repeat proteins form a complex (MBW) that activates the expression level of the structure genes. This complex also participates in other pathways, seed mucilage formation and epidermal cell fate determination, among others [9]. Transcription factor HY5 homolog (HYH) and elongated hypocptyl 5 (HY5) family genes regulate CHI, CHS, F3H, and DFR expressions at low temperatures [10]. Two single-repeat R3-MYB transcription factors (MYB-like 2 (MYBL2) and caprice (CPC)), three members of the lateral organ boundaries domain (LBD) family (LBD37, LBD38, and LBD39), and squamosa promoter binding protein-like 9 (SLP9) negatively regulate anthocyanin biosynthesis in Arabidopsis thaliana [11,12,13,14]. Genes LBD37, LBD38, and LBD39 negatively regulate the late anthocyanin-specific steps by repressing the production of the anthocyanin pigment (PAP) genes PAP1 and PAP2 under nitrogen/nitrate induction. Recently, other TFs, WRKY and NAC, were also found to regulate anthocyanin biosynthesis [15,16].
In addition to endogenous genes, other factors play an important role in anthocyanin accumulation. For example, MBW decreased under low light and high temperature; thus, further influencing anthocyanin content [17]. Exogenous sugar treatment could increase CHS, CHI, F3H, F3′H, DFR, and LDOX expression [18]. Lewis et al. (2011) reported that IAA plays a positive role in anthocyanin biosynthesis; cytokinin (CK), ABA, and GA also promote anthocyanin biosynthesis [19,20].
Recently, the anthocyanin degradation process in plants has been revealed and this metabolic process has received more attention. Anthocyanin usually accumulates in young leaves, and degrades in mature leaves. In young leaves, anthocyanin protects the cells from ultraviolet (UV) light damage, especially in photosynthesis apparatus. As the leaves mature, the leaf color often changes from red to green. Some enzymes have also been reported as involved in anthocyanin degradation in fruit, juice, and flower. For example, β-glucosidases remove the sugar moieties, while the class III peroxidases oxidize the aglycone [21]. Fang et al. (2015) identified a laccase (ADE/LAC) responsible for anthocyanin degradation in litchi fruit pericarp [22]. However, few studies have focused on anthocyanin degradation in plant leaves, which is the subject of the present study.
Chlorophyll is a lipid-soluble pigment located in the thylakoid membrane. It plays a core role in light absorption for photosynthesis. It also absorbs most red and purple wavelengths, but reflects green. The chlorophyll metabolic pathway in higher plants is well characterized. It consists of three steps: chlorophyll biosynthesis, chlorophyll cycle (interconversion of chlorophyll a and chlorophyll b), and chlorophyll degradation [23,24].
In the present study, we obtained a bicolor leaf mutant ‘Y005-7’ (Figure 1a) and analyzed its physiological traits. Total RNA was sampled from the whole leaf without the main vein (stages 1 and 2), and from the margin and center sectors (stage 3) of ‘Y005-7’ and subject to deep sequencing to obtain gene expression profiles related with anthocyanin biosynthesis, chlorophyll biosynthesis, and anthocyanin degradation. A set of DEGs were also identified as involved in anthocyanin degrading and bicolor formation. This information might be applied for breeding plants with desirable color traits and it lays the foundation for further genetic studies on anthocyanin degradation in ornamental kale and other plants.
2. Results
2.1. Chlorophyll and Anthocyanin Levels in Leaves
Anthocyanin content was highest at S1 and decreased at S2, as it reached 10.47 mg g−1 DW (dry weight) at S1 before subsequently declining to 4 mg g−1 DW at S2 (Figure 2a). The chlorophyll contents were very low at S1 and S2 (Figure 2b). The leaf matured and at S3 it finally exhibit green margin and red center. Low levels of anthocyanin were detected in green sectors at S3 (Figure 2a). Chlorophyll levels in the center and margins were also significantly different; the central part contained much less chlorophyll, while the margins contained high chlorophyll levels (Figure 2b). We also compared the anthocyanin/chlorophyll ratio and found that it ranged from 0.08 to 48.89. The ratio was highest at S1 and lowest at S3_S; the value at S2 was 2.40, and chlorophyll started to accumulate when it was below 2.40 (Figure 2c).
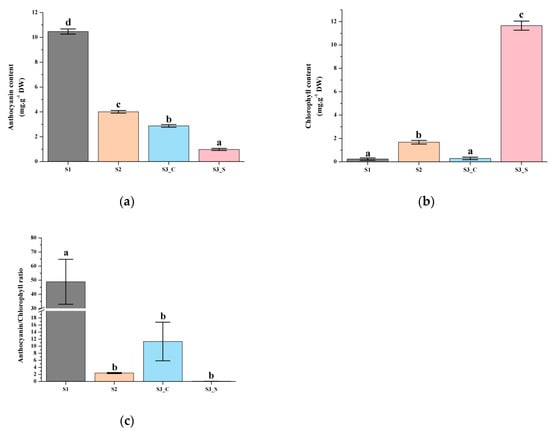
Figure 2.
Pigment accumulation in ‘Y005-7’ leaves at different developmental stages. (a) Anthocyanin contents at S1–S3. (b) Chlorophyll contents at S1–S3. (c) Anthocyanin/chlorophyll ratio at S1–S3. Different letters among stages indicate significant differences at p ≤ 0.01 based on the analysis of variance (ANOVA) (Tukey test).
Based on these results, we hypothesized that increased chlorophyll biosynthesis and anthocyanin degrading lead to the bicolor leaf formation. According to the measurement results of these pigments, we divided the development into two parts to evaluate anthocyanin degrading from S1 to S2 and the different anthocyanin degrading and chlorophyll accumulation rate at S3.
2.2. IAA, ABA, GA3, Sugar, and Starch Contents in Leaves
Previous studies showed that plant hormone and sugar contents are related with anthocyanin accumulation. To further confirm whether hormones played an important role in anthocyanin content changes, IAA, ABA and GA3 contents were examined. Total sugar and starch contents were also measured to test whether hormone-regulated anthocyanin content changes depend on sugar and starch changes, and if sugar and starch independently regulate anthocyanin content changes.
The red leaves in S1 contained higher IAA, ABA and GA3 contents than that in S2. ABA and GA3 contents were higher in the green margins of S3 leaves (S3_S) than in the red centers (S3_C), while the IAA content showed the opposite pattern (Figure 3a–c). Moreover, the GA3 contents in the center and margin of leaves at S3 were higher than that in S1 and S2 leaves. Only the changes in IAA content in different parts of the leaf and at the different stages studied were similar to changes in anthocyanin content, suggesting that IAA was positively correlated with anthocyanin biosynthesis and degradation. Thus, IAA might play an important role in anthocyanin content changes regardless of changes in sugar and starch contents.
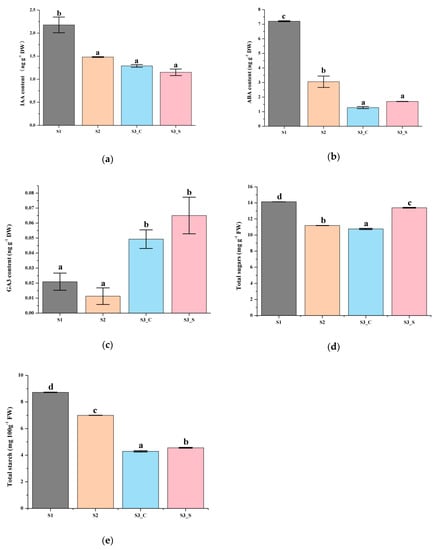
Figure 3.
Biochemical analysis of leaves at different developmental stages. (a) IAA content at S1-S3. (b) ABA content at S1–S3. (c) GA3 content at S1–S3. (d) Total sugar content at S1–S3. (e) Starch content at S1–S3. Different letters among stages indicate significant differences at p ≤ 0.05 based on ANOVA (Tukey test).
2.3. Illumina Sequencing, Sequence Assembly, and DEG Analyses
Pairwise comparisons were conducted to identify the candidate genes involved in anthocyanin biosynthesis and degradation at S2 and in the formation of bicolor leaves at S3. Of the 588.64 million raw reads obtained, 582.72 million were classified as clean after filtering out the low-quality reads (Table S1). Pairwise comparisons revealed 201, 543, and 391 DEGs in S2 vs. S1, S3_S vs. S3_C and S3_S vs. S2, respectively (Figure 4a–c, Tables S2–S4). The pairwise comparison of S2 vs. S1 revealed 99 upregulated and 102 downregulated DEGs, while that of S3_S vs. S3_C revealed 87 upregulated and 456 downregulated DEGs, and that of S3_S vs. S2 revealed 152 upregulated and 239 downregulated DEGs. Identified DEGs included genes involved in anthocyanin biosynthesis, anthocyanin degradation, and photosynthesis. DEGs identified in the pairwise comparisons of S2 vs. S1, S3_S vs. S3_C, and S3_S vs. S2, were selected as the candidate genes potentially associated with anthocyanin degradation and formation of bicolor leaves in ornamental kale and were subjected to further functional analysis.
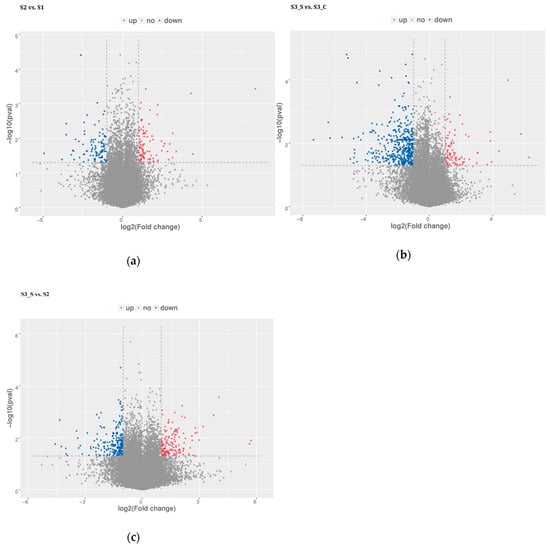
Figure 4.
Distribution of differential expressed genes in pairwise comparisons. (a) Differential expressed genes in S2 vs. S1. (b) Differential expressed genes in S3_S vs. S3_C. (c) Differentially expressed genes in S3_S vs. S2.
2.4. Functional Annotation and Classification
All DEGs identified in pairwise comparisons were searched in the GO (Gene Ontology) and KEGG (Kyoto Encyclopedia of Genes and Genomes) pathway databases. In the S2 vs. S1 pairwise comparison, DEGs were significantly enriched in 49 GO terms as follows: 29 terms for biological process, 18 terms for molecular function, and 1 term for cellular component. The oxidation-reduction process contained the largest number of genes, and therefore anthocyanin degrading might be related with the oxidation-reduction process (Figure 5a). Downregulated DEGs were enriched in 12 pathways, including anthocyanin related ‘Flavonoid biosynthesis’ and ‘Phenylpropanoid biosynthesis’.
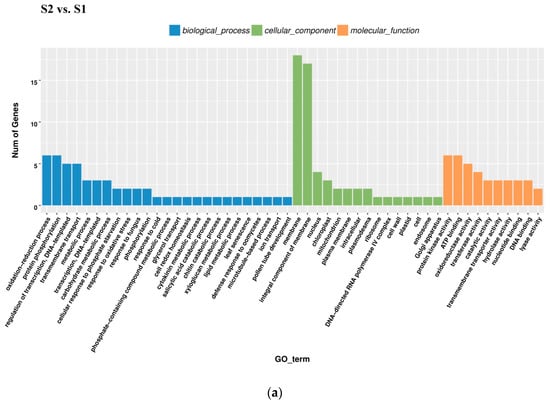

Figure 5.
Gene Ontology (GO) enrichment analysis in pairwise comparisons. (a) GO enrichment analysis in S2 vs. S1. (b) GO enrichment analysis in S3_S vs. S3_C. (c) GO enrichment analysis in S3_S vs. S2.
In the S3_S vs. S3_C pairwise comparison, DEGs were significantly enriched in 83 GO terms as follows: 43 terms for biological process, 36 terms for molecular function, and 4 terms for cellular component. Protein phosphorylation included the largest number of genes related with biological process, while oxidation-reduction included the second (Figure 5b). KEGG enrichment analysis showed that the DEGs were significantly enriched in the pathway of ‘Starch and sucrose metabolism’, ‘Steroid biosynthesis’, ‘Phenylpropanoid biosynthesis’, ‘Sesquiterpenoid and triterpenoid biosynthesis’, ‘Cyanoamino acid metabolism’, ‘Plant-pathogen interaction’, ‘Biosynthesis of siderophore group nonribosomal peptides’, ‘Caffeine metabolism’, and ‘Tropane, piperidine, and pyridine alkaloid biosynthesis’ (Figure 6b). Downregulated DEGs were enriched in 43 pathways, including anthocyanin related ‘flavonoid biosynthesis’, ‘peroxisome’ and ‘phenylpropanoid biosynthesis’, while upregulated DEGs were enriched in 7 pathways, including ‘photosynthesis’. Phenylpropanoid biosynthesis is one part of anthocyanin biosynthesis, and changes in this pathway might be related with anthocyanin degrading and bicolor formation at S3.
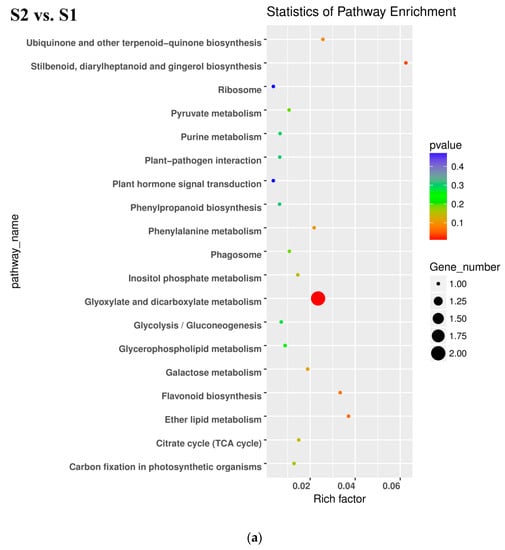
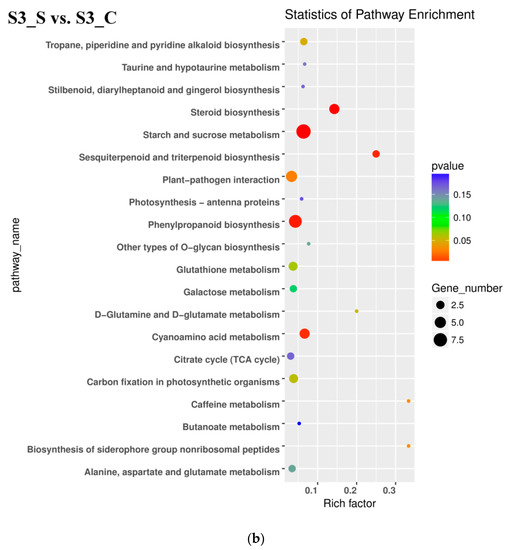
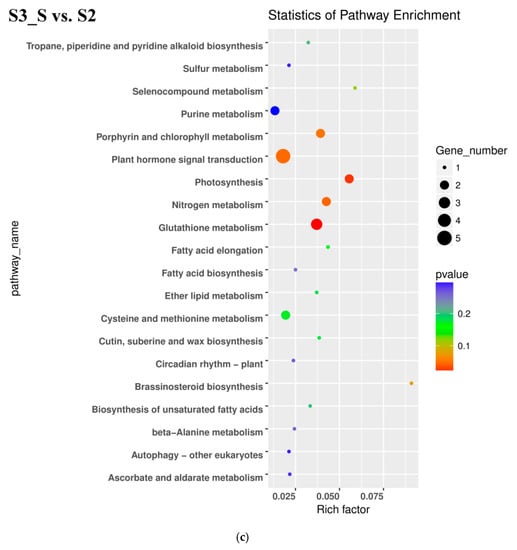
Figure 6.
Kyoto Encyclopedia of Genes and Genomes (KEGG) enrichment analysis in pairwise comparisons. (a) KEGG enrichment analysis in S2 vs. S1. (b) KEGG enrichment analysis in S3_S vs. S3_C. (c) KEGG enrichment analysis in S3_S vs. S2.
In the pairwise comparison of S3_S vs. S2, DEGs were significantly enriched in 64 GO terms as follows: 32 terms for biological process, 25 terms for molecular function, and 7 terms for cellular component. Oxidation-reduction included the largest number of genes related with biological process (Figure 5c). KEGG enrichment analysis showed that DEGs were significantly enriched in the following pathways: ‘glutathione metabolism’, ‘photosynthesis’, ‘nitrogen metabolism’, ‘sesquiterpenoid and triterpenoid biosynthesis’ and ‘plant hormone signal transduction’ (Figure 6c). Up- and downregulated DEGs were distributed into in 18 pathways each. Upregulated DEGs were enriched in ‘photosynthesis’ and ‘porphyrin and chlorophyll metabolism,’ which might be related with chlorophyll accumulation at S3.
2.5. Functional Annotation and Classification
Because bicolor leaf formation was related with anthocyanin degrading and chlorophyll accumulation, and the anthocyanin biosynthesis and chlorophyll metabolism have been well studied, the protein query basic local alignment search tool (BLASTP) method and GO and KEGG analysis were used to identify the genes involved in anthocyanin and chlorophyll metabolism in ornamental kale. The KEGG analysis was used to identify the peroxidases (Enzyme (EC) 1.11.1.7) and the gene annotation was used to identify the β-glucosidases and laccases in anthocyanin degradation.
Ninety-eight genes were involved in anthocyanin biosynthesis in ornamental kale, including 52 structural genes encoding anthocyanin biosynthesis enzymes and the intermediate and final products of this pathway, 34 genes encoding special regulatory proteins, four genes encoding proteins transporting anthocyanin and proanthocyanin to the vacuoles, and eight other genes (Table S5). One-hundred and nineteen genes involved in chlorophyll metabolism and its regulation were also identified, including 71 genes involved in chlorophyll metabolism and 48 genes related with the regulation of chlorophyll metabolism (Table S6). Polyphenol oxidase is located in the chloroplast, while anthocyanin is synthesized in the cytoplasm and transported to the vacuole. Although the link between vacuole and chloroplast is still unknown, the polyphenol oxidase gene should be excluded from the candidate genes. Sixty peroxidases, 13 β-glucosidases, and 16 laccases were finally identified (Table S7).
2.6. Quantitative Real-Time PCR (qRT-PCR) Analysis of the Gene Expression Patterns
The gene expression patterns of the DEGs involved in pigment biosynthesis were validated by qRT-PCR (Figure 7, Table S8), which indicated that the transcriptome analysis was reliable.
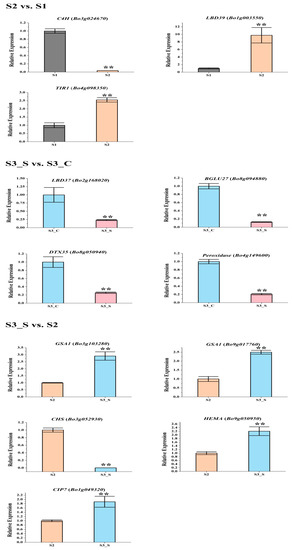
Figure 7.
Expression levels of the differentially expressed genes (DEGs) related with anthocyanin biosynthesis, anthocyanin degrading and chlorophyll biosynthesis in the three pairwise comparisons. Only DEGs with reduction in S3_S vs. S3_C were tested. Data are represented as the mean ± standard deviation (SD). ** p < 0.01 using the t-test.
2.7. Analysis of the Genes Involved in Anthocyanin Biosynthesis
The phenylpropanoid and polyketide pathway contained five Phe-ammonia lyase (PAL), five C4H, nine 4CL, and one ACC1. The early biosynthesis contained seven CHS, two CHI, one chalcone isomerase-like (CHI-L), two F3H and two F3′H, and the later biosynthesis contained two DFR, two ANS, eight UDP-glycosyltransferases (UGTs), one malnoyl-CoA:anthocyanin 5-O-glucoside-6”-O-malonyltransferase (5MAT), and two sinapoylglucose:anthocyanin sinapoyltransferase (SAT). Two TT2, two TT19, and one ANA10 were involved in anthocyanin transport. Gene C4H (Bo3g024670) was significantly decreased in S2 vs. S1. Certain structural genes had relatively higher Fragments Per Kilobase of transcript per million mapped reads (FPKM) at S1 or S2, including CHS (Bo2g146220), F3H (Bo8g081770), F3′H (Bo9g174880) DFR (Bo9g058630), ANS (Bo1g031790), and SAT (Bo3g042330). The FPKM values for most structural genes decreased at S2 (Figure 8). Consistent with the low anthocyanin content at S3_S, the FPKM values for most genes were also very low (Figure 8), and the FPKM values for nearly half of the anthocyanin biosynthesis genes were lower in S3_S than in S3_C. The FPKM values for most of the genes involved in anthocyanin transport (TT12 and AHA10) and modification (UGT, 5MAT, and A3GlcCouT) were ˂1. The FPKM values for nearly half the anthocyanin biosynthesis genes were lower in S3_S than in S2. Gene CHS (Bo3g052930) was significantly decreased in S3_S vs. S2 (Figure 9).
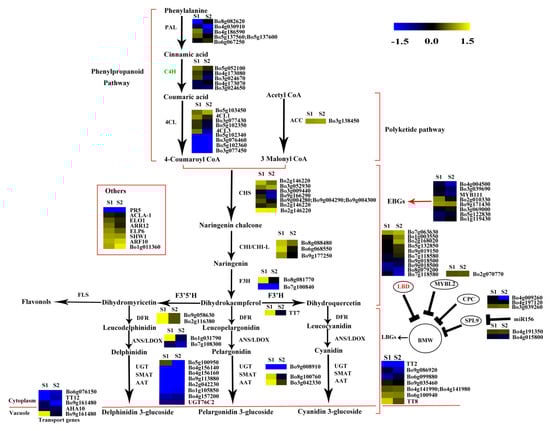
Figure 8.
Expression patterns of the genes involved in anthocyanin biosynthesis in S2 vs. S1. Enzyme names in red represent upregulated genes in S2 vs. S1. Enzyme names in green represent downregulated genes in S2 vs. S1. The red parentheses represent the four pathways, the black and red arrows represent the positive regulation and black “T” represent negative regulation. The genes in the red box are the other genes involved in anthocyanin biosynthesis.
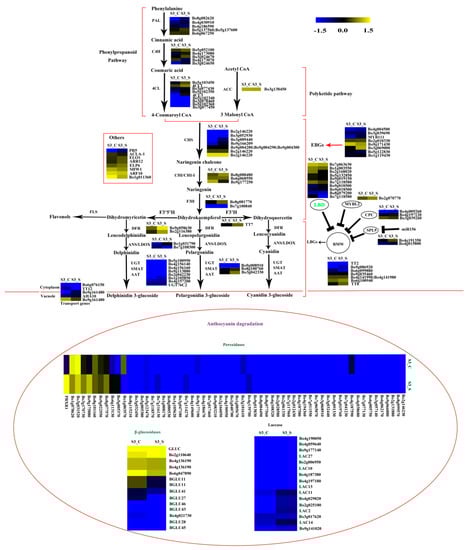
Figure 9.
Expression pattern of the genes involved in anthocyanin biosynthesis and anthocyanin degradation in S3_S vs. S3_C. Enzyme names in green represent downregulated genes in S3_S vs. S3_C. The genes in the ovoid circle are the genes involved in anthocyanin degradation. The red parentheses represent the four pathways, the black and red arrows represent the positive regulation and black “T” represent negative regulation. The genes in the red box are the other genes involved in anthocyanin biosynthesis.
Two of the 34 genes involved in the regulation of anthocyanin biosynthesis were identified as DEGs in pairwise comparisons. LBD39 (Bo1g003550) was upregulated at S2 compared to S1. Almost half of the positive regulatory genes showed a higher expression level at S1 than at S2 (Figure 8). LBD39 (Bo7g118580) and LBD37 (Bo2g168020) were down regulated at S3_S compared to S3_C (Figure 9). One negative regulatory gene, MYBL2, exhibited higher level in S3_S than in S3_C. The expression patterns of the anthocyanin biosynthesis genes were consistent with the changes in anthocyanin content at S2 compared to S1, S3_S compared to S3_C, and S3_S compared to S2 (Figure 10).
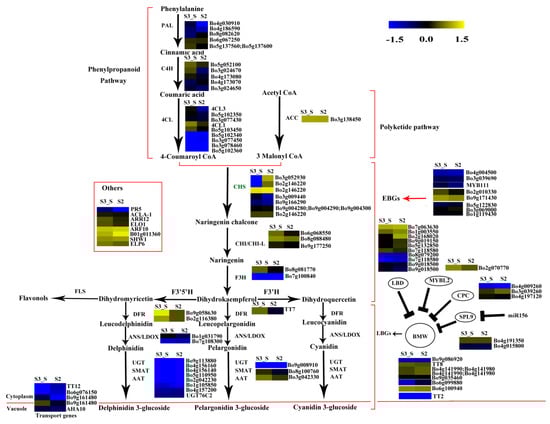
Figure 10.
Expression pattern of the genes involved in anthocyanin biosynthesis in S3_S vs. S2. Enzyme names in green represent downregulated genes in S3_S vs. S2. The red parentheses represent the four pathways, the black and red arrows represent the positive regulation and black “T” represent negative regulation. The genes in the red box are the other genes involved in anthocyanin biosynthesis.
2.8. Expression Patterns of the Genes Involved in Anthocyanin Degrading
The FPKM values of the 36 peroxidase genes were lower than 1. The expression levels of the 16 laccase genes were similar in S2 vs. S1, S3_S vs. S3_C, and S3_S vs. S2. Two peroxidase genes (Bo4g149600 and Bo4g187590) and two β-glucosidase genes (Bo8g094880 and Bo4g021730) were also down regulated in S3_S vs. S3_C (Figure 9). The two peroxidase and two β-glucosidase genes were related with the different anthocyanin degrading rates in the leaf center and margin.
2.9. DEGs Identified in Two Pairwise Comparisons
In addition to the DEGs mentioned in the previous subsections, other DEGs were found to be related with anthocyanin accumulation. In the pairwise comparison of S2 vs. S1, the downregulated Bo4g098350 was homologous to AtTIR1, which is an auxin receptor that mediates auxin-regulated transcriptions (Table S2). Studies also showed that auxin-stimulated flavonoid synthesis was blocked in TIR1 mutants [19]. A downregulated DTX was found in the pairwise comparison of S3_S vs. S3_C, and absence of this gene affects flavonoid metabolism [25]. Some TFs were found in these two pairwise comparisons. One WRKY TF was downregulated in S2 vs. S1. One MYB, one ethylene response factor (ERF), one MYC-type (MYC) TFs, three NAC TFs, and 15 WRKY TFs were downregulated and one light harvesting complex photosystem II subunit 6 (LHCB 6) was upregulated in S3_S vs. S3_C. One photosystem I subunit H2 (PSAH2) was upregulated and one photosystem II subunit P-2 (PSBP-2) was downregulated in the pairwise comparison of S3_S vs. S2. These DEGs may also be involved in color degradation and in bicolor formation at S3 (Tables S3 and S4).
2.10. Expression Patterns of the Genes Involved in Chlorophyll Metabolism
The FPKM values for Bo5g016620, Bo4g012640, Bo9g174500, Bo7g109930, Bo4g112650, Bo9g115140, and Bo1g108220 were ˂1 at all stages. Bo7g077290, Bo9g069300, Bo2g132170, and Bo3g023990 had relatively high FPKM values (Figure S1). Expression levels changed little for 1/3 of the genes, while those of about another 1/3 of the genes at S2 were higher than at S1. The expression level of this gene in S3_S was over two-fold higher than that in S3_C, but no genes were identified as DEGs in S2 vs. S1 and S3_S vs. S3_C (Figure S2). Among the 71 genes involved in chlorophyll metabolism, glutamyl-tRNA reductase (HEMA, Bo9g050950), glutamate-1-semialdehyde 2,1-aminomutase (GSA1, Bo9g017760 and Bo3g103280), and COP1-interacting protein 7 (CIP7, Bo1g049320) were DEGs in S3_S vs. S2, and these genes were involved in chlorophyll biosynthesis. None of the genes involved in chlorophyll cycle and degradation was found to be DEG in S2 vs. S1, S3_S vs. S3_C and S3_S vs. S2 comparisons (Figure 11).
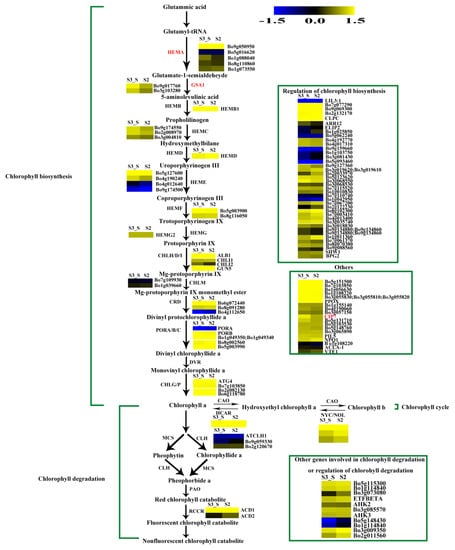
Figure 11.
Expression patterns of the genes involved in chlorophyll metabolism in S3_S vs. S2. Enzyme names in red represent upregulated genes in S3_S vs. S2. The green parentheses represent the three steps in chlorophyll metabolism. The genes in the boxes are the other genes involved in chlorophyll metabolism and the genes involved in regulation of chlorophyll metabolism. The black arrows represent the positive regulation.
3. Discussion
The bicolored leaves of ornamental kale have attracted extensive attention. However, there has been relatively little research on the formation of these color patterns. In the present study, the pigments, hormones, sugar, and starch contents of bicolor kale leaves were analyzed. RNA sequencing was applied to elucidate the gene expression patterns involved in anthocyanin biosynthesis, anthocyanin degradation, and chlorophyll biosynthesis. The 582.72 million clean reads acquired provided a global view of the transcriptome related with the changes in pigmentation, which occur during plant development. They also helped to identifying the key genes related with bicolor leaf formation.
3.1. Anthocyanin and Chlorophyll Content Variations with Plant Development
Leaf color is generally correlated with pigment metabolism. Anthocyanin is generally responsible for the red, blue, pink, and purple leaf colors while chlorophyll is involved in green leaf pigmentation [26,27]. The anthocyanin level slowly decreased with plant development, and at S3 the anthocyanin content in the leaf margin was lower than that in the leaf center. With the increased chlorophyll level in the leaf margin, the leaf finally showed a bicolor leaf phenotype at S3. A previous study showed that the anthocyanin level gradually decreased, and the chlorophyll level slowly increased as the leaf developed in the tea plant [28]. The results of the present study were consistent with that of previous studies. When the anthocyanin/chlorophyll ratio decreased to 2.40, chlorophyll started accumulating. The chlorophyll accumulation was higher when this ratio was lower. Anthocyanin and chlorophyll levels were negatively correlated, and anthocyanin degradation coupled to chlorophyll accumulation led to bicolor leaf formation.
3.2. DEGs Involved in Anthocyanin Biosynthesis
In recent years, the genes involved in anthocyanin biosynthesis have been well studied in Arabidopsis. Anthocyanin accumulation relies on a series of genes, including structural and regulatory genes. We hypothesized that anthocyanin degrading might be related with a low anthocyanin biosynthesis rate. In the present study, we identified five DEGs in the two pairwise comparisons, including CHS, C4H, LBD37, and two LBD39. C4H is a key structural gene in the phenylpropanoid pathway, and some c4h mutants of A. thaliana had lower flavonoid levels than wild type plants. Baek et al. (2008) isolated a full-length cDNA from the C4H gene of Korean black raspberry, and found that C4H plays an important role in flavanol accumulation during the early stages of fruit ripening [29]. Bo1g003550 is a homolog of AtLBD39, and LBD39 is a member of the LBD family. Rubin et al. (2009) reported three nitrogen/nitrate-induced members of the LBD gene family, namely, LBD37, LBD38, and LBD39 in A. thaliana. These genes repress anthocyanin biosynthesis by inhibiting PAP1 and PAP2 [12]. Thus, the reduction in anthocyanin content from S1 to S2 might be due to the different expressions of C4H and LBD39. The downregulated Bo4g098350 gene TIR1 was also identified in the S2 vs. S1 comparison. AtTIR1 is an auxin receptor that mediates auxin-regulated transcriptions. Studies have shown that the auxin-stimulated flavonoid synthesis was blocked in TIR1 mutants [19]. We also detected the auxin contents in S1, S2, S3_C and S3_S and found that the auxin content in S2 was lower than in S1. Thus, and the downregulation of TIR1 might be due to the decreased auxin content and regulate the low rate of anthocyanin synthesis from S1 to S2. A downregulated DTX, which is involved in anthocyanin biosynthesis, was also downregulated in S3_S vs. S3_C. And the DEG might be related with pigment changes. Chalcone synthase is a key enzyme of flavonoid biosynthesis that has been identified in many plants. In certain ornamental plants, CHS regulates bicoloration in flowers, and some flower patterns are due to post-transcriptional CHS silencing. This process occurs in the star and marginal picotee, Camellia japonica, and in dahlias [30,31,32]. Therefore, anthocyanin degradation from S2 to S3_S might be due to the expression of DEG.
Recent reports provided insight into the anthocyanin biosynthesis regulated by WRKY TFs. The WRKY TFs mainly regulated the MBW complex and further influenced the anthocyanin biosynthesis [33,34]. The peach NAC TF, BLOOD (BL), activates PpMYB10.1 transcription, and further influences anthocyanin accumulation [15]. In the present study, three NAC TFs and 15 WRKY TFs were denoted as DEGs and were downregulated in S3_S vs. S3_C. We also found that the anthocyanin content in the leaf margin differed from that in the leaf center at S3, and that the anthocyanin degrading rate in the leaf margin was faster than that in the leaf center at the same stage. Thus, the DEGs mentioned above may delay anthocyanin degrading in the leaf center and further influence bicolor leaf formation.
3.3. DEGs Involved in Anthocyanin Degradation
Most studies on anthocyanin degradation have been conducted in juices and fruits, and few have focused on plants. Anthocyanin often accumulates in young leaves and degrades in mature leaves. This may be due to the fact that anthocyanin can protect leaves from UV light and oxidative damaging, and to the gradual accumulation of chlorophyll in plants [21,35,36], which has been reported in some plants, including Chrysobalanus icaco, Photinia sp., and Cocoplum sp. [21,35,36]. Polyphenol oxidase (PPO), β-glucosidases, peroxidases, and laccases have been reported to be involved in anthocyanin degrading in juices and fruits [22,37,38,39,40,41]. PPO was excluded from the candidate gene pool in plants, but the other three kinds of enzymes might be involved in anthocyanin degrading in plants. β-glucosidases often remove the sugar moieties from anthocyanin, and peroxidases further oxidize the aglycone. Both of these enzymes are located in the vacuole. A laccase is responsible for anthocyanin degrading in litchi fruit pericarp [22] through epicatechin-coupled oxidation, and this enzyme is also located in the vacuole. In the present study, 60 peroxidases, 13 β-glucosidases, and 16 laccases were identified (Table S7). Two peroxidases (Bo4g149600 and Bo4g187590) and two β-glucosidases (Bo4g021730 and Bo8g094880) were downregulated in S3_S vs. S3_C. No transcripts of Bo4g149600 and Bo4g021730 were detected in S3_S. These four DEGs might be related with the different anthocyanin degrading rates in the leaf center and margin.
3.4. DEGs Involved in Chlorophyll Accumulation
The expression patterns of the genes involved in chlorophyll metabolism were also identified in the present study. Four genes were identified as DEGs, including one HEMA, two GSA1 and one CIP7 in S3_S vs. S2. This gene encodes a glutamyl-tRNA reductase protein that catalyzes the nicotinamide adenine dinucleotide phosphate (NADPH)-dependent reduction of Glu-tRNA to glutamate-1-semialdehyde with the release of free tRNA. Kumar et al. (2000) found that HEMA1 loss-of-function mutants presented patchy to completely yellow color and failed to thrive under normal growth conditions [42]. Schmied et al. (2011) found that HEMA1 overexpression in etiolated and dark-grown A. thaliana and tobacco seedlings can cause protochlorophyllide accumulation [43]. Thus, both HEMA and HEMA1 are involved in the early steps of chlorophyll biosynthesis. GSA1 is a homologue of glutamate-1-semialdehyde 2,1-aminomtase for catalyzing the conversion of glutamate-1-semialdehyde (GSA) into 5-amino levulinate (ALA). Both, the expression levels of HEMA and GSA1, were positively regulated by light and led to the formation of ALA, a universal precursor of tetrapyrroles [44]. Yamamoto et al. (1998) found that CIP7 interacts with constitutive photomorphogenic 1 (COP1), which represses photomorphogenesis in darkness. Reduced CIP7 expression decreases anthocyanin and chlorophyll content [45]. In the present study, we identified an upregulated CIP7 and inferred that its elevated expression might be related with anthocyanin and chlorophyll formation in the green parts of leaves at S3. In addition, the expression levels of the four DEGs were consistent with chlorophyll changes observed during plant development and might lead to chlorophyll accumulation in the leaf margin at S3.
4. Materials and Methods
4.1. Plant Materials
Ornamental kale DH lines ‘Y005-7’ were grown in a greenhouse at Shenyang Agriculture University (Shenyang, China). During its ornamental period, this variety displays a bicolor leaf phenotype consisting of red centers and green margins. This phenotype is gradually formed with leaf development, and can be divided into the following stages: stage 1 (S1), leaves entirely red; stage 2 (S2), red pigment appearing in the centers of leaves and leaf margins slightly green; stage 3 (S3), red leaf centers and green leaf margins (Figure 1b). The S1 stage of leaf development occurred from the end of September to mid-October, while the S2 stage occurred from mid-October to the end of October. Next, the S3 stage occurred from November to March of the following year. In order to eliminate the impact of the main vein with higher anthocyanin content, samples at S1. S2 and S3 were collected from whole leaves without the main vein. Samples were immediately frozen in liquid nitrogen and stored at −80 °C before RNA extraction and anthocyanin, chlorophyll, hormone, sugar, and starch content measurements. Three independent biological replicates were used for the above analyses.
4.2. Measurement of Chlorophyll and Anthocyanin Contents
Twenty milligrams of freeze-dried leaf tissue were used for pigment extraction. For the chlorophyll measurements, the samples were soaked in 10 mL of a 96% ethanol solution (v/v) at 25 °C for 24 h, and then whirlpool for 30 s after 12 h in dark culture [46]. A UV spectrophotometer (T6 New Century, Persee, Beijing, China) was used to measure sample absorbances at 649 nm and 665 nm (A649nm and A665nm, respectively) based on three replications. The following formulas were used to calculate the pigment content:
Chlorophyll a content = 13.95A665nm − 6.88A649nm,
Chlorophyll b content = 24.96A649nm − 7.2A665nm.
Anthocyanin content was determined using the method of Rabino and Mancinelli [47]; briefly, 20 mg of freeze-dried leaf tissue was added to 5 mL extracting solution (96% ethanol solution: 1.5 mol/L = 85:15) at 25 °C for 24 h, and then centrifuged for 30 s after 8 h in dark culture. One milliliter solutions were mixed with 2 mL 0.025 M KCl (pH 1.0) and 0.4 M NaAc (pH 4.5). The mixture was cultured at 25 °C for 2 h. Absorbance at 536 nm and 700 nm was measured in triplicate. The following formulas were used to calculate pigment content:
A= (A536nm − A700nm) pH 1.0 − (A536nm − A700nm) pH 4.5,
MW = 449.2 g/mol; e = 26900; DF = 3.
4.3. Measurement of IAA, ABA, GA3, Sugar and Starch Content
Fresh leaf samples (0.3–0.5 g) from different developmental stages and leaf parts were ground in liquid nitrogen, transferred to 3–5 mL isopropyl alcohol/ hydrochloric acid buffer, and kept at 4 °C for 30 min. Six to 10 milliliters of dichloromethane was then added and samples were kept at 4 °C for another 30 min. Liquid samples were centrifuged at 13,000 rpm for 5 min at 4 °C, and the resulting lower organic phase was blow-dried using nitrogen and then dissolved in 400 µL 0.1% formic acid. The solution was filtered through a 0.22-µm membrane and injected in a Qtrap 6500 liquid chromatography (LC)-MS/MS system (ABsciex, Framingham, MA, USA) to determine the IAA, ABA, and GA3 contents using a poroshell 120 SB-C18 column (Agilent Technology, Palo Alto, USA) (2.1 × 150, 2.7 m) set at 30 °C. Phases A and B were methanol/ 0.1% formic acid and water/ 0.1% formic acid, respectively. The gradient was set as: 0–1 min, A at 20%; 1–9 min, an increase to 80%; 9–10 min, A at 80%; 10–10.1 min, A decreased to 20%; 10.1–15 min, A at 20%. The air curtain gas, spray voltage, atomized gas pressure, auxiliary gas pressure, and atomization temperature was 15 psi, 4500 V, 65 psi, 70 psi, and 400 °C, respectively.
Leaf samples (0.1 g) were extracted with 80% ethanol, grind, and then transferred to 10 mL HNO3 in boiling water for 10 min. The resulting supernatant was used for measuring total starch content. Sugars were extracted twice using 5–10 mL distilled water in boiling water for 30 min. Three independent biological replicates were used for the above measurement.
4.4. Identification of the Genes Involved in Anthocyanin Biosynthesis and Chlorophyll Metabolism
To most comprehensively identified genes involved in anthocyanin biosynthesis and chlorophyll metabolism, the protein sequence of the 40, 33, and 22 genes involved in anthocyanin biosynthesis, chlorophyll metabolism, and regulation of chlorophyll metabolism in A. thaliana, respectively, were acquired from TAIR (http://www.arabidopsis.org/). The protein sequences were then aligned with the protein sequences from Brassica oleracea (ftp://ftp.ensemblgenomes.org/pub/release-38/plants/genbank/brassica_oleracea/) using the BLASTP (http://plants.ensembl.org/Brassica_oleracea/Tools/Blast?db=core). The threshold was set at E-value ≤ 1 × E−10.
4.5. Library Construction and Sequencing
A total RNA purification kit (TRK1001; LC Science, Hangzhou, China) was used to extract total RNA from leaves at different stages. The quantity and purity of RNA were determined using Bioanalyzer 2100 and the RNA 6000 Nano LabChip Kit (both Agilent Technologies, Santa Clara, CA, USA). Equal RNA amounts of similar quality were used to create cDNA libraries with the mRNA-Seq sample preparation kit (Illumina, San Diego, CA, USA) following the manufacturer’s protocol. Independent triplicate whole-leaf samples, taken at S1 and S2, and margin (S) and center (C) samples taken at S3 were used to construct 12 cDNA libraries, which were designated S1_1, S1_2, S1_3, S2_1, S2_2, S2_3, S3_S_1, S3_S_2, S3_S_3, S3_C_1, S3_C_2, and S3_C_3. Paired-end sequencing was performed on an Illumina HiSeq 4000 at LC Sciences (Hangzhou, Zhjiang, China).
Clean reads were obtained by removing the low quality reads (i.e., reads containing sequencing adaptors, sequencing primers, and/or nucleotides with a quality score (Q) <20). After that, clean reads were mapped to the reference genome (ftp://ftp.ensemblgenomes.org/pub/release-38/plants/genbank/brassica_oleracea/) using HISAT (Johns Hopkins University Center for Computational Biology, Baltimore, MD, USA). A maximum of two mismatches and multiple alignments per read (≤20 by default) were allowed.
4.6. Transcript Abundance Estimation and Differentially Expressed Genes (DEGs) Testing
StringTie (Johns Hopkins University Center for Computational Biology, Baltimore, Maryland, USA) was used to assemble the mapped reads, and their expression levels were calculated by the FPKM method. Differentially expressed genes were identified by the Ballgown package in R (R Project for Statistical Computing, R Core Team, Johns Hopkins University Center for Computational Biology, Baltimore, Maryland, USA) using log2 (fold change) >1 as a threshold and considering p < 0.05 as statistically significant.
4.7. GO and KEGG Enrichment Analysis of DEGs
All DEGs were mapped to GO terms and KEGG pathways in the respective databases (GO: http://www.geneontology.org/, KEGG: http://www.kegg.jp/kegg). Significantly enriched GO terms and KEGG pathways were identified using hypergeometric tests and the Bonferroni correction with p ≤ 0.05 as a threshold.
4.8. GO and KEGG Enrichment Analysis of DEGs
All DEGs were mapped to GO terms and KEGG pathways in the respective databases (GO: http://www.geneontology.org/, KEGG: http://www.kegg.jp/kegg). Significantly enriched GO terms and KEGG pathways were identified using hypergeometric tests and the Bonferroni correction with p ≤ 0.05 as a threshold.
4.9. qRT-PCR Analysis
In order to verify the reliability of the RNA-seq results, twelve important genes were selected, including five anthocyanin biosynthesis genes (LBD37, C4H, DTX35, CHS, and LBD39), two anthocyanin degradation genes (one peroxidase and one β-glucosidase), four chlorophyll metabolism (HEMA, two GSA1, and CIP7) and one auxin receptor (TIR1). The actin gene (Bo1g116200) was used as an internal control. Gene-specific primers were designed with Primer Premier v. 5.0 (PREMIER Biosoft International, Palo Alto, CA, USA) and primer sequences are shown in Table S8. The qRT-PCR was performed in a QuantStudio 6 PCR System (Applied Biosystems, Foster City, CA, USA) using the 2× Ultra SYBR Mixture (CWBio Corp., Beijing, China). All experiments were performed with three independent biological replicates. The relative expression was calculated using the 2−ΔΔCt method [48].
4.10. Statistical Analyses
Statistical analyses were performed using IBM SPSS statistics 23.0 (https://www.ibm.com/cn-zh/products/spss-statistics). Each value represents the mean ± SD of three independent biological replicates. Significantly different values of qRT-PCR were evaluated using the t-test and p ≤ 0.05 as a threshold. Others were evaluated using ANOVA (Tukey test).
5. Conclusions
In the present study, we found that, as the bicolor kale leaf developed, anthocyanin degraded gradually, and chlorophyll accumulated gradually. Candidate genes involved in anthocyanin degradation and anthocyanin biosynthesis were identified by RNA-seq. According to the transcriptome analysis performed here, the anthocyanin degrading in bicolor development is complex. Anthocyanin biosynthesis genes were downregulated from S1 to S2. One auxin receptor, TIR1, may block anthocyanin biosynthesis, and might have influenced the anthocyanin degrading from S1 to S2 (Figure 12a). Furthermore, TFs, such as NAC TFs and WRKY TFs were differentially expressed in the leaf margin and leaf center at S3, and might be linked to anthocyanin accumulation at S3. Anthocyanin degrading enzymes like peroxidases and β-glucosidases might play a crucial role in anthocyanin degrading at S3. These DEGs contributed to the bicolor formation at S3 (Figure 12b). One anthocyanin biosynthesis gene was downregulated, and four chlorophyll biosynthesis genes were upregulated during the transition from S2 to S3_S. These five DEGs contributed to chlorophyll accumulation at S3. Therefore, we propose that anthocyanin decreases during bicolor development resulting from reduced anthocyanin biosynthesis and increased anthocyanin degradation, while chlorophyll accumulation during bicolor development is a result of increased chlorophyll biosynthesis.
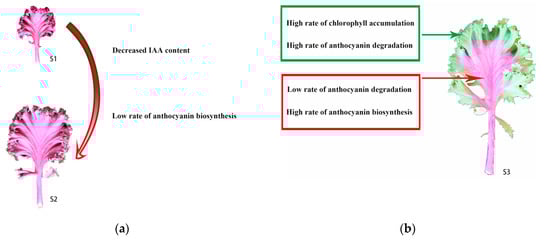
Figure 12.
Proposed models for the determination of anthocyanin degrading from S1 to S2 and the bicolor leaf formation at S3. (a) Proposed model for the determination of anthocyanin degrading from S1 to S2. The red arrow represent the leaf color change from S1 to S2. (b) Proposed models for the bicolor leaf formation at S3. The red box and arrow comprise the biosyntheses occurring in red center leaves and the dark green box and arrow comprises the biosyntheses occurring in green margin leaves.
Supplementary Materials
Supplementary materials can be found at http://www.mdpi.com/1422-0067/20/3/603/s1. Figure S1: Expression patterns of the genes involved in chlorophyll biosynthesis in S2 vs. S1. The green parentheses represent the three steps in chlorophyll metabolism. The genes in the boxes are the other genes involved in chlorophyll metabolism and the genes involved in regulation of chlorophyll metabolism. The black arrows represent the positive positive regulation. Figure S2: Expression patterns of the genes involved in chlorophyll biosynthesis in S3_S vs. S3_C. The green parentheses represent the three steps in chlorophyll metabolism. The genes in the boxes are the other genes involved in chlorophyll metabolism and the genes involved in regulation of chlorophyll metabolism. The black arrows represent the positive positive regulation. Table S1: Statistics of RNA-Seq data. Table S2: Summary of the 201 DEGs in S2 vs. S1. Table S3: Summary of the 543 DEGs in S3_S vs. S3_C. Table S4: Summary of the 391 DEGs in S3_S vs. S2. Table S5: Genes involved in anthocyanin biosynthesis. Table S6: Genes involved in chlorophyll metabolism. Table S7: Genes involved in anthocyanin degrading. Table S8: Primers used to validate the expression patterns.
Author Contributions
Conceptualization, H.F.; Formal analysis, J.R. and Z.L.; Funding acquisition, H.F.; Investigation, J.R., W.C. and H.X.; Resources, H.F.; Writing and original draft, J.R.; Writing, review and editing, H.F. All of the authors read and approved the final manuscript.
Funding
This research was funded by the National Natural Science Foundation of China, grant number 31672144.
Conflicts of Interest
The authors declare no conflict of interest.
Abbreviations
| DH | double haploid |
| IAA | indole-3-acetic acid |
| ABA | abscisic acid |
| GA3 | gibberellin 3 |
| DEGs | differentially expressed genes |
| C4H | cinnamate-4-hydroxylase |
| TIR1 | transport inhibitor response 1 |
| LBD | lateral organ boundaries domain |
| BGLU | β-glucosidase |
| DTX35 | detoxifying efflux carrier 35 |
| NAC | no apical meristem |
| WRKY | WRKY DNA-binding protein |
| TFs | transcription factors |
| CHS | Chalcone synthase |
| CHI | chalcone isomerase |
| CoA | coenzyme A |
| F3H | flavanone 3-hydroxylase |
| F3′H | flavonoid 3′-hydroxylase |
| DFR | Dihydroflavonol reductase |
| LDOX/ANS | leucoanthocyanidin dioxygenase/anthocyanidin synthase |
| ANR | anthocyanidin reductase |
| GST | glutathione-S-transferase |
| ABC | ATP-binding cassette |
| ATP | adenosine triphosphate |
| MATE | toxic compound extrusion |
| MYB | myeloblastosis |
| HYH | HY5 homolog |
| HY5 | elongated hypocptyl 5 |
| MYBL2 | MYB-like 2 |
| CPC | caprice |
| SLP9 | squamosa promoter binding protein-like 9 |
| PAP | production of the anthocyanin pigment |
| CK | cytokinin |
| UV | ultraviolet |
| ADE/LAC | laccase |
| ANOVA | the analysis of variance |
| BLASTP | the protein query basic local alignment search tool |
| EC | Enzyme |
| PAL | Phe-ammonia lyase |
| CHI-L | chalcone isomerase-like |
| UGTs | UDP-glycosyltransferases |
| MAT | malnoyl-CoA:anthocyanin 5-O-glucoside-6”-O-malonyltransferase |
| SAT | sinapoylglucose:anthocyanin sinapoyltransferase |
| FPKM | Fragments Per Kilobase of transcript per million mapped reads |
| ERF | ethylene response factor |
| MYC | MYC-type |
| HEMA | glutamyl-tRNA reductase |
| GSA1 | glutamate-1-semialdehyde 2,1-aminomutase |
| CIP7 | COP1-interacting protein 7 |
| NADPH | nicotinamide adenine dinucleotide phosphate |
| GSA | glutamate-1-semialdehyde |
| ALA | 5-amino levulinate |
| COP1 | constitutive photomorphogenic 1 |
| LHCB 6 | light harvesting complex photosystem II subunit 6 |
| PPO | Polyphenol oxidase |
| GO | Gene Ontology |
| KEGG | Kyoto Encyclopedia of Genes and Genomes |
References
- Hsu, C.C.; Chen, Y.Y.; Tsai, W.C.; Chen, W.H.; Chen, H.H. Three R2R3-MYB transcription factors regulate distinct floral pigmentation patterning in Phalaenopsis spp. Plant Physiol. 2015, 168, 175–191. [Google Scholar] [CrossRef]
- Zhu, G.; Yang, F.; Shi, S.; Li, D.; Wang, Z.; Liu, H.; Huang, D.; Wang, C. Transcriptome Characterization of Cymbidium sinense ‘Dharma’ Using 454 Pyrosequencing and Its Application in the Identification of Genes Associated with Leaf Color Variation. PLoS ONE 2015, 10, e0128592. [Google Scholar] [CrossRef] [PubMed]
- Ren, J.; Liu, Z.; Niu, R.; Feng, H. Mapping of Re, a gene conferring the red leaf trait in ornamental kale (Brassica oleracea L. var. acephala). Plant Breed. 2015, 134, 494–500. [Google Scholar] [CrossRef]
- Koes, R.; Verweij, W.; Quattrocchio, F. Flavonoids: A colorful model for the regulation and evolution of biochemical pathways. Trends Plant Sci. 2005, 10, 236–242. [Google Scholar] [CrossRef] [PubMed]
- Shi, M.Z.; Xie, D.Y. Features of anthocyanin biosynthesis in pap1-D and wild-type Arabidopsis thaliana plants grown in different light intensity and culture media conditions. Planta 2010, 231, 1385–1400. [Google Scholar] [CrossRef] [PubMed]
- Shi, M.Z.; Xie, D.Y. Engineering of red cells of Arabidopsis thaliana and comparative genome-wide gene expression analysis of red cells versus wild-type cells. Planta 2011, 233, 787–805. [Google Scholar] [CrossRef]
- Preuss, A.; Stracke, R.; Weisshaar, B.; Hillebrecht, A.; Matern, U.; Martens, S. Arabidopsis thaliana expresses a second functional flavonol synthase. FEBS Lett. 2009, 583, 1981–1986. [Google Scholar] [CrossRef]
- Wang, L.; Dai, S.; Jin, X.; Huang, H.; Hong, Y. Advances in plant anthocyanin transport mechanism. Chin. J. Biotechnol. 2014, 30, 848. [Google Scholar]
- Ramsay, N.A.; Glover, B.J. MYB-bHLH-WD40 protein complex and the evolution of cellular diversity. Trends Plant Sci. 2005, 10, 63–70. [Google Scholar] [CrossRef]
- Zhang, Y.; Zheng, S.; Liu, Z.; Wang, L.; Bi, Y. Both HY5 and HYH are necessary regulators for low temperature-induced anthocyanin accumulation in Arabidopsis seedlings. J. Plant Physiol. 2011, 168, 367–374. [Google Scholar] [CrossRef]
- Dubos, C.; Le, J.G.; Baudry, A.; Huep, G.; Lanet, E.; Debeaujon, I.; Routaboul, J.M.; Alboresi, A.; Weisshaar, B.; Lepiniec, L. MYBL2 is a new regulator of flavonoid biosynthesis in Arabidopsis thaliana. Plant J. Cell Mol. Biol. 2008, 55, 940. [Google Scholar] [CrossRef] [PubMed]
- Rubin, G.; Tohge, T.; Matsuda, F.; Saito, K.; Scheible, W.R. Members of the LBD Family of Transcription Factors Repress Anthocyanin Synthesis and Affect Additional Nitrogen Responses in Arabidopsis. Plant Cell 2009, 21, 3567. [Google Scholar] [CrossRef] [PubMed]
- Zhu, H.F.; Fitzsimmons, K.; Khandelwal, A.; Kranz, R.G. CPC, a Single-Repeat R3 MYB, Is a Negative Regulator of Anthocyanin Biosynthesis in Arabidopsis. Mol. Plant 2009, 2, 790–802. [Google Scholar] [CrossRef] [PubMed]
- Gou, J.Y.; Felippes, F.F.; Liu, C.J.; Weigel, D.; Wang, J.W. Negative regulation of anthocyanin biosynthesis in Arabidopsis by a miR156-targeted SPL transcription factor. Plant Cell 2011, 23, 1512–1522. [Google Scholar] [CrossRef] [PubMed]
- Zhou, H.; Lin-Wang, K.; Wang, H.; Gu, C.; Dare, A.P.; Espley, R.V.; He, H.; Allan, A.C.; Han, Y. Molecular genetics of blood-fleshed peach reveals activation of anthocyanin biosynthesis by NAC transcription factors. Plant J. Cell Mol. Biol. 2015, 82, 105–121. [Google Scholar] [CrossRef] [PubMed]
- Yang, Y.; Yao, G.; Yue, W.; Zhang, S.; Wu, J. Transcriptome profiling reveals differential gene expression in proanthocyanidin biosynthesis associated with red/green skin color mutant of pear (Pyrus communis L.). Front. Plant Sci. 2015, 6, 795. [Google Scholar] [CrossRef] [PubMed]
- Azuma, A.; Yakushiji, H.; Koshita, Y.; Kobayashi, S. Flavonoid biosynthesis-related genes in grape skin are differentially regulated by temperature and light conditions. Planta 2012, 236, 1067–1080. [Google Scholar] [CrossRef] [PubMed]
- Solfanelli, C.; Poggi, A.; Loreti, E.; Alpi, A.; Perata, P. Sucrose-specific induction of the anthocyanin biosynthetic pathway in Arabidopsis. Plant Physiol. 2006, 140, 637–646. [Google Scholar] [CrossRef]
- Lewis, D.R.; Ramirez, M.V.; Miller, N.D.; Vallabhaneni, P.; Ray, W.K.; Helm, R.F.; Winkel, B.S.; Muday, G.K. Auxin and ethylene induce flavonol accumulation through distinct transcriptional networks. Plant Physiol. 2011, 156, 144–164. [Google Scholar] [CrossRef]
- Wang, H.Z.; Xu, Q.J.; Yan, H.F. Summary of regulation of anthocyanin synthesis by light, sugar and hormone. Acta Agric. Jiangxi 2016, 28, 35–41. [Google Scholar]
- Oren-Shamir, M. Does anthocyanin degradation play a significant role in determining pigment concentration in plants. Plant Sci. 2009, 177, 310–316. [Google Scholar] [CrossRef]
- Fang, F.; Zhang, X.-L.; Luo, H.; Zhou, J.; Gong, Y.-H.; Li, W.-J.; Shi, Z.-W.; He, Q.; Wu, Q.; Li, L.; et al. An Intracellular Laccase Is Responsible for Epicatechin-Mediated Anthocyanin Degradation in Litchi Fruit Pericarp. Plant Physiol. 2015, 169, 2391. [Google Scholar] [CrossRef] [PubMed]
- Eckhardt, U.; Grimm, B.; Hortensteiner, S. Recent advances in chlorophyll biosynthesis and breakdown in higher plants. Plant Mol. Biol. 2004, 56, 1–14. [Google Scholar] [CrossRef] [PubMed]
- Hortensteiner, S. Update on the biochemistry of chlorophyll breakdown. Plant Mol. Biol. 2013, 82, 505–517. [Google Scholar] [CrossRef]
- Thompson, E.P.; Wilkins, C.; Demidchik, V.; Davies, J.M.; Glover, B.J. An Arabidopsis flavonoid transporter is required for anther dehiscence and pollen development. J. Exp. Bot. 2010, 61, 439–451. [Google Scholar] [CrossRef] [PubMed]
- Iwashina, T. Contribution to flower colors of flavonoids including anthocyanins: A review. Nat. Prod. Commun. 2015, 10, 529–544. [Google Scholar] [PubMed]
- Lightbourn, G.J.; Griesbach, R.J.; Novotny, J.A.; Clevidence, B.A.; Rao, D.D.; Stommel, J.R. Effects of anthocyanin and carotenoid combinations on foliage and immature fruit color of Capsicum annuum L. J. Hered. 2008, 99, 105–111. [Google Scholar] [CrossRef]
- Shen, J.; Zou, Z.; Zhang, X.; Zhou, L.; Wang, Y.; Fang, W.; Zhu, X. Metabolic analyses reveal different mechanisms of leaf color change in two purple-leaf tea plant (Camellia sinensis L.) cultivars. Hortic. Res. 2018, 5, 7. [Google Scholar] [CrossRef]
- Baek, M.H.; Chung, B.Y.; Kim, J.H.; Kim, J.S.; Lee, S.S.; An, B.C.; Lee, I.J.; Kim, T.H. cDNA cloning and expression pattern of cinnamate-4-hydroxylase in the Korean black raspberry. BMB Rep. 2008, 41, 529–536. [Google Scholar] [CrossRef]
- Koseki, M.; Goto, K.; Masuta, C.; Kanazawa, A. The star-type color pattern in Petunia hybrida ‘red Star’ flowers is induced by sequence-specific degradation of chalcone synthase RNA. Plant Cell Physiol. 2005, 46, 1879–1883. [Google Scholar] [CrossRef]
- Tateishi, N.; Ozaki, Y.; Okubo, H. White marginal picotee formation in the petals of Camellia japonica ‘Tamanoura’. J. Jpn. Soc. Hortic. Sci. 2010, 79, 207–214. [Google Scholar] [CrossRef]
- Ohno, S.; Hosokawa, M.; Kojima, M.; Kitamura, Y.; Hoshino, A.; Tatsuzawa, F.; Doi, M.; Yazawa, S. Simultaneous post-transcriptional gene silencing of two different chalcone synthase genes resulting in pure white flowers in the octoploid dahlia. Planta 2011, 234, 945–958. [Google Scholar] [CrossRef] [PubMed]
- Gonzalez, A.; Brown, M.; Hatlestad, G.; Akhavan, N.; Smith, T.; Hembd, A.; Moore, J.; Montes, D.; Mosley, T.; Resendez, J.; et al. TTG2 controls the developmental regulation of seed coat tannins in Arabidopsis by regulating vacuolar transport steps in the proanthocyanidin pathway. Dev. Biol. 2016, 419, 54–63. [Google Scholar] [CrossRef] [PubMed]
- Verweij, W.; Spelt, C.E. Functionally Similar WRKY Proteins Regulate Vacuolar Acidification in Petunia and Hair Development in Arabidopsis. Plant Cell 2016, 28, 786–803. [Google Scholar] [CrossRef] [PubMed]
- Steyn, W.J.; Wand, S.J.E.; Holcroft, D.M.; Jacobs, G. Anthocyanins in vegetative tissues: A proposed unified function in photoprotection. New Phytol. 2002, 155, 349–361. [Google Scholar] [CrossRef]
- Nissim-Levi, A.; Kagan, S.; Ovadia, R.; Oren-Shami, M. Effects of temperature, UV-light and magnesium on anthocyanin pigmentation in cocoplum leaves. J. Pomol. Hortic. Sci. 2003, 78, 61–64. [Google Scholar] [CrossRef]
- Lee, H.S.; Wicker, L. Quantitative changes in anthocyanin pigments of lychee fruit during refrigerated storage. Food Chem. 1991, 40, 263–270. [Google Scholar] [CrossRef]
- Underhill, S.; Critchley, C. Anthocyanin decolorisation and its role in lychee pericarp browning. Aust. J. Exp. Agric. 1994, 34, 115–122. [Google Scholar] [CrossRef]
- Zhang, Z.; Pang, X.; Duan, X.; Ji, Z.; Jiang, Y. Role of peroxidase in anthocyanin degradation in litchi fruit pericarp. Food Chem. 2005, 90, 47–52. [Google Scholar] [CrossRef]
- Zheng, X.; Tian, S. Effect of oxalic acid on control of postharvest browning of litchi fruit. Food Chem. 2006, 96, 519–523. [Google Scholar] [CrossRef]
- Huang, S.; Hart, H.; Lee, H.; Wicker, L. Enzymatic and color changes during post-harvest storage of lychee fruit. J. Food Sci. 2010, 55, 1762–1763. [Google Scholar] [CrossRef]
- Kumar, A.M.; Soll, D. Antisense HEMA1 RNA expression inhibits heme and chlorophyll biosynthesis in Arabidopsis. Plant Physiol. 2000, 122, 49–56. [Google Scholar] [CrossRef] [PubMed]
- Schmied, J.; Hedtke, B.; Grimm, B. Overexpression of HEMA1 encoding glutamyl-tRNA reductase. J. Plant Physiol. 2011, 168, 1372–1379. [Google Scholar] [CrossRef] [PubMed]
- Ilag, L.L.; Kumar, A.M.; Soll, D. Light regulation of chlorophyll biosynthesis at the level of 5-aminolevulinate formation in Arabidopsis. Plant Cell 1994, 6, 265–275. [Google Scholar] [CrossRef] [PubMed]
- Yamamoto, Y.Y.; Matsui, M.; Ang, L.H.; Deng, X.W. Role of a COP1 interactive protein in mediating light-regulated gene expression in Arabidopsis. Plant Cell 1998, 10, 1083–1094. [Google Scholar] [CrossRef] [PubMed]
- Gao, J.F. Experimental Guidance of Plant Physiology; Beijing Higher Education Press: Beijing, China, 2006; pp. 74–76. [Google Scholar]
- Rabino, I.; Mancinelli, A.L. Light, temperature, and anthocyanin production. Plant Physiol. 1986, 81, 922–924. [Google Scholar] [CrossRef] [PubMed]
- Livak, K.J.; Schmittgen, T.D. Analysis of relative gene expression data using real-time quantitative PCR and the 2−ΔΔCT Method. Methods (San Diego Calif.) 2001, 25, 402–408. [Google Scholar] [CrossRef] [PubMed]
© 2019 by the authors. Licensee MDPI, Basel, Switzerland. This article is an open access article distributed under the terms and conditions of the Creative Commons Attribution (CC BY) license (http://creativecommons.org/licenses/by/4.0/).