Entrainment of Breast Cell Lines Results in Rhythmic Fluctuations of MicroRNAs


Abstract
:
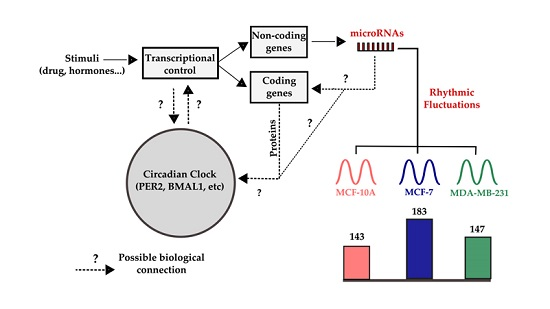
1. Introduction
2. Results
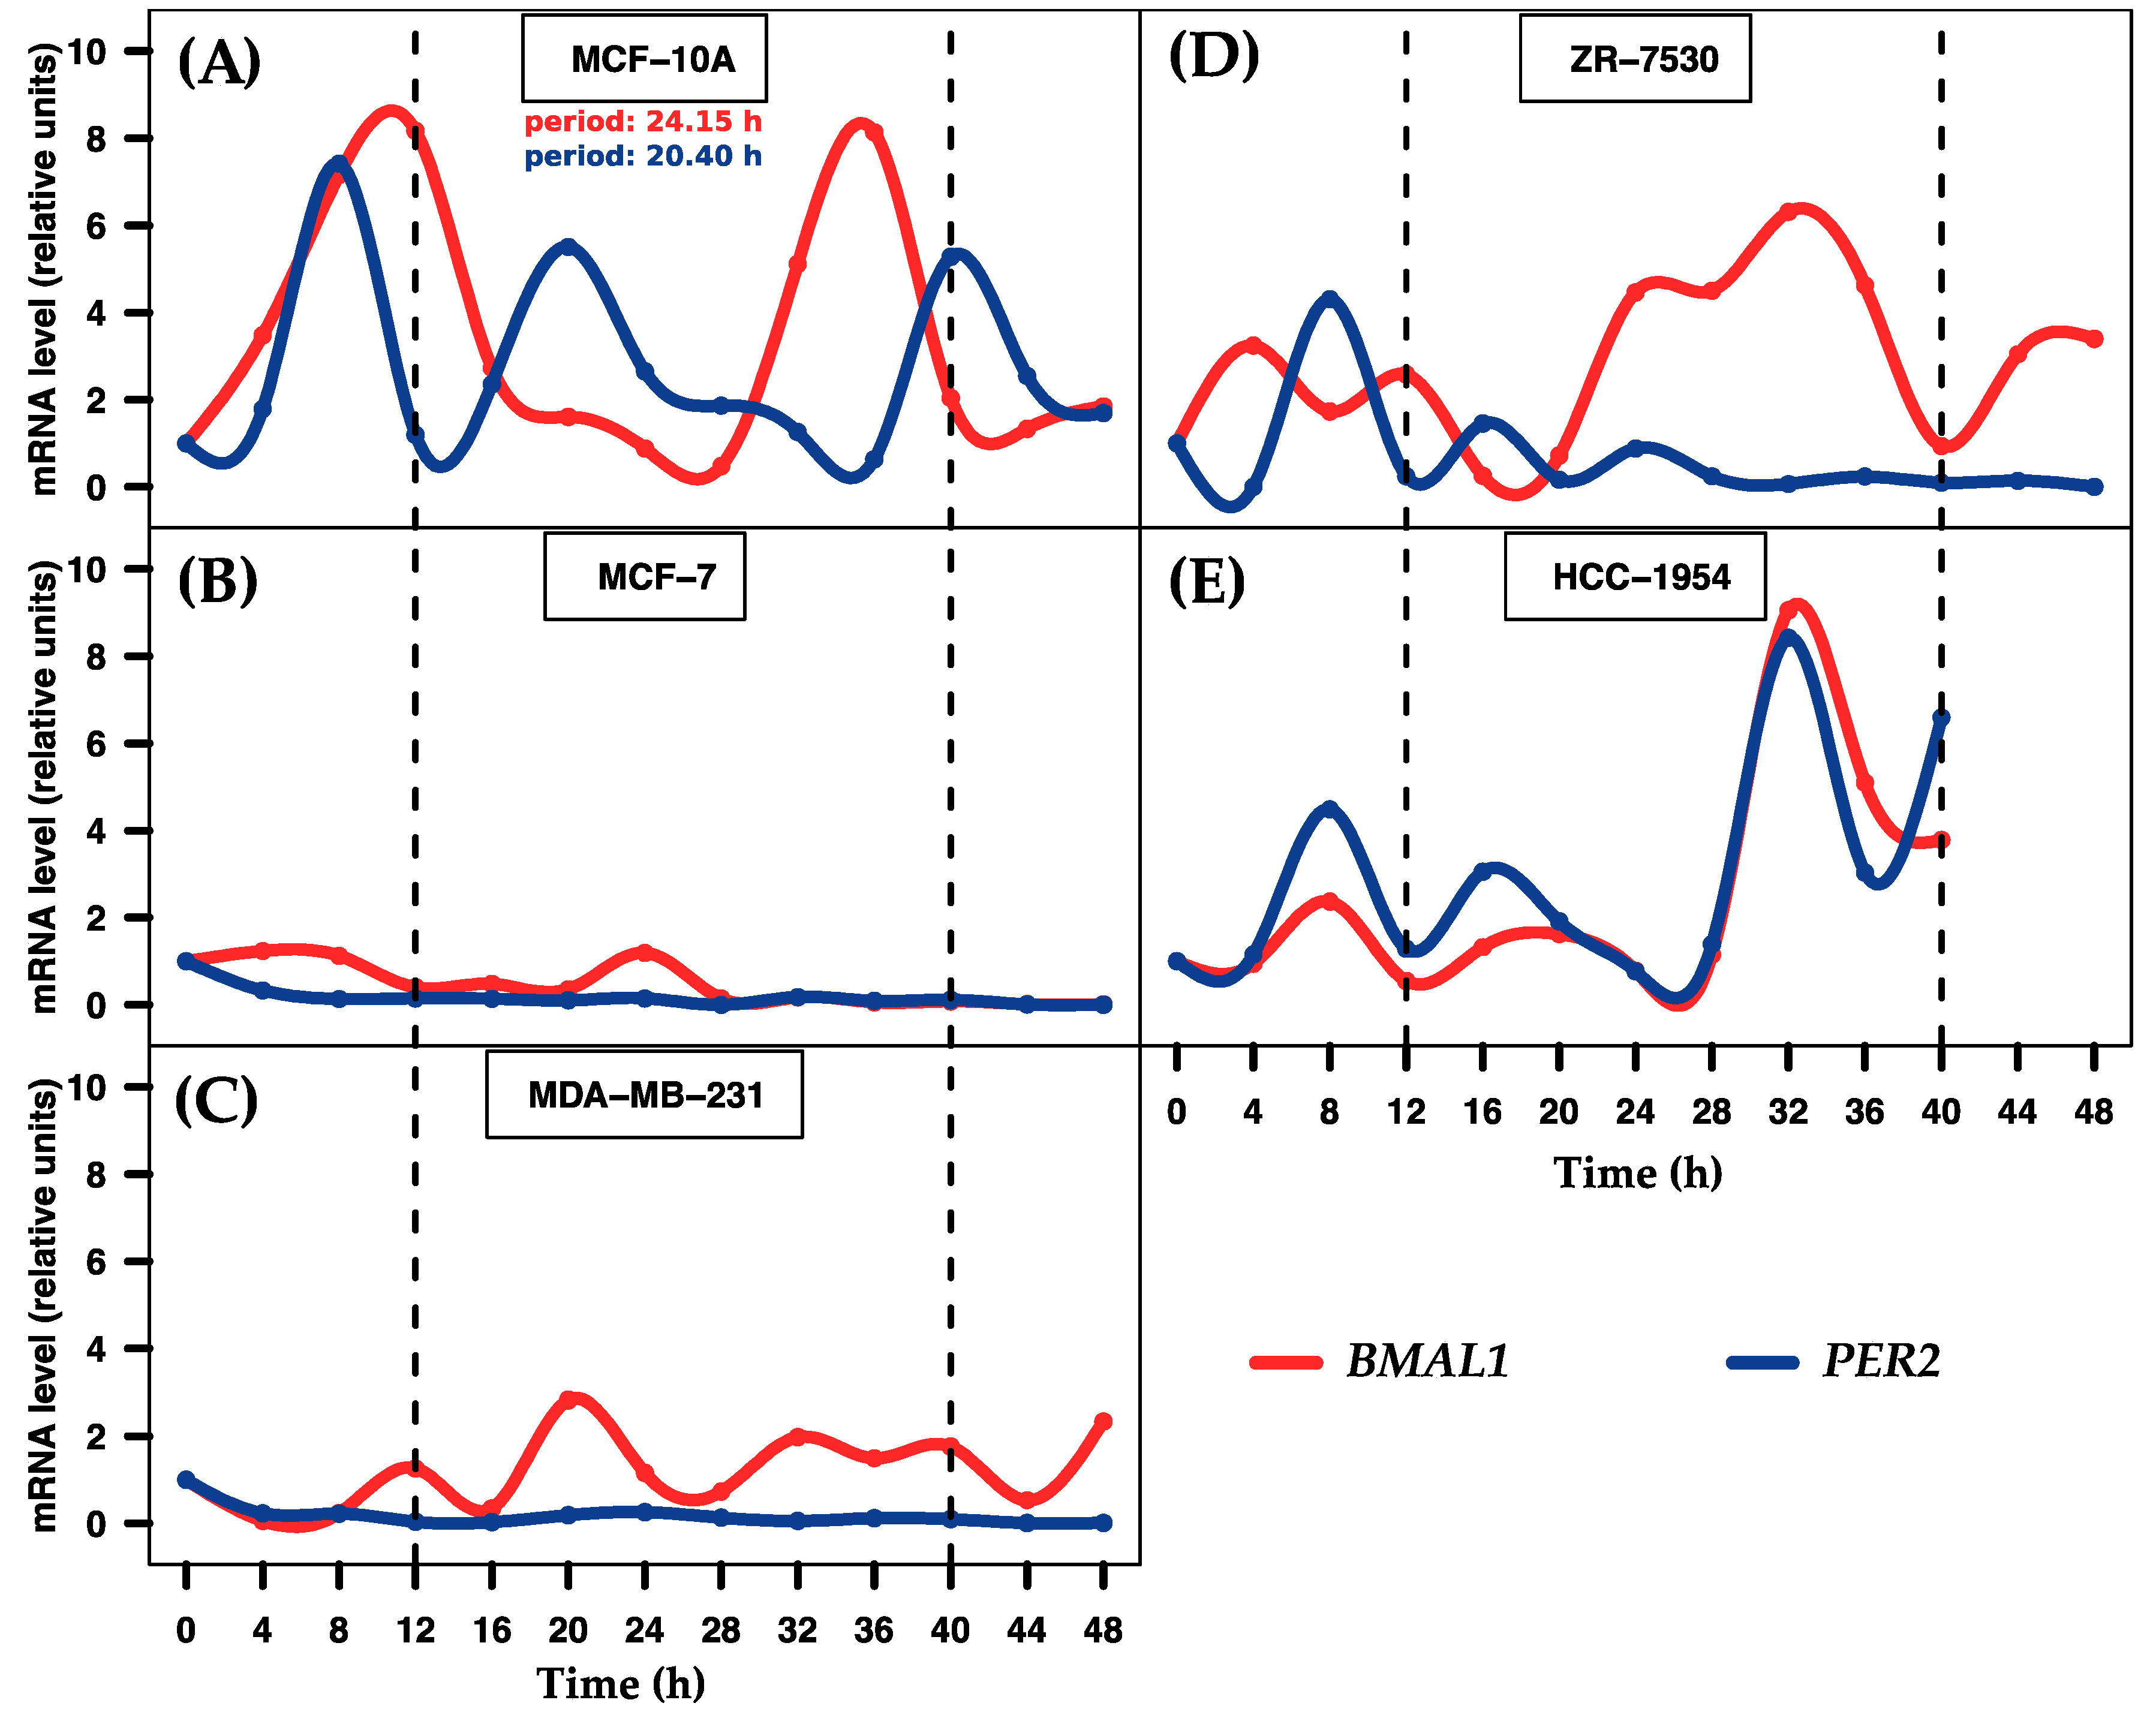
2.1. Entrainment of Human Breast Cell Cultures
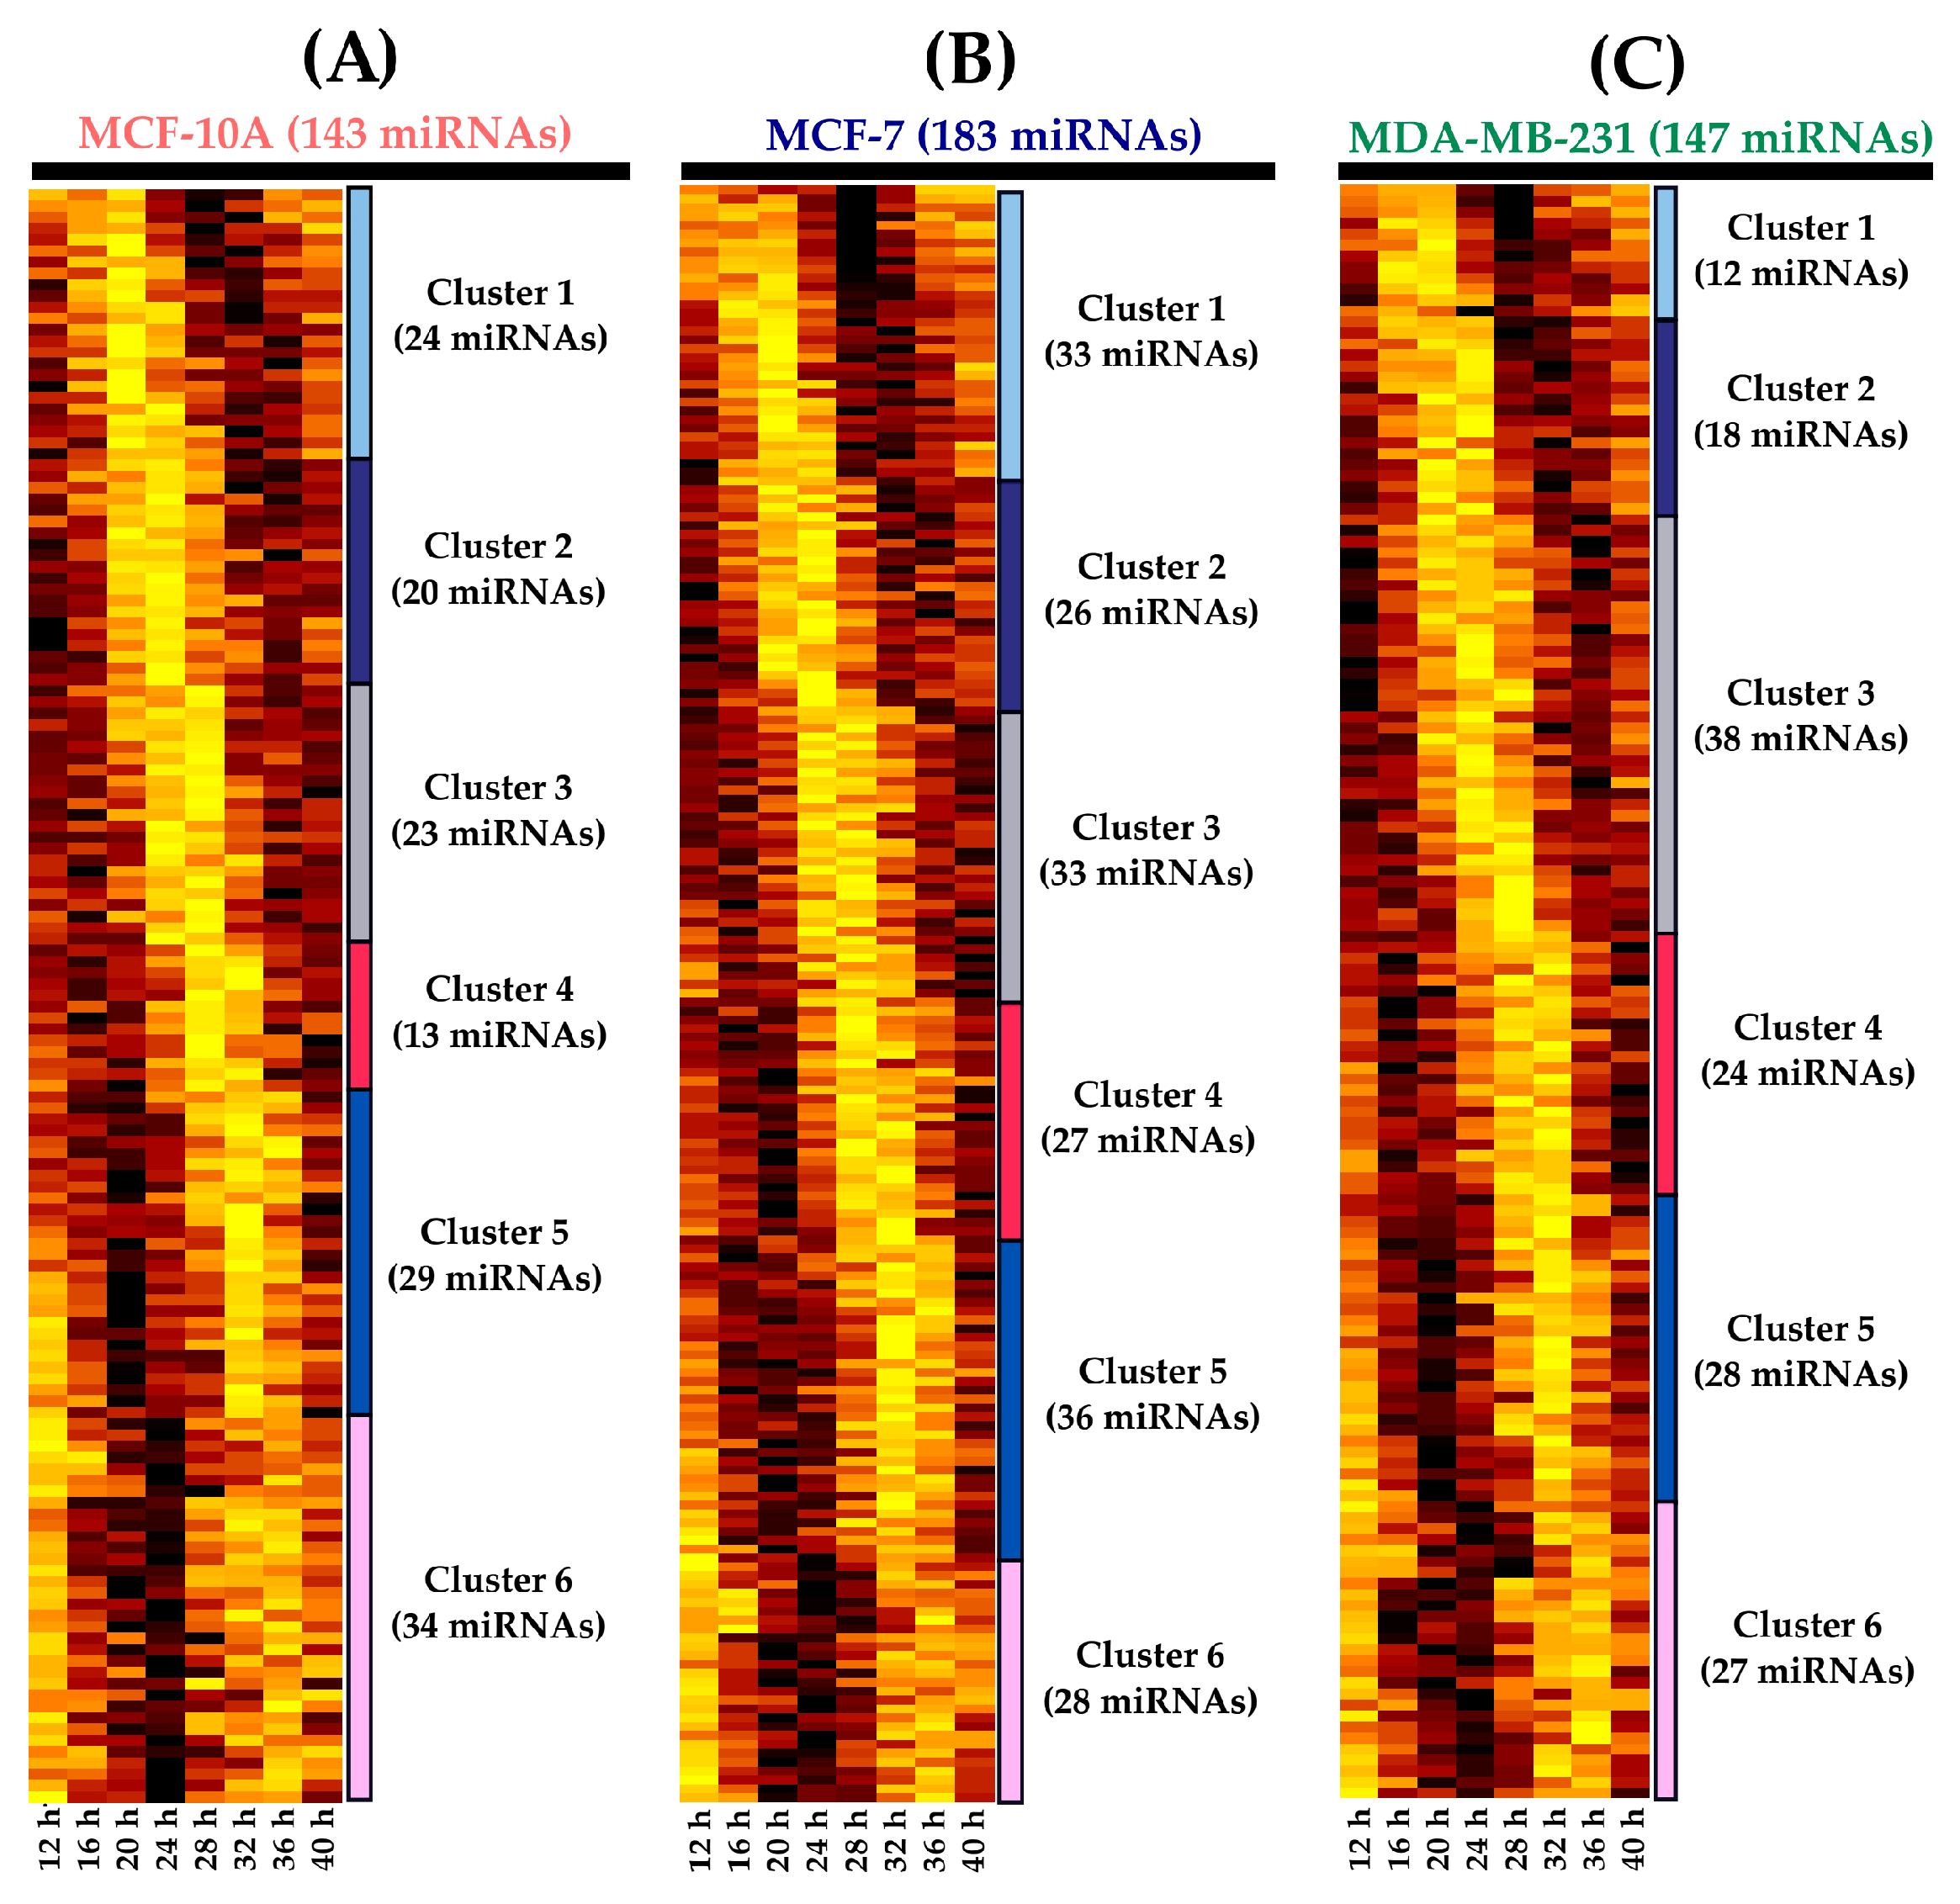
2.2. Statistical Analysis of miRNA Rhythmic Profiles
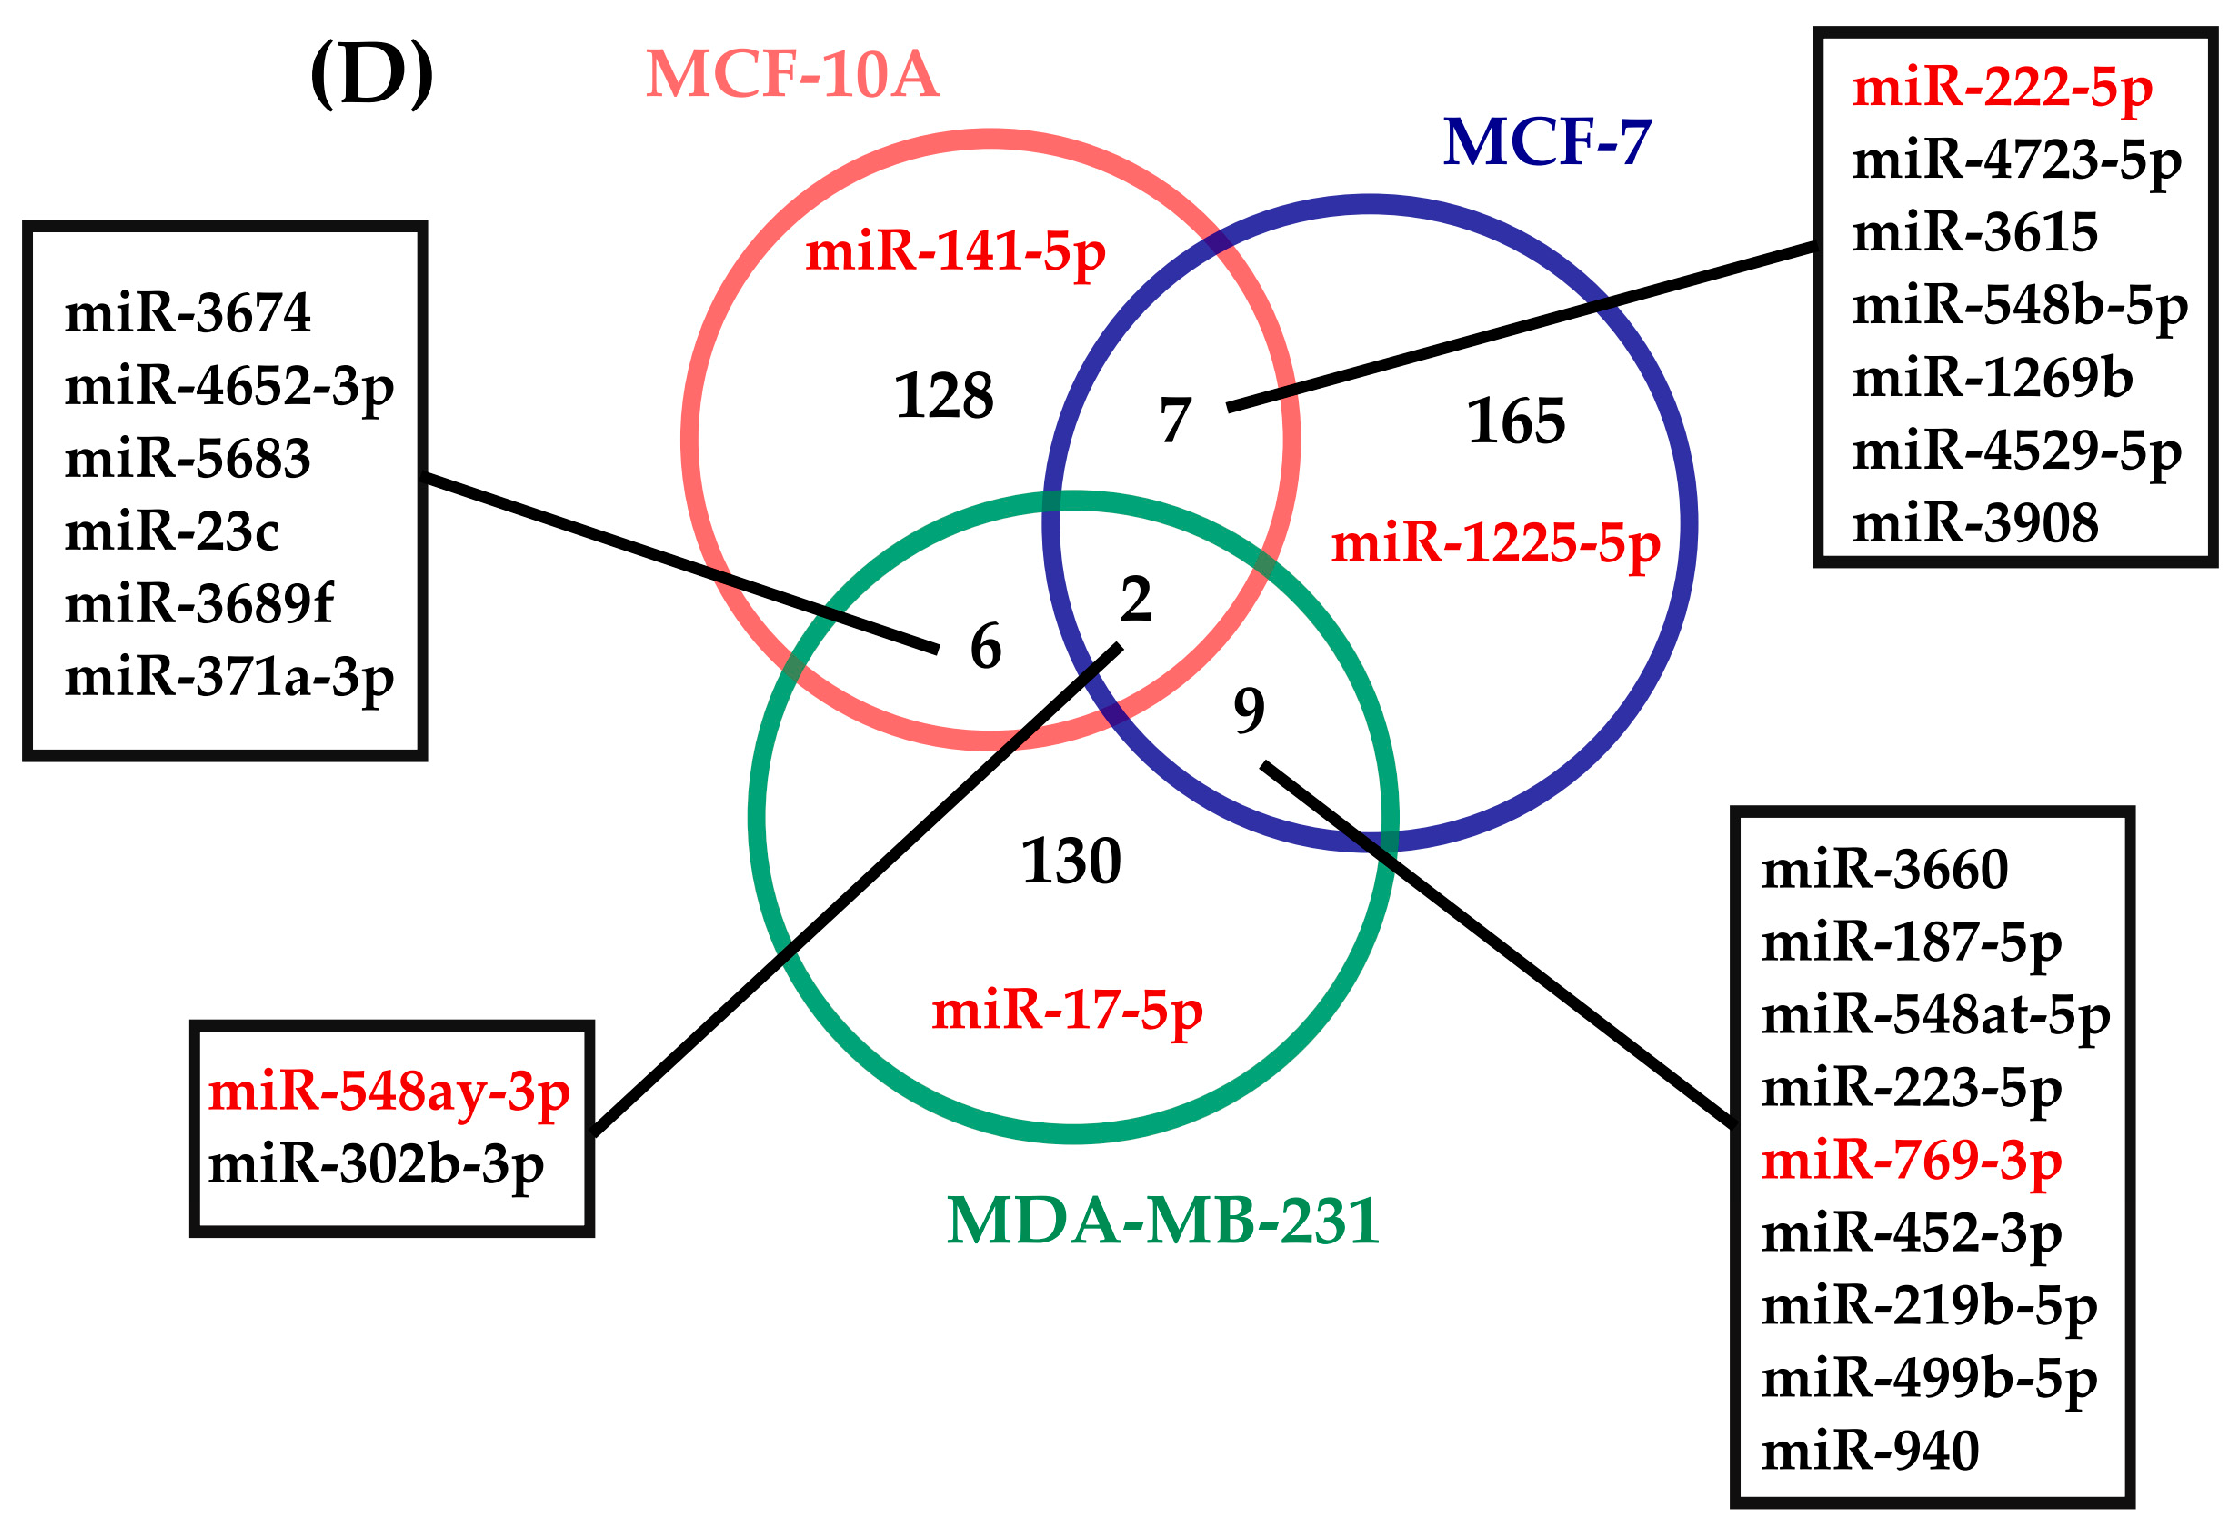
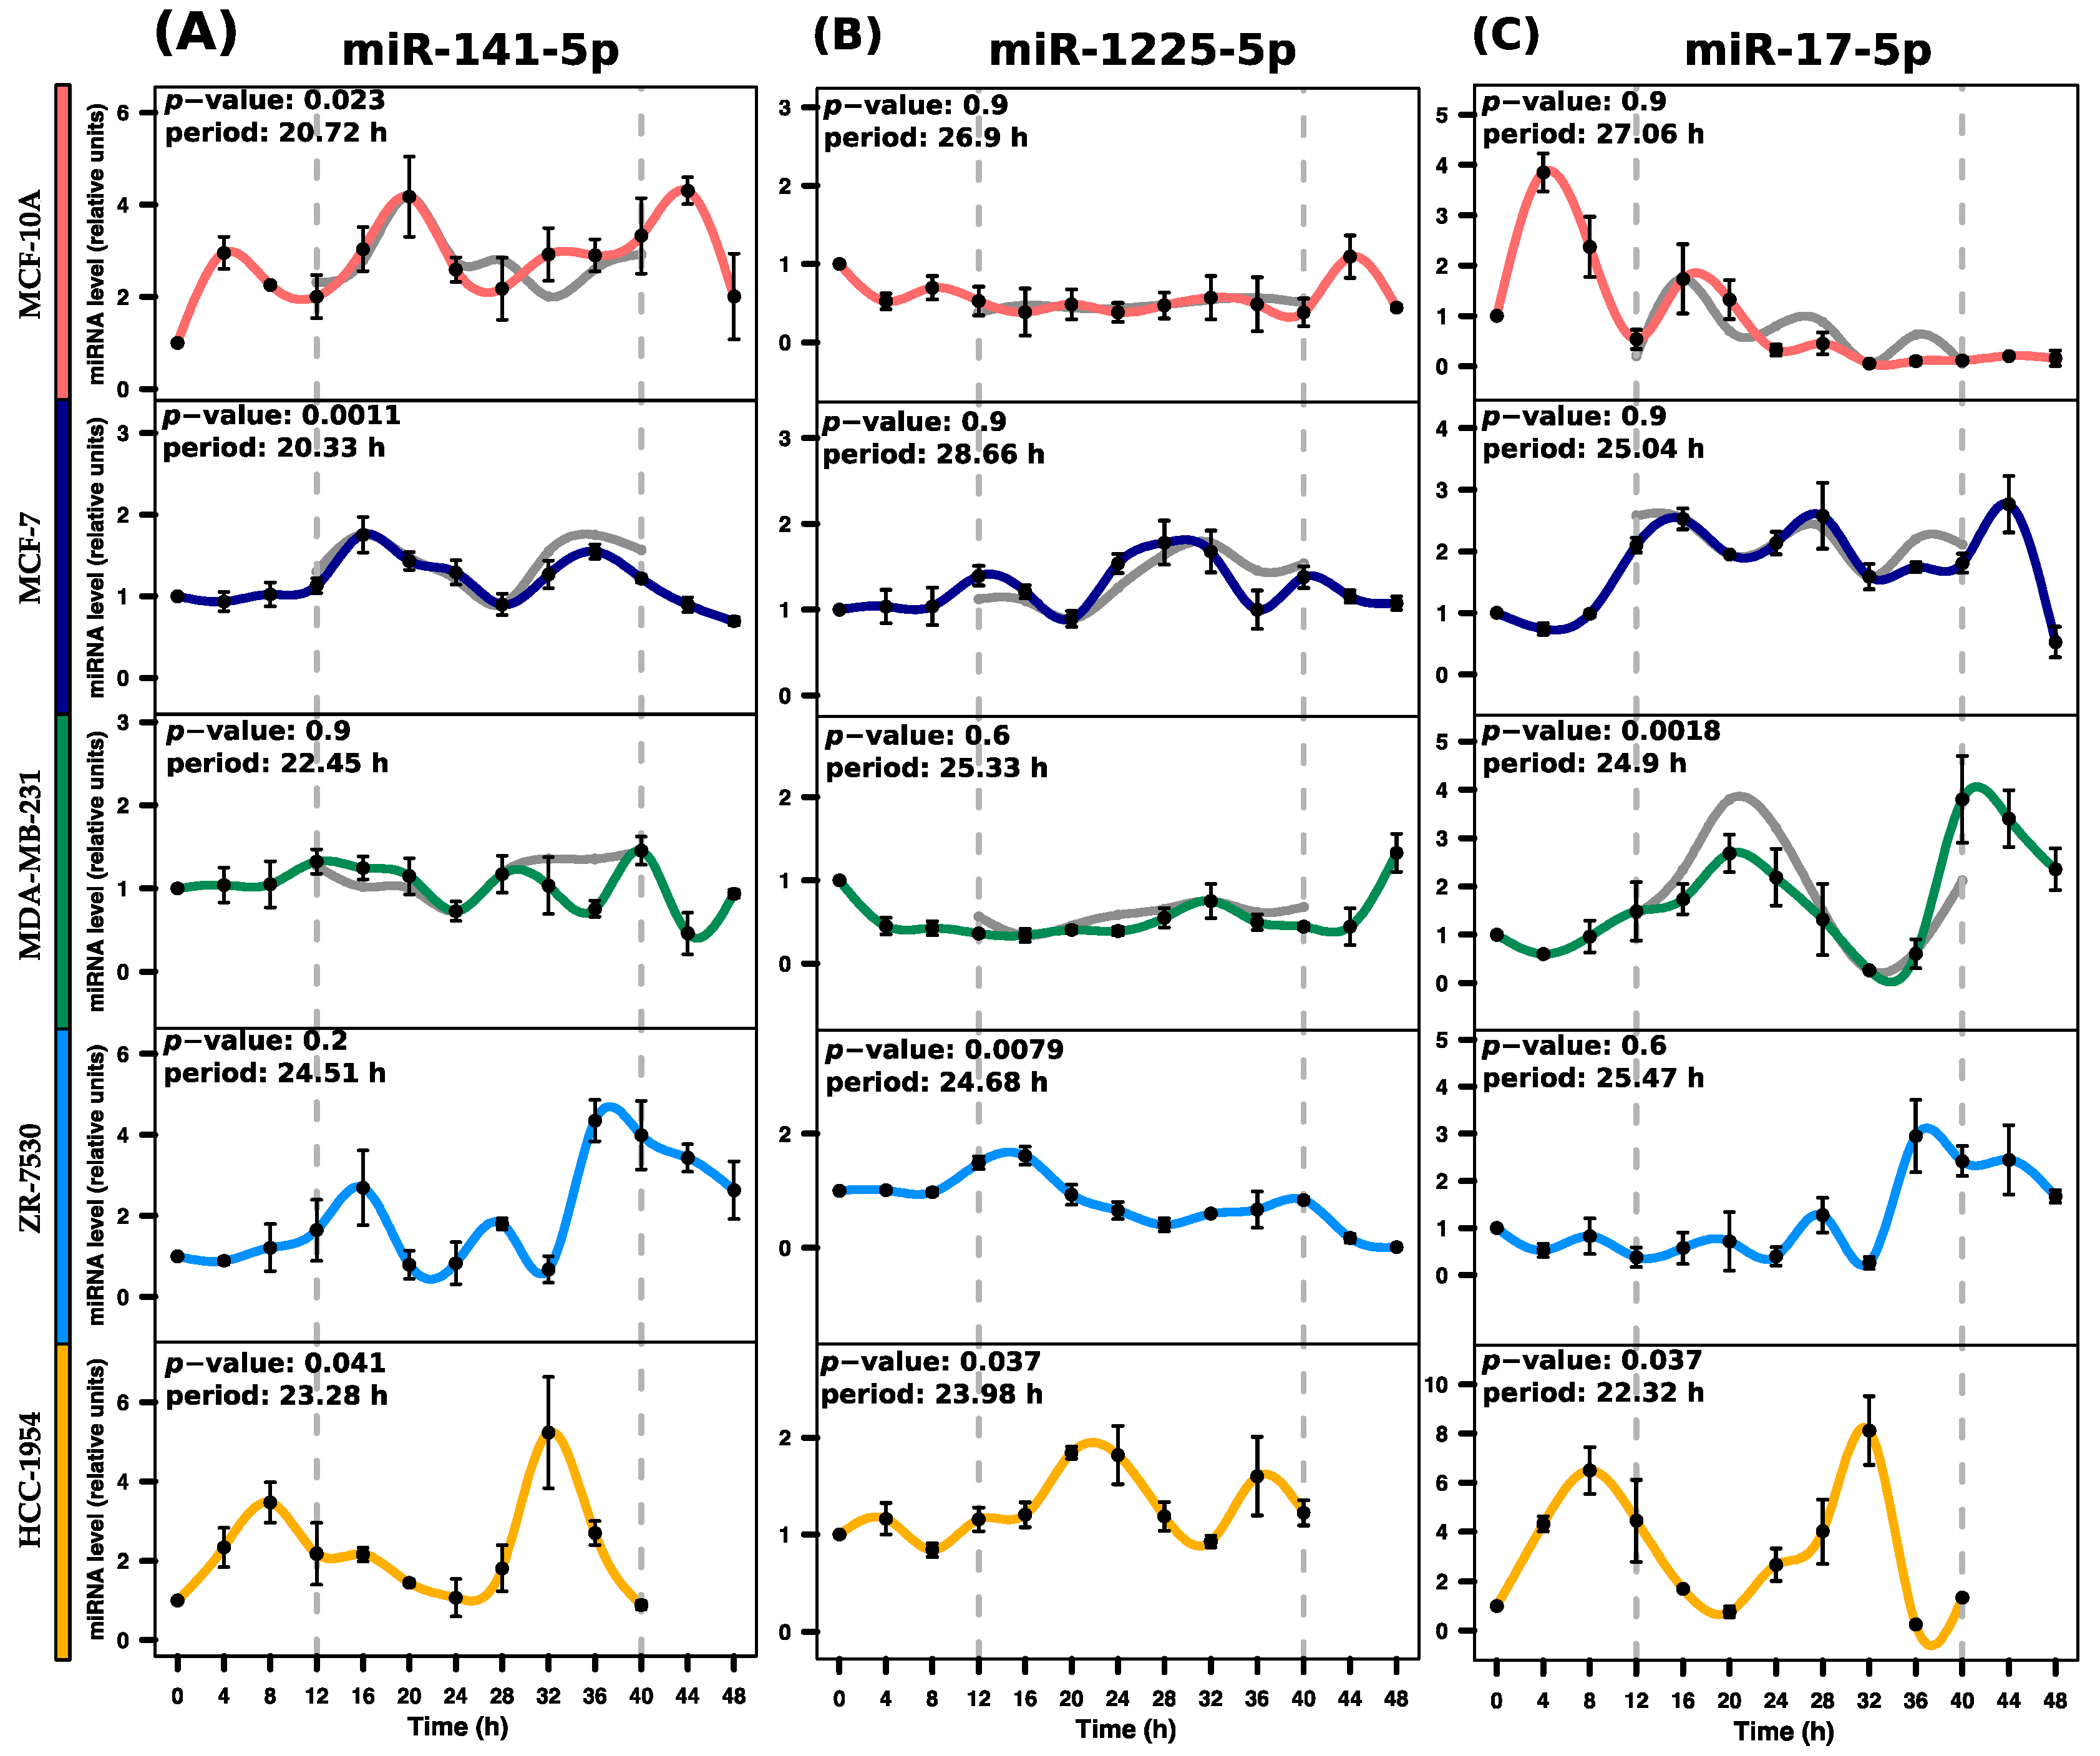
2.3. Determination of miRNAs with Rhythmic Expression
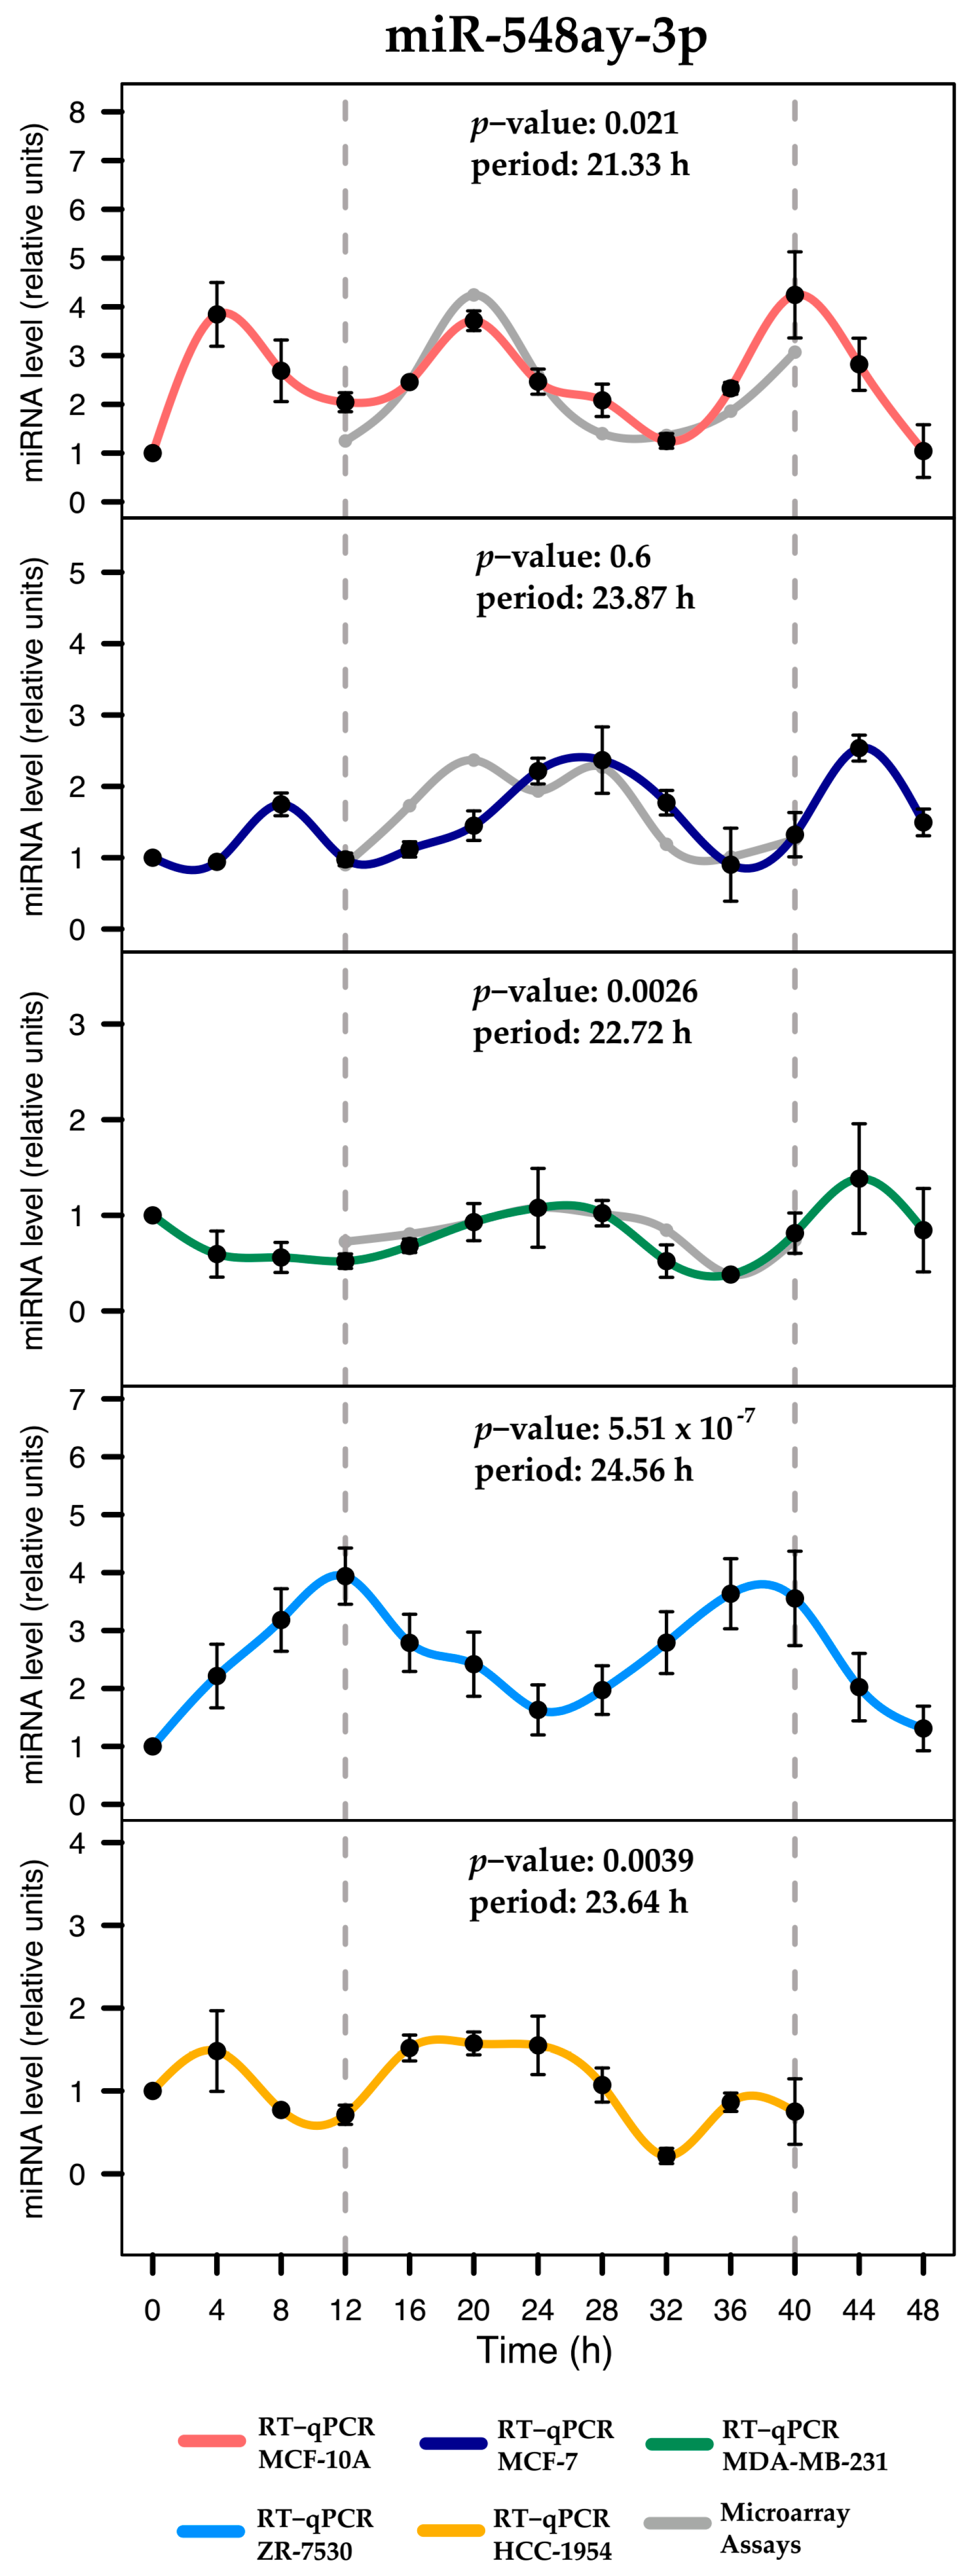
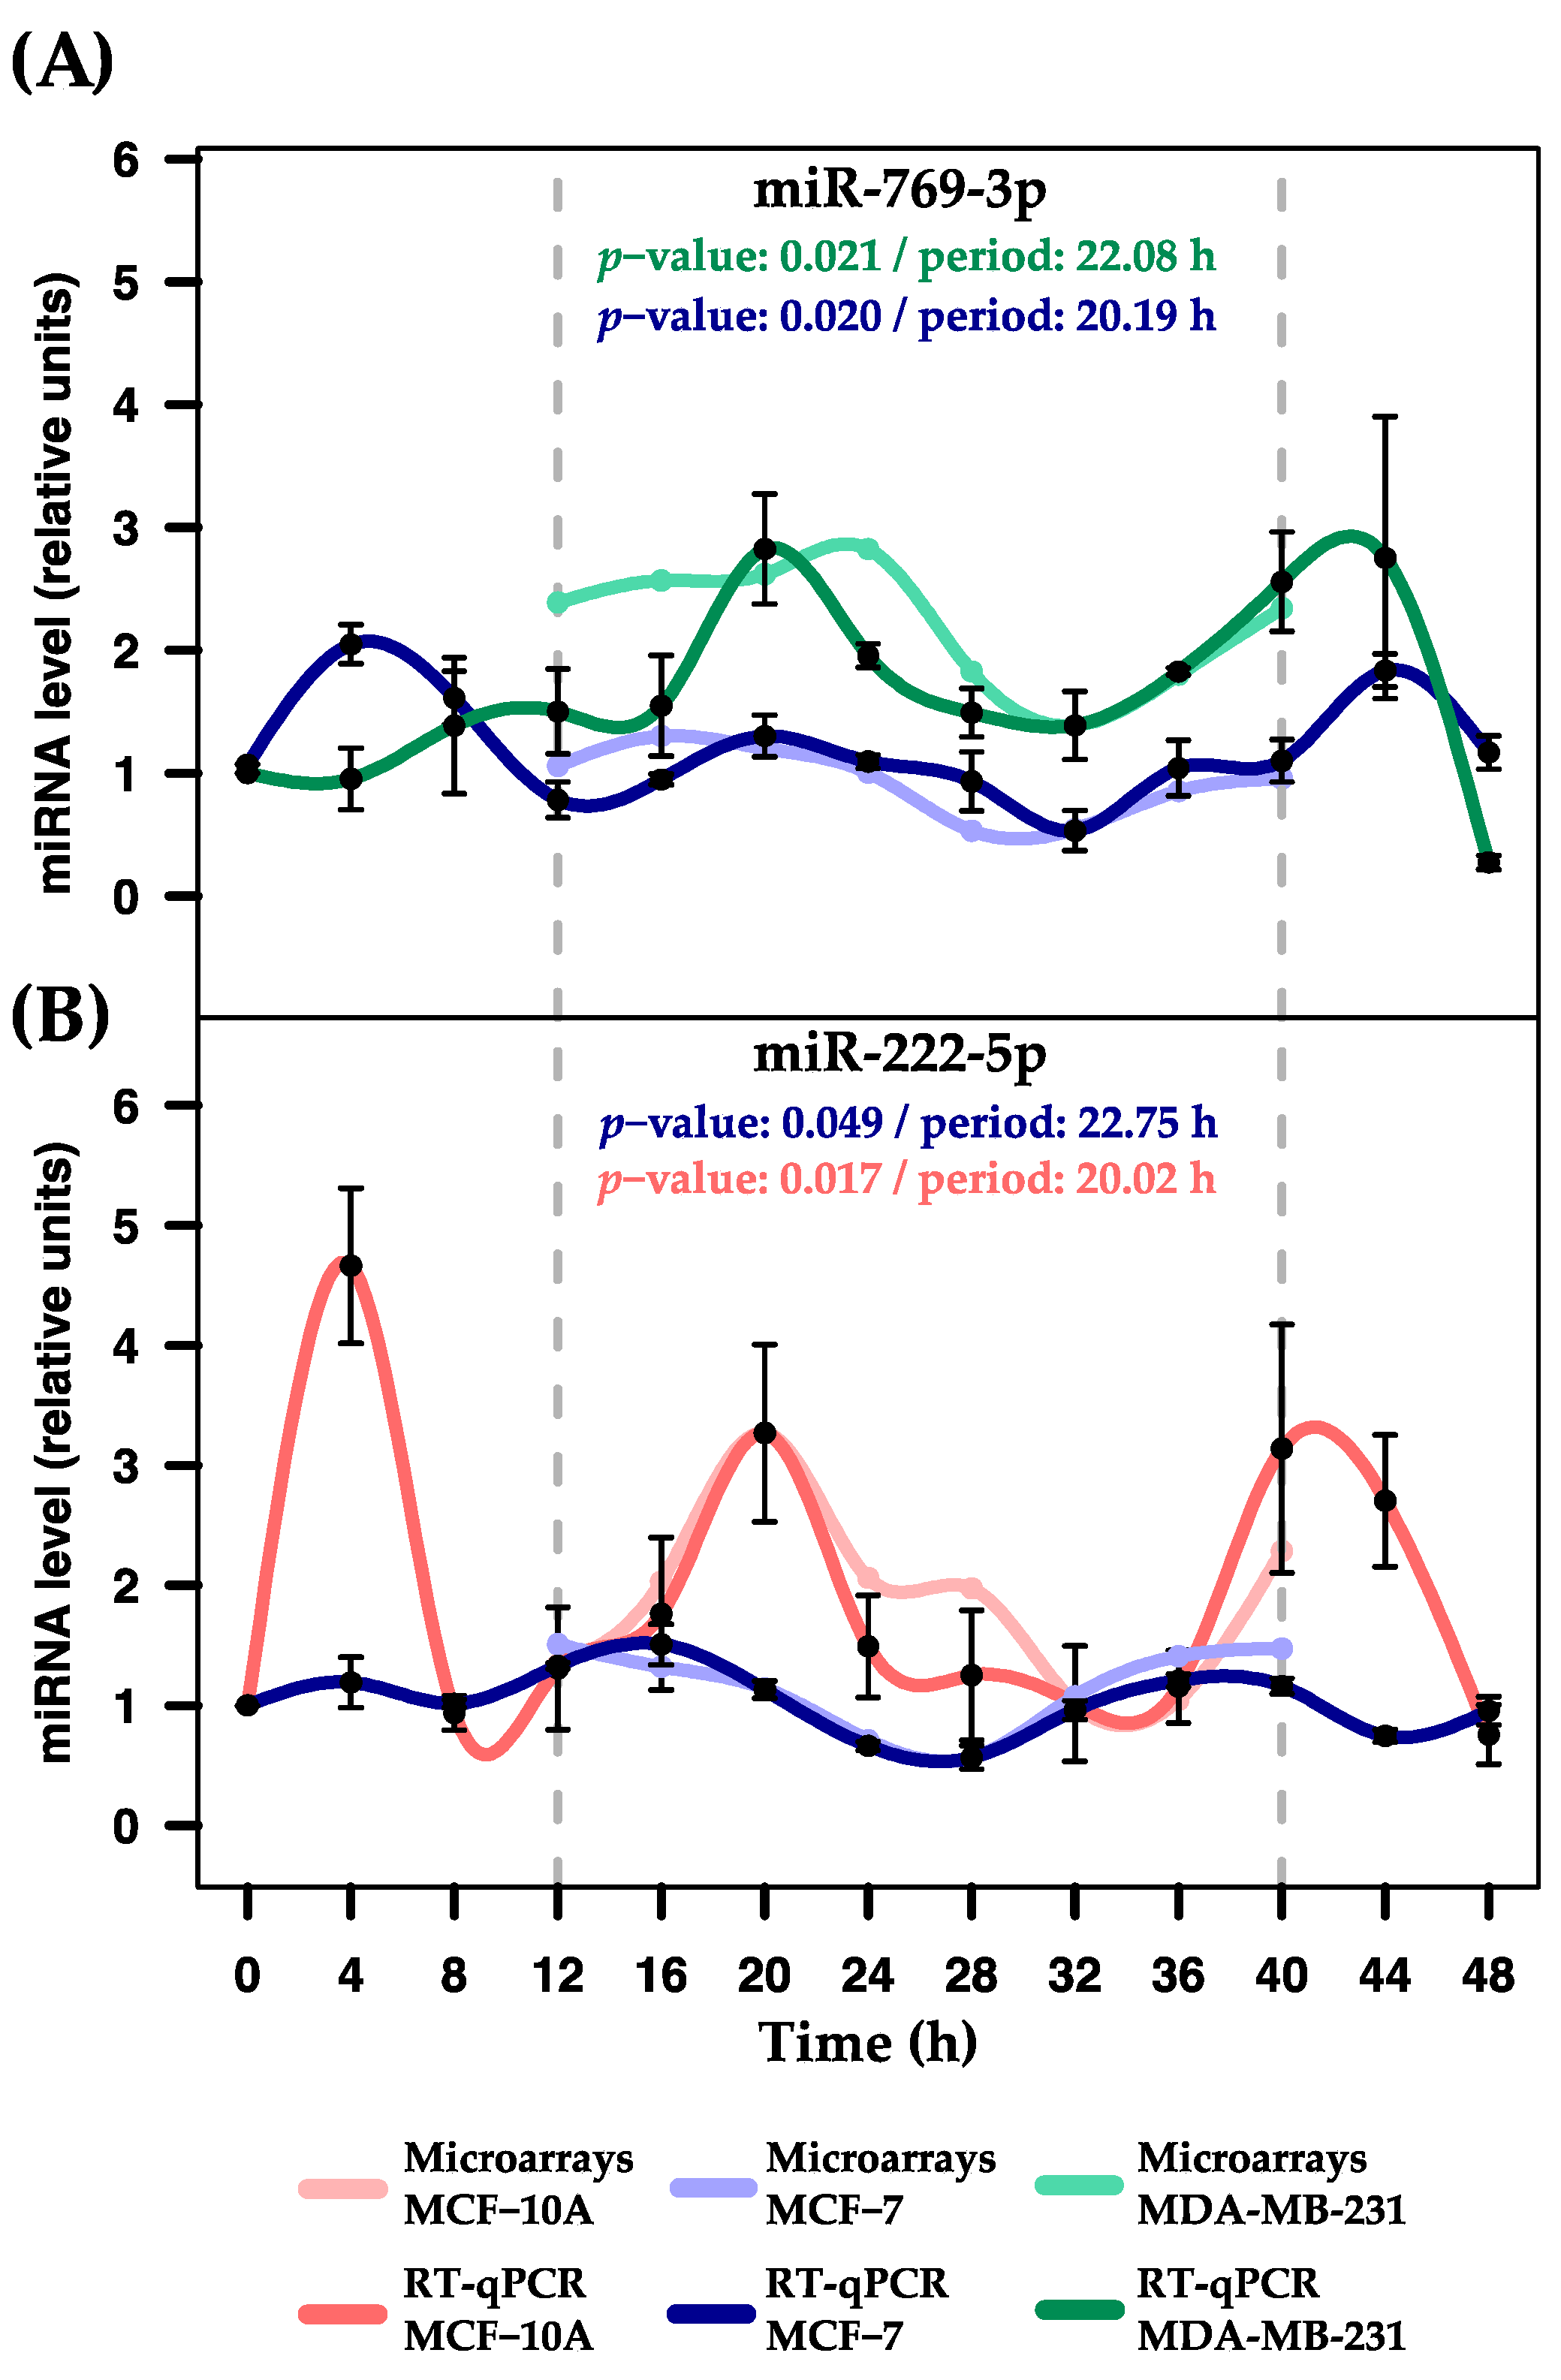
2.4. Validation of Rhythmic Expression Profiles Using RT-qPCR
2.5. Identification of the Target mRNAs in a Group of miRNAs
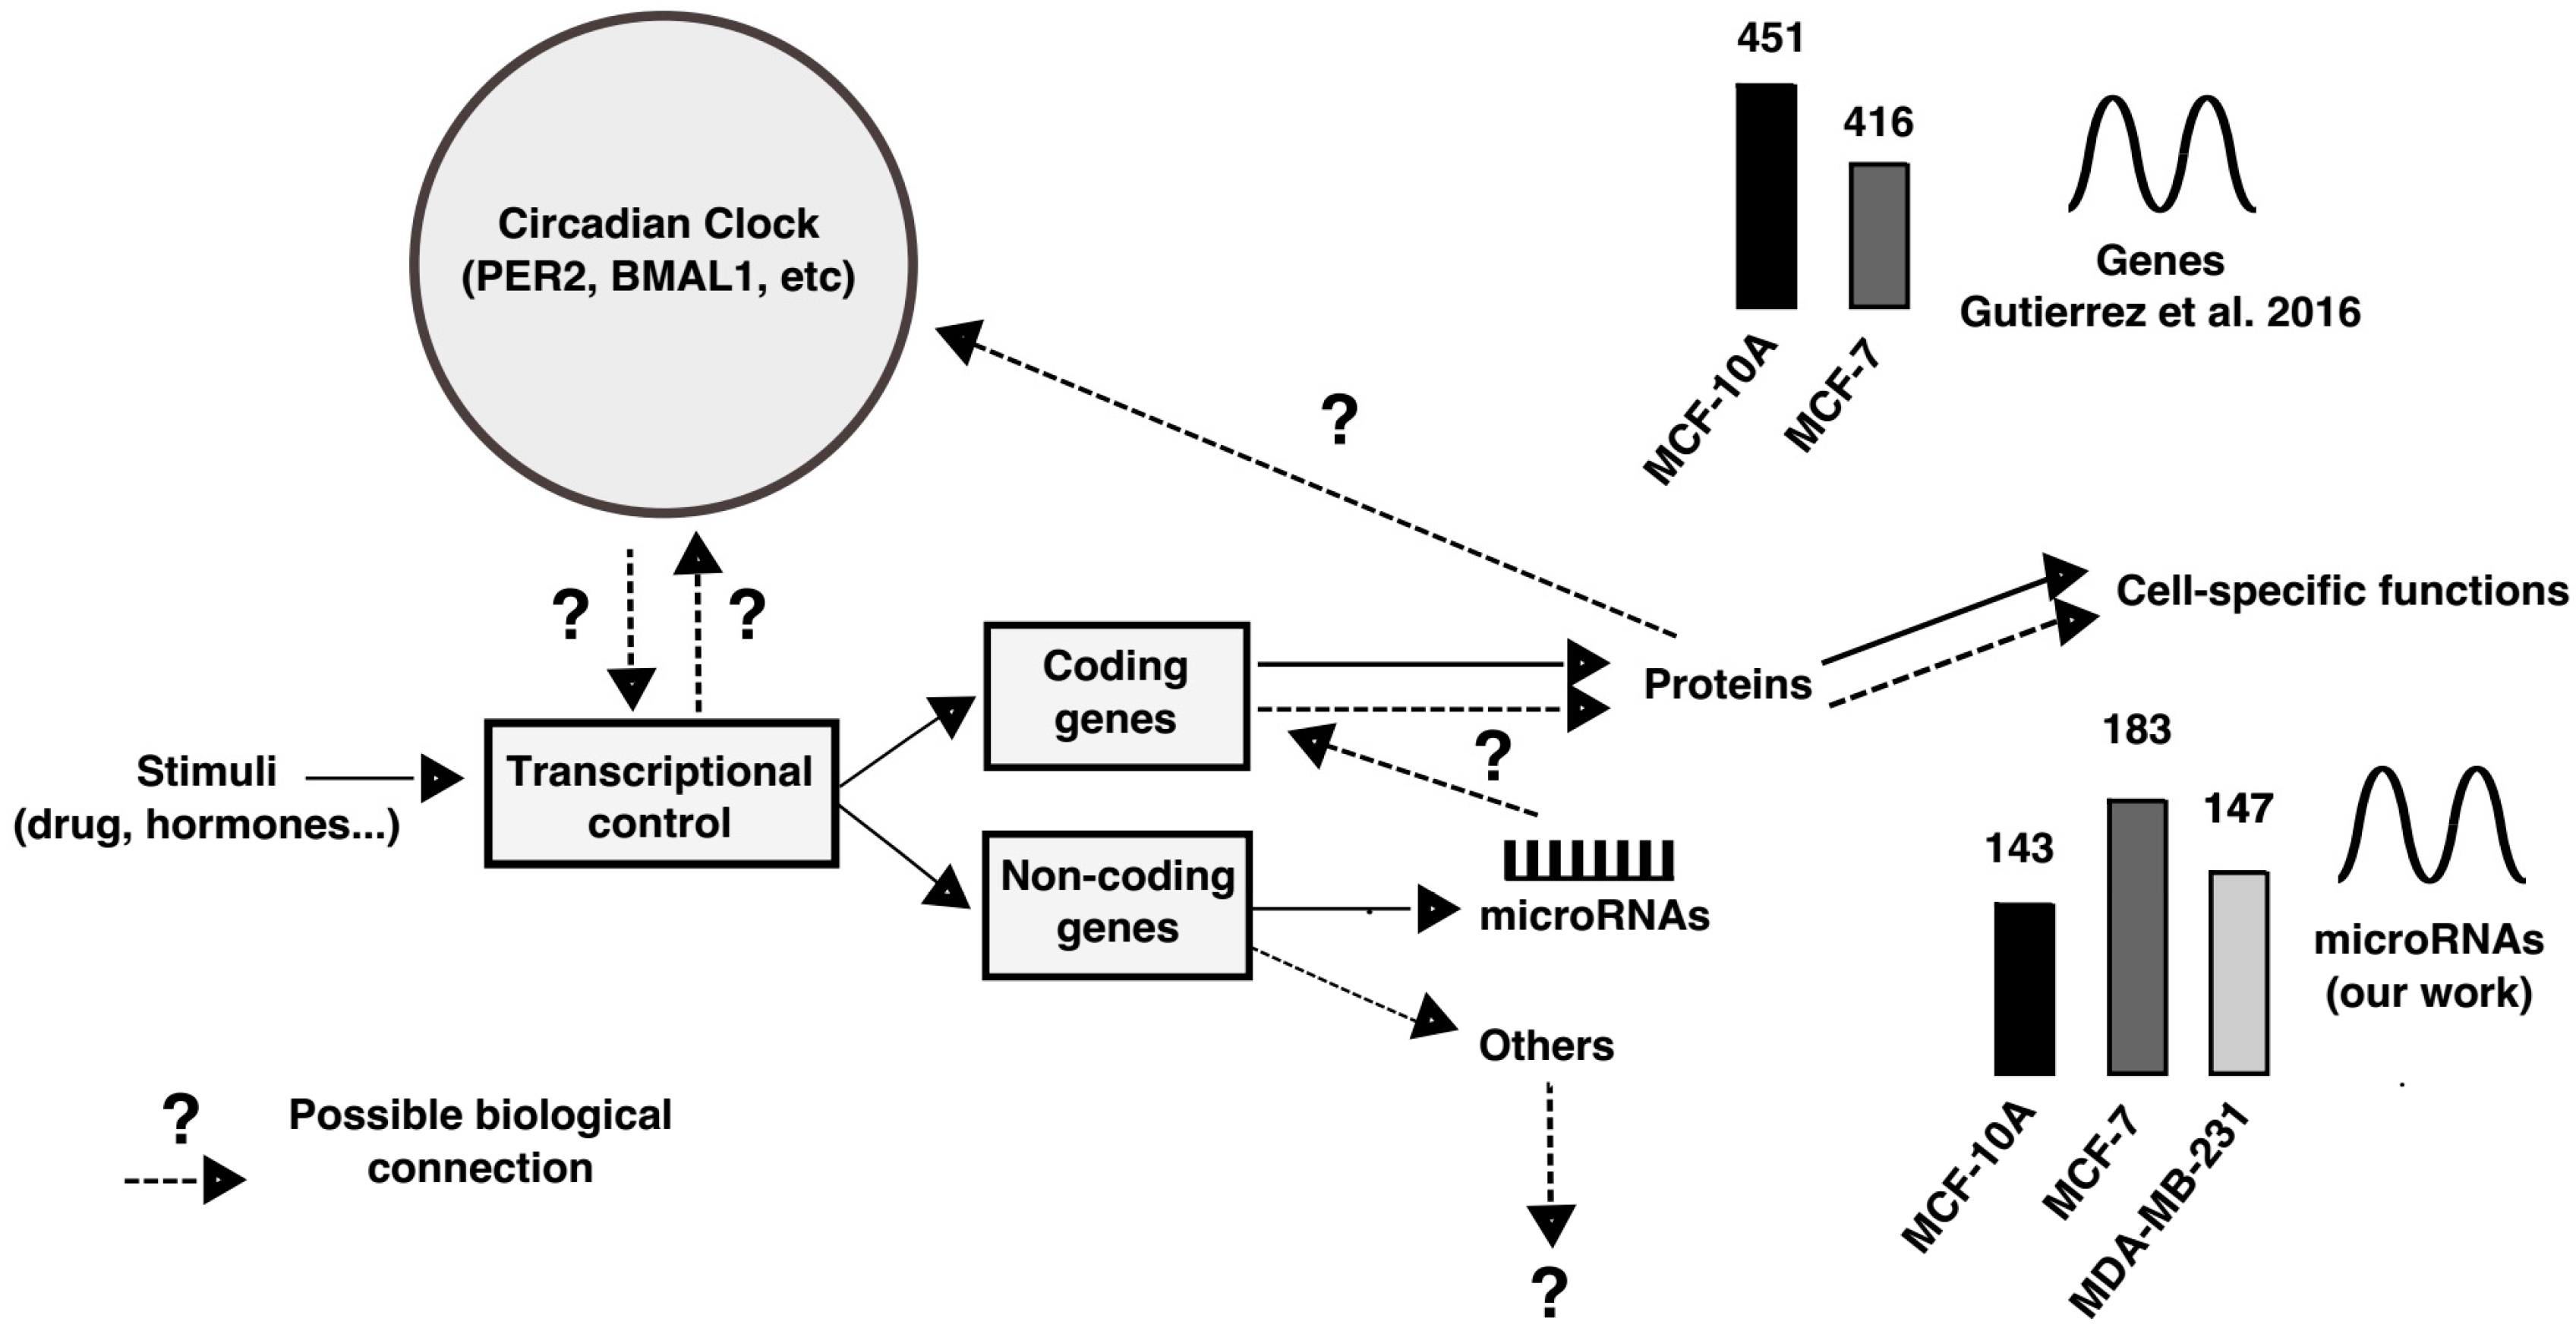
3. Discussion
4. Materials and Methods
4.1. Cell Lines and Culture Procedures
4.2. Serum Shock Synchronization
4.3. Total RNA Purification for mRNA and miRNA Expression
4.4. Quantitative RT-qPCR for mRNA Expression
4.5. Microarray Processing and Analysis
4.6. Identification of miRNAs with Rhythmic Expression
4.7. Quantitative RT-qPCR for miRNA Expression
4.8. Identification of Targeted mRNAs and Pathway Analysis
5. Conclusions
Supplementary Materials
Acknowledgments
Author Contributions
Conflicts of Interest
Abbreviations
| BMAL1 | also known arntl, aryl hydrocarbon receptor nuclear translocator like |
| PER2 | Period circadian clock 2 |
| SERPINB1 | Serpin family B member 1 |
| TL | Time-label |
| RW | Row-wise |
| CW | Column-wise |
| RCW | Row-column-wise |
| RCWB | Row-column-wise by blocks |
References
- Golombek, D.A.; Rosenstein, R.E. Physiology of circadian entrainment. Physiol. Rev. 2010, 90, 1063–1102. [Google Scholar] [CrossRef] [PubMed]
- Rana, S.; Mahmood, S. Circadian rhythm and its role in malignancy. J. Circadian Rhythm. 2010, 8, 1–13. [Google Scholar] [CrossRef] [PubMed]
- Garbarino-Pico, E.; Green, C.B. Posttranscriptional regulation of mammalian circadian clock output. Cold Spring Harb. 2007, 72, 145–156. [Google Scholar] [CrossRef] [PubMed]
- Buhr, E.D.; Takahashi, J.S. Molecular components of the Mammalian circadian clock. Handb. Exp. Pharmacol. 2013, 15, 3–27. [Google Scholar] [CrossRef]
- Bray, M.S.; Young, M.E. Circadian rhythms in the development of obesity: Potential role for the circadian clock within the adipocyte. Obes. Rev. 2007, 8, 169–181. [Google Scholar] [CrossRef] [PubMed]
- Leibetseder, V.; Humpeler, S.; Svoboda, M.; Schmid, D.; Thalhammer, T.; Zuckermann, A.; Marktl, W.; Ekmekcioglu, C. Clock genes display rhythmic expression in human hearts. Chronobiol. Int. 2009, 26, 621–636. [Google Scholar] [CrossRef] [PubMed]
- Gutierrez-Monreal, M.A.; Cuevas-Diaz, R.; Moreno-Cuevas, J.E.; Scott, S.P. A Role for 1α, 25-dihydroxyvitamin D3 in the expression of circadian genes. J. Biol. Rhythms 2014, 29, 384–388. [Google Scholar] [CrossRef] [PubMed]
- Harbour, V.L.; Weigl, Y.; Robinson, B.; Amir, S.; Brooks, A. Phase differences in expression of circadian clock genes in the central nucleus of the amygdala, dentate gyrus, and suprachiasmatic nucleus in the rat. PLoS ONE 2014, 9, e103309. [Google Scholar] [CrossRef] [PubMed]
- Xiang, S.; Mao, L.; Duplessis, T.; Yuan, L.; Dauchy, R.; Dauchy, E.; Blask, D.E.; Frasch, T.; Hill, S.M. Oscillation of clock and clock controlled genes induced by serum shock in human breast epithelial and breast cancer cells: Regulation by melatonin. Breast Cancer 2012, 6, 137–150. [Google Scholar] [CrossRef] [PubMed]
- Rossetti, S.; Esposito, J.; Corlazzoli, F.; Gregorski, A.; Sacchi, N. Entrainment of breast (cancer) epithelial cells detects distinct circadian oscillation patterns for clock and hormone receptor genes. Cell Cycle 2012, 11, 350–360. [Google Scholar] [CrossRef] [PubMed]
- Gutiérrez-Monreal, M.A.; Treviño, V.; Moreno-Cuevas, J.E.; Scott, S.-P. Identification of circadian-related gene expression profiles in entrained breast cancer cell lines. Chronobiol. Int. 2016, 33, 392–405. [Google Scholar] [CrossRef] [PubMed]
- Kojima, S.; Green, C.B. Circadian genomics reveal a role for post-transcriptional regulation in mammals. Biochemistry 2015, 54, 124–133. [Google Scholar] [CrossRef] [PubMed]
- He, L.; Hannon, G.J. MicroRNAs: Small RNAs with a big role in gene regulation. Nat. Rev. Genet. 2004, 5, 522–531. [Google Scholar] [CrossRef] [PubMed]
- Reddy, A.B.; Karp, N.A.; Maywood, E.S.; Sage, E.A.; Deery, M.; O’Neill, J.S.; Wong, G.K.Y.; Chesham, J.; Odell, M.; Lilley, K.S.; et al. Circadian orchestration of the hepatic proteome. Curr. Biol. 2006, 16, 1107–1115. [Google Scholar] [CrossRef] [PubMed]
- Lee, K.H.; Kim, S.H.; Lee, H.R.; Kim, W.; Kim, D.Y.; Shin, J.C.; Yoo, S.H.; Kim, K.T. MicroRNA-185 oscillation controls circadian amplitude of mouse cryptochrome 1 via translational regulation. Mol. Biol. Cell 2013, 24, 2248–2255. [Google Scholar] [CrossRef] [PubMed]
- Kinoshita, C.; Aoyama, K.; Matsumura, N.; Kikuchi-Utsumi, K.; Watabe, M.; Nakaki, T. Rhythmic oscillations of the microRNA miR-96-5p play a neuroprotective role by indirectly regulating glutathione levels. Nat. Commun. 2014, 5, 3823. [Google Scholar] [CrossRef] [PubMed]
- Balakrishnan, A.; Stearns, A.T.; Park, P.J.; Dreyfuss, J.M.; Ashley, S.W.; Rhoads, D.B.; Tavakkolizadeh, A. MicroRNA mir-16 is anti-proliferative in enterocytes and exhibits diurnal rhythmicity in intestinal crypts. Exp. Cell Res. 2010, 316, 3512–3521. [Google Scholar] [CrossRef] [PubMed]
- Du, N.-H.; Arpat, A.B.; Matos, M.; De Gatfield, D. MicroRNAs shape circadian hepatic gene expression on a transcriptome-wide scale. Elife 2014, 3, e02510. [Google Scholar] [CrossRef] [PubMed]
- Gotoh, T.; Vila-Caballer, M.; Liu, J.; Schiffhauer, S.; Finkielstein, C.V. Association of the circadian factor Period 2 to p53 influences p53’s function in DNA-damage signaling. Mol. Biol. Cell 2015, 26, 359–372. [Google Scholar] [CrossRef]
- Kochan, D.Z.; Ilnytskyy, Y.; Golubov, A.; Deibel, S.H.; McDonald, R.J.; Kovalchuk, O. Circadian disruption-induced microRNAome deregulation in rat mammary gland tissues. Oncoscience 2015, 2, 428–442. [Google Scholar] [CrossRef] [PubMed]
- Sempere, L.F.; Christensen, M.; Silahtaroglu, A.; Bak, M.; Heath, C.V.; Schwartz, G.; Wells, W.; Kauppinen, S.; Cole, C.N. Altered microrna expression confined to specific epithelial cell subpopulations in breast cancer. Cancer Res. 2007, 67, 11612–11620. [Google Scholar] [CrossRef] [PubMed]
- Mulrane, L.; McGee, S.F.; Gallagher, W.M.; O’Connor, D.P. miRNA dysregulation in breast cancer. Cancer Res. 2013, 73, 6554–6562. [Google Scholar] [CrossRef] [PubMed]
- Balsalobre, A.; Damiola, F.; Schibler, U.A. Serum shock induces circadian gene expression in mammalian tissue culture cells. Cell 1998, 93, 929–937. [Google Scholar] [CrossRef]
- Nagoshi, E.; Saini, C.; Bauer, C.; Laroche, T.; Naef, F.; Schibler, U. Circadian gene expression in individual fibroblasts: Cell-autonomous and self-sustained oscillators pass time to daughter cells. Cell 2004, 119, 693–705. [Google Scholar] [CrossRef] [PubMed]
- Futschik, M.E.; Herzel, H. Are we overestimating the number of cell-cycling genes? The impact of background models on time-series analysis. Bioinformatics 2008, 24, 1063–1069. [Google Scholar] [CrossRef] [PubMed]
- Kallio, A.; Vuokko, N.; Ojala, M.; Haiminen, N.; Mannila, H. Randomization techniques for assessing the significance of gene periodicity results. BMC Bioinform. 2011, 12, 330. [Google Scholar] [CrossRef] [PubMed]
- Wu, G.; Anafi, R.C.; Hughes, M.E.; Kornacker, K.; Hogenesch, J.B. MetaCycle: An integrated R package to evaluate periodicity in large scale data. Bioinformatics 2016, 32, 3351–3353. [Google Scholar] [CrossRef] [PubMed]
- Ru, Y.; Kechris, K.J.; Tabakoff, B.; Hoffman, P.; Radcliffe, R.A.; Bowler, R.; Mahaffey, S.; Rossi, S.; Calin, G.A.; Bemis, L.; Theodorescu, D. The multiMiR R package and database: Integration of microRNA–target interactions along with their disease and drug associations. Nucleic Acids Res. 2014, 42, 133. [Google Scholar] [CrossRef] [PubMed]
- Sahar, S.; Sassone-Corsi, P. Metabolism and cancer: The circadian clock connection. Nat. Rev. Cancer 2009, 9, 886–896. [Google Scholar] [CrossRef] [PubMed]
- Xu, H.; Gustafson, C.L.; Sammons, P.J.; Khan, S.K.; Parsley, N.C.; Ramanathan, C.; Lee, H.W.; Liu, A.C.; Partch, C.L. Cryptochrome 1 regulates the circadian clock through dynamic interactions with the BMAL1 C terminus. Nat. Struct. Mol. Biol. 2015, 22, 476–484. [Google Scholar] [CrossRef] [PubMed]
- Chen, R.; Schirmer, A.; Lee, Y.; Lee, H.; Kumar, V.; Yoo, S.H.; Takahashi, J.S.; Lee, C. Rhythmic PER abundance defines a critical nodal point for negative feedback within the circadian clock mechanism. Mol. Cell 2009, 36, 417–430. [Google Scholar] [CrossRef] [PubMed]
- Hausser, J.; Zavolan, M. Identification and consequences of miRNA-target interactions—Beyond repression of gene expression. Nat. Rev. Genet. 2014, 15, 599–612. [Google Scholar] [CrossRef] [PubMed]
- Savvidis, C.; Koutsilieris, M. Circadian rhythm disruption in cancer biology. Mol. Med. 2012, 18, 1249–1260. [Google Scholar] [CrossRef] [PubMed]
- Na, Y.J.; Sung, J.H.; Lee, S.C.; Lee, Y.J.; Choi, Y.J.; Park, W.Y.; Shin, H.S.; Kim, J.H. Comprehensive analysis of microRNA-mRNA co-expression in circadian rhythm. Exp. Mol. Med. 2009, 41, 638–647. [Google Scholar] [CrossRef] [PubMed]
- Kim, D.H.; Grün, D.; van Oudenaarden, A. Dampening of expression oscillations by synchronous regulation of a microRNA and its target. Nat. Genet. 2013, 45, 1337–1344. [Google Scholar] [CrossRef] [PubMed]
- Chen, B.; Zhang, B.; Luo, H.; Yuan, J.; Skogerbø, G.; Chen, R. Distinct MicroRNA Subcellular Size and Expression Patterns in Human Cancer Cells. Int. J. Cell Biol. 2012, 2012. [Google Scholar] [CrossRef] [PubMed]
- Huisman, S.A.; Oklejewicz, M.; Ahmadi, A.R.; Tamanini, F.; Ijzermans, J.N.M.; van der Horst, G.T.J.; de Bruin, R.W.F. Colorectal liver metastases with a disrupted circadian rhythm phase shift the peripheral clock in liver and kidney. Int. J. Cancer 2015, 136, 1024–1032. [Google Scholar] [CrossRef] [PubMed]
- Gery, S.; Virk, R.K.; Chumakov, K.; Yu, A.; Koeffler, H.P. The clock gene Per2 links the circadian system to the estrogen receptor. Oncogene 2007, 26, 7916–7920. [Google Scholar] [CrossRef] [PubMed]
- Menger, G.J.; Lu, K.; Thomas, T.; Cassone, V.M.; Earnest, D.J. Circadian profiling of the transcriptome in immortalized rat SCN cells. Physiol. Genom. 2005, 21, 370–381. [Google Scholar] [CrossRef] [PubMed]
- Yu, Z.; Willmarth, N.E.; Zhou, J.; Katiyar, S.; Wang, M.; Liu, Y.; McCue, P.A.; Quong, A.A.; Lisanti, M.P.; Pestell, R.G. microRNA 17/20 inhibits cellular invasion and tumor metastasis in breast cancer by heterotypic signaling. Proc. Natl. Acad. Sci. USA 2010, 107, 8231–8236. [Google Scholar] [CrossRef] [PubMed]
- Jin, L.; Lim, M.; Zhao, S.; Sano, Y.; Simone, B.A.; Savage, J.E.; Wickstrom, E.; Camphausen, K.; Pestell, R.G.; Simone, N.L. The metastatic potential of triple-negative breast cancer is decreased via caloric restriction-mediated reduction of the miR-17~92 cluster. Breast Cancer Res. Treat. 2014, 146, 41–50. [Google Scholar] [CrossRef] [PubMed]
- Gao, Q.; Zhou, L.; Yang, S.-Y.; Cao, J.-M. A novel role of microRNA 17-5p in the modulation of circadian rhythm. Sci. Rep. 2016, 6, 30070. [Google Scholar] [CrossRef] [PubMed]
- Castellano, L.; Giamas, G.; Jacob, J.; Coombes, R.C.; Lucchesi, W.; Thiruchelvam, P.; Barton, G.; Jiao, L.R.; Wait, R.; Waxman, J.; et al. The estrogen receptor-α-induced microRNA signature regulates itself and its transcriptional response. Proc. Natl. Acad. Sci. USA 2009, 106, 15732–15737. [Google Scholar] [CrossRef] [PubMed]
- Zhao, J.J.; Lin, J.; Yang, H.; Kong, W.; He, L.; Ma, X.; Coppola, D.; Cheng, J.Q. MicroRNA-221/222 negatively regulates estrogen receptorα and is associated with tamoxifen resistance in breast cancer. J. Biol. Chem. 2008, 283, 31079–31086. [Google Scholar] [CrossRef] [PubMed]
- Blattner, M.S.; Mahoney, M.M. Estrogen receptor 1 modulates circadian rhythms in adult female mice. Chronobiol. Int. 2014, 31, 637–644. [Google Scholar] [CrossRef] [PubMed]
- Joyce, C.E.; Zhou, X.; Xia, J.; Ryan, C.; Thrash, B.; Menter, A.; Zhang, W.; Bowcock, A.M. Deep sequencing of small RNAs from human skin reveals major alterations in the psoriasis miRNAome. Hum. Mol. Genet. 2011, 20, 4025–4040. [Google Scholar] [CrossRef] [PubMed]
- Takahashi, J.S. Transcriptional architecture of the mammalian circadian clock. Nat. Rev. Genet. 2016, 18, 164–179. [Google Scholar] [CrossRef] [PubMed]
- Livak, K.J.; Schmittgen, T.D. Analysis of relative gene expression data using real-time quantitative PCR and the 2(-Delta Delta C(T)) method. Methods 2001, 408, 402–408. [Google Scholar] [CrossRef] [PubMed]
- Izumo, M.; Sato, T.R.; Straume, M.; Johnson, C.H. Quantitative analyses of circadian gene expression in mammalian cell cultures. PLoS Comput. Biol. 2006, 2, e136. [Google Scholar] [CrossRef] [PubMed]
- Wang, H.; Ach, R.A.; Curry, B. Direct and sensitive miRNA profiling from low-input total RNA. RNA 2007, 13, 151–159. [Google Scholar] [CrossRef] [PubMed]
- Ritchie, M.E.; Silver, J.; Oshlack, A.; Holmes, M.; Diyagama, D.; Holloway, A.; Smyth, G.K. A comparison of background correction methods for two-colour microarrays. Bioinformatics 2007, 23, 2700–2707. [Google Scholar] [CrossRef] [PubMed]
- Smyth, G.K.; Speed, T. Normalization of cDNA microarray data. Methods 2003, 31, 265–273. [Google Scholar] [CrossRef]
- López-Romero, P.; González, M.A.; Callejas, S.; Dopazo, A.; Irizarry, R.A. Processing of Agilent microRNA array data. BMC Res. Notes 2010, 3, 18. [Google Scholar] [CrossRef] [PubMed]
- Chou, C.-C.; Chen, C.-H.; Lee, T.-T.; Peck, K. Optimization of probe length and the number of probes per gene for optimal microarray analysis of gene expression. Nucleic Acids Res. 2004, 32, e99. [Google Scholar] [CrossRef] [PubMed]
- Chen, C.; Ridzon, D.A.; Broomer, A.J.; Zhou, Z.; Lee, D.H.; Nguyen, J.T.; Barbisin, M.; Xu, N.L.; Mahuvakar, V.R.; Andersen, M.R.; et al. Real-time quantification of microRNAs by stem–loop RT–PCR. Nucleic Acids Res. 2005, 33, e179. [Google Scholar] [CrossRef] [PubMed]
- Mestdagh, P.; Feys, T.; Bernard, N.; Guenther, S.; Chen, C.; Speleman, F.; Vandesompele, J. High-throughput stem-loop RT-qPCR miRNA expression profiling using minute amounts of input RNA. Nucleic Acids Res. 2008, 36, e143. [Google Scholar] [CrossRef] [PubMed]
- Lao, K.; Xu, N.L.; Yeung, V.; Chen, C.; Livak, K.J.; Straus, N.A. Multiplexing RT-PCR for the detection of multiple miRNA species in small samples. Biochem. Biophys. Res. Commun. 2006, 343, 85–89. [Google Scholar] [CrossRef] [PubMed]
- Pezzolesi, M.G.; Satake, E.; McDonnell, K.P.; Major, M.; Smiles, A.M.; Krolewski, A.S. Circulating TGF-β1–regulated miRNAs and the risk of rapid progression to ESRD in type 1 diabetes. Diabetes 2015, 64, 3285–3293. [Google Scholar] [CrossRef] [PubMed]
- Fabregat, A.; Sidiropoulos, K.; Garapati, P.; Gillespie, M.; Hausmann, K.; Haw, R.; Jassal, B.; Jupe, S.; Korninger, F.; McKay, S.; et al. The reactome pathway knowledgebase. Nucleic Acids Res. 2016, 44, D481–D487. [Google Scholar] [CrossRef] [PubMed]


| miRNA | p-Value | Period (h) | Phase (h) | Amplitude |
|---|---|---|---|---|
| MCF-10A | ||||
| hsa-miR-141-5p | 0.0239 * | 20.72 | 19.97 | 2.3 |
| hsa-miR-1225-5p | 0.9901 | 26.91 | 9.12 | 0.71 |
| hsa-miR-17-5p | 0.9659 | 27.06 | 4.73 | 3.79 |
| hsa-miR-769-3p | 0.9439 | 25.33 | 6.79 | 1.95 |
| hsa-miR-222-5p | 0.0174 * | 20.02 | 0.40 | 3.91 |
| hsa-miR-548ay-3p | 0.0219 * | 21.33 | 20.56 | 3.2 |
| MCF-7 | ||||
| hsa-miR-141-5p | 0.0012 * | 20.34 | 17.88 | 1.06 |
| hsa-miR-1225-5p | 0.9526 | 28.67 | 1.53 | 0.89 |
| hsa-miR-17-5p | 0.9050 | 25.04 | 19.81 | 2.24 |
| hsa-miR-769-3p | 0.0205 * | 20.19 | 2.26 | 1.2 |
| hsa-miR-222-5p | 0.0492 * | 22.75 | 13.95 | 0.94 |
| hsa-miR-548ay-3p | 0.6690 | 23.87 | 1.99 | 1.63 |
| MDA-MB-231 | ||||
| hsa-miR-141-5p | 0.9372 | 22.46 | 13.76 | 0.99 |
| hsa-miR-1225-5p | 0.6841 | 25.33 | 4.72 | 0.99 |
| hsa-miR-17-5p | 0.0018 * | 24.90 | 20.16 | 3.53 |
| hsa-miR-769-3p | 0.0214 * | 22.09 | 19.90 | 2.55 |
| hsa-miR-222-5p | 0.7651 | 25.80 | 7.37 | 1.06 |
| hsa-miR-548ay-3p | 0.0027 * | 22.73 | 1.09 | 1 |
| ZR-7530 | ||||
| hsa-miR-141-5p | 0.2357 | 24.52 | 15.42 | 3.68 |
| hsa-miR-1225-5p | 0.0079 * | 24.69 | 13.19 | 1.6 |
| hsa-miR-17-5p | 0.6695 | 25.47 | 16.15 | 2.69 |
| hsa-miR-769-3p | 0.9661 | 28.67 | 14.22 | 1.76 |
| hsa-miR-222-5p | 0.1897 | 27.15 | 7.89 | 2.24 |
| hsa-miR-548ay-3p | 0.00001 * | 24.56 | 12.47 | 2.63 |
| HCC-1954 | ||||
| hsa-miR-141-5p | 0.0411 * | 23.28 | 9.51 | 4.35 |
| hsa-miR-1225-5p | 0.0373 * | 23.99 | 21.86 | 1 |
| hsa-miR-17-5p | 0.0380 * | 22.32 | 8.14 | 7.87 |
| hsa-miR-769-3p | 0.9610 | 21.33 | 18.46 | 4.65 |
| hsa-miR-222-5p | 0.9907 | 28.67 | 7.65 | 6.22 |
| hsa-miR-548ay-3p | 0.0040 * | 23.64 | 21.33 | 1.36 |
| Gene | Primer | Sequence (5′→3′) | NCBI RefSeq |
|---|---|---|---|
| BMAL1 | Forward | CATTGTGCACAGAAGCATCA | NM_001178.4 |
| Reverse | ACAAGGAAGAATAAACGGCTTT | ||
| PER2 | Forward | TGCCAAAATCTTACTCTGCTG | NM_022817.2 |
| Reverse | GGCATCACGTAAACAAATTCA | ||
| SERPINB1 | Forward | AGGTTCATTCAAGATTCCAGAGT | NM_030666.3 70 |
| Reverse | AGTTTCAGAATATAAGACGCTCCA | ||
| GAPDH | Forward | AGCCACATCGCTCAGACAC | NM_002046.4 |
| Reverse | TGGCAACAATATCCACTTTACCAGA |
| miRNA | Primer | Sequence (5′→3′) | Mature Accession Number |
|---|---|---|---|
| hsa-miR-141-5p | Stem-loop | GTC GTA TCC AGT GCA GGG TCC GAG GTA TTC GCA CTG GAT ACG AC TCCAAC | MIMAT0004598 |
| Forward | CAC GCA CAT CTT CCA GTA C | ||
| hsa-miR-1225-5p | Stem-loop | GTC GTA TCC AGT GCA GGG TCC GAG GTA TTC GCA CTG GAT ACG AC CCCCCC | MIMAT0005572 |
| Forward | CAACAGTGGGTACGGCCCA | ||
| hsa-miR-17-5p | Stem-loop | GTC GTA TCC AGT GCA GGG TCC GAG GTA TTC GCA CTG GAT ACG AC CTACCT | MIMAT0000070 |
| Forward | CAC GCA CAA AGT GCT TAC A | ||
| hsa-miR-769-3p | Stem-loop | GTC GTA TCC AGT GCA GGG TCC GAG GTA TTC GCA CTG GAT ACG AC AACCAA | MIMAT0003887 |
| Forward | CAA CAC TGG GAT CTC CGG | ||
| hsa-miR-222-5p | Stem-loop | GTC GTA TCC AGT GCA GGG TCC GAG GTA TTC GCA CTG GAT ACG AC AGGATC | MIMAT0004569 |
| Forward | CAG CAC TCA GTA GCC AGT | ||
| hsa-miR-548ay-3p | Stem-loop | GTC GTA TCC AGT GCA GGG TCC GAG GTA TTC GCA CTG GAT ACG AC TGCAAG | MIMAT0025453 |
| Forward | CAG CAC AAA ACC GCG AT | ||
| hsa-miR-106a-5p | Stem-loop | GTC GTA TCC AGT GCA GGG TCC GAG GTA TTC GCA CTG GAT ACG AC GCTACC | MIMAT0000103 |
| Forward | CAC GCA AAAAGTGCTTACAGT | ||
| Universal | TCG TA TCC AGT GCA GGG T |
© 2017 by the authors. Licensee MDPI, Basel, Switzerland. This article is an open access article distributed under the terms and conditions of the Creative Commons Attribution (CC BY) license (http://creativecommons.org/licenses/by/4.0/).
Share and Cite
Chacolla-Huaringa, R.; Moreno-Cuevas, J.; Trevino, V.; Scott, S.-P. Entrainment of Breast Cell Lines Results in Rhythmic Fluctuations of MicroRNAs. Int. J. Mol. Sci. 2017, 18, 1499. https://doi.org/10.3390/ijms18071499
Chacolla-Huaringa R, Moreno-Cuevas J, Trevino V, Scott S-P. Entrainment of Breast Cell Lines Results in Rhythmic Fluctuations of MicroRNAs. International Journal of Molecular Sciences. 2017; 18(7):1499. https://doi.org/10.3390/ijms18071499
Chicago/Turabian StyleChacolla-Huaringa, Rafael, Jorge Moreno-Cuevas, Victor Trevino, and Sean-Patrick Scott. 2017. "Entrainment of Breast Cell Lines Results in Rhythmic Fluctuations of MicroRNAs" International Journal of Molecular Sciences 18, no. 7: 1499. https://doi.org/10.3390/ijms18071499
APA StyleChacolla-Huaringa, R., Moreno-Cuevas, J., Trevino, V., & Scott, S.-P. (2017). Entrainment of Breast Cell Lines Results in Rhythmic Fluctuations of MicroRNAs. International Journal of Molecular Sciences, 18(7), 1499. https://doi.org/10.3390/ijms18071499