Abstract
During this phytochemical study, 13 compounds from the bark of Salix cinerea L. were isolated and their structures elucidated. These included two salicylic alcohol derivatives, one flavonol, two phenylpropanoids, two flavan-3-ols, two dimeric procyanidins, two dimeric prodelphinidins, and a unique ester of catechin (3-O-(1-hydroxy-6-oxo-2-cyclohexen-1-carboxylic acid), HCH-catechin). Furthermore, seasonal variations in the composition of Salix cortex regarding proanthocyanidins (PA) and the degree of polymerization were examined using NMR spectroscopy, revealing an increase in polymerization throughout the growing season 2020 associated with a consistent hydroxylation pattern in the B-ring. The isolated HCH-catechin was tested in vitro for its inhibitory effect on TNF-α-induced ICAM-1 expression in human microvascular endothelial cells (HMEC-1). A 24 h treatment with a 25 µM solution of HCH-catechin significantly reduced ICAM-1 expression (83.7 ± 3.2%) compared to unsubstituted catechin (97.9 ± 4.4%). Additionally, during a mass-spectrometric screening, numerous HCH adducts within the PA fraction could be identified, allowing for the proposition of a characteristic fragmentation pattern. This study establishes a foundation for a comprehensive assessment of the phenolic, PA-rich fraction in willow bark, particularly the occurrence of HCH adducts, which may contribute to the medicinal properties of Salicis cortex. Findings on seasonal variations and mass spectrometric profiling offer new insights into the quality standards for Salicis cortex as a medicinal remedy.
1. Introduction
Willows (Salix spp.) fulfill unique ecological roles as early successional species in a huge variety of terrestrial habitats reaching from shorelines to the nival stage of mountains. They are used in landscaping and ecological restoration, including riverbank stabilization, and certain species are cultivated for basketry and biomass production [1,2,3]. The medicinal use of willow bark dates to ancient times. Historical records document its use in Egyptian medicine, in early Chinese medicine (over 2000 years ago), and by Hippocrates in Greece (460–370 BCE) for fever and pain relief [4]. Modern scientific interest began in the 18th century when the pharmacological efficacy of willow bark was systematically studied [5], leading to the isolation of pharmacologically active compounds like salicin [6]. Subsequently, the synthesis of salicylic acid by Kolbe and Schmitt followed by the acetylation process paved the way for industrial production of acetylsalicylic acid (ASS), branded as Aspirin® by Bayer in 1899 [4,7]. Although willow bark’s medical relevance declined with the increasing use of synthetic ASS, it regained attention in the late 20th century as a standardized phytomedicinal product [7]. Monographs from ESCOP, HMPC, and WHO specify its use for mild back pain and temporary relief of muscle and joint aches [8,9]. The European Pharmacopoeia defines Salicis cortex (willow bark) as the whole or cut, dried bark of young branches or stems from various Salix species, with a minimum requirement of 1.5% total salicylic alcohol derivatives, calculated as salicin [8]. Besides these, willow bark contains diverse secondary metabolites, including flavones, flavonols, chalcones, and proanthocyanidins [10]. Proanthocyanidins are the major tannins in willow bark and potentially contribute to the pharmacological efficacy [11].
Clinical studies confirm the analgesic effects of willow bark, particularly for lower back pain [12,13]. Derivatives of salicylic alcohol and their metabolite salicylic acid are regarded as primarily responsible for its therapeutic effects [14,15]. However, polyphenolic and proanthocyanidin-rich fractions also appear to contribute, possibly through anti-inflammatory activity [11]. Other studies highlight potential antimicrobial, antiviral, and hepatoprotective properties, though further in vivo tests and clinical validation is required [16,17]. Due to the variability in the composition of secondary metabolites across different Salix species and applied extraction methods, ongoing research into the bioactive profile of willow bark remains crucial for quality standardization [18].
This study aims to characterize the phenolic constituents of Salix cinerea, focusing on isolation and identification of salicylic alcohol derivatives, phenolic glycosides, flavan-3-ols, proanthocyanidins, and HCH adducts (1-hydroxy-6-oxo-2-cyclohexen-1-carboxylic acid-esters). Seasonal effects on the degree of polymerization of proanthocyanidins are examined via NMR. Furthermore, the activity and stability of isolated HCH-catechin is compared with unsubstituted catechin in an ICAM-1 in vitro assay to better understand its pharmacological role in Salicis cortex. In addition, a mass-spectrometric screening is performed to identify HCH adducts in the tannin fraction of S. cinerea, with the goal of proposing a fragmentation pattern and identifying related structures.
2. Results
2.1. Isolation of Phenolic Constituents from the Bark of Salix cinerea
Salicis cortex, harvested from a single Salix cinerea L. individuum at the beginning (June), climax (August), and end of the growing season (October), was extracted by methanol and the extract separated chromatographically. In a first step, open-column separation on Sephadex®-LH20 was performed, and under TLC control, up to 16 fractions plus a final fraction containing mainly polymer proanthocyanidins (pPAs) were isolated. The pPA-enriched fractions were characterized by 1H-NMR spectroscopy to determine the degree of polymerization of proanthocyanidins and the ratio of different hydroxylation patterns of the flavan-3-ol monomers. Furthermore, the ratio of 2,3-cis to 2,3-trans configuration of the compounds depending on the harvesting time was examined.
The Sephadex®-LH20 fractions of one harvest (August) were further separated for targeted isolation of phenolic constituents. Fraction SdII2 was separated by preparative HPLC in the reverse phase, leading to components 1–5. Four other fractions were subjected to MPLC on MCI-gel® (CHP-20P) to isolate compounds 8, 10, 11, and 13. Preparative HPLC (reversed phase) of four MPLC fractions was used for isolation of compounds 6, 7, 9, and 12. All structures are represented in Figure S8, and a sample TLC of the Sephadex®-LH20 fractionation is presented in Figure S9.
Structure elucidation was achieved by acquisition of UHPLC-HRESIMS, one dimensional 1H- and 13C-NMR and two-dimensional NMR experiments (HSQC, HMBC, COSY, and NOESY). Further spectroscopic data (UV, Polarimetry and CD) were collected for each compound. Isolated compounds were identified as salicin (1) [19,20], salicortin (2) [19,20], picein (3) [19,21,22], triandrin (4) [23,24], and vimalin (5) [25,26,27]. The obtained compounds 6, 7 and 8 were identified as the flavan-3-ols (+)-gallocatechin (6) [28,29,30], (+)-catechin (7) [30,31,32], and (+) dihydromyricetin (ampelopsin, 8) [33,34,35]. Compound 9 was identified as catechin-3-O-(1-hydroxy-6-oxo-2-cyclohexen-1-carboxylic acid) ester (HCH-catechin), with spectral data matching previous reports [36,37]. Also, the two dimeric procyanidins B1 (10) and B3 (11) [37,38,39,40,41,42] as well as two dimeric prodelphinidins (gallocatechin-(4α→8)-catechin (12) [29,43,44] and gallocatechin-(4α→8)-gallocatechin (13) [34,45]) could be obtained by chromatographic separation and identified by spectroscopy experiments.
These isolates show the diversity of phenolic compounds in Salix cinerea.
2.2. NMR Analysis of Polymeric Proanthocyanidin Fractions (pPA) Throughout the Year
For the characterization of pPA-enriched fractions, the degree of polymerization of pPAs, the ratio of dehydroxylated catechin-like flavan-3-ols (diHO-F3ols) to trihydroxylated gallocatechin-like flavan-3-ol monomers (triHO-F3ols), and the ratio of 2,3-cis to 2,3-trans configuration of monomers were analyzed.
The mean degree of polymerization (mDP) was calculated by comparing the integrals of signals representing the C-3 atoms in extending chain units (“L”) and terminal units (“M”), as shown in Figure 1 and Figure 2. In June, the mDP of the pPA fraction was determined to be 7, with terminal units constituting 14% of the total flavan-3-ol units. By August, the mDP increased to 9 (11% terminal units). The trend continued into October, when the mDP reached 11 with terminal units contributing only 10%.

Figure 1.
13C NMR spectra of three pPA-enriched fractions from Salix cinerea collected at three different harvest times (June: black, August: red, October: blue), recorded at 100 MHz in MeOD-d4 with 24k–30k scans. Assignments include: A: C-5/C-7/C-8a; B: C-3′/C-4′ (procyanidin units, diHO-Fl3ol) and C-3′/C-5′ (prodelphinidin units, triHO-Fl3ol); C: C-1′/C-4′ (triHO-Fl3ol); D: C-6′ (diHO-Fl3ol); E: C-2′/C-5′ (diHO-Fl3ol); F: C-8substituted and C-2′/C-6′ (triHO-Fl3ol); G: C-4a; H: C-6unsubstituted/C-8unsubstituted; I: C-2 of 2,3-trans chain units; J: C-2 of 2,3-trans terminal units; K: C-2 of 2,3-cis units; L: C-3 of chain units; M: C-3 of terminal units; N: C-4 in 2,3-trans-configured chain units; O: C-4 in 2,3-cis-configured chain units; P: C-4 of terminal units. Signals used for estimating the proportion of trihydroxylated flavan-3-ols are designated as Btri, Bdi, Ctri, Cdi, Ftri, and Fdi.
Figure 2.
Assignment of signals shown in Figure 1 to exemplary structure elements of proanthocyanidins ((left): prodelphinidin units (triHO-Fl3ol), (right): procyanidin units (diHO-Fl3ol)).
The relative proportions of 2,3-cis and 2,3-trans-configured flavan-3-ol units were assessed by comparison of integrals “I” and “J” to “K” as well as “N” to “O”. In June, 55% of the units were 2,3-cis, compared to 45% that were 2,3-trans-configured. This proportion shifted slightly in August and October, with 59% 2,3-cis and 41% 2,3-trans units at both samplings. The ratio of diHO-F3ols to triHO-F3ols monomers revealed a near-equal distribution, with a slight decline in trihydroxylated monomers (triHO-Fl3ols) during the growing season. In June, the ratio of triHO-F3ols to diHO-F3ols was 1.1 (53% triHO-F3ols). This was stable in August (1.1, again 53% triHO-F3ols) and decreased to 1.0 (50% triHO-F3ols) in October. These results are summarized in Table 1.

Table 1.
Mean degree of polymerization (mDP), relative proportion of 2,3-cis-configured flavan-3-ol units among total proanthocyanidin monomer units, and ratio of diHO-F3ols to triHO-F3ols by harvest month, calculated from the ratio of respective 13C-NMR signals.
Figure S1 (Supplementary Materials) highlights characteristic NMR signals for the pPA fraction (June) alongside prodelphinidin B3 (GC-(4α→8)-catechin), gallocatechin-(4α→8)-gallocatechin (GC-(4α→8)-GC), and procyanidin B1 (epicatechin-4β→8-catechin). This comparison confirmed the suitability of the assigned spectral regions for assessing hydroxylation patterns in the pPA fraction.
2.3. In Vitro Study by ICAM-1 and MTT Assay
In the ICAM-1 assay, HCH-catechin exhibited significant and concentration-dependent activity, whereas unsubstituted catechin showed no significant differences compared to the negative control (97.9 ± 4.4%). HCH-catechin was able to significantly reduce ICAM-1 expression at a concentration of 25 µM to 83.7 ± 3.2% (mean ± SD) compared to the negative control (TNF-α). Solutions with concentrations of 50 µM and 75 µM achieved highly significant reductions to 72.5 ± 7.3% and 54.7 ± 3.8%, respectively (mean ± SD) (Figure 3).
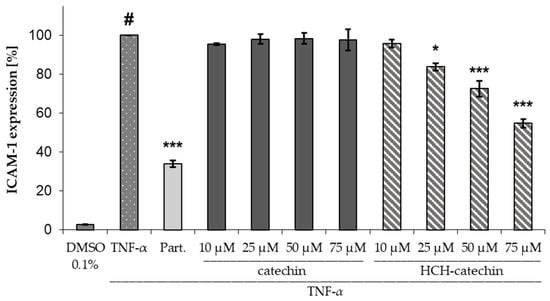
Figure 3.
Influence of catechin and HCH-catechin on ICAM-1 expression in HMEC-1 cells (DMSO 0.1%: untreated control; TNFα: TNFα (10 ng/mL) as negative control; Part.: parthenolide (5 µM) + TNF-α as positive control; substance concentrations ranging from 10–75 µM + TNFα; data presented as mean ± SD (n = 3); # p < 0.001 vs. untreated control; * p < 0.05, *** p < 0.001 vs. TNFα.
The stability of HCH-catechin was also investigated, given the known degradation of salicylic alcohol derivatives containing a 6-HCH moiety (e.g., salicortin and tremulacin) under cell culture conditions, as shown by Ruuhola et al. and Knuth et al. [46,47]. When incubating a 50 µM solution of HCH-catechin under ICAM-1 assay conditions and monitoring the concentration by UPLC®-PDA analysis, the compound’s concentration decreased by 71.3 ± 1.3% over 24 h, accompanied by a corresponding increase in the concentration of catechol to 11.7 ± 0.5 µM (Figure 4).
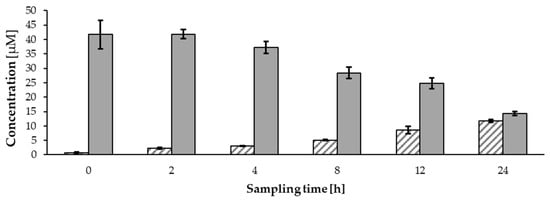
Figure 4.
Decrease in 50 µM HCH-catechin (plain grey) and increase in catechol (striped) after incubation under assay conditions (mean ± SD).
The cytotoxicity of HCH-catechin and unsubstituted catechin was evaluated using HMEC-1 cells across a concentration range of 10 to 75 µM, consistent with the methodology of Knuth et al. [47]. The results indicated no significant impact on cell viability for either compound within the tested range. Specifically, catechin showed viability levels between 94.9 ± 1.6% and 97.7 ± 3.5% (mean ± SD), while HCH-catechin exhibited slightly broader variability, with viability values ranging from 95.7 ± 2.4% to 106 ± 1.8% (mean ± SD), relative to the negative control (Figure S2).
2.4. Mass-Spectrometric Screening for HCH-PA Adducts
Initially, the Sephadex® fractions of the methanolic extract (October) were screened by LC-HRESI-MS for specific molecular masses associated with possible HCH adducts, encompassing combinations of mono- to trimeric proanthocyanidins combined with up to two HCH moieties. In every fraction, molecular masses associated with possible HCH adducts could be detected. The results suggest the presence of various HCH-modified flavan-3-ols and HCH proanthocyanidins. Further elucidation of molecular structure necessitated MS/MS experiments to observe fragmentation patterns.
Fragmentation pattern analysis for HCH esters was performed using the LC-QqQ-MS/MS methodology. Salicortin was detected during negative ionization as [M − H]− with an m/z of 423 and as sodium, potassium, and ammonium adducts in positive ionization mode. Its fragmentation pattern confirmed previously reported data [22], producing fragments at m/z 83 ([HCH–H–CO2–CO]−), 137 ([HCH–H–H2O]−), 123 ([salicylalcohol–H]−), and 155 ([HCH–H]−) in negative mode, and m/z 107 ([M + H–HCH–anhydroHex]+), 287 ([M + H–anhydroHCH]+), and 263 ([M + H–anhydroHex]+) in positive mode. Tremulacin was also tentatively identified, with [M − H]− at m/z 527, and its fragmentation closely matched the literature data, yielding fragments at m/z 83, 137, 121 (benzoate), and 155 in negative mode and m/z 105 ([benzoic acid+H–H2O]+) and 267 ([benzoylHex+H–H2O]+) in positive mode. Additionally, three isomeric acetylated salicortins were found in SdIII3 with [M − H]− at m/z 465, and its fragmentation produced characteristic ions at m/z 205 ([AcHex+H–H2O]+), 311 ([M + H–HCH]+), and 107 ([M + H–HCH–anhydroAcHex]+) [22].
Two HCH-diHO-Fl3ols, identified as HCH-catechin and HCH-epicatechin, were detected in SdIII5 with [M − H]− at m/z 427.1030. These compounds exhibited characteristic aglycone fragments at m/z 289.0718 and 271.0611 in accordance to previously reported data [37]. The identifications are postulated based on retention times and alignment of fragmentation patterns of the isolated compounds 4 and 9.
The fragmentation pattern of HCH-flavan-3-ols included the neutral loss of the HCH, resulting in the formation of the [M − H–HCH]− ion, i.e., flavonoid Y0− ion (m/z 289), followed by a subsequent water loss to generate [M − H–HCH–H2O]− i.e., [Y0-H2O]− (m/z 271). Additionally, typical flavonoid fragments formed by retro-Diels–Alder reaction (RDA), such as 1,3A− (m/z 137.0244, possibly also including isobaric [HCH–H–H2O]−) and 1,4A− (m/z 125.0244), were formed. Notably, the [HCH–H]− ion (m/z 155), characteristic for salicylic alcohol derivatives, was absent, underscoring the distinct fragmentation behavior of HCH-modified flavan-3-ols, which exhibited preference for charge retention on the flavonoid moiety.
A number of HCH-triHO-Fl3ols (HCH-gallocatechin, HCH-epigallocatechin, and their isomers) were observed with [M − H]− at m/z 443.0960 (SdIII5). Characteristic fragments included the loss of a neutral mass of 156 u ([Y0–H2O]−/[M − H–HCH]−, m/z 287.0557) and the product of subsequent water loss at m/z 269.0441 ([M − H–HCH–H2O]−), as well as the loss of a HCH moiety and intact hydroxylation in position 3 (Y0− = [M–anhydroHCH–H]−, m/z 305.0652). Additionally, typical species associated with the flavan-3-ol core structure, such as 1,3A− and [1,3B–CO]− (m/z 137.0242) and 1,4A− (m/z 125.0241), were observed. The water loss of the aglycone anion appeared to be significantly more prominent for HCH-triHO-Fl3ols compared to HCH-diHO-Fl3ols. This was reflected in a signal ratio strongly shifted in favor of the [Y0–H2O]− species. HRESIMS/MS spectra are presented in Figures S3 and S4, and the postulated fragmentation is presented schematically in Figure 5.
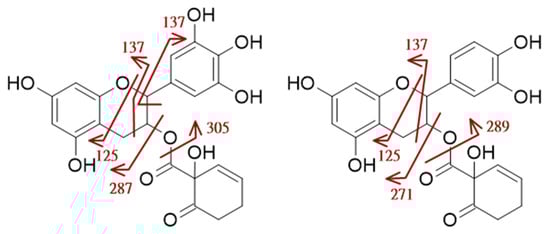
Figure 5.
Postulated fragmentation pattern for HCH-triHO-Fl3ol and HCH-diHO-Fl3ol respectively at negative ionization; fragment masses indicated by red arrows.
The signal at m/z 715.1665 was attributed to an HCH adduct of a dimeric PA, corresponding to HCH-diHO-Fl3ol-diHO-Fl3ol (SdIII7). The obtained MS/MS spectrum and the proposed fragmentation pathway are shown in Figure S5 (Supplementary Materials). Characteristic fragments include the loss of HCH as a neutral mass of 156.0424 u, resulting in the fragment [M − HCH–H]− (m/z 559.1242). Similarly to HCH-catechin, the loss of HCH without dehydration was observed ([M − H–anhydroHCH]−, m/z 577.1342), representing the dimeric procyanidin. The fragment at m/z 563.1192 can be assigned to the product of a retro-Diels–Alder reaction (neutral loss of 1,3B) [48] as well as [M − H–HCH–1,3B]− (m/z 407.0768). Further characteristic fragments of a dimeric procyanidin were also assigned: these included the monomeric flavan-3-ol [Y0]−, as well as the slightly lighter fragment [Y0–H2]−, both originating from the cleavage of dimeric procyanidins analogous to data of Symma and Hensel [48]. Additionally, the fragments [Y0–H2O]− and [1,4A]−/[1,3B-CO]− were observed (Figure S5).
Another HCH adduct of a dimeric proanthocyanidin was identified at m/z 731.1604 (SdIII7), comprising one diHO-Fl3ol and one triHO-Fl3ol subunit. Characteristic fragments such as appear [M − H–HCH]−, resulting from a neutral loss of 156.0420 u and the retro-Diels–Alder product [M-1,3B]− (m/z 563.1181). Another neutral loss was observed, resulting in the daughter fragment [M − H–1,3B–HCH]− at m/z 407.0765 [48]. It is noteworthy that these fragments match the m/z values of the daughter fragments of HCH-diHO-Fl3ol-diHO-Fl3ol, despite originating from a different parental ion. Based on the proposed fragmentation patterns, it can be inferred that the RDA cleavage preferentially involves the trihydroxylated B-ring of the triHO-Fl3ol subunit, as respective fragments for the diHO-Fl3ol unit were not observed. Additionally, characteristic daughter fragments were assigned to a dehydrogenated triHO-Fl3ol ([X0–H2]−) at m/z 303.0504, [X0–H2O]− at m/z 287.0553, diHO-Fl3ol (Y0−) at m/z 289.0696, and [Y0–H2O]− at m/z 271.0598 (Figure S6). The absence of a [X0]− signal alongside the presence of a signal corresponding to a dehydrogenated triHO-Fl3ol suggests that the triHO-Fl3ol unit represents the upper of the two flavan-3-ol subunits. The formation of a dehydrogenated flavan-3-ol during the cleavage of the dimeric proanthocyanidin is attributed to the linkage involving C-4 [48].
Additionally, the HCH adduct of a trimeric PA (m/z 1003.2282) was observed (SdIII8). The MS/MS experiment yielded fragments at m/z 847.1838 ([M − H–HCH]−), indicating the loss of the HCH moiety. Additionally, a neutral loss of 288.0656 u was observed, corresponding to the loss of a diHO-Fl3ol unit. The resulting fragment, [M − H–diHO-Fl3ol]−, at m/z 715.1626, matches the parent fragment of the discussed HCH adduct of a homodimeric procyanidin. Further corresponding daughter fragments were detected, such as [Y0]−, [Y0–H2]−, and [1,4A]−/[1,3B-CO]−, as well as fragments generated after the loss of one monomeric subunit: [M − H–diHO-Fl3ol–1,3B]−, [M − H–diHO-Fl3ol–HCH]−, and [M − H–diHO-Fl3ol–1,3B-HCH]−. Additionally, the fragment [M − H–diHO-Fl3ol–1,3B–anhydroHCH]− at m/z 423.0697 was assigned to the RDA cleavage product of the dimeric procyanidin (Figure S7). No signals corresponding to a mHO-Fl3ol (in B-ring monohydroxylated flavan-3-ol) were detected, excluding the possibility that the underlying proanthocyanidin backbone is composed of mono-, di-, and trihydroxylated flavan-3-ols, indicating an HCH adduct of a homotrimeric procyanidin. A table for the mass-spectrometric data is given in Table S8.
3. Discussion and Conclusions
In this study, 13 phenolic compounds were isolated from a methanolic extract of willow bark (Salix cinerea). Among these salicin, salicortin, and picein were isolated, all previously identified in various Salix species, including Salix cinerea [49]. Additionally, two phenylpropanoid glycosides, triandrin and vimalin, could be obtained. While their presence in S. cinerea has been previously suggested [24,26], this study confirms their occurrence in the species. Dihydromyricetin, also known as ampelopsin, was obtained as the sole flavanonol. As a typical constituent of willow bark [8,50], this is the first report of an isolation of dihydromyricetin from S. cinerea bark as well as the monomeric flavan-3-ols catechin and gallocatechin, although these have been isolated from several Salix species [51]. Further, this study describes the successful isolation of HCH-catechin (catechin-3-O-(1-hydroxy-6-oxo-2-cyclohexen-1-carboxylic acid) ester), which is reported here for the first time in S. cinerea and which is only the third report globally [36,37]. Approximately 30 mg of HCH-catechin (0.1% of the extract) was isolated. As the HCH moiety, also found in salicortin, suggests potential biological activity [15,47,52], the compound was further used for in vitro testing (ICAM-1 assay). Further obtained compounds included procyanidin B1, procyanidin B3, prodelphinidin B3 (gallocatechin-(4α→8)-catechin) and gallocatechin-(4α→8)-gallocatechin (GC-(4α→8)-GC). Although the occurrence of procyanidins B1 and B3 have been reported throughout the genus [51,53], no specific report on isolation from S. cinerea bark has been made yet. The tendency for high prodelphinidin contents compared to other Salix species was postulated earlier [54,55,56]. Here, both prodelphinidins were obtained for the first time from S. cinerea, while for gallocatechin-(4α→8)-gallocatechin no previous report of isolation within the genus Salix could be found. The isolation of reasonable amounts of prodelphinidins supports the results of Bate-Smith, but exact ratios of PCs to PDs could not be determined by the referred method [54].
The 13C NMR-spectroscopic analysis of polymeric proanthocyanidins (pPAs) in Salix cinerea revealed a notably high proportion of trihydroxylated flavan-3-ol units (triHO-Fl3ols), ranging between 49% and 54%. This contrasts with previous studies on other Salix species, such as S. purpurea and S. daphnoides, which reported minimal or no evidence of prodelphinidins [37,39]. The presence of prodelphinidins aligns with the isolation of two representatives of this class during the study and corroborates earlier findings by Foo and Porter in Salix caprea [57]. Interestingly, the balanced distribution of di- and trihydroxylated units aligns with the observations of Bate-Smith, who identified significant prodelphinidin content in S. cinerea leaf extracts [54]. Additionally, the pPA mixture exhibited a slight predominance of 2,3-cis-configured monomers (55–59%). During the isolation of phenolic substances from S. cinerea, only cis-configured catechin and gallocatechin were isolated. No 2,3-trans-configured epicatechin or epigallocatechin could be obtained, although an epicatechin monomer is part of compound 10 and NMR spectrometric data indicated their presence within the PAs. Further proof for the occurrence of trans monomers as part of pPAs is procyanidin B1, containing an epicatechin unit, which was successfully isolated. The mean degree of polymerization (mDP) showed a seasonal trend, increasing from approximately 7 in early growing season to 11 by the end of the season. These values are between those reported for S. purpurea (mDP 4–5) and S. daphnoides (mDP 12) by the same methodical approach [37,39]. Comparison to the mDP values reported for S. purpurea and S. daphnoides is challenging, as the harvest times of the plant material in those studies were not specified. While the hydroxylation patterns and orientation of the linkage between C-2 to C-3 remained relatively stable (±10%), the increase in the mDP reflects elongation of PA chains throughout the growing season. However, due to the limitations of single-point sampling for each harvest, this trend remains a hypothesis requiring further validation.
HCH-catechin (9) demonstrated a significant reduction in TNF-α-induced ICAM-1 expression at concentrations of 25 µM and above, whereas catechin alone had no such effect. This activity can therefore be attributed to the 1-hydroxy-6-oxo-2-cyclohexen-1-carboxyl (HCH) moiety, as previously suggested, due to degradation of this moiety to catechol [46,47]. The formation of catechol under assay conditions in vitro corroborates its role as the active metabolite. HCH-catechin showed lower activity compared to salicortin, which exhibited significant effects at 10 µM [47] under the same testing conditions. While salicortin degraded by ~90% within 24 h, HCH-catechin degraded more slowly (71.3 ± 1.3%) in the same time. Catechol concentrations after HCH-catechin degradation (~11.7 µM) were comparable to those from tremulacin in previous studies but lower than those from salicortin (~20 µM) [47]. These results suggest that pharmacological effects of HCH-catechin, salicortin, and tremulacin in the ICAM-1 in vitro assay are primarily mediated by catechol, as confirmed by their similar inhibitory profiles. Differences in activity arise from their varying degradation rates and catechol release kinetics. The slower degradation of HCH-catechin suggests a prolonged release of catechol, potentially leading to sustained effects. Catechol’s anti-inflammatory activity has been demonstrated in various in vitro models [15,47,58,59,60]. Studies have also identified catechol conjugates as phase II metabolites in humans following the ingestion of willow bark preparations [52,61] and also as constituents in commercial standardized willow bark extracts [58]. However, further studies are required to understand the prevalence of HCH moieties across Salix species and their contribution to the pharmacological profile of Salicis cortex, evaluating a potential broader distribution of HCH-containing compounds. While the presence of HCH-catechin was shown by a mass-spectrometric screening in different Salix species [42], the amount of HCH as part of different salicylic alcohol derivatives is not determined by the analysis according to European Pharmacopoeia. Understanding these parameters may refine quality standards for Salicis cortex and future investigations into its therapeutic potential.
This study successfully detected numerous HCH adducts in Salix cinerea. Using UHPLC-HRESIMS-TOF analysis, compounds corresponding to HCH adducts of flavan-3-ols and proanthocyanidins were detected in all proanthocyanidin-containing fractions of a methanolic extract chromatographed on Sephadex® LH-20. Furthermore, the application of LC-MS/MS-QqQ allowed for a comparison of the fragmentation patterns of HCH adducts with salicylic alcohols and those with flavan-3-ol backbones and the literature data [22,37]. The HCH flavan-3-ols demonstrated a notable tendency to cleave the HCH moiety as a neutral fragment. This behavior resulted in distinct characteristic daughter fragments compared to salicylic alcohol derivatives. Using these identified fragments, five HCH adducts of flavan-3-ols and proanthocyanidins were further characterized, and their respective fragmentation pathways were proposed. This work represents the first detailed report on the fragmentation mechanisms of di- and trimeric proanthocyanidin–HCH adducts. Moreover, due to comparison of these patterns to the ones described for flavan-3-ols in the literature [48], this study successfully identified a HCH adduct of a mixed di- and trihydroxylated dimeric prodelphinidin. The occurrence of these mixed-hydroxylated dimeric proanthocyanidins in S. cinerea was already confirmed in this project through the isolation of 12; thus, the presence of an HCH adduct of this compound is reported for the first time. Further, a homotrimeric procyanidin HCH adduct was observed. Such a compound has been previously described in the literature [36], although no mass spectrometric data or fragmentation pattern has been published.
This mass-spectrometric study highlights the widespread presence of HCH adducts in Salix cinerea extracts, extending beyond the traditionally studied salicylic alcohol derivatives. A mass-spectrometric screening for HCH-catechin by Wiesneth et al. also suggests a broad abundance of HCH adducts across the genus Salix [42]. Future research is necessary to explore their association with other compounds and to quantify total HCH content, providing insights into their potential contribution to the efficacy of Salicis cortex preparations. As HCH adducts are a potential source of catechol, an in vivo metabolite of willow bark preparations [52,61], a quantification method for catechol sources could be an interesting subject for future investigations and an explanation for the efficacy of polyphenolic fractions of willow bark extracts [11]. Additionally, this understanding could introduce additional quality markers of the medicinal drug Salicis cortex, which is heavily focused on the content of salicylic alcohol derivatives [62,63]. This study represents a significant step towards a more detailed understanding of willow bark’s pharmaceutically relevant compounds and their properties.
These results describe the occurrence of relevant phenolic compounds in Salix cinerea and underline the importance of determining pharmacologically important HCH adducts in plant extracts.
4. Materials and Methods
4.1. Plant Material
Willow bark of a single S. cinerea individuum was harvested at the Ecological-Botanical Gardens of the University of Bayreuth (Bayreuth, Germany) in accordance with the Monograph of European Pharmacopoeia. Twigs of the current growing season with a maximum diameter of 10 mm without leaves and buds were cut into small pieces [62]. Drying was conducted over silica gel in evacuated desiccators. Silica gel was regenerated daily for five days and then once more for the final two days. The whole drying was completed after seven days. Harvesting took place on three dates in 2020 at the beginning (June), in the middle (August) and at the end (October) of the growing season. Specimens of the cut, dried drug material are deposited at the Institute of Pharmaceutical Biology of the University of Regensburg (Regensburg, Germany, Voucher-Nr: “38_Scin_f_BT_06-2020_001”, “38_Scin_f_BT_08-2020_001”, and “38_Scin_f_BT_06-2020_001”).
4.2. Extraction and Isolation
The dried drug was ground by applying a UZM 1 mill (Retsch GmbH, Haan, Germany) with a sieve size of 0.50 mm and mixed with an equivalent volume of sea sand (1 + 1). After 12 h of maceration using methanol, exhaustive methanolic percolation was performed over 14 days. After evaporation and lyophilization, this resulted in 12.5 g (June), 31.9 g (August) and 38.6 g (October) if dried extract (drug extract ratios were 7.1, 5.4 and 4.7 respectively, Table 2).
Table 2.
Overview of drug material weights and extraction yields. DER: drug extract ratios.
The extracts were separated by open-column chromatography (95 × 3 cm) with Sephadex® LH-20 (250 g, GE Healthcare Europe GmbH, Freiburg, Germany) as a stationary phase. The flow of the eluent ethanol 70% (v/v) was set to 1 mL/min. TLC on silica gel 60 F254 (Merck Chemicals GmbH, Darmstadt, Germany) and mixtures of ethyl acetate, formic acid, acetic acid, methanol, and water were used as eluents to control the chromatography (100:11:11:0:26 and 90:5:0:3:2 [v/v]). For detection, vanillin/HCl and anisaldehyde/H2SO4 reagents were applied, and fractions of a similar chromatographic profile were combined. When the eluent turned colorless, the mobile phase was changed to acetone 70% (v/v) to yield a fraction of polymeric proanthocyanidins. Amounts of extracts and fractions as well as elution ranges are shown in Table S1. Fractions of the harvest in August (SdII) were further separated during the isolation process. A sample TLC of the Sephadex®-LH20 fractionation is shown in Figure S9.
Fractions SdII67 (SdII6 and SdII7 were merged due to their similar chromatographic fingerprint, 1495 to 1988 mL), SdII8 (1988 to 2533 mL), SdII9 (2533 to 3464 mL), and SdII10 (3464 to 4249 mL) underwent MPLC on a Spot Liquid Chromatography Flash machine (Arment Instruments, Paris, France). The stationary phase used for the MPLC was MCI-Gel® CHP20P (170 g, Mitsubishi Chemical Europe GmbH, Düsseldorf, Germany) in a 600 × 25 mm glass column (BESTA-Technik für Chromatographie GmbH, Düsseldorf, Germany). A = 20% methanol, B = 50% methanol; flow 15 mL/min; gradient: 0–5 min 0% B, 5–150 min 0% → 100% B, 150–180 min 100% B. Subsequently, two isocratic steps were applied. The first one used 75% methanol for 45 min, and the second one used 100% methanol for 65 min until the eluent turned colorless. TLC control was equivalent to the control of Sephadex® open-column chromatography.
Compounds 8 eluted as fraction SdII67M6 (2161–2640 mL) from SdII67. Compound 10 eluted as fraction SdII8M4 (1101–1360 mL) from SdII8. Compound 12 eluted as fraction SdII9M4 (1101–1360 mL) from SdII9. Compound 13 eluted as fraction SdII10M2 (221–600 mL) from SdII10.
Further fractionation was conducted by RP-HPLC (Binary Agilent Infinity 1260 HPLC system connecting a 1260 Agilent diode array detector, a 1260 Agilent fraction collector, and a 1260 Agilent manual injector, Waldbronn, Germany). As stationary phases, three columns equipped with guard columns were used. Column I: Nucleodur C18 Isis, 5 µm, 10 × 250 mm (Macherey-Nagel, Düren, Germany); column II: Nucleodur C18 Isis, 5 µm, 21 × 250 mm (Macherey-Nagel); column III: Kinetex® Biphenyl, 100 Å, 5 µm, 21,2 × 250 mm (Phenomenex, Aschaffenburg, Germany). The fractions diluted in methanol were injected manually.
HPLC-System I: Column I; flow 5 mL/min; A = water, B = acetonitrile; gradient: 0–13.5 min 12% → 40% B, 13.5–14 min 40% → 50% B, 14–15 min 50% → 100% B, 15–18 min 100% B isocratic. Compounds 1–5 eluted at 4.9, 9.5, 5.3, 6.3 and 10.9 min from SdII2.
HPLC-System II: Column II; flow 21 mL/min; A = water, B = acetonitrile; gradient: 0–10 min 10% → 45% B, 10–11 min 45% → 100% B, 11–13 min 100% B isocratic. Compounds 6 and 7 eluted at 2.4 and 4.8 min respectively from SdII67M2.
HPLC-System III: Column III; flow 21 mL/min; A = water, B = acetonitrile; gradient: 0–10 min 20% → 36.7% B, 10–11 min 36.7% → 100% B, 11–13 min 100% B isocratic. Compound 9 eluted at 8.3 min from SdII67M8.
HPLC-System IV: Column III; flow 21 mL/min; A = water, B = acetonitrile; gradient: 0–10 min 20% → 35% B, 10–11 min 35% → 100% B, 11–13 min 100% B isocratic. Compound 9 was again further purified and eluted at 8.7 min.
HPLC-System V: Column III; flow 21 mL/min; A = water, B = acetonitrile; gradient: 0–10 min 5% → 35.7% B, 10–11 min 35.7% → 100% B, 11–13 min 100% B isocratic. Compound 11 eluted at 8.3 min from SdII9M5.
4.3. NMR Spectroscopy
For NMR spectroscopy, all sample solutions were prepared in methanol-d4. The spectra for compounds 10–13, showing rotational isomerism, were acquired on system I, which was an AVANCE III HD NMR (Bruker Corporation, Billerica, MA, USA) operating at 400.13 MHz (1H NMR) and 100.63 MHz (13C NMR) at 233 K. The experiments for other isolated compounds were conducted at room temperature (RT) and measured with system II, which was an AVANCE III 600 NMR (Bruker Corporation) equipped with a Bruker 5 mm TCI CryoProbe operating at 600.25 MHz (1H NMR) and 150.95 MHz (13C NMR). Experiments for structure verification and elucidation comprised 1D-1H, 1D-13C, [1H–13C]-HSQC, [1H–13C]-HMBC, [1H–1H]-COSY and [1H–1H]-NOESY.
The pPA-enriched fractions (SdI_pPA, SdII_pPA, SdIII_pPA, Table S1) of collected willow bark were analyzed for further characterization of the contained pPAs. Therefore, a well-established NMR-based method was employed, following the protocols of Czochanska et al., Eberhardt and Young and Newman et al. [64,65,66]. Spectra of pPA fractions were acquired on system I at room temperature. The fractions were examined to estimate the degree of polymerization of pPAs and the ratio of dehydroxylated, catechin-like flavan-3-ols (diHO-F3ols) to trihydroxylated gallocatechin-like flavan-3-ol monomers (triHO-F3ols) and the ratio of the 2,3-cis to 2,3-trans configuration of monomers. The mean degree of polymerization (mDP) was calculated by comparing the integrals of signals representing the C-3 atoms in extending chain units (“L”) and terminal units (“M”), as shown in Figure 1 and Figure 2. In contrast to Wiesneth et al. [67], the assessment by integrals “N”, “O”, and “P” was not possible due to the poor signal-to-noise ratio of “P”. The relative proportions of 2,3-cis- and 2,3-trans-configured flavan-3-ol units were assessed by comparison of integrals “I” and “J” to “K” as well as “N” to “O”. The ratio of diHO-F3ols to triHO-F3ols monomers was investigated using three different signals by forming the ratio of “Btri” to “Bdi” and “Ctri I + Ctri II” to “Cdi” as well as the ratio of the sum of “D” and “E” to “Ftri” and calculating the arithmetic mean.
4.4. Mass Spectrometry
Isolated compounds were analyzed by HRESIMS Q-TOF 6540 UHD (Agilent Technologies GmbH, Waldbronn, Germany) coupled to a 1290 Infinity UHPLC (Agilent).
Further data was obtained by screening PA-rich fractions after chromatography (column: Luna Omega 1.6 μm C18 100 Å 50 × 2.1 mm; flow 0.5 mL/min; temperature: 50 °C; injection volume: 1.00 µL; gradient: A = water + 0.1% FA, B = acetonitrile + 0.1% FA; 0.0–6.0 min 20% → 60% B, 6.0–9.0 min 60% → 100% B, 9.0–12.0 min 100% B isocratic, 12.0–15.0 min 100% → 20% B). Detection range was set to m/z 80–1700 at 4 MS scans/s and 6 scans/s for MS/MS experiments. Ionization was achieved by a Jet Stream ESI Ion source at a gas flow of 8 L/min (300 °C), and a pressure of 40 psi in the nebulizer was applied, while the fragmentor worked at 120 V; detected masses with a score > 95 were considered hits.
LC-QqQ-MS experiments were conducted on a 1200 Series HPLC (Agilent; column: Zorbax Eclipse XDB-C18, 50 mm × 4.6 mm, 1.8 µm; flow 1 mL/min; temperature: 50 °C; injection volume: 5 µL; A = water + 0.1% FA, B = acetonitrile; gradient: 0.0–6.0 min 20% → 60% B, 6.0–9.0 min 60% → 100% B, 9.0–12.0 min 100% B isocratic, 12.0–15.0 min 100% → 20% B). Ionization was achieved by an ESI ion source with a pressure of 50 psi in the nebulizer and drying gas at 10 L/min (350 °C). MS scans were conducted in positive and negative ionization mode in a detection range of m/z 100–1680. The fragmentor voltage was set to 120 V. A screening by Scan-CID-SIM (precursor ion scan mode) used negative ionization (precursor ion range m/z 153–1680; product ion m/z 155; fragmentor voltage 120 V; collision energy 10 V, 20 V, and 30 V). For the SIM-CID-Scan (product ion scan), the species [M + H]+, [M + NH4]+ and [M − H]− were chosen (with detection range between m/z 35 and precursor ion m/z + 2; fragmentor voltage 100 V; collision energy 5 V, 15 V, 25 V, and 35 V).
4.5. CD Spectroscopy
A J-715 spectropolarimeter (JASCO Deutschland GmbH, Gross-Umstadt, Germany) was used for acquisition of CD-spectra at 22 °C (1 mm pathlength in Quartz cuvettes). The range of wavelength from 200 to 400 nm was scanned in 0.5 nm steps and at a scan speed of 200 nm/min. Ten cycles were run, and the final spectrum was calculated by applying the Savitzky–Golay algorithm with a convolution width of 15. HPLC-grade methanol was used as the solvent for the samples in concentrations ranging from 175 to 1750 µmol/L.
4.6. Polarimetry
Optical rotation of isolated compounds was measured using an UniPol L 1000 polarimeter (Schmidt + Haensch GmbH & Co., Berlin, Germany) and a PL1 (Exacta OpTech GmbH, München, Germany). Samples were solved in methanol (HPLC-grade) at a concentration of 0.1% and analyzed at 589.30 nm in a microtube of 50 mm length and 0.550 µL volume (100 mm and 10 mL respectively for PL1) at room temperature (25 °C). The specific rotational angle was calculated as the average from ten measurements (five for PL1).
4.7. Isolated Compounds (All Structures Are Represented in Figure S8)
Salicin (1), white amorphous powder; −35° (c 1.0 g/L, MeOH); λmax 212.0 nm (c 0.1 g/L, MeOH); 1H and 13C NMR data, see Tables S2 and S3; HRESIMS m/z 285.0979 [M − H]−, (calcd. for C13H18O7, 285.0980).
Salicortin (2), white amorphous powder; −92.5° (c 1.0 g/L, MeOH); λmax 269.1 nm (c 0.1 g/L, MeOH); 1H and 13C NMR data, see Tables S2 and S3; HRESIMS m/z 423.1301 [M − H]−, (calcd. for C20H24O10, 423.1297).
Picein (3), white amorphous powder; −72.4° (c 1.0 g/L, MeOH); λmax 264.0 nm (c 0.1 g/L, MeOH); 1H and 13C NMR data, see Tables S2 and S3; HRESIMS m/z 297.0979 [M − H]−, (calcd. for C14H18O7, 297.0980).
Triandrin (4), white amorphous powder; −36.2° (c 1.0 g/L, MeOH); λmax 263.1 nm (c 0.1 g/L, MeOH); 1H and 13C NMR data, see Tables S2 and S3; HRESIMS m/z 330.1546 [M − H]−, (calcd. for C15H20O7, 330.1547).
Vimalin (5), white amorphous powder; −50° (c 1.0 g/L, MeOH); λmax 262.0 nm (c 0.1 g/L, MeOH); 1H and 13C NMR data, see Tables S2 and S3; HRESIMS m/z 325.1290 [M − H]−, (calcd. for C16H22O7, 325.1293).
Gallocatechin (6), beige–brown amorphous powder; 162.4° (c 1.06 g/L, MeOH); λmax 210.0 nm, λlocal 271.9 nm (c 0.1 g/L, MeOH); 1H and 13C NMR data, see Tables S3 and S4; HRESIMS m/z 305.0676 [M − H]−, (calcd. for C15H14O7, 305.0667).
Catechin (7), beige–brown amorphous powder; 48.1° (c 0.74 g/L, MeOH); λmax 207.9 nm, λlocal 271.9 (c 0.1 g/L, MeOH); 1H and 13C NMR data, see Tables S4 and S5; HRESIMS m/z 289.0727 [M − H]−, (calcd. for C15H14O6, 289.0718).
Dihydromyricetin (8), beige–brown amorphous powder; 122.3° (c 2.78 g/L, MeOH); λmax 207.9 nm, λlocal 291.0 (c 0.1 g/L, MeOH); 1H and 13C NMR data, see Tables S4 and S5; HRESIMS m/z 319.0473 [M − H]−, (calcd. for C15H12O8, 319.0459).
HCH-catechin (9), beige–brown amorphous powder; −91.6° (c 1.0 g/L, MeOH); λmax 205.0 nm, λlocal 289.1 nm (c 0.1 g/L, MeOH); 1H and 13C NMR data, see Tables S4 and S5; HRESIMS m/z 427.104 [M − H]−, (calcd. for C22H20O9, 427.1035).
Procyanidin B1 (10), beige–brown amorphous powder; −4.02° (c 1.0 g/L, MeOH); λmax 203.1 nm, λlocal 289.1 nm (c 0.1 g/L, MeOH); 1H and 13C NMR data, see Tables S6 and S7; HRESIMS m/z 577.1358 [M − H]−, (calcd. for C30H26O12, 577.1357).
Procyanidin B3 (11), beige–brown amorphous powder; −224.2° (c 1.0 g/L, MeOH); λmax 282.0 nm (c 0.1 g/L, MeOH); 1H and 13C NMR data, see Tables S6 and S7; HRESIMS m/z 577.1358 [M − H]−, (calcd. for C30H26O12, 577.1357).
Gallocatechin-(4α→8)-catechin (12), beige–brown amorphous powder; −152.7° (c 1.0 g/L, MeOH); λmax 205.0 nm, λlocal 282.0 nm (c 0.1 g/L, MeOH); 1H and 13C NMR data, see Tables S6 and S7; HRESIMS m/z 593.1306 [M − H]−, (calcd. for C30H26O13, 593.1301).
Gallochatechin-(4α→8)-gallocatechin (13), beige–brown amorphous powder; −267.4° (c 1.0 g/L, MeOH); λmax 209.0 nm (c 0.1 g/L, MeOH); 1H and 13C NMR data, see Tables S6 and S7; HRESIMS m/z 609.1261 [M − H]−, (calcd. for C30H26O14, 609.1250).
4.8. Cell Culture
The human microvascular endothelial cell line (HMEC-1) was provided by Dr. E. Ades and F.-J. Candel (CDC, Atlanta, GA, USA) as well as Dr. T. Lawley (Emory University, Atlanta, GA, USA). The cells were cultured in EASY Endothelial Cell Growth Medium supplemented with 10% FBS, 50 ng/mL amphotericin B and 50 ng/mL gentamicin. Mycoplasma contamination was excluded by PCR and culture from GATC Biotech AG (Konstanz, Germany). Culture of cells was conducted in an atmosphere of 5% CO2 and relative humidity of 90% at 37 °C.
4.8.1. MTT Assay
For the MTT assay, HMEC-1 cells were seeded (at 100 µL/well, 9 × 10⁴ cells/well) in 96-well plates and incubated at 37 °C (5% CO2, 90% relative humidity) for 24 h. Subsequently, the medium was replaced by a sample solution in medium (10–75 µM, max. 0.1% DMSO, v/v) and kept for another 24 h under the same conditions. In the next step, the supernatant was replaced by 100 µL of MTT solution in medium (0.4 mg/mL) and incubated for another three hours. After completion of this incubation, cells were treated with 10% sodium dodecyl sulfate (SDS) in water and stored under light exclusion at room temperature until the formazan crystals were dissolved. The absorbance at 560 nm was determined using a Tecan microplate reader (Tecan Trading AG, Maennedorf, Switzerland). The cell viability was calculated by comparison to the average absorbance of the negative control (medium only). Additional to the negative control, the highest used DMSO concentration was applied to preclude the possibility of solvent effects. All tests were performed three times independently in hexaplicates.
4.8.2. ICAM-1 Assay
This assay was performed as previously described [66]. Confluently grown HMEC-1 cells from a culture flask (150 cm2) were split (1:3), suspended in 13 mL medium, and seeded in a 24-well plate (500 µL/well). After cultivation for 48 h at 37 °C in an atmosphere of 5% CO2 and 90% relative humidity and after the formation of a monolayer, the supernatant was replaced by substance dilutions in medium (6–70 µM) containing a maximum of 0.15% DMSO (v/v) and incubated for 30 min before stimulation with TNFα (10 ng/mL). In each performance, an unstimulated negative control (0.15% DMSO, v/v), an untreated control (medium), and a positive control (parthenolide, 5 µM) were included. A total of 24 h later, the cells were washed with phosphate-buffered saline (PBS), detached by trypsin/EDTA, fixed by formalin 10% for 15 min, and treated with a murine fluorescein-isothiocyanate (FITC)-marked IgG1 antibody against ICAM-1 (Bio-Rad, Kidlington, UK) for 30 min. The cell suspension in PBS was analyzed by a FACSCanto II (BD, Lakes, NJ, USA) (flow: 60 µL/min, FSC: 1 V, SSC: 320 V; FITC: 320 V). The ICAM-1 expression was calculated as a proportion of the mean obtained for the untreated control. The test was performed three times independently in duplicates.
Statistical significance levels were calculated via one-way ANOVA followed by Tukey’s HSD in SPSS 26 (IBM, Armonk, NY, USA).
4.8.3. Stability Study
For stability studies, 50 µM solutions of HCH-catechin in cell culture medium were incubated in triplicates for 24 h under ICAM-1 assay conditions. Samples (250 µL) were taken at defined intervals, and proteins were precipitated with an equivalent amount of methanol, filtered (Nanosept® filters, 14000 UpM, 10 °C, 30 min) and analyzed via UPLC®-PDA using catechol and purified HCH-catechin as reference standards.
UPLC system: Acquity H-Class quaternary solvent manager, Acquity FTN autosampler, Acquity eλ PDA detector, Acquity FLR detector (all Waters GmbH, Eschborn, Germany); column: Luna Omega 1,6 μm C18 100 Å 100 × 2.1 mm; A = water + 1% formic acid, B = ACN + 1% formic acid; gradient: 0.0–0.5 min 5% B, 0.5–9.0 min 5% → 30% B, 9.0–10.5 min 30% → 50% B, 10.5–11.5 min 50% → 100% B, 11.5–14.0 min 100% B, 14.0–15.0 min 100% → 5% B, 15.0–17.0 min 5% B.
Supplementary Materials
The following supporting information can be downloaded at: https://www.mdpi.com/article/10.3390/molecules31040702/s1, Table S1: Overview Sephadex fractions, Table S2: 1H NMR data of compounds 1–5, Table S3: 13C NMR data of compounds 1–5, Table S4: 1H NMR data of compounds 6–9, Table S5: 13C NMR data of compounds 6–9, Table S6: 1H NMR data of compounds 10–13, Table S7: 13C NMR data of compounds 10–13, Figure S1: detailed section of the 13C-NMR spectrum of the polymeric PA fraction SdIpPA, prodelphinidin B3, gallocatechin-(4α→8)-gallocatechin, and procyanidin B1, Figure S2: effect of catechin and HCH-catechin on the cell viability of HMEC-1 cells, Figure S3: mass spectrum and proposed fragmentation pattern for HCH-catechin at negative ionization, Figure S4: mass spectrum and proposed fragmentation pattern for HCH-triHO-Fl3ol at negative ionization, Figure S5: mass spectrum and proposed fragmentation pattern for HCH-diHO-Fl3ol diHO-Fl3ol at negative ionization, Figure S6: mass spectrum and proposed fragmentation pattern for HCH-triHO-Fl3ol-diHO-Fl3ol at negative ionization, Figure S7: mass spectrum and proposed fragmentation pattern for HCH-diHO-Fl3ol-diHO-Fl3ol-diHO-Fl3ol at negative ionization, Figure S8: structures of salicin (1), salicortin (2), picein (3), triandrin (4), vimalin (5), gallocatechin (6), catechin (7), dihydromyricetin/ampelopsin (8), HCH-catechin (9), procyanidin B1 (10), procyanidin B3 (11), gallocatechin-(4α→8)-catechin (12) and gallocatechin-(4α→8)-gallocatechin (13), Figure S9: TLC control of the Salix cinerea extract fractionated by Sephadex® LH-20, Table S8: mass spectrometric screening for HCH-PA adducts.
Author Contributions
Conceptualization, G.J.; investigation, T.O.G., K.K. (cell culture) and D.O. (mass-spectrometric fragmentation pattern analysis); resources, G.J., J.H. and G.A. (plant material from Ecological-Botanical Gardens Bayreuth); writing—original draft preparation, T.O.G.; writing—review and editing, K.K., D.O., J.H., G.A. and G.J.; visualization, T.O.G.; supervision, G.J.; project administration, G.J. All authors have read and agreed to the published version of the manuscript.
Funding
This research received no external funding.
Data Availability Statement
The raw data supporting the conclusions of this article will be made available by the authors on request.
Acknowledgments
F. Kastner and T.A. Nguyen are kindly acknowledged for performing the 1D and 2D NMR experiments, as are J. Kiermaier and W. Söllner for acquiring the MS data (all: Zentrale Analytik, Faculty of Chemistry and Pharmacy, University of Regensburg). The authors also would like to thank the American Type Culture Collection (ATTC®, Manassas, VA, USA) for providing the HeLa cell line, as well as E. Ades, F.J. Candal of CDC (USA) and T. Law-ley of Emory University (USA) for providing the HMEC-1 cells. Many thanks are also due to Leonie Kayser for helpful discussions and technical support!
Conflicts of Interest
The authors declare no conflicts of interest.
References
- Holdenrieder, O.; Rudow, A.; Aas, G. Die Gattung Salix. Eine Einführung in die Vielfalt, Biologie und Ökologie der Weiden | The Genus Salix: An introduction to the diversity, biology and ecology of willows. Schweiz. Z. Forstwes. 1999, 150, 405–411. [Google Scholar] [CrossRef][Green Version]
- Perttu, K.L. Environmental justification for short-rotation forestry in Sweden. Biomass Bioenergy 1998, 15, 1–6. [Google Scholar] [CrossRef]
- Stott, K.G. Willows in the service of man. Proc. R. Soc. Edinb. Sect. B 1991, 98, 169–182. [Google Scholar] [CrossRef]
- Mahdi, J.G.; Mahdi, A.J.; Mahdi, A.J.; Bowen, I.D. The historical analysis of aspirin discovery, its relation to the willow tree and antiproliferative and anticancer potential. Cell Prolif. 2006, 39, 147–155. [Google Scholar] [CrossRef]
- Stone, E. XXXII. An account of the success of the bark of the willow in the cure of agues. In a letter to the Right Honourable George Earl of Macclesfield, President of R. S. from the Rev. Mr. Edward Stone, of Chipping-Norton in Oxfordshire. Philos. Trans. R. Soc. Lond. 1763, 53, 195–200. [Google Scholar] [CrossRef]
- MacLagan, T. The treatment of acute rheumatism by salicin and salicylic acid. Lancet 1876, 107, 383–384. [Google Scholar] [CrossRef]
- Wagner, I.; Biegert, C.; Heide, L. Phytoanalgetika: Aktuelle Forschungsergebnisse zur Weidenrinde. Pharm. Ztg. 2003, 148, 21–32. [Google Scholar]
- Wichtl, M.; Willuhn, G.; Loew, D. Weidenrinde-Salicis cortex. In Wichtl–Teedrogen und Phytopharmaka: Ein Handbuch für die Praxis; Blaschek, W., Ed.; Wissenschaftliche Verlagsgesellschaft Stuttgart: Stuttgart, Germany, 2015; pp. 575–577. [Google Scholar]
- Committee on Herbal Medicinal Products (HMPC). European Union Herbal Monograph on Salix [Various Species Including, S. purpurea L., S. daphnoides Vill., S. fragilis L.], Cortex: EMA/HMPC/860630/2016—Corr. 2017; Committee on Herbal Medicinal Products (HMPC): Amsterdam, The Netherlands, 2017. [Google Scholar]
- Meier, B.; Meier-Liebi, M. Salix; Hagers Enzyklopädie der Arzneistoffe und Drog; Wissenschaftliche Verlagsgesellschaft Stuttgart: Stuttgart, Germany, 2007; pp. 81–115. [Google Scholar]
- Nahrstedt, A.; Schmidt, M.; Jäggi, R.; Metz, J.; Khayyal, M.T. Willow bark extract: The contribution of polyphenols to the overall effect. Wien. Med. Wochenschr. 2007, 157, 348–351. [Google Scholar] [CrossRef]
- Chrubasik, S.; Eisenberg, E.; Balan, E.; Weinberger, T.; Luzzati, R.; Conradt, C. Treatment of low back pain exacerbations with willow bark extract: A randomized double-blind study. Am. J. Med. 2000, 109, 9–14. [Google Scholar] [CrossRef]
- Chrubasik, S.; Künzel, O.; Model, A.; Conradt, C.; Black, A. Treatment of low back pain with a herbal or synthetic anti-rheumatic: A randomized controlled study. Willow bark extract for low back pain. Rheumatology 2001, 40, 1388–1393. [Google Scholar] [CrossRef]
- Schmid, B.; Kötter, I.; Heide, L. Pharmacokinetics of salicin after oral administration of a standardised willow bark extract. Eur. J. Clin. Pharmacol. 2001, 57, 387–391. [Google Scholar] [CrossRef] [PubMed]
- Antoniadou, K.; Herz, C.; Le, N.P.K.; Mittermeier-Kleßinger, V.K.; Förster, N.; Zander, M.; Ulrichs, C.; Mewis, I.; Hofmann, T.; Dawid, C.; et al. Identification of salicylates in willow bark (Salix cortex) for targeting peripheral inflammation. Int. J. Mol. Sci. 2021, 22, 11138. [Google Scholar] [CrossRef] [PubMed]
- Sobeh, M.; Mahmoud, M.F.; Rezq, S.; Alsemeh, A.E.; Sabry, O.M.; Mostafa, I.; Abdelfattah, M.A.O.; El-Allem, K.A.; El-Shazly, A.M.; Yasri, A.; et al. Salix tetrasperma Roxb. Extract alleviates neuropathic pain in rats via modulation of the Nf-κb/TNF-α/NOX/iNOS pathway. Antioxidants 2019, 8, 482. [Google Scholar] [CrossRef] [PubMed]
- Wahid, A.; Hamed, A.N.; Eltahir, H.M.; Abouzied, M.M. Hepatoprotective activity of ethanolic extract of Salix subserrata against CCl4-induced chronic hepatotoxicity in rats. BMC Complement. Altern. Med. 2016, 16, 263. [Google Scholar] [CrossRef] [PubMed]
- Förster, N.; Antoniadou, K.; Zander, M.; Baur, S.; Mittermeier-Kleßinger, V.K.; Dawid, C.; Ulrichs, C.; Mewis, I. Chemoprofiling as breeding tool for pharmaceutical use of Salix. Front. Plant Sci. 2021, 12, 579820. [Google Scholar] [CrossRef]
- Dommisse, R.A.; Van Hoof, L.; Vlietinck, A.J. Structural analysis of phenolic glucosides from salicaceae by NMR spectroscopy. Phytochemistry 1986, 25, 1201–1204. [Google Scholar] [CrossRef]
- Zapesochnaya, G.G.; Kurkin, V.A.; Braslavskii, V.B.; Filatova, N.V. Phenolic compounds of Salix acutifolia bark. Chem. Nat. Compd. 2002, 38, 314–318. [Google Scholar] [CrossRef]
- Al Bittar, S.; Mora, N.; Loonis, M.; Dangles, O. A simple synthesis of 3-deoxyanthocyanidins and their O-glucosides. Tetrahedron 2016, 72, 4294–4302. [Google Scholar] [CrossRef]
- Kammerer, B.; Kahlich, R.; Biegert, C.; Gleiter, C.H.; Heide, L. HPLC-MS/MS analysis of willow bark extracts contained in pharmaceutical preparations. Phytochem. Anal. 2005, 16, 470–478. [Google Scholar] [CrossRef]
- Naidoo, L.A.C.; Drewes, S.E.; Van Staden, J.; Hutchings, A. Exocarpic acid and other compounds from tubers and inflorescences of Sarcophyte sanguinea. Phytochemistry 1992, 31, 3929–3931. [Google Scholar] [CrossRef]
- Thieme, H. Isolierung eines neuen Phenolglykosids aus Salix triandra L. Naturwissenschaften 1963, 50, 571. [Google Scholar] [CrossRef]
- Bassanini, I.; Krejzová, J.; Panzeri, W.; Monti, D.; Křen, V.; Riva, S. A sustainable one-pot, two-enzyme synthesis of naturally occurring arylalkyl glucosides. ChemSusChem 2017, 10, 2040–2045. [Google Scholar] [CrossRef] [PubMed]
- Thieme, H. Isoierung eines neuen Phenolglykosids aus Salix viminalis L. Naturwissenschaften 1964, 51, 217. [Google Scholar] [CrossRef]
- Binns, W.W.; Blunden, G.; Woods, D.L. Distribution of leucoanthocyanidins, phenolic glycosides and imino-acids in leaves of Salix species. Phytochemistry 1968, 7, 1577–1581. [Google Scholar] [CrossRef]
- An, R.-B.; Kim, H.C.; Tian, Y.H.; Kim, Y.C. In vitro free radical scavenging and hepatoprotective compound from Sanguisorbae radix. Nat. Prod. Sci. 2005, 11, 119–122. [Google Scholar] [CrossRef]
- Schwindl, S. Phytochemische und Chemotaxonomische Studien zu Juglans regia L. und Untersuchungen zur α-Glucosidasehemmung. Doctoral Dissertation, University of Regensburg, Regensburg, Germany, 2020. [Google Scholar]
- Hashida, K.; Makino, R.; Ohara, S. Amination of pyrogallol nucleus of condensed tannins and related polyphenols by ammonia water treatment. Holzforschung 2009, 63, 319–326. [Google Scholar] [CrossRef]
- Baldé, A.M.; Pieters, L.A.; Gergely, A.; Kolodziej, H.; Claeys, M.; Vlietinck, A. A-type proanthocyanidins from stem-bark of Pavetta owariensis. Phytochemistry 1991, 30, 337–342. [Google Scholar] [CrossRef]
- Korver, O.; Wilkins, C.K. Circular dichroism spectra of flavanols. Tetrahedron 1971, 27, 5459–5465. [Google Scholar] [CrossRef]
- Chaturvedula, V.S.P.; Huang, R. Isolation and NMR spectral studies of dihydromyricetin. J. Pharmacogn. Phytochem. 2013, 2, 113–115. [Google Scholar]
- Petereit, F.; Kolodziej, H.; Nahrstedt, A. Flavan-3-ols and proanthocyanidins from Cistus incanus. Phytochemistry 1991, 30, 981–985. [Google Scholar] [CrossRef]
- Slade, D.; Ferreira, D.; Marais, J.P.J. Circular dichroism, a powerful tool for the assessment of absolute configuration of flavonoids. Phytochemistry 2005, 66, 2177–2215. [Google Scholar] [CrossRef] [PubMed]
- Hsu, F.-L.; Nonaka, G.-I.; Nishioka, I. Acylated flavanols and procyanidins from Salix sieboldiana. Phytochemistry 1985, 24, 2089–2092. [Google Scholar] [CrossRef]
- Jürgenliemk, G.; Petereit, F.; Nahrstedt, A. Flavan-3-ols and procyanidins from the bark of Salix purpurea L. Pharmazie 2007, 62, 231–234. [Google Scholar] [CrossRef] [PubMed]
- Shoji, T.; Mutsuga, M.; Nakamura, T.; Kanda, T.; Akiyama, H.; Goda, Y. Isolation and structural elucidation of some procyanidins from apple by low-temperature nuclear magnetic resonance. J. Agric. Food Chem. 2003, 51, 3806–3813. [Google Scholar] [CrossRef] [PubMed]
- Wiesneth, S.; Petereit, F.; Jürgenliemk, G. Salix daphnoides: A screening for oligomeric and polymeric proanthocyanidins. Molecules 2015, 20, 13764–13779. [Google Scholar] [CrossRef] [PubMed]
- Barrett, M.W.; Klyne, W.; Scopes, P.M.; Fletcher, A.C.; Porter, L.J.; Haslam, E. Plant proanthocyanidins. Part 6. Chiroptical studies. Part 95. Circular dichroism of procyanidins. J. Chem. Soc. Perkin Trans. 1 1979, 2375–2377. [Google Scholar] [CrossRef]
- Saito, A.; Nakajima, N.; Tanaka, A.; Ubukata, M. Synthetic studies of proanthocyanidins. Part 2: Stereoselective gram-scale synthesis of procyanidin-B3. Tetrahedron 2002, 58, 7829–7837. [Google Scholar] [CrossRef]
- Wiesneth, S. Phytochemische Untersuchung des Phenolischen Inhaltsstoffspektrums in Salix Spezies Unter Besonderer Berücksichtigung der Flavan-3-ole. Doctoral Dissertation, University of Regensburg, Regensburg, Germany, 2019. [Google Scholar]
- Fujii, W.; Toda, K.; Kawaguchi, K.; Kawahara, S.-I.; Katoh, M.; Hattori, Y.; Fujii, H.; Makabe, H. Syntheses of prodelphinidin B3 and C2, and their antitumor activities through cell cycle arrest and caspase-3 activation. Tetrahedron 2013, 69, 3543–3550. [Google Scholar] [CrossRef]
- Esatbeyoglu, T.; Wray, V.; Winterhalter, P. Dimeric procyanidins: Screening for B1 to B8 and semisynthetic preparation of B3, B4, B6, And B8 from a polymeric procyanidin fraction of white willow bark (Salix alba). J. Agric. Food Chem. 2010, 58, 7820–7830. [Google Scholar] [CrossRef]
- Sun, D.; Wong, H.; Foo, L.Y. Proanthocyanidin dimers and polymers from Quercus dentata. Phytochemistry 1987, 26, 1825–1829. [Google Scholar] [CrossRef]
- Ruuhola, T.; Julkunen-Tiitto, R.; Vainiotalo, P. In vitro degradation of willow salicylates. J. Chem. Ecol. 2003, 29, 1083–1097. [Google Scholar] [CrossRef] [PubMed]
- Knuth, S.; Schübel, H.; Hellemann, M.; Jürgenliemk, G. Catechol, a bioactive degradation product of salicortin, reduces TNF-α induced ICAM-1 expression in human endothelial cells. Planta Med. 2011, 77, 1024–1026. [Google Scholar] [CrossRef] [PubMed]
- Symma, N.; Hensel, A. Advanced analysis of oligomeric proanthocyanidins: Latest approaches in liquid chromatography and mass spectrometry based analysis. Phytochem. Rev. 2022, 21, 809–833. [Google Scholar] [CrossRef]
- Thieme, H. Die Phenolglykosider der Salicaceen 5. Mitteilung: Untersuchungen über die Glykosidspektren und den Glykosidgehalt der mitteldeutschen Salixarten. Pharmazie 1965, 20, 570–574. [Google Scholar] [CrossRef] [PubMed]
- Shao, Y.; Lahloub, M.F.; Meier, B.; Sticher, O. Isolation of phenolic compounds from the bark of Salix pentandra. Planta Med. 1989, 55, 617–618. [Google Scholar] [CrossRef]
- Tawfeek, N.; Mahmoud, M.F.; Hamdan, D.I.; Sobeh, M.; Farrag, N.; Wink, M.; El-Shazly, A.M. Phytochemistry, pharmacology and medicinal uses of plants of the genus Salix: An updated review. Front. Pharmacol. 2021, 12, 593856. [Google Scholar] [CrossRef]
- Knuth, S.; Abdelsalam, R.M.; Khayyal, M.T.; Schweda, F.; Heilmann, J.; Kees, M.G.; Mair, G.; Kees, F.; Jürgenliemk, G. Catechol conjugates are in vivo metabolites of salicis cortex. Planta Med. 2013, 79, 1489–1494. [Google Scholar] [CrossRef]
- Pobłocka-Olech, L.; Krauze-Baranowska, M. SPE-HPTLC of procyanidins from the barks of different species and clones of Salix. J. Pharm. Biomed. Anal. 2008, 48, 965–968. [Google Scholar] [CrossRef]
- Bate-Smith, E.C. Phytochemistry of proanthocyanidins. Phytochemistry 1975, 14, 1107–1113. [Google Scholar] [CrossRef]
- Jay, M. Distribution des flavonoides chez les Bruniacées. Taxon 1967, 16, 484–488. [Google Scholar] [CrossRef]
- Jay, M. Chemotaxonomic researches on vascular plants. XIX. Flavonoid distribution in the Pittosporaceae. Bot. J. Linn. Soc. 1969, 62, 423–429. [Google Scholar] [CrossRef]
- Foo, L.Y.; Porter, L.J. Prodelphinidin polymers: Definition of structural units. J. Chem. Soc. Perkin Trans. 1 1978, 711, 1186–1190. [Google Scholar] [CrossRef]
- Freischmidt, A.; Jürgenliemk, G.; Kraus, B.; Okpanyi, S.; Müller, J.; Kelber, O.; Weiser, D.; Heilmann, J. Contribution of flavonoids and catechol to the reduction of ICAM-1 expression in endothelial cells by a standardised Willow bark extract. Phytomedicine 2012, 19, 245–252. [Google Scholar] [CrossRef] [PubMed]
- Zheng, L.T.; Ryu, G.M.; Kwon, B.M.; Lee, W.-H.; Suk, K. Anti-inflammatory effects of catechols in lipopolysaccharide-stimulated microglia cells: Inhibition of microglial neurotoxicity. Eur. J. Pharmacol. 2008, 588, 106–113. [Google Scholar] [CrossRef] [PubMed]
- Qiang, M.; Kinneer, K. Chemoprotection by phenolic antioxidants. Inhibition of tumor necrosis factor α induction in macrophages. J. Biol. Chem. 2002, 277, 2477–2484. [Google Scholar] [CrossRef]
- Untergehrer, M.; Kiermaier, J.; Reintjes, S.; Heilmann, J.; Jürgenliemk, G. Identification of phase-II metabolites from human serum samples after oral intake of a willow bark extract. Phytomedicine 2019, 57, 396–402. [Google Scholar] [CrossRef]
- European Scientific Cooperative on Phytotherapy. Salicis Cortex (Willow Bark). 2017. Available online: www.escop.com/downloads/salix/ (accessed on 11 February 2026).
- Weidenrinde Salicis cortex. In Europäisches Arzneibuch 10. Auflage, Grundwerk 2020, Amtliche Deutsche Ausgabe; Deutscher Apotheker Verlag: Stuttgart, Germany, 2020; pp. 2498–2499.
- Czochanska, Z.; Foo, L.Y.; Newman, R.H.; Porter, L.J. Polymeric proanthocyanidins. Stereochemistry, structural units, and molecular weight. J. Chem. Soc. Perkin Trans. 1 1980, 2278–2286. [Google Scholar] [CrossRef]
- Eberhardt, T.L.; Young, R.A. Conifer seed cone proanthocyanidin polymers: Characterization by 13C NMR spectroscopy and determination of antifungal activities. J. Agric. Food Chem. 1994, 42, 1704–1708. [Google Scholar] [CrossRef]
- Newman, R.H.; Porter, L.J.; Foo, L.Y.; Johns, S.R.; Willing, R.I. High-resolution 13C NMR studies of proanthocyanidin polymers (condensed tannins). Magn. Reson. Chem. 1987, 25, 118–124. [Google Scholar] [CrossRef]
- Wiesneth, S.; Aas, G.; Heilmann, J.; Jürgenliemk, G. Investigation of the flavan-3-ol patterns in willow species during one growing-season. Phytochemistry 2018, 145, 26–39. [Google Scholar] [CrossRef]


Disclaimer/Publisher’s Note: The statements, opinions and data contained in all publications are solely those of the individual author(s) and contributor(s) and not of MDPI and/or the editor(s). MDPI and/or the editor(s) disclaim responsibility for any injury to people or property resulting from any ideas, methods, instructions or products referred to in the content. |
© 2026 by the authors. Licensee MDPI, Basel, Switzerland. This article is an open access article distributed under the terms and conditions of the Creative Commons Attribution (CC BY) license.