Abstract
Fluorinated nitriles have been proposed as low-global-warming-potential substitutes for industrial applications such as plasma etching and as dielectric materials in high-voltage equipment. FT-IR spectroscopy was used to measure the radiative efficiency of CH2FCN and its reactivity towards Cl and OH radicals, and to determine products from the Cl reaction. Relative rate experiments yielded rate constants for Cl and OH reactions of (2.1 ± 0.3) × 10−14 and (7.0 ± 1.0) × 10−14 cm3 molecule−1 s−1, respectively. The estimated atmospheric lifetime of CH2FCN with respect to radical attack was estimated to be 0.45 years, which, combined with the radiative efficiency of 0.042 W m−2 ppb−1, implies a 100-year global warming potential of 20. FCOCN was observed as the only organic product of the Cl-atom reaction in air, consistent with a dominant role for H-abstraction. Absolute infrared cross-sections for FCOCN were determined, to assist future experiments where this molecule may be formed. Quantum calculations at the CBS-APNO//B2PLYP-D3/cc-pVTZ level indicate similar energy barriers to addition and abstraction for OH radical attack, but the looser transition state and greater opportunity for tunneling also favor abstraction in this case.
1. Introduction
The Kigali Amendment to the Montreal Protocol [1] regulates environmentally persistent compounds that strongly absorb outgoing infrared (IR) radiation from the Earth’s surface, in order to mitigate climate change. With this motivation, there are efforts underway to replace industrial chemicals that possess high global warming potentials (GWPs). The GWP metric of a compound indicates the integrated amount of IR absorption by this compound, if introduced into the atmosphere, over a specified time interval (100 years for the GWP100) on a mass basis, relative to carbon dioxide [2]. Perfluoroalkanes have been widely used as reagents in the plasma etching of wafers for microelectronic manufacture, and an example compound, C2F6, has a GWP100 of, ca., 13,000 [3]. The introduction of reactive functional groups that shorten the lifetime in the atmosphere diminish the GWP. The quantification of this metric requires assessment of the IR absorption in the atmospherically relevant region, combined with the determination of atmospheric lifetime. This lifetime is typically controlled by the rate of consumption by naturally occurring hydroxyl radicals (OH) along with a smaller contribution by atomic chlorine (Cl). Fluoroacetonitrile, CH2FCN, and other nitriles have been proposed as plasma etchants [4], but presently, the information needed to determine the GWP of CH2FCN is unavailable. Accordingly, we present its measured IR spectrum and kinetics with OH and Cl to determine this GWP. We also compare these results with quantum chemistry analysis to assess the usefulness of theoretical analysis of this and similar compounds.
Fluorinated nitriles exhibit favorable dielectric constants and have been suggested [5] as substitutes for sulfur hexafluoride, SF6 (GWP100 ~25,000 [3]), used to prevent arcing in high-voltage equipment. This has motivated recent studies of perfluoronitrile chemistry [5,6,7,8]. We speculate that the GWP of such substitutes, which lie in the range of 200–2000 [7], could be lowered further by the inclusion of C-H bonds. We note that this could allow the formation of cyanoformyl fluoride, FCOCN, as an atmospheric degradation product. This molecule was first prepared in 1960 by Tullock and Coffman [9], and in 1991, the complete IR spectrum was obtained and analyzed by Balfour et al. [10]. However, IR absorption cross-sections remain unavailable but are central to the determination of the yield of FCOCN. We chose CH2FCN in part as a molecule likely to form FCOCN in large quantities during radical-initiated oxidation. We present a photochemical synthesis of FCOCN, which avoids the original use [9] of toxic phosgene and hydrogen cyanide, and quantify the IR absorbance of the pure compound. These data can then be used to evaluate FCOCN formation from other species.
When nitriles react with radicals, there is the possibility for two reaction pathways: the abstraction of an H-atom or addition to the CN group, as exemplified by acetonitrile, CH3CN. For OH, both pathways are important at ambient conditions, while Cl proceeds by abstraction [11]. There are no prior measurements on CH2FCN for comparison, but we note that CH2FCN is isoelectronic with hydroxyacetonitrile, HOCH2CN, a species which has recently been detected in interstellar nebulae [12] and in smoke plumes from wildfires [13]. Its atmospheric reactions with OH were evaluated computationally [14] and are compared with the measurements here. For OH + CH2FCN, we predict that H-abstraction dominates, based on ab initio computations for the reaction pathways. The GWP100 is estimated as 20, which is indeed an order of magnitude smaller than for perfluoronitriles.
2. Results
2.1. Infrared Spectra
We measured the CH2FCN IR spectrum and validated the Beer–Lambert law (Section 4.1) applied at the band peaks. This is demonstrated in Figure 1.
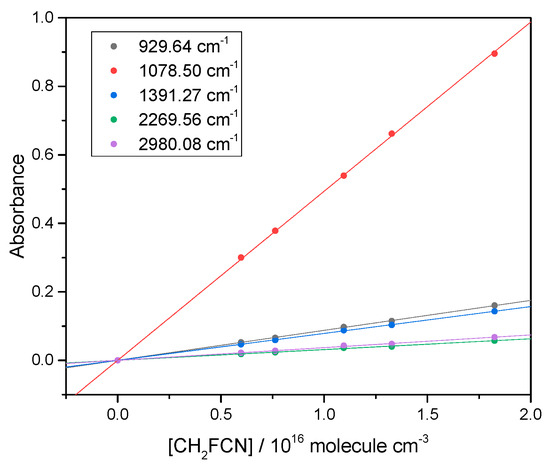
Figure 1.
Beer–Lambert plots for peaks in the CH2FCN IR spectrum, to check that base e absorbance is proportional to concentration. Each line corresponds to a different band.
Absolute cross-sections are plotted as a function of wavenumber in Figure 2. Also shown there are anharmonic computed vibrational transitions, which reproduce the band centers well and account even for the weak overtones and combination peaks. The overlap between this spectrum and the radiative forcing efficiency (the distribution of the Earth’s emitted IR, some of which is intercepted by greenhouse gases) evaluated as outlined by Hodnebrog et al. [2] yields a radiative efficiency (RE) of CH2FCN as 0.042 W m−2 ppb−1. Two peaks which lie within the 500–1500 cm−1 region mainly contribute to this RE, the strong absorbance at 1070 cm−1 from C-F stretching and the moderate absorbance at 918 cm−1 due to C-C stretching. The computed spectrum shows two weak peaks below the ~550 cm−1 instrumental cutoff, which would contribute less than 1% to the RE.
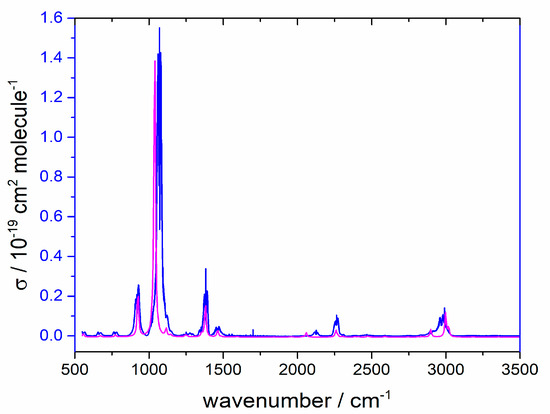
Figure 2.
Measured base e cross-section for CH2FCN at 292 K (blue line) and computed spectrum with an arbitrary vertical scale (magenta line).
Following its synthesis, we obtained the IR spectrum of FCOCN. The check for proportionality between absorbance A and concentration is shown in Figure 3, and the cross-sections are plotted in Figure 4.
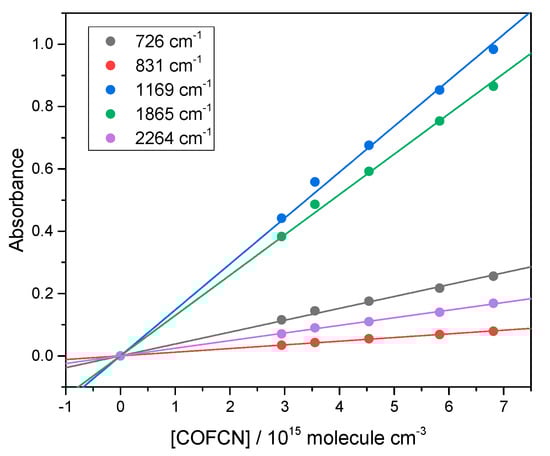
Figure 3.
Beer–Lambert plots at band peaks for FCOCN demonstrating linearity.
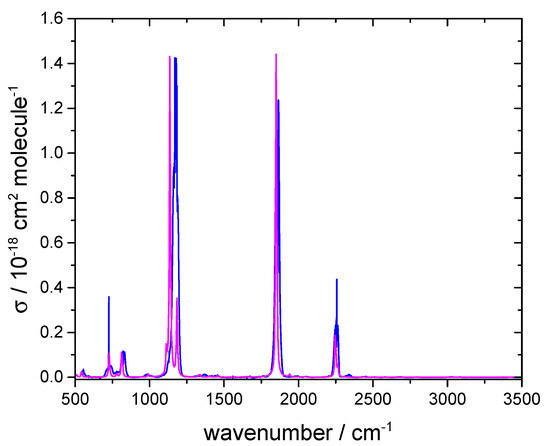
Figure 4.
Measured base e cross-section for FCOCN at 292 K (blue line) and computed spectrum with an arbitrary vertical scale (magenta line).
Again, the simulated IR spectrum is in good agreement with the measured spectrum and indicates that there are no major impurities causing unassigned bands. The band observed at 2255 cm−1 corresponds to C≡N stretching, while the band at 1869 cm−1 corresponds to C=O stretching. Experimental and calculated band centers match to within 2 cm−1. The bands in the fingerprint region also align closely between the two spectra. We employed the carbonyl band for quantifying FCOCN, with an integrated band strength (base e) of 3.59 10−17 cm molecule−1 over 1862–1880 cm−1. This is comparable to 4.6 10−17 cm molecule−1 for carbonyl stretching in COF2 [15].
2.2. Kinetic Measurements
The rate coefficient k1 for the reaction
was measured relative to k2 for
by monitoring the consumption of both organic reactants using their IR bands at 1090–1045 and 1209–1231 cm−1, respectively. Initial checks showed that, without UV irradiation, there was no observable loss of reactants. Figure 5 is an example plot of the concentration data, whose slope equals the ratio k1/k2. Table 1 summarizes the partial pressures p for four experiments (1 torr = 1.333 mbar) at 292 K, at a total pressure of 750 torr made up with Ar bath gas.
Cl + CH2FCN → products
Cl + CHCl3 → products
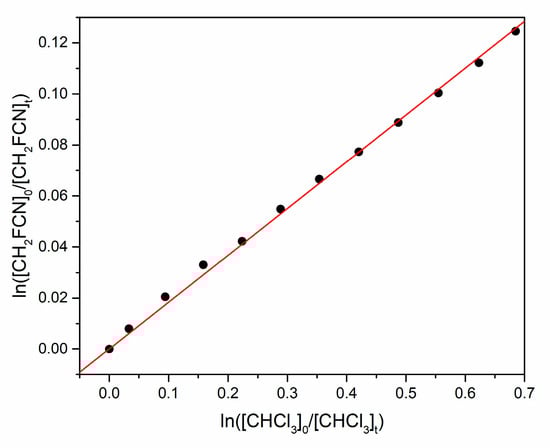
Figure 5.
Relative rate plot for simultaneous loss of CH2FCN and CHCl3 by reaction with atomic Cl.

Table 1.
Conditions for relative rate measurements of Cl + CH2FCN.
The uncertainty quoted in the rate coefficient ratio is the 1σ statistical uncertainty in the slopes of plots like Figure 5. The JPL critical evaluation recommends k2 = (1.11 ± 0.17) × 10−13 cm3 molecule−1 s−1 at 292 K, with 1σ uncertainty [16]. Thus, our best estimate of k1 is (2.1 ± 0.3) × 10−14 cm3 molecule−1 s−1. The linearity of plots like Figure 5 and Figure 6 indicates that there is no significant secondary chemistry that consumes the organic reagents.
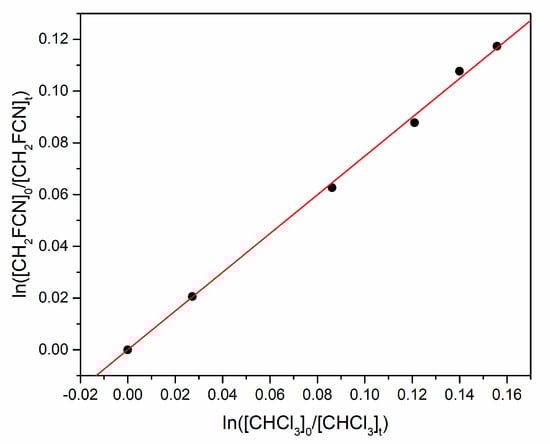
Figure 6.
Relative rate plot for simultaneous loss of CH2FCN and CHCl3 by reaction with OH.
Similarly, the rate coefficient k3 for the reaction
was measured relative to k4 for
by monitoring the consumption of organic reactants by their IR bands at 1398–1365 and 1212–1230 cm−1, respectively. Figure 6 is an example plot of the concentration data, whose slope equals the ratio k3/k4. Table 2 summarizes the experimental conditions for three experiments (1 torr = 1.333 mbar) at 291 K and 750 torr total pressure made up with Ar.
OH + CH2FCN → products
OH + CHCl3 → products
Table 2.
Conditions for relative rate measurements of OH + CH2FCN.
The JPL evaluation recommends k4 = (9.3 ± 1.4) × 10−14 cm3 molecule−1 s−1 at 291 K, with 1σ uncertainty [16]. Thus, our best estimate of k3 is (7.0 ± 1.0) × 10−14 cm3 molecule−1 s−1.
2.3. Product Studies
In order to gain insight into the likely atmospheric chemistry of CH2FCN following initial radical attack, experiments were performed in zero-air bath gas with Cl2 as the radical source and CH2FCN as the only organic reagent. The growth of products was monitored via their IR spectra. An example is shown in Figure 7.
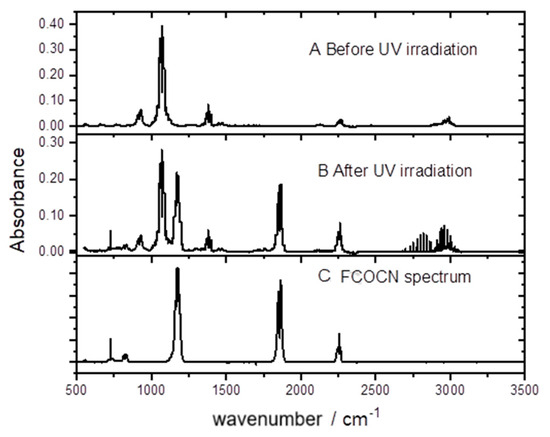
Figure 7.
Spectra of an irradiated CH2FCN/Cl2/air mixture.
It may be seen that FCOCN is a major product. This was quantified by plotting the concentration of FCOCN formed, determined via the carbonyl band strength, against the concentration of CH2FCN consumed. A correction was included for a dark loss of CH2FCN noted in these experiments of 0.5% per minute. The results are shown in Figure 8, whose slope gives a yield of 88%. HCl is also formed and accounts for the line spectrum in the 2700–3100 cm−1 region. We attempted to measure its yield and obtained 68%, but because HCl readily absorbs on surfaces, this is a lower bound.
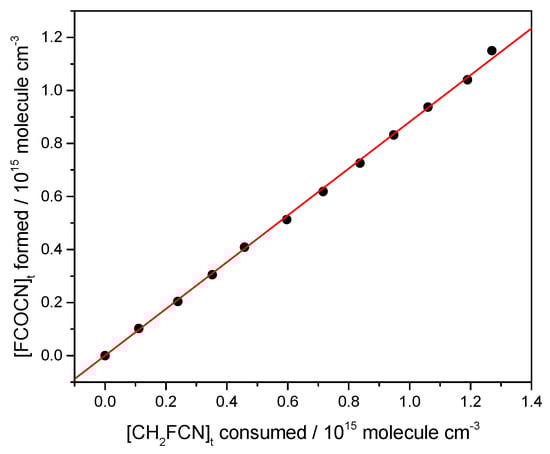
Figure 8.
Yield of FCOCN from an irradiated CH2FCN/Cl2/air mixture, starting with 0.24 torr of CH2FCN and 4.1 torr of Cl2 made up to 760 torr with zero air.
2.4. Pathways for Reaction with Hydroxyl
Quantum calculations were carried out to explore the addition and abstraction reaction pathways for OH with CH2FCN (Reaction (3)). The geometries of reactants, intermediates, transition states, and products are provided in Table S3. Figure 9 compares the relative enthalpies at 0 K along these two pathways, which both involve moderately bound pre-reactive complexes before distinct energy barriers.
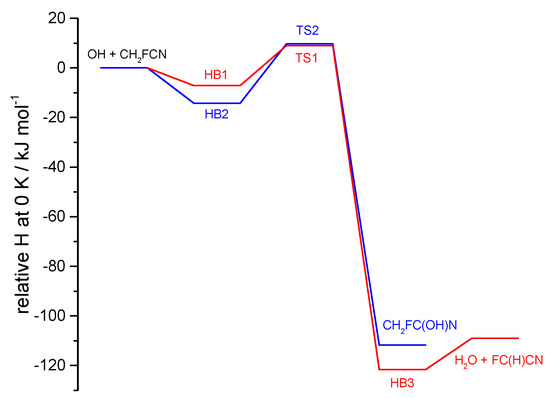
Figure 9.
CBS-APNO//B2PLYP-D3/cc-pVTZ energies including zero-point vibrational energy along the reaction paths for OH + CH2FCN. The H-abstraction channel is in red, and the addition channel is in blue.
For the abstraction reaction, there is weak (6.3 kJ mol−1) hydrogen bonding between the H of the incoming OH radical and the F atom in the complex HB1, before passage over a 9.8 kJ mol−1 barrier (relative to the reactants) to form H2O + FC(H)CN, via a hydrogen-bonded complex HB3 in the exit channel. For the addition reaction, there is a 13.6 kJ mol−1 hydrogen-bonded complex HB2 in the entrance channel, before a barrier of 10.5 kJ mol−1 on the way to formation of the CH2FC(OH)N addition product, where a new C-O bond is created.
3. Discussion
The high yields of FCOCN observed indicate that the abstraction channel dominates the Cl-atom kinetics (Reaction (1)). A plausible mechanism is that initially formed FC(H)CN reacts with O2 to create peroxy radicals, FC(H)(CN)OO. In the atmosphere, these could react with NO to yield alkoxy species, FC(H)(CN)O. The same species can be formed in the laboratory by the peroxy self-reaction ROO + ROO → RO + RO + O2, which is favored at the high radical concentrations used in experiments (high compared to the atmosphere). The C-H bond is weak in such alkoxy radicals, because the loss of H· is accompanied by C-O· rearrangement to C=O, so H is readily removed by collision with O2 to make HO2. This leads to the observed FCOCN product. In fact, Figure 7 shows no other IR-active product (except HCl, the other H-abstraction product). Guo et al. [7] argued that addition would ultimately lead to the creation of nitrogen oxides, but none were observed here. We speculate that the yield of FCOCN is essentially 1, and that the measurement of 0.88 (Figure 8) might indicate some loss of FCOCN on the walls of the IR cell. We suggest that the yield of FCOCN can be represented as 0.9 ± 0.1.
For Reaction (3) with hydroxyl, the reaction profiles in Figure 9 show that the transition state (TS) energies for the competing pathways are essentially equal (to 0.7 kJ mol−1, well within the uncertainty of such calculations which may be several kJ mol−1). There are two factors that will favor abstraction over addition. One is quantum mechanical tunneling, where the light H-atom transfer has an imaginary frequency of 1063 i cm−1 vs. 530 i cm−1 for C-O bond formation. The second factor is that the addition TS is tighter than for abstraction, with an entropy at 298 K smaller by about 16 J K−1 mol−1. This reflects the alignment of OH and CN groups in the TS, which are held parallel by dipole forces, so the barriers to torsion of the OH groups in the TSs are smaller for abstraction (4.6 kJ mol−1) than for addition (31 kJ mol−1). This entropy difference influences the pre-exponential factors, as seen below. Transition state theory estimates of abstraction and addition rate constants at 291 K are 9.3 × 10⁻¹⁴ and 8.0 × 10⁻¹⁵ cm3 molecule−1 s−1, respectively, consistent with these interpretations and suggesting a branching ratio of about 0.9 for abstraction by OH. The total rate constant is, ca., 40% larger than observed, which might arise from an underestimation of barrier heights by ~0.9 kJ mol−1, within the computational uncertainty. The computed Arrhenius expressions near room temperature are 2.3 × 10⁻¹² exp(−7.7 kJ mol−1/RT) cm3 molecule−1 s−1 and 5.5 × 10⁻¹³ exp(−10.2 kJ mol−1/RT) cm3 molecule−1 s−1 for TS1 and TS2, respectively. The activation energy difference is influenced in part by the greater tunneling at TS1.
We therefore expect Reaction (3) to be similar to the OH reaction with HOCH2CN, where abstraction was also proposed as the main pathway [14], for similar reasons, even though, in that case, the abstraction barrier was higher than for addition by ~4 kJ mol−1. The HOCH2CN abstraction barrier was 5 kJ mol−1 lower than that proposed here for CH2FCN, which largely accounts for k3 being about a factor of 4 smaller than for the predicted analogous abstraction from HOCH2CN.
We now consider the tropospheric lifetime of CH2FCN, τ, with respect to consumption by Cl and OH radicals. Given the average concentrations [Cl] = 3 × 10⁴ molecule cm−3 [17] and [OH] = 1 × 10⁶ molecule cm−3 [18], and that k3 ≈ 3 k1, the rate of loss via the Cl reaction is negligible, about 1% of that via OH. We also neglect minor stratospheric losses and employ [3]
to obtain τ = 0.45 years for the troposphere. This lifetime can be combined [2] with the radiative efficiency of 0.042 W m−2 ppb−1 to estimate the 100-year global warming potential as GWP100 = 20. This is small enough to make CH2FCN a relatively benign industrial chemical, from the climate change perspective. The incorporation of C-H bonds has shortened the lifetime, compared to perfluoronitriles, by an order of magnitude or more.
1/τ = k3[OH]
4. Materials and Methods
4.1. Materials
The reagents used were CH2FCN (Aldrich, St. Louis, MO, USA, 98% purity), CHCl3 (Mallinckrodt, St. Louis, MO, USA, 99.8%), and Cl2 (Matheson, Irving, TX, USA, 99.5%), which we purified by freeze-pump-thaw cycles with liquid nitrogen. H2 (MG Industries, Valley Forge, PA, USA, UHP grade), O2, and Ar (Air Liquide, Pasadena, TX, USA, >99.99% purity) and zero air (20% O2/80% N2, Airgas, Radnor, PA, USA, industrial grade) were used directly from their cylinders. Ozone was synthesized by passing pure O2 through an ozone generator (A2Z Ozone, Louisville, KY, USA) and separating the O3 from O2 in a trap filled with silica gel and cooled with an acetone/dry ice slush bath.
Cyanoformyl fluoride, FCOCN, was photochemically synthesized from a mixture of 5 torr of CH2FCN, 8 torr of Cl2, and 250 torr of zero air in a glass bulb exposed to 365 nm UV light. Small samples were taken from the bulb and analyzed by FT-IR spectroscopy to check for remaining traces of CH2FCN. UV exposure continued until the CH2FCN was consumed, and then the mixture was passed through a liquid nitrogen-cooled trap (77 K) which condensed the FCOCN, while the uncondensed air was removed through pumping. The liquid nitrogen trap was then replaced with an ethanol slush bath at 157 K. This temperature retained FCOCN and HCN in the trap, while more volatile impurities including excess Cl2 were removed through multiple freeze–pump–thaw cycles. IR analysis revealed 2.5% HCN, based on a 3220–3384 cm−1 band strength of 2.55 × 1017 cm molecule−1, obtained from the PNNL database [15]. To verify that there was no Cl2 present, H2 was added to a sample and, after UV irradiation, no HCl was detected.
Five known pressures of FCOCN up to 0.2 torr, corrected for the HCN component, were made up to a final pressure of 750 torr with Ar at 292 K and sent to the FT-IR instrument. Adherence to the Beer–Lambert law was verified for the major peaks. The concentration, absorbance, and path length data were incorporated into Equation (6):
where, with the path length ℓ in cm and c in molecule cm−3, the base e cross-section σ is obtained in cm2 molecule−1. We determine σ at every discrete frequency in the absorption spectrum, from the slope of a linear plot of measured A vs. the values of c. The same procedure was employed to evaluate the cross-sections of CH2FCN.
σ = 2.3026 A/(c ℓ)
4.2. Experimental Methods
The apparatus and methodology have been described previously [19]. Briefly, reagents are diluted in bath gas to 750 torr of pressure in a quartz multipass IR cell (path length ℓ = 240 cm) at room temperature. Sequential FT-IR spectra are taken at 1 cm−1 resolution over time. Radicals are created by continuous in situ UV photolysis of Cl2 at 365 nm for atomic Cl, or of O3/H2 mixtures at 254 nm, to create OH from O(1D) reaction with excess H2. Cl atoms were used for product formation studies with zero-air bath gas to simulate atmospheric conditions. Cl and OH were used in relative rate studies, where the consumption of CH2FCN (A) and an added reference compound, CHCl3 (B), was monitored. The rate coefficients ki are related via [20]
The quotients are the ratio of the initial species concentration to its later value at a time t. With kB known, kA can be obtained.
4.3. Computational Methods
IR spectra are simulated with second-order vibrational perturbation theory [21], as implemented in the Gaussian 16 code, rev A.03 [22]. The incorporation of anharmonicity avoids the empirical scaling of harmonic frequencies, and overtones and combination bands are included. Quantum calculations are made with the N07D basis set, designed for this task [21,23], and used with the B2PLYP density functional [24,25]. The computed vibrational spectral lines are then artificially broadened with Lorentzian functions (16 cm−1 FWHM) as a simple representation of the rotational structure which is not generally resolved for the polyatomic molecules in these experiments.
For potential energies along the OH + CH2FCN reaction paths, the geometries and harmonic frequencies (scaled as in [14] for zero-point vibrational energy) of stationary points were evaluated with B2PLYP-D3/cc-pVTZ density functional theory [24,26,27], followed by single-point energy evaluations with the CBS-APNO approximation to coupled cluster theory extrapolated to the infinite basis set limit [28]. The OH energy was lowered empirically by 0.83 kJ mol−1 to correct for its spin–orbit splitting.
Canonical transition state theory
with an Eckart correction κ for quantum mechanical tunneling, was applied as detailed in a prior study [14]. Internal hydroxyl rotors in the transition states for abstraction and addition were characterized through explicit analysis of the one-dimensional torsional potentials; otherwise, the partition functions Q were evaluated with the rigid-rotor harmonic-oscillator approximation. mTS is the number of optical isomers for the transition state, and E0 is the 0 K energy difference between the transition state and the reactants, including zero-point vibrational energy. The rate constants were evaluated with the MultiWell program [29].
Supplementary Materials
The following supporting information can be downloaded at https://www.mdpi.com/article/10.3390/molecules30030478/s1. Table S1: IR cross-sections of CH2FCN as a function of wavenumber; Table S2: IR cross-sections of FCOCN as a function of wavenumber; Table S3: Geometries of stationary points for OH reactions with CH2FCN.
Author Contributions
Conceptualization, R.S. and P.M.; methodology, R.S.; software, R.S.; validation, R.S., T.N. and P.M.; formal analysis, R.S. and T.N.; investigation, R.S. and T.N.; resources, P.M.; data curation, P.M.; writing—original draft preparation, R.S. and T.N.; writing—review and editing, P.M.; visualization, R.S., T.N. and P.M.; supervision, P.M.; project administration, P.M. All authors have read and agreed to the published version of the manuscript.
Funding
This research received no external funding.
Institutional Review Board Statement
Not applicable.
Informed Consent Statement
Not applicable.
Data Availability Statement
The original contributions presented in this study are included in the article/Supplementary Materials. Further inquiries can be directed to the corresponding author.
Acknowledgments
Computational facilities were purchased with support from the National Science Foundation under Award OAC-2117247.
Conflicts of Interest
The authors declare no conflicts of interest.
References
- Montreal Protocol to Protect the Ozone Layer. Available online: https://ozone.unep.org/sites/default/files/Handbooks/MP-Handbook-2020-English.pdf (accessed on 26 December 2024).
- Hodnebrog, ∅.; Etminan, M.; Fuglestvedt, J.S.; Marston, G.; Myhre, G.; Nielsen, C.J.; Shine, K.P.; Wallington, T.J. Global Warming Potentials and Radiative Efficiencies of Halocarbons and Related Compounds: A Comprehensive Review. Rev. Geophys. 2013, 51, 300–378. [Google Scholar] [CrossRef]
- Annex to the Scientific Assessment of Ozone Depletion 2022. Available online: https://www.unep.org/resources/publication/scientific-assessment-ozone-layer-depletion-2022 (accessed on 26 December 2024).
- Hsu, C.-Y.; Peng, S.; Stafford, N. Methods of Minimizing Plasma-Induced Sidewall Damage During Low K Etch Processes. U.S. Patent 10347498, 9 July 2019. [Google Scholar]
- Andersen, M.P.S.; Kyte, M.; Andersen, S.T.; Nielsen, C.J.; Nielsen, O.J. Atmospheric Chemistry of (CF3)2CFCN: A Replacement Compound for the Most Potent Industrial Greenhouse Gas, SF6. Environ. Sci. Technol. 2017, 51, 1321–1329. [Google Scholar] [CrossRef] [PubMed]
- Andersen, M.P.S.; Ohide, J.; Sølling, T.I.; Nielsen, O.J. Atmospheric chemistry of CF3CN: Kinetics and products of reaction with OH radicals, Cl atoms and O3. Phys. Chem. Chem. Phys. 2022, 24, 2638–2645. [Google Scholar] [CrossRef]
- Guo, Q.; Chen, L.; Kutsuna, S.; Quan, H.; Mizukado, J. Atmospheric chemistry of perfluoronitriles: Environmental impact and experimental evidence related to N2O and NO formation. Atmos. Environ. 2019, 198, 175–182. [Google Scholar] [CrossRef]
- Blázquez, S.; Antiñolo, M.; Nielsen, O.J.; Albaladejo, J.; Jiménez, E. Reaction kinetics of (CF3)2CFCN with OH radicals as a function of temperature (278–358 K): A good replacement for greenhouse SF6? Chem. Phys. Lett. 2017, 687, 297–302. [Google Scholar] [CrossRef]
- Tullock, C.W.; Coffman, D.D. Synthesis of fluorides by metathesis with sodium fluoride. J. Org. Chem. 1960, 25, 2016–2019. [Google Scholar] [CrossRef]
- Balfour, W.J.; Fougere, S.G.; Klapstein, D. The vibrational spectrum of cyanoformyl fluoride. Spectrochim. Acta Part A 1991, 47A, 1127–1130. [Google Scholar] [CrossRef]
- Tyndall, G.S.; Orlando, J.J.; Wallington, T.J.; Hurley, M.D. Products of the Chlorine-Atom- and Hydroxyl-Radical-Initiated Oxidation of CH3CN. J. Phys. Chem. A 2001, 105, 5380–5384. [Google Scholar] [CrossRef]
- Zeng, S.; Quénard, D.; Jiménez-Serra, I.; Martín-Pintado, J.; Rivilla, V.M.; Testi, L.; Martín-Doménech, R. First Detection of the Pre-Biotic Molecule Glycolonitrile (HOCH2CN) in the Interstellar Medium. Mon. Not. R. Astron. Soc. Lett. 2019, 484, L43–L48. [Google Scholar] [CrossRef]
- Finewax, Z.; Chattopadhyay, A.; Neuman, J.A.; Roberts, J.M.; Burkholder, J.B. Calibration of hydroxyacetonitrile (HOCH2CN) and methyl isocyanate (CH3NCO) isomers using I− chemical ionization mass spectrometry (CIMS). Atmos. Meas. Tech. 2024, 17, 6865–6873. [Google Scholar] [CrossRef]
- Marshall, P.; Burkholder, J.B. Kinetics and Thermochemistry of Hydroxyacetonitrile (HOCH2CN) and Its Reaction with Hydroxyl Radical. ACS Earth Space Chem. 2024, 8, 1933–1941. [Google Scholar] [CrossRef]
- Virtual Planetary Laboratory. Available online: https://vpl.astro.washington.edu/spectra/hcn.htm (accessed on 20 January 2025).
- Burkholder, J.B.; Sander, S.P.; Abbatt, J.; Barker, J.R.; Cappa, C.; Crounse, J.D.; Dibble, T.S.; Huie, R.E.; Kolb, C.E.; Kurylo, M.J.; et al. Chemical Kinetics and Photochemical Data for Use in Atmospheric Studies, Evaluation No. 19. Publication 19-5; NASA/JPL: Pasadena, CA, USA, 2019. Available online: https://jpldataeval.jpl.nasa.gov (accessed on 27 December 2024).
- Wingenter, O.W.; Sive, B.C.; Blake, N.J.; Blake, D.R.; Rowland, F.S. Atomic Chlorine Concentrations Derived from Ethane and Hydroxyl Measurements over the Equatorial Pacific Ocean: Implication for Dimethyl Sulfide and Bromine Monoxide. J. Geophys. Res. 2005, 110, D20308. [Google Scholar] [CrossRef]
- Prinn, R.G.; Weiss, R.F.; Miller, B.R.; Huang, J.; Alyea, F.N.; Cunnold, D.M.; Fraser, P.J.; Hartley, D.E.; Simmonds, P.G. Atmospheric Trends and Lifetime of CH3CCI3 and Global OH Concentrations. Science 1995, 269, 187–192. [Google Scholar] [CrossRef] [PubMed]
- Herath, T.N.; Clinch, E.C.; Orozco, I.; Raign, E.L.; Marshall, P. Relative rate and product studies of the reactions of atomic chlorine with tetrafluoroethylene, 1,2-dichloro-1,2-difluoroethylene, 1,1-dichloro-2,2-difluoroethylene, and hexafluoro-1,3-butadiene in the presence of oxygen. J. Phys. Chem. A 2016, 120, 7311–7319. [Google Scholar] [CrossRef]
- Atkinson, R. Kinetics and Mechanisms of the Gas-Phase Reactions of the Hydroxyl Radical with Organic Compounds under Atmospheric Conditions. Chem. Rev. 1985, 85, 69–201. [Google Scholar] [CrossRef]
- Barone, V.; Biczysko, M.; Bloino, J. Fully anharmonic IR and Raman spectra of medium-size molecular systems: Accuracy and interpretation. Phys. Chem. Chem. Phys. 2014, 16, 1759–1787. [Google Scholar] [CrossRef] [PubMed]
- Frisch, M.J.; Trucks, G.W.; Schlegel, H.B.; Scuseria, G.E.; Robb, M.A.; Cheeseman, J.R.; Scalmani, G.; Barone, V.; Petersson, G.A.; Nakatsuji, H.; et al. Gaussian 16 Rev. A.03; Gaussian, Inc.: Wallingford, CT, USA, 2016. [Google Scholar]
- Biczysko, M.; Panek, P.; Scalmani, G.; Bloino, J.; Barone, V. Harmonic and Anharmonic Vibrational Frequency Calculations with the Double-Hybrid B2PLYP Method: Analytic Second Derivatives and Benchmark Studies. J. Chem. Theory Comput. 2010, 6, 2115–2125. [Google Scholar] [CrossRef]
- Grimme, S. Semiempirical hybrid density functional with perturbative second-order correlation. J. Chem. Phys. 2006, 124, 034108. [Google Scholar] [CrossRef]
- Schwabe, T.; Grimme, S. Towards chemical accuracy for the thermodynamics of large molecules: New hybrid density functionals including non-local correlation effects. Phys. Chem. Chem. Phys. 2006, 8, 4398–4401. [Google Scholar] [CrossRef]
- Grimme, S.; Antony, J.; Ehrlich, S.; Krieg, H. A consistent and accurate ab initio parametrization of density functional dispersion correction (DFT-D) for the 94 elements H-Pu. J. Chem. Phys. 2010, 132, 154104. [Google Scholar] [CrossRef]
- Dunning, T.H., Jr. Gaussian basis sets for use in correlated molecular calculations. I. The atoms boron through neon and hydrogen. J. Chem. Phys. 1989, 90, 1007–1023. [Google Scholar] [CrossRef]
- Ochterski, J.W.; Petersson, G.A.; Montgomery, J.A., Jr. A complete basis set model chemistry. V. Extensions to six or more heavy atoms. J. Chem. Phys. 1996, 104, 2598–2619. [Google Scholar] [CrossRef]
- Barker, J.R.; Nguyen, T.L.; Stanton, J.F.; Aieta, C.; Ceotto, M.; Gabas, F.; Kumar, T.J.D.; Li, C.G.L.; Lohr, L.L.; Maranzana, A.; et al. MultiWell-2023.1 Software Suite; University of Michigan: Ann Arbor, MI, USA, 2023; Available online: https://multiwell.engin.umich.edu (accessed on 29 June 2023).
Disclaimer/Publisher’s Note: The statements, opinions and data contained in all publications are solely those of the individual author(s) and contributor(s) and not of MDPI and/or the editor(s). MDPI and/or the editor(s) disclaim responsibility for any injury to people or property resulting from any ideas, methods, instructions or products referred to in the content. |
© 2025 by the authors. Licensee MDPI, Basel, Switzerland. This article is an open access article distributed under the terms and conditions of the Creative Commons Attribution (CC BY) license (https://creativecommons.org/licenses/by/4.0/).