Abstract
A polymethacrylate matrix (PMM) is proposed for the solid-phase extraction and determination of tetracycline (TC). The study of the influence of medium acidity, temperature, and contact time on the extraction of tetracycline by PMM showed that tetracycline is extracted by the matrix in the form of a singly charged anion H2TC−, within the pH range of 8.9–9.7, with distribution coefficients reaching (5–6) × 103 mL/g. Following the extraction process using PMM and PMM-Au0, the direct determination of tetracycline in the solid phase is possible without an elution step. This is achieved by using as the analytical signal both the intrinsic absorption and the instrumentally measured peak area of the anionic form of tetracycline, H2TC−, in the matrix, with detection limits of 0.03 and 0.01 mg/L, respectively, and the fluorescence of tetracycline in PMM and PMM-Au0, with detection limits of 0.001 and 0.005 mg/L, respectively. The applicability of the digital colorimetry method for the quantitative determination of tetracycline based on its fluorescence in the solid phase is demonstrated. Methodologies for the determination of tetracycline using PMM and PMM-Au0 were developed and tested in the analysis of river and bottled water samples, biological fluid, as well as honey and milk samples.
1. Introduction
Tetracycline antibiotics are widely used today due to their low cost and broad spectrum of action. Tetracyclines are used for the treatment and prevention of infectious diseases in humans; they are actively used in veterinary medicine for the prevention and treatment of infectious diseases in animals, in feed production for rapid growth and weight gain of animals, and also in agriculture [1,2]. Furthermore, antibiotics are used in the food industry, including in the production of bottled water [3]. The widespread use of tetracyclines and non-compliance with the dosages of these drugs leads to their presence in food products of animal and plant origin, and in environmental objects: soils, surface and groundwater, and drinking water, where they can enter with wastewater from pharmaceutical and agricultural enterprises [4,5]. Accumulation in the body as a result of systematic intake of tetracycline can lead to a number of diseases: allergic reactions, metabolic disorders, dysbiosis, and can also cause bacterial resistance to the antibiotic. Consumption of drinking water containing even microquantities of antibiotics significantly accelerates the development of resistance [6]. To protect human health and ensure food safety, regulations controlling the quality of food products have been introduced [7]. Therefore, it is important to ensure proper quality control of food products and environmental objects containing residual amounts of antibiotics. Analysis of human urine allows for the assessment of the level of exposure to antibiotics ingested through food or water, and also plays an important role in clinical practice. In this regard, the development of highly sensitive, selective, and rapid methods for the determination of tetracycline in complex matrices is an urgent task in analytical chemistry.
Various methods are used for the determination of tetracycline, each having its own advantages and disadvantages. One of the most accurate and selective methods is chromatographic–mass spectrometric methods (HPLC-MS, LC-MS/MS); however, these methods require expensive equipment, highly qualified operators, and complex sample preparation, which limits their use in routine analysis, especially in small laboratories [8,9,10,11,12,13,14]. Immunochemical methods, despite their high sensitivity and rapidity, depend on the quality of the reagents used and the analysis conditions [15]. Some of the most accessible and easy-to-use are optical methods [16], such as spectrophotometry [1,17,18] and fluorimetry [19,20,21,22,23,24]. However, their main limitation in determining trace amounts of analytes in complex matrices (biological fluids, food products, environmental objects) is their low sensitivity and strong influence of matrix effects, which necessitates preliminary concentration and isolation of the analyte from complex media.
Among the many concentration methods, solid-phase extraction is one of the most effective, reproducible, and convenient for automation approaches [25,26], as well as for creating hybrid methods for substance determination combining concentration stages in the form of solid-phase extraction and detection of the analyte directly in the solid phase using optical methods. This approach allows for the elimination of the laborious elution step, minimization of analyte losses, reduction in analysis time, and an increase in its sensitivity due to the combination of concentration and measurement operations. A key element of such hybrid systems is the solid-phase extractant material, which must not only efficiently extract the target analyte from the complex matrix but also possess optimal optical characteristics for direct spectrophotometric and fluorimetric measurements. In this context, polymethacrylate polymers are of exceptional interest due to their high optical transparency and low intrinsic background fluorescence. We propose using a polymethacrylate matrix (PMM) as a solid-phase extractant, obtained by radical block polymerization of methacrylate monomers in the presence of polyethylene glycol 400 (PEG 400), thus realizing a hydrophobic framework in the form of a polymethacrylate base, providing structural rigidity and analyte accumulation, and a hydrophilic base in the form of PEG400, ensuring diffusion of the analyte into the matrix volume [27,28]. One of the key advantages of tetracycline as an analysis object is its intrinsic absorption in the visible region of the spectrum and its ability to exhibit intrinsic fluorescence under certain conditions [29]. This opens up the possibility for creating direct, label-free spectrophotometric and fluorimetric methods, the sensitivity of which can be enhanced by using PMM for solid-phase extraction of tetracycline (TC) and its subsequent determination in the solid phase by spectrophotometry and fluorimetry. For the targeted enhancement of the analytical signal of TC in PMM, gold nanoparticles (PMM-Au0) possessing surface plasmon resonance properties [5,30,31,32] were immobilized, and their introduction into PMM is intended to enhance interaction with TC during its extraction into PMM-Au0, which is promising for solving the problems of monitoring trace amounts of TC in biological fluids, food products, and environmental objects.
It can be stated that the determination using solid-phase extraction is more sensitive than that for aqueous tetracycline solutions. Aqueous tetracycline solutions possess low fluorescence quantum yields of ~10−3, which makes direct fluorimetry ineffective for the determination of trace quantities. This is due to rapid non-radiative processes in a protic medium, and enhancing fluorescence requires special conditions, such as organic solvents [29]. In the PMM polymer matrix, fluorescence enhancement is observed, which is due to both the concentration of the analyte and the influence of a less polar and protonated environment. This reduces the probability of quenching and promotes an increase in the efficiency of fluorescent emission.
Thus, the aim of the present work was to develop and study a hybrid method for the determination of TC, based on its solid-phase extraction into PMM and PMM-Au0 with subsequent direct quantitative measurement in the solid phase using spectrophotometry and fluorimetry.
2. Results and Discussion
2.1. Spectrophotometric TC Determination Using PMM
Tetracycline is an amphoteric molecule with multiple functional groups and, depending on pH, can exist in aqueous solutions in five ionic forms [33,34]. Figure 1A,B show the absorption spectra of TC in aqueous solutions with different pH values and in PMM after its extraction by the matrix from these solutions, respectively.
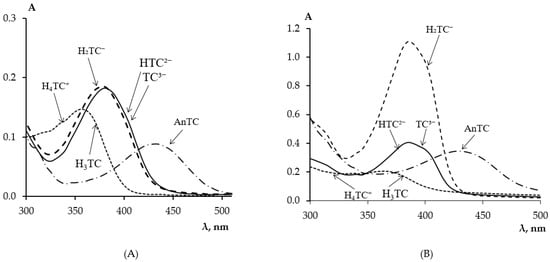
Figure 1.
Absorption spectra of TC in aqueous solutions (A) and in PMM (B) after its contact with a TC solution at different pH values: 1–0.5; 2–3.2; 3–9.3; 4–12.0; (CTC = 5 mg/L, tcontact = 60 min).
In a strong acidic medium at pH ≈ 0.5, tetracyclines are converted to anhydrotetracyclines, AnTC, according to the scheme presented in work [35], and exhibit a dark yellow color with an absorption maximum at 440 nm [36]. In an acidic medium at pH < 3.2, TC is in the cationic form H4TC+ with an absorption maximum at a wavelength of 430 nm. When the medium acidity changes from acidic to neutral 1.8 < pH < 7.6, TC transitions from H4TC+ to the zwitterionic form H3TC with an absorption maximum at a wavelength of 355 nm. In a weakly alkaline medium, deprotonation of the molecule continues, leading to the formation of the singly charged anionic form H2TC− 7.6 < pH < 9.6 with an absorption maximum at 380 nm. A further increase in pH promotes the deprotonation of the second phenolic hydroxyl of the phenolic diketone part, leading to the formation of the doubly charged anion HTC2− 9.6 < pH < 12 and at pH > 12, the triply charged anion TC3− is formed without changing the absorption spectrum characteristic of the anionic form H2TC−.
From the absorption spectra of TC in PMM (Figure 1B) after its solid-phase extraction from solutions of different acidity, it is evident that the pH of the solution affects the extraction of TC by the matrix from the solution. Table 1 presents the absorption maxima of the ionic forms of TC in aqueous solutions and in PMM depending on the medium acidity.

Table 1.
Absorption maxima of ionic forms of TC in aqueous solution and in PMM after its contact with the TC solution.
For the quantitative characterization of the extraction process of TC from solutions with different pH values, its distribution coefficients were determined, presented in Table 2. As can be seen, the best extraction of TC occurs from solutions with pH from 8.9 to 9.7 in the form H2TC−, with a small shoulder appearing on the right side of the TC absorption spectrum in PMM compared to its solution. This may be due to the coordination of TC by the calcium ion present in PMM as a cross-linking agent—calcium methacrylate. According to [37], TC forms a complex with the calcium ion in an aqueous solution in a 1:1 ratio at pH 7.5–11.7, and the absorption spectrum of this complex is identical to the absorption spectrum of TC in PMM. However, it should be noted that increasing the pH of the TC solution above 9.7 led to a decrease in TC extraction by PMM. Therefore, all further studies on the extraction of TC by the matrix and its determination by solid-phase spectrophotometry were carried out at pH 9.18 in a borate buffer medium.
Table 2.
Distribution coefficients of TC during its extraction by the matrix from solutions with different pH values (n = 3).
The optical density at the maximum absorption of TC in PMM at a wavelength of 385 nm (A385) or the absolute change in optical density, ΔA385 = A − A0, where A and A0 are the absorbances of the PMM at 385 nm after contact with the solution in the presence and absence of the TC, respectively, was used as the analytical signal.
The influence of the temperature of the TC solution on its solid phase extraction was assessed by the magnitude of the analytical signal ΔA385 after contact of the matrix with the TC solution upon heating in the range of 20–90 °C. From the dependence presented in Figure 2, it can be seen that the analytical signal is maximal after contact of PMM with antibiotic solutions at a temperature of 60–70 °C. With a further increase in temperature, a decrease in ΔA385 is observed. This is likely due to the degradation of the analyte at high temperatures. Based on the presented results, the extraction of TC by the matrix was carried out by heating the solutions to 60 °C.
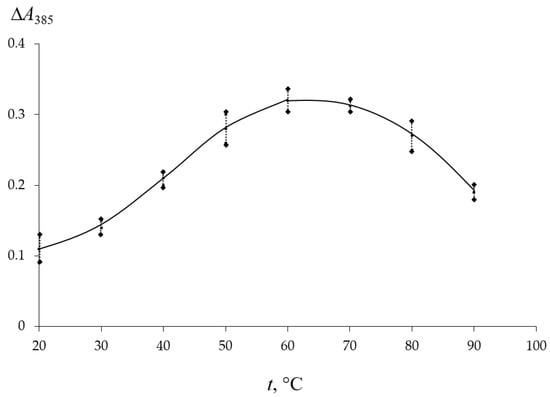
Figure 2.
Influence of temperature on the analytical signal ∆A385 after contact of PMM with TC solution CTC = 2 mg/L for 60 min.
The influence of the contact time of PMM with the TC solution on its extraction under optimal conditions was investigated by constructing dependencies of the analytical signal ∆A385 on the antibiotic concentration in the solution at different contact times. To increase the sensitivity of TC determination using PMM under acceptable conditions, the possibility of using the instrumentally measured peak area, bounded by the peak contour and its base—the segment connecting the start and end of the absorption maximum of the anionic form of TC H2TC− in the matrix at 385 nm, as the analytical signal was considered. This approach is associated with minimizing the influence of the intrinsic background absorption of PMM on the magnitude of the analytical signal. Table 3 presents the parameters of the calibration dependencies and the analytical characteristics of TC determination. From the given data, it can be seen that with an increase in the contact time of PMM with the TC solution, the sensitivity of the analyte determination increases, and its detection limit, calculated by the 3s-criterion, decreases. The use of the instrumentally measured peak area as the analytical signal allows for an increase in the sensitivity of TC determination. Figure S1 shows the absorption spectra of TC in the matrix after contact of the matrices with TC solutions of different concentrations at pH 9.18 and a contact time of 90 min.
Table 3.
Analytical characteristics of TC determination using PMM at different extraction times.
2.2. TC Determination by Its Intrinsic Fluorescence Using PMM and PMM-Au0
A promising alternative to the spectrophotometric determination of tetracyclines using PMM is the measurement of the direct fluorescence of the antibiotic in the solid phase. This approach is based on the ability of tetracyclines to fluoresce under UV irradiation without the introduction of additional reagents, as well as on the fact that the luminescence method generally surpasses spectrophotometry in sensitivity. Although aqueous solutions of TC are characterized by weak fluorescence, its extraction by PMM allows for the concentration of the antibiotic in the solid phase, which significantly increases the sensitivity of determination. It is important to note that after the extraction of TC, the PMM plate remains transparent, ensuring high accuracy of analytical signal measurements.
Figure 3 presents the fluorescence spectra of TC in PMM after contact of the matrix with a TC solution. It can be seen from the figure that the fluorescence intensity in the matrix regularly increases with an increase in the concentration of TC in the analyzed solution. The fluorescence maximum of TC in the PMM (520 nm) coincides with its fluorescence in organic solvents such as acetonitrile and dimethyl sulfoxide [29]. The coincidence of the fluorescence maximum of TC in PMM with the data for aprotic organic solvents indicates that the matrix provides TC with a similar environment that suppresses intermolecular proton transfer, characteristic of water. Additionally, the “rigidity” of the polymer environment restricts the mobility of the TC molecule, which may suppress non-radiative processes and likely leads to a higher fluorescence quantum yield compared to an aqueous solution.
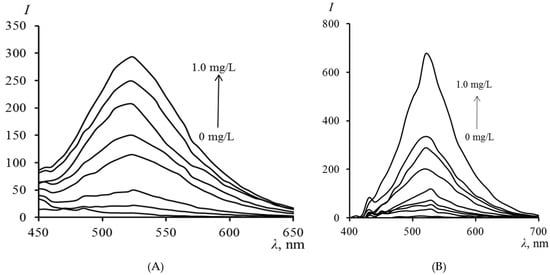
Figure 3.
Fluorescence spectra of TC in PMM (A) and PMM-Au0 (B) after contact with solutions of different concentrations (excitation at 390 nm).
The promise of using the direct fluorescence of TC in PMM lies not only in the high sensitivity of the method but also in the variability of instrumental detection. In addition to recording the signal on a standard fluorimeter, its fixation by digital colorimetry is possible, which corresponds to modern trends in analytical chemistry. Currently, there is a steady trend towards the development of portable control tools that allow for rapid, inexpensive, and express analysis directly at the sampling site. One of the most promising directions for this is digital colorimetry, the key advantages of which are the simplicity of hardware design and the possibility of using widely available digital photo equipment.
The ubiquitous distribution of smartphones equipped with high-quality cameras and software for image processing plays a special role in the miniaturization of such methods. This opens up opportunities for creating mobile methods that are not inferior in accuracy to procedures using stationary equipment [32].
The extraction of TC from the analyzed solutions by PMM was carried out under optimal conditions previously selected for spectrophotometric determination. After completion of the extraction, the plates were removed from the solution and irradiated with light at a wavelength of 365 nm to excite fluorescence. The TC content was found from the calibration dependence constructed under similar conditions. Table 4 presents the parameters of the calibration dependencies and the analytical characteristics of TC determination by its intrinsic fluorescence using PMM (Figure 4).
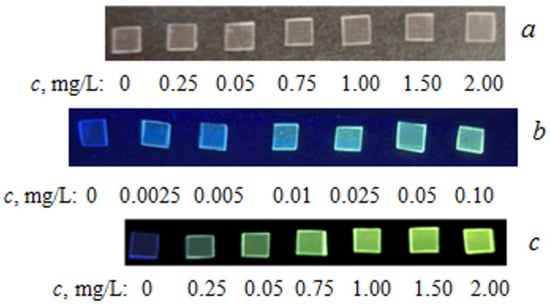
Figure 4.
Photographs of PMM samples after contact with TC solutions of different concentrations: (a)—without irradiation; (b,c)—upon irradiation with UV light 365 nm.
Table 4.
Analytical characteristics of TC determination by its intrinsic fluorescence using PMM and PMM-Au0 (t = 60 min).
Table 4.
Analytical characteristics of TC determination by its intrinsic fluorescence using PMM and PMM-Au0 (t = 60 min).
| Extractant | Equation | Color | R | AR, mg/L | LOD, mg/L |
|---|---|---|---|---|---|
| PMM | ∆E = 1150c | Blue (Figure 4b) | 0.995 | 0.0025–0.1000 | 0.001 |
| ∆E = 74c + 158 | Yellow-Green (Figure 4c) | 0.994 | 0.25–2.00 | 0.21 | |
| PMM-Au0 | ΔE = 10,571c | Blue (Figure 5) | 0.992 | 0.001–0.010 | 0.0005 |
| ∆E = 469c + 142 | Yellow-Green (Figure 5) | 0.994 | 0.025–0.100 | 0.012 |

Figure 5.
Photographs of PMM-Au0 samples after contact with TC solutions of different concentrations: (A)—without irradiation; (B)—upon irradiation with UV light (365 nm).
Figure 5.
Photographs of PMM-Au0 samples after contact with TC solutions of different concentrations: (A)—without irradiation; (B)—upon irradiation with UV light (365 nm).

Also, the interaction of TC with a composite material based on polymethylmethacrylate containing gold nanoparticles (PMM-Au0) was investigated in the work, since it is known that for fluorophores located near the surface of metallic nanostructures, an increase in quantum yield is possible [38]. Depending on the nature of the reducing agent used in the synthesis, samples with different optical properties were obtained: upon reduction with sodium borohydride, the plates had a red color with a plasmon absorption maximum at 530 nm, and when using ascorbic acid, they had a gray-violet color with a maximum at 575 nm (Figure S2).
After the extraction of TC by PMM-Au0 and subsequent irradiation with UV light, intense yellow fluorescence of the antibiotic was observed. A key result is the significant enhancement of the fluorescent signal in the presence of gold nanoparticles compared to pure PMM, which is explained by the metal-enhanced fluorescence effect [39,40,41,42,43].
During preliminary experiments, it was found that PMM-Au0 samples synthesized using ascorbic acid exhibit fluorescence in the blue region of the visible spectrum under UV irradiation, and the signal intensity increases during sample storage [44]. This background fluorescence significantly hinders the registration of the TC signal after its extraction. In this regard, for all subsequent studies, PMM-Au0 samples (Figure S3) obtained using sodium borohydride were used, which did not possess interfering intrinsic fluorescence.
The influence of the concentration of gold nanoparticles (Au NPs) in PMM after the extraction of TC on the magnitude of the ∆E was varied by changing the concentration of the initial HAuCl4 solution in the range from 2.5 to 25.0 mg/L at the stage of immobilization of Au(III) ions. The absorption spectra of the obtained samples, presented in Figure 6A, demonstrate that with an increase in the concentration of HAuCl4, the intensity of the plasmon resonance maximum at 530 nm increases, which directly indicates an increase in the concentration of synthesized Au NPs in the polymer matrix. According to the data in Figure 6B, the ∆E reaches a maximum when using HAuCl4 solutions with a concentration of 5.0–7.5 mg/L for the synthesis of PMM-Au0.
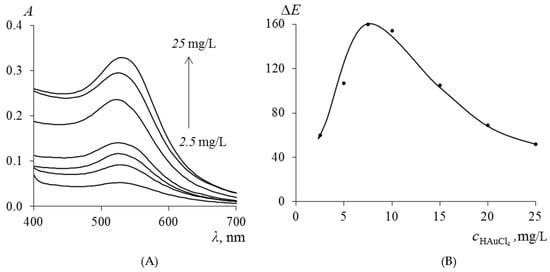
Figure 6.
Absorption spectra of Au NPs synthesized in PMM (A) and dependence of the analytical signal ∆E on the concentration of Au NPs in PMM after contact of PMM-Au0 with a 0.1 mg/L TC solution (B).
The extraction of TC from the analyzed solutions by PMM-Au0 was carried out under optimal conditions previously selected for spectrophotometric determination. After completion of the extraction, the plates were removed from the solution and irradiated with light at a wavelength of 365 nm to excite fluorescence. Table 4 presents the parameters of the calibration dependencies and the analytical characteristics of TC determination by its intrinsic fluorescence using PMM-Au0. Figure 6 shows photographs of PMM-Au0 after contact with TC solutions of different concentrations without and upon irradiation with UV light. It can be seen from the figure that the intensity of yellow fluorescence in the matrix regularly increases with an increase in the concentration of TC in the analyzed solution. Based on the conducted research, methodologies for the determination of TC using PMM and PMM-Au0 by solid-phase spectrophotometry and solid-phase colorimetry were developed and tested on real samples.
2.3. TC Determination Procedure
The developed methodology was tested on real samples of human urine, river and bottled drinking water samples, as well as on milk and honey. When determining TC in bottled drinking and river waters, preliminary sample preparation of the analyzed samples was not required. In the case of biological and food analysis objects, preliminary sample preparation was carried out to remove proteins. When determining TC in urine, 10 mL of the analyzed sample was placed in a 15 mL plastic tube, 0.1 mL of a 20% trichloroacetic acid solution was added, mixed on a rotary shaker for 5 min, and then centrifuged for 5 min at 3000 rpm. The supernatant was transferred to another tube. For milk sample preparation, 10 g of the sample was placed in a 50 mL centrifuge tube, 0.4 g of ethylenediaminetetraacetic acid (EDTA), and 0.3 mL of concentrated glacial acetic acid were added, thermostated in a water bath for 10 min at 50 °C, and then centrifuged for 5 min at 4000 rpm. The supernatant was filtered through a paper filter. When analyzing honey, 20 g of the sample was placed in a 50 mL centrifuge tube, brought to a volume of 45 cm3 with distilled water, and stirred until complete homogenization. The sample was thermostated in a water bath for 10 min at a temperature of 50 °C, then centrifuged for 10 min at g-force 1431 g. The resulting supernatant was filtered through a paper filter into a conical flask.
When analyzing samples for TC content by the standard solutions method, a 0.5–3.6 mL aliquot of the analyzed samples was placed in a 5 mL tube, 0.4 mL of borate buffer was added, diluted to a volume of 4 cm3 with distilled water, and a PMM or PMM-Au0 plate was added. The contents of the tube were stirred for 60–90 min at a temperature of 60 °C, the samples were removed from the tube, and the analytical signal was measured. The TC content in the investigated samples was found from the calibration dependencies constructed under similar conditions (Table 3 and Table 4).
When determining TC in analysis objects using calibration dependencies constructed by the standard addition method, the procedure described above was performed. The difference was that additionally, solutions of reference samples with the content of 0.02–0.30 mL of a working TC solution with a concentration of 10 mg/L and 0.01–0.05 mL with a concentration of 1 mg/L were prepared. Then, a graph of the dependence of the analytical signal on the concentration of the additive was plotted, and the obtained straight line was extrapolated to the intersection with the concentration axis.
The accuracy of the analysis was checked by the standard addition method. The TC additive was introduced into the samples of human urine, milk, and honey at the first stage of sample preparation. The results of TC determination in the analyzed objects are given in Table 5. The relative standard deviation of the analysis results does not exceed 19%. The quantitative determination of additions of the standard TC solution in the analysis objects is determined with sufficient accuracy (Table S2).
Table 5.
Results of TC determination in the analyzed objects (n =3–5; p = 0.95).
As a result, it is shown that PMM and PMM-Au0 can be used for direct extraction of TC, followed by solid-phase spectrophotometric and solid-phase colorimetric determination in the range of TC concentrations 0.001–1.50 mg/L with a detection limit of 0.0005 mg/L with a sample volume of 4 mL. The proposed methods are simple in execution and comply with the principles of “green” chemistry, since they exclude the stage of elution and the use of toxic organic solvents, due to the unique properties of PMM, which allow direct measurement of the analyte in the solid phase.
3. Materials and Methods
3.1. Preparation of the PMM
The description is given in Section S1.
3.2. Preparation of Solutions
The description is given in Section S2.
3.3. Preparation of Gold Nanoparticles in PMM
Stable gold nanoparticles Au0 were formed directly in the transparent PMM by in situ synthesis through the reduction of Au(III) ions. At the first stage, immobilization of Au(III) into the matrix (PMM-Au3+) from a HAuCl4 solution with a concentration of 2.5–25.0 mg/L was carried out. For this, 20–60 PMM plates were stirred on a rotator with 5–15 mL of the solution for 5 min. At the second stage, the synthesis of nanoparticles in situ was initiated by immersing the PMM-Au3+ matrix into a reducing agent solution. Reductants of varying strength were used: a 1% NaBH4 solution (reduction time 1 min) and a 5% ascorbic acid solution (reduction time 5 min).
3.4. Experimental Methodology
The extraction of TC by PMM and PMM-Au0 was studied under various conditions. For this, a TC solution, a solution for creating the necessary pH value, with different concentrations of reacting substances, were placed into a 5 mL graduated tube, diluted to a volume of 4 cm3 with distilled water, and PMM was added. The contents of the tube were stirred for 15–120 min at a temperature of 20–90 °C, and the absorption spectra were recorded or the optical density at the maximum of the TC absorption band in the matrix was measured.
The efficiency of extraction recovery was assessed by the distribution coefficients (D), which were calculated by the formula:
where A0 and A are the optical densities of the TC solution before and after extraction;
V is the total volume of the solution, mL;
m is the mass of the PMM plate, g.
3.5. Instrumentation and Operating Parameters
A scanning spectrophotometer UV-1800 (Shimadzu, Nakagyo-ku, Japan) was used for the determination of absorption spectra and absorbance of the PMM and the solutions in the visible region. The optical characteristics of the matrices after the TC extraction process were measured relative to the initial PMM. Fluorescence spectra of the matrices were recorded using an Agilent Cary Eclipse spectrofluorimeter (Agilent, Waldbronn, Germany). Fluorescence excitation at 395 nm was carried out using a Wood’s lamp (Izmeritelnaya Tekhnika, Moscow, Russia). Fluorescent emission in the yellow-green region, 520 ± 5 nm, was recorded using a smartphone or an ultraviolet analytical recorder UVC-HD (PetroChem, Sankt-Peterburg, Russia). Color difference ΔE in the RGB system was used as the analytical signal, calculated by the formula: ∆E = ((R − R0)2 + (G − G0)2 + (B − B0)2)1/2, where R, G, B, R0, G0, and B0 are the intensity values of red, green, and blue colors of the analyzed and blank samples, respectively.
The electron microscopy (SEM) images were registered using a JEM-2100 (JEOL, Akishima-shi, Japan) microscope with a thermal field-emission cathode at an acceleration voltage of 200 kV. BioSan Multi Bio RS-24 (BioSan, Riga, Latvia) multi-rotator was used for solution mixing. The pH values of the solutions were measured using an I-160 laboratory-grade ion meter (Izmeritelnaya Tekhnika, Moscow, Russia) with silver chloride reference electrodes. For centrifuging real samples at the sample preparation stage, a Stegler CM-600S (NV-Lab, Moscow, Russia) laboratory centrifuge was used. ColourGrab V. 3.9.2. software was used to process the obtained images.
4. Conclusions
A new hybrid method for the determination of TC has been developed, based on its solid-phase extraction into a PMM and a composite based on it containing gold nanoparticles PMM-Au0, with subsequent direct quantitative measurement in the solid phase using spectrophotometry and fluorimetry. The method is characterized by high sensitivity, selectivity, and rapidity. The developed methodology was tested on real samples of human urine, river and bottled drinking water, as well as on milk and honey. The relative standard deviation of the analysis results does not exceed 19%. The developed method can be used for the determination of TC in complex matrices, including biological fluids, food products, and environmental objects.
Supplementary Materials
The following supporting information can be downloaded at: https://www.mdpi.com/article/10.3390/molecules30224458/s1, Section S1. Preparation of the PMM. Section S2. Preparation of Solutions. Figure S1. Absorption spectra of TC in PMM after contact with solutions of different concentrations. Figure S2. Scheme for obtaining gold nanoparticles in PMM. Figure S3. SEM images of nanoparticle associates in PMM-Au0 (1,2) and their size distribution (3). Table S1. Analytical characteristics of PMM-Au0 sensors with different storage periods. Table S2. Comparison between our sensor and that of other jobs.
Author Contributions
N.V.S.: research design, provided financial and material support, and writing—review and editing. D.E.K.: experiments and tests, data disposal, and. N.A.G.: experiments and tests, and data disposal. M.A.G.: research design, writing—original draft, writing—review and editing. All authors have read and agreed to the published version of the manuscript.
Funding
This research was funded by the Russian Science Foundation under the project 25-23-20058 and the Administration of the Tomsk region.
Institutional Review Board Statement
Not applicable.
Informed Consent Statement
Not applicable.
Data Availability Statement
Data are contained within the article.
Acknowledgments
The authors would like to thank the above funding for the support of this study.
Conflicts of Interest
The authors declare that they have no known competing financial interest or personal relationships that could have appeared to influence the work reported in this paper.
References
- Saenjum, C.; Pattapong, N.; Aunsakol, T.; Pattananandecha, T.; Apichai, S.; Murakami, H.; Grudpan, K.; Teshima, N. High sensitivity spectrophotometric determination of tetracycline with zirconium chelation by employing simultaneous injection effective mixing analysis (SIEMA): Tetracycline residue in honey. J. Food Compos. Anal. 2022, 105, 104215. [Google Scholar] [CrossRef]
- Chopra, I.; Roberts, M. Tetracycline antibiotics: Mode of action, applications, molecular biology, and epidemiology of bacterial resistance. Microbiol. Mol. Biol. Rev. 2001, 65, 232–260. [Google Scholar] [CrossRef] [PubMed]
- Goncharova, L.A.; Kobylinskaya, N.G.; Diaz-Garcia, M.E.; Zaitsev, V.N. Solid-phase luminescence determination of tetracycline in bottled water using chemically modified silica. J. Anal. Chem. 2017, 72, 724–733. [Google Scholar] [CrossRef][Green Version]
- Cherkashina, K.D.; Pochivalov, A.S.; Shakirova, F.M.; Shishov, A.Y.; Bulatov, A.V. Microextraction of tetracyclines from milk to deep eutectic solvents for the subsequent determination by high-performance liquid chromatography-tandem mass spectrometry. J. Anal. Chem. 2022, 77, 334–341. [Google Scholar] [CrossRef]
- Qi, M.; Tu, C.; Dai, Y.; Wang, W.; Wang, A.; Chen, J. A simple colorimetric analytical assay using gold nanoparticles for specific detection of tetracycline in environmental water sample. Anal. Methods 2018, 10, 3402–3407. [Google Scholar] [CrossRef]
- Ma, F.; Xu, S.; Tang, Z.; Li, Z.; Zhang, L. Use of antimicrobials in food animals and impact of antimicrobial resistance on humans. Biosaf. Health 2021, 3, 32–38. [Google Scholar] [CrossRef]
- Commission Regulation (EU). No 37/2010 of 22 December 2009 on pharmacologically active substances and their classification regarding maximum residue limits in foodstuffs of animal origin. Off. J. Eur. Union 2010, L 15, 1–72. [Google Scholar]
- Khatami, A.; Dabbagh, A.; Moghaddam, M.R.; Dini Talatappeh, H.; Mohammadimehr, M. Simultaneous extraction of polycyclic aromatic hydrocarbons and tetracycline antibiotics from honey samples using dispersive solid phase extraction combined with dispersive liquid-liquid microextraction before their determination with HPLC-DAD. J. Food Compos. Anal. 2024, 131, 106179. [Google Scholar] [CrossRef]
- Li, Z.-Y.; Zhu, J.-H.; Zhao, J.; Yang, X.-S.; Liu, Y.-S.; Cheng, T.; Chen, Y.; Sun, S.-Y.; Wang, L.-L. Self-assembled Fe3O4–COOH hydrogen-bonded organic framework composites for magnetic solid-phase extraction of tetracycline in food samples coupled with HPLC determination. Talanta 2024, 280, 126746. [Google Scholar] [CrossRef] [PubMed]
- Gab-Allah, M.A.; Getachew Lijalem, Y.; Yu, H.; Dong Kyu Lim, D.K.; Ahn, S.; Choi, K.; Kim, B. Accurate determination of four tetracycline residues in chicken meat by isotope dilution-liquid chromatography/tandem mass spectrometry. J. Chromatogr. A 2023, 1691, 463818. [Google Scholar] [CrossRef] [PubMed]
- Hassan, J.; Shams, G.-R.; Pourrastegar, M.; Pourshaban-Shahrestani, A. Application of salting-out assisted liquid-liquid extraction for the determination of oxytetracycline, tetracycline, tilmicosin, and tylosin in cow milk by liquid chromatography with photodiode array detection. MethodsX 2024, 12, 102616. [Google Scholar] [CrossRef] [PubMed]
- Alanazi, F.; Almugbel, R.; Maher, H.M.; Alodaib, F.M.; Alzoman, N.Z. Determination of tetracycline, oxytetracycline and chlortetracycline residues in seafood products of Saudi Arabia using high performance liquid chromatography—Photo diode array detection. Saudi Pharm. J. 2023, 31, 566–575. [Google Scholar] [CrossRef] [PubMed]
- Ri, H.-C.; Piao, J.; Cai, L.; Jin, X.; Piao, X.; Jin, X.; Jon, C.-S.; Liu, L.; Zhao, J.; Shang, H.-B.; et al. A reciprocating magnetic field assisted on-line solid-phase extraction coupled with liquid chromatography-tandem mass spectrometry determination of trace tetracyclines in water. Anal. Chim. Acta 2021, 1182, 338957. [Google Scholar] [CrossRef]
- Khaled, O.; Ryad, L.; Eissa, F. Determination of tetracycline residues in potatoes and soil by LC-MS/MS: Method development, validation, and risk assessment. Food Chem. 2024, 461, 140841. [Google Scholar] [CrossRef]
- Song, E.; Yu, M.; Wang, Y.; Hu, W.; Cheng, D.; Swihart, M.T.; Song, Y. Multi-color quantum dot-based fluorescence immunoassay array for simultaneous visual detection of multiple antibiotic residues in milk. Biosens. Bioelectron. 2015, 72, 320–325. [Google Scholar] [CrossRef]
- Rong, M.; Huang, Y.; Lin, C.; Lai, L.; Wu, Y.; Niu, L. Recent advances in optical sensing for tetracycline antibiotics. TrAC Trends Anal. Chem. 2024, 178, 117839. [Google Scholar] [CrossRef]
- Hassan, A.M.; Kelani, K.M.; Hegazy, M.A.; Nadim, A.H.; Tantawy, M.A. A probe of new molecularly imprinted solid-phase extraction coupled with HPLC-DAD and atomic absorption spectrophotometry for quantification of tetracycline HCl, metronidazole and bismuth subcitrate in combination with their official impurities: Application in dosage form and human plasma. J. Chromatogr. B 2024, 1234, 124032. [Google Scholar]
- Thanasarakhan, W.; Kruanetr, S.; Deming, R.L.; Liawruangrath, B.; Wangkarn, S.; Liawruangrath, S. Sequential injection spectrophotometric determination of tetracycline antibiotics in pharmaceutical preparations and their residues in honey and milk samples using yttrium (III) and cationic surfactant. Talanta 2011, 84, 1401–1409. [Google Scholar] [CrossRef]
- Mili, K.; Hsine, Z.; Chevalier, Y.; Ledoux, G.; Mlika, R. Application of thiol capped ZnS quantum dots as a fluorescence probe for determination of tetracycline residues. Solid State Commun. 2023, 360, 115040. [Google Scholar] [CrossRef]
- Ho, C.-Y.; Lee, T.-W.; Li, X.-Y.; Chen, C. Repurposing of waste ammonium sulfate as S,N-doped carbon quantum dots: A sensitive and selective fluorescent probe for the determination of tetracycline. J. Taiwan Inst. Chem. Eng. 2024, 154, 105128. [Google Scholar] [CrossRef]
- Hong, C.; Huang, Y.L.; Li, L.; Zou, J.Y.; Wang, E.L.; Zhang, L.; Liu, Y.W.; You, S.-Y. A fluorescent Zn(II) metal−organic framework sensor for quantitative tetracycline determination. J. Mol. Struct. 2024, 1299, 137113. [Google Scholar] [CrossRef]
- Yan, W.; Wang, X.; Gao, X.; Zhao, L. A smart fluorescent colorimetric dual-response sensing for the determination of tetracycline antibiotics. J. Photochem. Photobiol. A Chem. 2024, 447, 115217. [Google Scholar] [CrossRef]
- Zhang, M.; Zhang, S.; Xu, Z.; Lv, T.; Liu, X.; Wang, L.; Liu, B. Fluorescence determination of the total amount of tetracyclines by a flavonol-based supramolecular sensor. Talanta 2024, 266, 124982. [Google Scholar] [CrossRef] [PubMed]
- Xia, W.Q.; Liu, J.; Wang, J.P. Evolution of a natural TetR protein and development of a Fe3O4 assisted semi-homogeneous fluorescent method for determination of tetracyclines in milk. Anal. Chim. Acta 2023, 1276, 341609. [Google Scholar] [CrossRef]
- Udalova, A.Y.; Dmitrienko, S.G.; Apyari, V.V. Sorption of tetracycline antibiotics on hyper-crosslinked polystyrene from aqueous and aqueous-organic media. Russ. J. Phys. Chem. A 2015, 89, 1082–1086. [Google Scholar] [CrossRef]
- Perez, M.; Pellerano, R.G.; Pezza, L.; Pezza, H.R. An overview of the main foodstuff sample preparation technologies for tetracycline residue determination. Talanta 2018, 182, 1–21. [Google Scholar] [CrossRef]
- Gavrilenko, N.A.; Saranchina, N.V.; Kambarova, E.A.; Urazov, E.V.; Gavrilenko, M.A. Colorimetric and fluorescent sensing of rhodamine using polymethacrylate matrix. Spectrochim. Acta A Mol. Biomol. Spectrosc. 2019, 220, 117106. [Google Scholar] [CrossRef]
- Gavrilenko, N.A.; Saranchina, N.V.; Gavrilenko, M.A. Colorimetric sensor based on silver nanoparticle—Embedded polymethacrylate matrix. Adv. Mater. Res. 2014, 1040, 923–927. [Google Scholar] [CrossRef]
- Carlotti, B.; Fuoco, D.; Elisei, F. Fast and ultrafast spectroscopic investigation of tetracycline derivatives in organic and aqueous media. Phys. Chem. Chem. Phys. 2010, 12, 15580–15591. [Google Scholar] [CrossRef] [PubMed]
- Li, J.; Fan, S.; Li, Z.; Li, S.; Zhao, Y. Simple colorimetric detection of doxycycline and oxytetracycline using unmodified gold nanoparticles. Opt. Spectrosc. 2014, 117, 250–255. [Google Scholar] [CrossRef]
- Yang, K.; Zhu, R.; Li, Z.; Shuang, S.; Zhai, Y.; Dong, C. Label-free colorimetric detection of tetracycline using gold nanoparticles with different surface charge. Talanta 2024, 266, 125077. [Google Scholar] [CrossRef] [PubMed]
- Ponhong, K.; Nilnit, T.; Lee, C.Y.; Kusakunniran, W.; Saeteard, P.; Supharoek, S.-A. A facile smartphone-based digital image colorimetric sensor for the determination of tetracyclines in water using natural phenolic compounds induced to grow gold nanoparticles. RSC Adv. 2025, 15, 8411–8423. [Google Scholar] [CrossRef]
- Jin, L.; Amaya-Mazo, X.; Apel, M.E.; Sankisa, S.S.; Johnson, E.; Zbyszynska, M.A.; Han, A. Ca2+ and Mg2+ bind tetracycline with distinct stoichiometries and linked deprotonation. Biophys. Chem. 2007, 128, 185–196. [Google Scholar] [CrossRef]
- González-Garrido, L.D.; Guzmán-Hernández, D.S.; Rojas-Hernández, A.; Rodríguez-Barrientos, D.; Juárez-Gómez, J.; Ramírez-Silva, M.T. Tetracycline speciation study in aqueous medium. J. Mex. Chem. Soc. 2025, 69, 78–87. [Google Scholar] [CrossRef]
- Gorodilova, A.I.; Lebedeva, E.L.; Petrova, J.S.; Neudachina, L.K. Study of sorption of chlortetracycline hydrochloride and its subsequent determination by capillary zone Electrophoresis. J. Anal. Chem. 2023, 78, 1659–1664. [Google Scholar] [CrossRef]
- Mohammed-Ali, M.A.-J. Stability study of tetracycline drug in acidic and alkaline solutions by colorimetric method. J. Chem. Pharm. Res. 2012, 4, 1319–1326. [Google Scholar]
- Schmitt, M.O.; Schneider, S. Spectroscopic investigation of complexation between various tetracyclines and Mg2+ or Ca2+. Phys. Chem. Chem. Phys. 2000, 3, 1989–1995. [Google Scholar] [CrossRef]
- Zeng, Z.; Mizukami, S.; Fujita, K.; Kikuchi, K. An enzyme-responsive metal-enhanced near-infrared fluorescence sensor based on functionalized gold nanoparticles. Chem. Sci. 2015, 6, 4934–4939. [Google Scholar] [CrossRef]
- Jeong, Y.; Kook, Y.-M.; Lee, K.; Koh, W.-G. Metal enhanced fluorescence (MEF) for biosensors: General approaches and a review of recent developments. Biosens. Bioelectron. 2018, 111, 102–116. [Google Scholar] [CrossRef] [PubMed]
- Lee, D.; Song, J.; Song, G.; Pang, Y. Metal-enhanced fluorescence of dyes with quadrupole surface plasmon resonance of silver nanoparticles. Nanoscale Adv. 2022, 4, 2794–2802. [Google Scholar] [CrossRef] [PubMed]
- Gartia, M.R.; Eichorst, J.P.; Clegg, R.M.; Liu, G.L. Lifetime imaging of radiative and non-radiative fluorescence decays on nanoplasmonic surface. Appl. Phys. Lett. 2012, 101, 023118. [Google Scholar] [CrossRef]
- Austin, L.A.; Kang, B.; El-Sayed, M.A. Probing molecular cell event dynamics at the single-cell level with targeted plasmonic gold nanoparticles: A review. Nano Today 2015, 10, 542–558. [Google Scholar] [CrossRef]
- Roumyantseva, T.B.; Dement’eva, O.V.; Protsenko, I.E.; Zaitseva, A.V.; Sukhov, V.M.; Rudoy, V.M. Plasmonic enhancement of dye fluorescence in polymer/metal nanocomposites. Colloid J. 2019, 81, 733–740. [Google Scholar] [CrossRef]
- Saranchina, N.V.; Bazhenova, O.A.; Bragina, S.K.; Semin, V.O.; Gavrilenko, N.A.; Volgina, T.N.; Gavrilenko, M.A. Stabilization of gold nanoparticles in a transparent polymer while maintaining the capabilities of a colorimetric glucose sensor. Opt. Mater. 2024, 157, 116150. [Google Scholar] [CrossRef]


Disclaimer/Publisher’s Note: The statements, opinions and data contained in all publications are solely those of the individual author(s) and contributor(s) and not of MDPI and/or the editor(s). MDPI and/or the editor(s) disclaim responsibility for any injury to people or property resulting from any ideas, methods, instructions or products referred to in the content. |
© 2025 by the authors. Licensee MDPI, Basel, Switzerland. This article is an open access article distributed under the terms and conditions of the Creative Commons Attribution (CC BY) license (https://creativecommons.org/licenses/by/4.0/).