Abstract
Metal hydrides are an interesting group of chemical compounds, able to store hydrogen in a reversible, compact and safe manner. Among them, A2B7-type intermetallic alloys based on La-Mg-Ni have attracted particular attention due to their high electrochemical hydrogen storage capacity (∼400 mAh/g) and extended cycle life. However, the presence of Mg makes their synthesis via conventional metallurgical routes challenging. Replacing Mg with Y is a viable approach. Herein, we present a systematic study for a series of compounds with a nominal composition of La2-xYxNi6.50Mn0.33Al0.17, x = 0.33, 0.67, 1.00, 1.33, 1.67, focusing on the relationship between the material structural properties and hydrogen sorption performances. The results show that while the hydrogen-induced phase amorphization occurs in the Y-poor samples (x < 1.00) already during the first hydrogen absorption, a higher Y content helps to maintain the material crystallinity during the hydrogenation cycles and increases its H-storage capacity (1.37 wt.% for x = 1.00 vs. 1.60 wt.% for x = 1.67 at 50 °C). Thermal conductivity experiments on the studied compositions indicate the importance of thermal transfer between powder individual particles and/or a measuring instrument.
1. Introduction
Integrating renewables with various energy storage technologies into the electrical grid is a compelling approach for further expansion of the green energy production and utilization [1]. Hydrogen as a fuel and an energy carrier is a part of the sustainable energy revolution, while energy can be stored in a form of liquid or gaseous hydrogen, a considerable amount of energy is lost during the gas compression and/or liquefaction processes [2,3]. An alternative storage method utilizes metal hydrides, in particular intermetallic alloys, which can reversibly sorb hydrogen gas at moderate temperatures and pressures [3,4], in a safer way than the mentioned, conventional solutions [5].
Various metal hydrides have been tested as solid-state hydrogen storage materials, including: AB-, AB2-, AB3-, AB5-, A2B7- and A5B19-type compounds, with the A element (e.g., La, Ce, Li, Y) having high-and the B element (e.g., Ni, Fe, Mn, Al) having low affinity to hydrogen [6,7,8,9,10,11].
Previous studies have shown that by performing multiple substitutions of both the A element, and the B elements, the stability of the structure during cycling and storage capacities are affected [12,13,14,15]. It has been found that by substituting Mg for La in rare-earth (RE) superlattice based A2B7-type metal hydrides, it is possible to achieve a higher storage capacity (compared to commercial AB5-type alloys), a lower self-discharge if used in batteries and improved cycle stability by preventing the occurrence of hydrogen-induced amorphization (HIA), when compared to pure La2Ni7 [12,16,17,18,19,20,21,22].
However, an issue related to using RE-Mg-Ni based materials is due to the high vapour pressure of Mg, making compositional control difficult while also being an explosion hazard [12]. Further, RE-Mg-Ni based materials still suffers from poor cycle stability.
To solve some of these issues, new manufacturing techniques such as smelting protection with helium gas [20,23], sintering techniques [24,25], ball milling [26] or other processing techniques [23,27] have been proposed. These are however either very expensive and/or are highly complicated processes. Evidence suggest that though substitution with Mg is preferable from an economic standpoint, substitution with Y eliminates the issues of Mg synthesis.
Substitution of the La element for the heavier lanthanides is of limited interest for industrial applications due to the cost of these elements, alongside the increase in weight of the final product. However, using Y instead of Mg is a viable solution, since it is lighter and cheaper than the heavier lanthanides. Baddour-Hadjean et al. [28] found that by combining LaNi5 and YNi2 in appropriate amounts, a La-Y-Ni based AB3-type system was formed. It was found that the LaY2Ni9 alloy was a PuNi3-type compound, similar to that of LaMg2Ni9, and could absorb a higher hydrogen content than that of LaMg2Ni9 under identical conditions. However, using LaY2Ni9 as an electrode, showed an electrochemical capacity of only 265 mAh/g. Further, Belgacem et al. [29] showed that LaY2Ni9 only maintained 54% capacity after 100 cycles. Other studies showed that multi-substituted materials based on the A2B7-type in the La-Y-Ni system, show great improvements in performance, outperforming already commercialized AB5-type metal hydrides [12,30,31,32].
The A2B7 intermetallic compounds crystallise either with the hexagonal (H-; the Ce2Ni7 structure type; space group: P63/mmc, a high-temperature phase) or rhombohedral (R-; the Gd2Co7 structure type, space group: R-3m, a low-temperature phase) symmetry. Both polymorphs belong to the family of superlattice compounds with a composite structure, built up by AB5 (the CaCu5 structure type) and A2B4 (AB2) subunits (the MgZn2 and MgCu2 structures types, known as C-14 and C-15 Laves phases, in the hexagonal and rhombohedral system, respectively) alternated along c-axis, with a 2:1 ratio. Due to this, the A2B7 phases combine the advantage of the fast activation of AB5 phases with the high discharge capacity of AB2-type compounds.
Yan et al. [12] showed that the hexagonal LaY2Ni9.7Mn0.5Al0.3 could absorb up to 1.48 wt.% of hydrogen, which is close to the reported hydrogen storage capacities of the H-A2B7 phases in the RE-Mg-Ni system (up to 1.57 wt.% of H2) [18,33].
Liu et al. [34] and Zhao et al. [35] studied the effects of yttrium substitution in A2B7-type phases of La-Y-Ni-Mn-Al and found that Y induced the formation of the H-A2B7 compositions. These observations however contradict other studies indicating that the yttrium presence favoured the R-A2B7 phase formation [36,37]. Zhao et al. [35] also reported that the studied La1-xYxNi3.25Mn0.15Al0.10 (x = 0.00–1.00) intermetallic compounds had a single hydrogen ab/desorption plateau, while Liu [34] reported on the formation of two hydrogen ab/desorption plateaus for a similar sample series, La3-xYxNi9.7Mn0.5Al0.3 (x = 1, 1.5, 1.75, 2, 2.25, 2.5), which is in line with observations reported for other A2B7-type materials [12,37,38].
With the aim to clarify inconsistencies on structural and functional properties of A2B7-type materials in the La-Y-Ni-Al-Mn system, we have conducted a systematic study of the sample series La2-xYxNi6.50Mn0.33Al0.17 (x = 0.33, 0.67, 1.00, 1.33, 1.67), focusing on the analysis of the material structural/microstructural properties and hydrogen sorption behaviour.
2. Results
2.1. HR SR-PXD and PND
The structural properties of the intermetallic powders were investigated using both HR SR-PXD and PND techniques to obtain sufficient contrast among the system elements, while SR-PXD data helped to differentiate between La and Y, the PND measurements allowed to distinguish the Mn and Ni atoms. The combined simultaneous analysis of both data sets, carried out for each composition, appears essential for the accurate analysis of the material crystal structures (Figure 1, Figure 2 and Figure 3 and Table 1, Table 2, Table 3 and Table 4). The results confirm the formation of H-A2B7 as a main phase in all studied samples. The higher Y content results in the shifting of Bragg peak positions towards higher 2 angles in the collected diffraction patterns, which indicates the formation of a smaller unit cell, as expected (atomic radius of La = 1.87 Å and Y = 1.79 [39]) and previously reported [34,35]. The substitution of Ni by Al or Mn atoms (atomic radius of Ni = 1.26 Å, Al = 1.41 Å, Mn = 1.32 Å [39]), were expected to influence the average unit cell size, as also reported by other studies [30,38].

Figure 1.
(a) HR SR-PXD data (the measurement for Y0.33 (black line) was collected with = 0.7289 Å, the rest was taken at = 0.7291 Å) and (b) PND data with = 1.54 Å of La2-xYxNi6.50Mn0.33Al0.17 (x = 0.33, 0.67, 1.00, 1.33, 1.67). The data are given a vertical offset, allowing for easier reading.
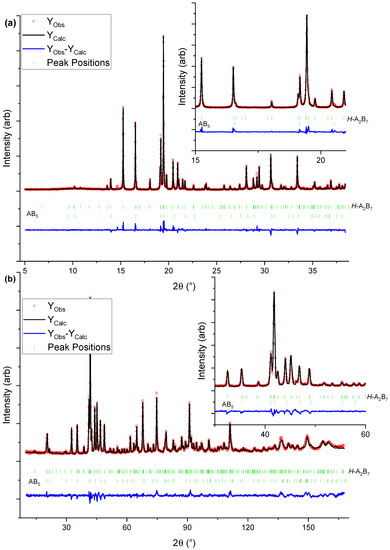
Figure 2.
Graphical representation of the Rietveld refinement results for Y0.33: (a) HR SR-PXD data ( = 0.7289 Å), (b) PND data ( = 1.5400 Å). The inserts are zoom in of selected ranges.
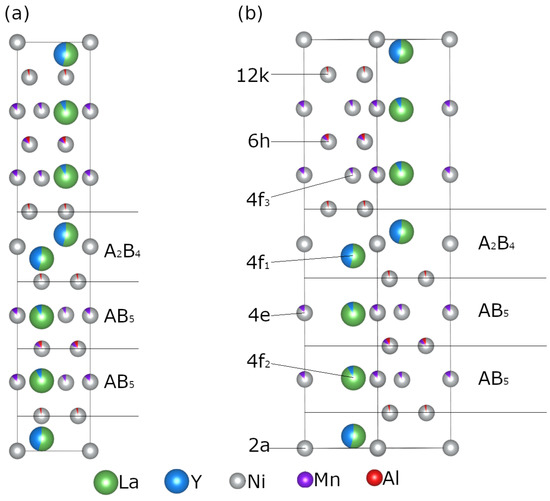
Figure 3.
(a) Stacking arrangement of the A2B4 and AB5 subunits in the crystal structure of the hexagonal A2B7-type structure; (b) crystallographic sites in the H-A2B7 crystal structure with the fractional atomic occupancies (green: La, blue: Y. grey: Ni, purple: Mn, red: Al atoms) as obtained for the Y0.67 sample.

Table 1.
Lattice parameters, phase abundance, A2B4 and AB5 subunits and unit cell volumes for the H-A2B7 phase in the studied intermetallic compounds, as obtained from Rietveld refinements.
Table 2.
Rwp values reported from the Rietveld refinement.
Table 3.
RBragg values reported from the Rietveld refinement.
Table 4.
Refined sample compositions, fractional occupancies (n), displacement factors (Biso), atomic positions, atomic distance 4f1-4f1 in the A2B4 subunit and goodness-of-fit () for the H-A2B7 phase in the studied intermetallic compounds, as obtained from Rietveld refinement. All crystallographic sites are assumed to be fully occupied; the remaining fractional occupancies are completed to 100% by either La (A atoms) or Ni (B atoms).
The Rietveld refinement results indicate the formation of a single hexagonal Ce2Ni7-type phase only in Y0.67 and Y1.00. In all other samples, additional secondary phases are present (Table 1). Y0.33 consists of H-A2B7 (95 wt.%) and the minor AB5-type (5.3 wt.%) phase. The concentration of the major H-A2B7 increases to 100 wt.% in Y0.67 and Y1.00 but again decreases to 89 wt.% and 53 wt.% for Y1.33 and Y1.67, respectively. In the samples with the higher Y concentration (x ≥ 1.33), the formation of the R-A2B7 and R-AB3 phases has also been observed, which confirms but also contradicts some of the previously reported results. Liu et al. [34] (La3-xYxNi9.7Mn0.5Al0.3 (x = 1, 1.5, 1.75, 2, 2.25, 2.5)) claimed that the increased Y concentration stabilised the formation of H-A2B7, whereas Zhao et al. [35] (La1-xYxNi3.25Mn0.150Al0.10 (x = 0.00–1.00)) observed the presence of the H-A2B7 phase only up to x ≥ 0.85, and the R-AB3 phase occurrence for higher Y content. The findings presented herein confirm that the Y presence induces the formation H-A2B7 in the entire sample series, but the higher Y concentration (x ≥ 1.33) leads additionally to crystallisation of the R-A2B7 and R-AB3 phases. Our observations are in line with earlier reports, suggesting that A2B7 compositions with a higher concentration of smaller A elements, e.g., Y, prefer to take rhombohedral symmetry instead of hexagonal one [40,41], which is in line with the higher abundance of the R-A2B7 phase in Y1.33 and Y1.67.
The refined lattice parameters of the major H-A2B7 phase decrease with the increasing Y content (a = b = 5.0740 and 5.0004 Å for Y0.33 and Y1.67, respectively; c = 24.643 and 24.322 Å for Y0.33 and Y1.67, respectively), resulting in smaller subunit (VA2B4 = 6.4% and VAB5 = 2.9%) and unit cell volumes (V = 4.2%) as seen in Table 1. (The subunit volumes are calculated using where is the unit cell volume, c is the lattice parameter, and and are z value coordinates between 0 and 1 of the atoms at the edge of the subunit).
To help determine the quality of the fitted parameters, the Rwp and RBragg are shown in Table 2 and Table 3, respectively. As seen for Rwp, the values might seem high. Still, one must remember that when dealing with higher quality datasets, these may, in turn, provide higher Rwp values due to imperfections not considered in the data refining step. On the other hand, the RBragg values are generally small, indicating that the chosen model is satisfactory.
As shown in Table 4, the Y occupancy factor at the 4f1 and 4f2 sites in H-A2B7 increases from 0.14 to 0.70, and from 0.09 to 0.26 for Y0.33 and Y1.00, respectively. With the higher Y content, the element concentration at the 4f1 and 4f2 sites rise further to reach eventually 93 and 84%, respectively, in Y1.67. This suggests that while initially, Y occupy the A2B4 subunits, once filled up (x ≥ 1), it prefers entering the AB5 subunits. Such behaviour has been previously reported and was related to a lower coordination number of 16 at the 4f1 site when compared with coordination number 20 at the 4f2 site [36]. The higher Y concentration in the samples also shortens the 4f1-4f1 distance in the neighbouring unit cells from 3.282(3) to 3.170(7) Å for Y0.33 and Y1.67, respectively.
The Rietveld refinement results indicate that Mn atoms are present at the 4e and 6h sites in all studied compositions. The obtained fractional occupancies are low but larger than the estimated standard deviation values. In Y0.33, Y0.67 and Y1.00, Mn appears additionally at the 4f3 site. This site depletion observed in the Y-rich compositions, correlates with a subtle increase of the Mn atom occupancies at 4e and 6h, similar to the result reported by Deng et al. [31] for Y0.75La0.25Ni3.2Mn0.3 with H-A2B7 crystal structure.
In Y0.33, Y0.67 and Y1.00, the Al atoms are distributed over the 6h and 12k sites, with the latter being less occupied. This is in line with the earlier report by Wang et al. [38]. They found that for H-A2B7 in the LaY1.9Ni10.2-xAlxMn0.5 (x = 0, 0.2, 0.4, 0.6) system the presence of Al was only detected at the 6h site, between two AB5 subunits. Similar results were also observed for H-A2B7 formed in La0.77Mg0.23Ni3.41Al0.09 and Nd0.9Mg0.1Ni3.3Al0.2 [21,42]. In Y1.33 and Y1.67, the 6h site is no longer populated by Al, but at the same time, a slight increase of aluminium concentration at the 12k site is observed. These findings, compared with the changes in population of the 4f1 and 4f2 sites, may indicate that the higher amount of Y atoms in H-A2B7, and its increasing concentration at the 4f2 site, have an effect on (correlates with) the B atom distribution over the available crystallographic sites in this crystal structure, however the nature of interatomic relationships must be further investigated.
2.2. In Situ XRD
In situ PXD data were collected to determine: (1) the experimental conditions required for the hydrogenation of the studied compounds, and (2) the phase compositions of the hydrogenated materials. After initial activation of sample Y0.33 and Y0.67, various hydrogen pressures and temperatures were applied, within the ranges reported previously in literature [12]. Regardless of the tested experimental conditions, both materials became amorphous upon hydrogenation. Figure 4a shows the results obtained for Y0.67 at 30 °C and under 8 bar of H2 (red line). Due to the amorphous nature of the H2 exposed Y0.33 and Y0.67, the samples were excluded from further studies. The Y-rich samples (x ≥ 1) were successfully hydrogenated at 20 bar of H2 and 30 °C, with well-preserved crystallinity of the formed metal hydride phases (red plots in Figure 4b and Figure S1 in the Supplementary Information).
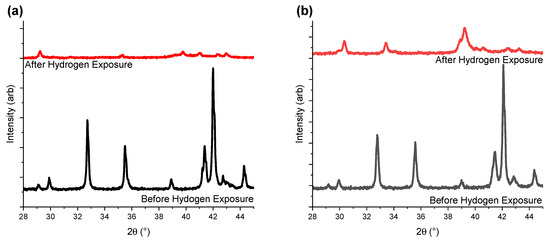
Figure 4.
In situ PXD data ( = 1.5406 Å) collected for (a) Y0.67 (30 °C, 8 bar of H2) and (b) Y1.00 (30 °C, 20 bar of H2) before and after hydrogenation. The black lines correspond to the pristine intermetallic compounds, while the red ones represent the hydrogenated materials. Data for the remaining samples can be found in Supplementary Information (Figure S1). The data are given a vertical offset, allowing for easier reading.
The previously reported investigation also indicated the occurrence of HIA for similar intermetallics (e.g., La1-xYxNi3.25Mn0.15Al0.10) at lower Y concentration (x < 0.5) [35]. Aoki and Masumoto [43] related the probability of the HIA occurrence with the ratio of the Goldschmidt radii between the A and B atoms (). Based on the empirical data, if the ratio was below 1.37 ( < 1.37) for the A2B4 subunit, then HIA was effectively prevented, whereas if above amorphization was expected to happen. The calculated Goldschmidt radii ratio in our samples decreased from 1.48 for Y0.33 to 1.43 for Y1.67, being higher than the limit found by Aoki and Masumoto. A similar result was reported for La1-xYxNi3.25Mn0.15Al0.1 in [35] where a ratio of 1.453 was reported, with the 4f1 site being completely filled with Y. The difference in the calculated ratios, was expected to be due to different atomic sizes being used, with the source not being provided in [35]. As such, all samples were expected to get amorphous.
It has also been found that the hydrogenated samples reported in this paper spontaneously release hydrogen, when stored in a sealed stainless-steel vial stored in a glovebox under ambient argon atmosphere (Figure S2 in Supplementary Information).
2.3. SEM and EDX
Investigations with SEM-EDX were carried out for Y1.00, Y1.33 and Y1.67 to: (1) map out the chemical composition of the intermetallics, and (2) to study the effect of the Y concentration on the particle size distribution in the pristine intermetallics and hydrogenated samples. The difference in holes in the carbon tape has no influence to the analysis. These are caused by the quality and type of the carbon tape used. The differences in coverage can be due to three factors. (1) The samples were produced three months apart manually (no reproducible results). (2) The finer material obtained after hydrogenation formed a blanket that was stuck to the carbon tape. (3) Since the micrographs were taken three months apart, the stickiness of the carbon tape could have changed (different roll). Before hydrogen exposure, the Y1.00 material (Figure 5a) revealed the most homogeneous particle size distribution as compared to other samples. In contrary, the Y1.67 powders (Figure 5e) were characterized by the largest spread of the particle sizes. A zoom onto the particle surface at 25,000× before and after exposure to hydrogen can be seen in Figure S3 in the Supplementary Information. After hydrogenation, smaller particles with a comparable size distribution were observed in all studied compositions (Figure 5b,d,f). Although not directly comparable, Liu et al. [34] found that when the Y concentration increased in La3-xYxNi9.7Mn0.5Al0.3 (x = 1, 1.5, 1.75, 2, 2.25, 2.5) from x = 1 to x = 1.5, the average particle size increased. Increasing the Y amount further, lowered the average particle size.

Figure 5.
SEM micrographs collected at 250× for: Y1.00, Y1.33 and Y1.67 before (a, c and e, respectively) and after (b, d and f, respectively) hydrogen exposure. Additional micrographs obtained at higher magnification (25,000×) can be found in Supplementary Information (Figure S3).
EDX investigations (Table 5, Supplementary Information Figure S4) consisted of two sets of data acquired for Y1.00, Y1.33 and Y1.67; one focusing on a small region of a seemingly flat particle, with the second covering a larger area (referred to as “overview” in Table 5). A general trend presented in the EDX data confirmed the lower Ni content than in the sample nominal compositions when looking at single particles. Still, when considering at the overview, Ni concentrations were closer to the nominal values. When comparing the nominal composition, the obtained (average) EDX compositions and the refined compositions, it was still observed that the amount of Ni detected in the EDX data was smaller than for the pristine and refined data (Table 6). Hao et al. [44] found that when annealing samples of La0.33Y0.67Ni3.25Mn0.15Al0.1, that the composition in the surface change. It is thus believed this is the reason for the lower Ni contant on the surface, and that it instead is located in the bulk. Further, since the samples are not perfectly flat, this can also influence the final results, altering the ratio of different elements detected.
Table 5.
EDX data collected for the selected intermetallic samples.
Table 6.
The selected sample nominal, chemical and refined compositions.
2.4. PCT
The PCT measurements (Figure 6) were performed for Y1.00, Y1.33 and Y1.67 to investigate in detail, the material hydrogen absorption behaviours. The corresponding Van’t Hoff plots are shown in Figure 6d. The values of the enthalpy and entropy of the hydride formation in the studied samples, along with the expected plateau pressures at 30 °C, are listed in Table 7.
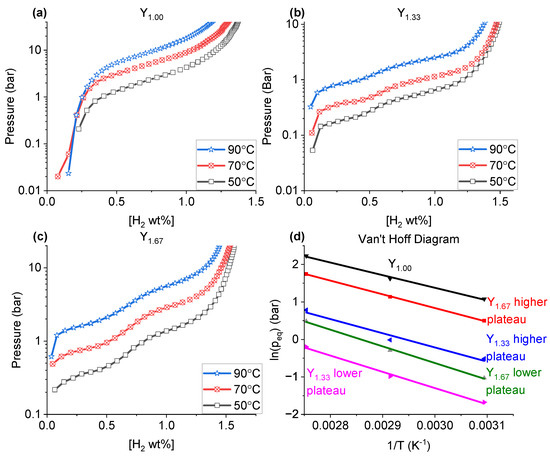
Figure 6.
The PCT diagrams for (a) Y1.00, (b) Y1.33, (c) Y1.67 collected at 50, 70 and 90 °C; (d) the corresponding Van’t Hoff plots.
Table 7.
The obrained values of enthalpy and entropy of hydrogenation, and the calculated plateau pressure for the studied compositions, at 30 °C.
No leaks were detected during the pre-hydrogen exposure setup. For each point of the PCT a step time of 1.5 h has been chosen in order to obtain a PCT measurement with satisfactory accuracy. As an example, Figure S5 of the supplementary information shows a representative kinetics curve obtained for one point during the PCT measurements.
As highlighted in the paper by Rudman [45], great care needs to be taken when measuring the PCT characteristics of a material. A very high P (40 bars) was chosen during activation, and hydrogen was completely absorbed within minutes. During the PCT measurements, a P of 2 bars was set for each point, with the sample experiencing a P of approximately 1 bar due to the reservoir and sample holder volumes described in the experimental section. Here, most hydrogen had been absorbed within minutes, with the absorption being greatly slowed down after 30 min of hydrogen exposure.
While the PCT plot for Y1.00 (Figure 6a) revealed only one clearly visible plateau pressure, at all studied temperatures, the data for Y1.33 and Y1.67 (Figure 6b,c) displayed two hydrogen absorption regions. Furthermore, the single plateau of Y1.00 occurs at a higher hydrogen pressure value (2.9 bar of H2 at 50 °C) than any of the highest plateaus observed for Y1.33 and Y1.67 (0.6 and 1.6 bar of H2 at 50 °C for Y1.33 and Y1.67, respectively). Previous studies showed that for La2Ni7-based materials, either single [46] or multiple [37] plateau pressures can be expected for both single phase (H-A2B7 or R-A2B7) or combined phase materials. It has been discussed that if more than one plateaus were present, it was likely due to: (a) the existence of multiple hydrogen-active (absorbing) phases in the sample [47], and/or (b) the hydrogen absorption at different pressures by various structural subunits [37]. The PCT data presented in Figure 6 differ from those reported in literature for similar compositions, both in the number of plateaus and, in the case of Y1.00, the equilibrium pressures [34,35,37]. Single plateaus in A2B7-type compounds can be obtained by adjusting the subunit volumes [37].
As mentioned earlier, there can be two potential reasons for the appearance of the two plateaus as observed in Y1.33: The appearance of multiple phases [47], or subunits absorbing at different pressures [37]. Since both samples contained multiple phases, it could be assumed that this was the reason for the multiple plateaus. However, for La2-xYxNi7 Zhang et al. [37] argued that the appearance of the multiple plateaus were not due to the H-A2B7 or R-A2B7 phases appearing at the same time, but rather the different subunits absorbing at different pressures due to a difference in volume size.
For Y1.67 (Table 1), a R-AB3 phase was present in addition to the H-A2B7 and R-A2B7-type phases. Earlier studies have found that the equilibrium pressures of R-AB3 were expected to be similar to that of H-A2B7 due to the similarities in their superstacking structures [48,49]. As such, it was considered that the appearance of two plateaus in Y1.33 and Y1.67 was not due to the appearance of different phases, but due to differences in the subunit volumes in these phases.
By increasing the ratio Y/La our measurements showed a higher gas storage capacity (1.37 wt.% for Y1.00 vs. 1.60 wt.% for Y1.67, both at 50 C (Table 8)). This was partly attributed to the lower weight of Y compared to La, though the large increase in capacity from Y1.00 (1.37 wt.% at 50 °C) to Y1.33 (1.57 wt.% at 50 °C) cannot be explained by the sole relative weight difference between La and Y.
Table 8.
The maximum hydrogen storage capacity for the studied materials at different temperatures.
When performing PCT at various temperatures, for each sample a loss of storage capacity was observed as the temperature increase (Figure 6 and Table 8), with a more marked change from 70 °C to 90 °C (between 0.05 and 0.10 wt.% difference) than from 50 °C to 70 °C (between 0.02 and 0.05 wt.% difference). Furthermore, the major changes were observed in Y1.00, compared to the changes for Y1.33 and Y1.67.
According to various findings, the plateau pressure values are affected by either a local chemical (binding) environment between the hydrogen atoms and the metallic atoms in the crystal structure (both A and B elements) [50], and/or differences in unit cell size [51]. According to Khatamian and Manchester [52], the formation enthalpy of YH2 is −219.6 kJ/mol(H2) close to other findings [53], whereas that of LaH2 is −208 kJ/mol(H2) [50,54]. This difference indicates that a higher La-content in the sample should result in higher plateau pressure values. In our case, as indicated by the values obtained for Y1.33 and Y1.67 (Figure 6b,c) it was observed that with increasing Y content the plateaus increased. It is important to note that the plateau pressure were higher for Y1.00 (Figure 6a), when compared to Y1.33 and Y1.67. This goes against the expected trend, seeing as others have shown for A2B7-type materials based on La-Y-Ni the plateau increased the more Y was present, due to a decrease in the average unit cell size [34,35,37]. Further, Zhang et al. [37] showed that in case the two plateaus were due to absorption in the different subunits, the lower plateau pressure can be related to the volume of the A2B4 subunit, in that if the subunit volume decrease, the lower plateau pressure increase. The higher plateau was more complex and requires a more thorough inspection, since some substitutions lead to plateau pressure stabilization, even with changes to the subunit volumes [37].
The measured hydrogenation pressures for Y1.00 absorbed from 2.9 bar at 50 °C to 9.3 bar at 90 °C, for Y1.33 the lower plateau pressure absorb from 0.2 bar at 50 °C to 0.8 bar at 90 °C, the higher pressure go from 0.6 bar at 50 °C to 2.2 bar at 90 °C. Y1.67 displayed a lower plateau absorbing from 0.4 bar at 50 °C to 1.6 bar at 90 °C and a higher plateau of 1.6 bar at 50 °C to 5.7 bar at 90 °C. From these measurements the enthalpy and entropy of formation, using a Van’t Hoff plot as shown in Figure 6d. From these, the pressure plateaus at 30 °C were calculated (Table 7).
Liu et al. [34] found that for La3-xYxNi9.7Mn0.5Al0.3 (x = 1, 1.5, 1.75, 2, 2.25, 2.5) all samples had two plateaus (found via electrochemical measurements). For a composition similar to Y1.00 (La1.5Y1.5Ni9.7Mn0.5Al0.3) the plateaus were at roughly 0.02 bar and 0.07 bar, for La1.0Y2.0Ni9.7Mn0.5Al0.3 (similar to Y1.33) the plateaus were at 0.06 bar and 0.2 bar. Lastly for La0.5Y2.5Ni9.7Mn0.5Al0.3 (similar to Y1.67) the plateaus were at 0.07 bar and 0.3 bar.
Zhao et al. [35] found that La1-xYxNi3.25Mn0.15Al0.10 (x = 0.00–1.00) showed both single and multiple plateau behaviour. When looking at the compositions La0.5Y0.5Ni3.25Mn0.15Al0.10, La0.33Y0.67Ni3.25Mn0.15Al0.10 and La0.12Y0.85Ni3.25Mn0.15Al0.10 (comparable to Y1.00, Y1.33 and Y1.67, respectively) only single plateaus were observed at 0.26 bar, 0.54 bar and 0.94 bar, respectively.
When comparing all of these literature plateau pressure values with the plateau pressures calculated at 30 °C, it was observed that for Y1.00 the calculated plateau was higher than reported values in the literature for both single and multiple plateaus. When comparing the calculated plateau pressures of Y1.33 and Y1.67 to the plateau pressures found by Liu et al. [34] it was observed that all calculated plateau pressures reported here were higher, than the electrochemically measured plateaus reported by Liu et al. By comparing the calculated plateau pressures to those obtained by Zhao et al. [35], it was observed that the single plateaus reported by Zhao et al. have higher plateau pressures, than both of the calculated plateau pressures.
As described, there are no clear trends in the literature regarding this compound, both regarding plateau pressures, but also the number of plateaus. The reported data correspond to this in that no clear trends were found, showing that the picture is more complex, and great care needs to be applied to all known aspects that can affect the hydrogenation properties.
Figure 7 shows the PXD data collected for the three samples before and after PCT experiments, with sample completely desorbed (here called after exposure). The sample with the lowest yttrium concentration (Y1.00) become less crystalline after exposure to hydrogen gas as compared to Y-rich compositions. This suggests that higher Y content helps to retain material crystallinity during hydrogen ab/desorption.
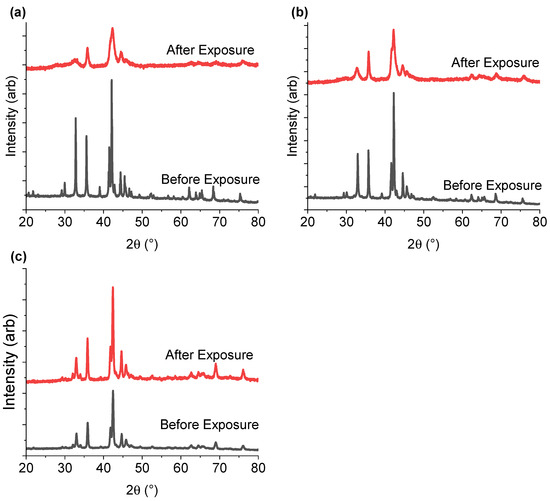
Figure 7.
PXD data for (a) Y1.00, (b) Y1.33, and (c) Y1.67 collected before and after PCT experiments. Red plots correspond to the intermetallic compound after four absorption/desorption cycles (one activation cycle, and three PCT cycles). The black lines correspond to the pristine intermetallic compound. The data are given a vertical offset, allowing for easier reading.
Fang et al. [55] found that if the volumes of the A2B4 and AB5 subunits in a variety of AB3-type intermetallics (PrNi3, NdNi3, SmNi2.67Mn0.33, SmNi3, Sm0.9Mg0.1Ni3 and Nd0.33Er0.67Ni3) were smaller than 89.2 Å3 and 88.3 Å3, respectively, then the material could release all of the absorbed hydrogen. When above these limits, the hydrogen could not be completely desorbed from their respective subunits. The critical volume limits were further confirmed by Zhang et al. [37], who studied a variety of LaxA2-xNi7, (A = Gd, Sm, Y, Mg). Samples of LaxY2-xNi7 with x between 0 and 0.8, had subunit volumes below these critical values mentioned above, and showed the best cycling behaviour.
Among the three hydrogenated samples presented here, only the A2B4 and AB5 subunits of the Y1.67 intermetallic were below the critical values of 89.2 Å3 and 88.3 Å3 (Table 1). When analysing the XRD data before and after hydrogenation, Y1.67 was also the sample with the best-preserved crystallinity after sample activation and three PCT hydrogenation cycles (Figure 7). Thus, the loss in crystallinity and lower capacity for samples with lower Y content may be due to partial hydrogen release. For Y1.00 and Y1.33, while the volumes of the A2B4 subunits exceeded the critical values, sizes of the AB5 subunits were rather borderline values, with Y1.33 being just above the limit. This may explain the appearance of the secondary plateau in the case of Y1.33, as well as the better crystallinity and hydrogen release compared to Y1.00. In the case of Y1.67 the volume values were below the critical limit for both subunits and confirmed the link with better crystallinity compared to the other samples, and the most well-defined plateau regions. Further investigations are needed to confirm this hypothesis.
2.5. Thermal Conductance
Thermal conductivity measurements were performed for the intermetallic powders of Y1.00, Y1.33 and Y1.67 (Figure 8). The measurements were conducted over three rounds, with each round having five measurements. Between rounds, the material was moved around, and re-compacted.
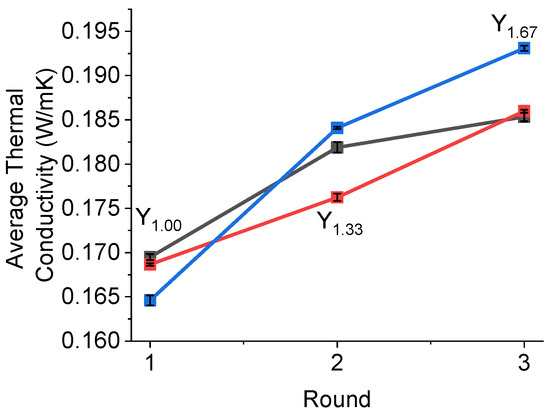
Figure 8.
The average thermal conductivity over three rounds (one round was five measurements). The Y-axis was the average value collected in each round.
The thermal conductivity of hydrogen storage materials is often an overlooked parameter. For intermetallic compounds, the typical value is low and varies between 0.1 and 1 W/mK. While at lab-scale, the limiting factor of hydrogen absorption/desorption often is related to the intrinsic kinetics of hydrogen absorption of the samples [56], for large batches, the hydrogen uptake and release are dependent on the thermal management of the hydrogen storage systems and thermal conductivity of metal hydrides [56].
As can be observed in Figure 8, the data obtained in this study do not suggest any correlation with the Y content or the sample phase compositions. However, while stirring and re-compacting the powders between measurements, higher values of thermal conductivity were achieved, which may indicate that the contact between particles was essential for enhancing the thermal properties of the samples. It was very likely that the higher values of thermal conductivity for Y1.67 were due to the greater particle size distribution in this sample, as observed by SEM (Figure 5).
3. Experimental Tools and Methods
The series of samples with the following nominal compositions:
La2-xYxNi6.50Mn0.33Al0.17, x = 0.33, 0.67, 1.00, 1.33, 1.67, hereafter referred to as Y0.33, Y0.67, Y1.00, Y1.33 and Y1.67, respectively, were prepared according to the synthesis method reported in [12].
The intermetallic powders were studied by high-resolution synchrotron radiation powder X-ray diffraction (HR SR-PXD) at the MCX beamline (Elettra, Basovizza, Italy) [57] (for Y0.33: = 0.7289 Å; for all remaining compositions: = 0.7291 Å; 2 range: 5–38°, step size: 0.008°2). During the measurements, powders were sealed in boron-silica capillaries (d = 0.3 mm) and rotated. The powder neutron diffraction (PND) experiments were carried out with a high resolution diffractometer BT-1 at the National Institute of Standards and Technology (NIST, Gaithersburg, MD, USA) ( = 1.5400 Å; 2 range: 3–167°; step size: 0.05°2, the Cu(311) monochromator). The powders were measured in a 5 mL vanadium can, sealed with an indium wire.
The hydrogen sorption behaviour of the studied compositions was investigated by in situ powder X-ray diffraction carried out with a laboratory Bruker D8 Advance diffractometer, equipped with an in-house built set-up for hydrogen gas pressurisation and thermal sample heating [58]. The data were collected with Cu K1 ( = 1.5406 Å; 2 range: 20–95°; step size: 0.0176°2). The powders, sealed in a beryllium sample holder, were first heated up to 70 °C for 1 h, under dynamic vacuum, and subsequently exposed to static hydrogen pressure in the range of 8–20 bar. The hydrogenated materials were subsequently cooled down to temperatures in the range of 28–30 °C.
The HR SR-PXD and PND data collected for the intermetallic compounds were jointly analysed by Rietveld refinements using the Fullprof Suite program [59]. The diffraction profiles were modelled using the pseudo-Voigt peak shape function with the background being defined by interpolation between manually chosen points. For the final refinement cycles the following parameters were allowed to vary: the scale factors of indexed phases, lattice parameters of indexed phases, up to six profile parameters (U, V, W, mixing factor and two asymmetry parameters) and overall or individual displacement parameters.
To model the hexagonal phase, the La2Ni7 crystal structure was used as a prototype. Based on the previously reported data, it was assumed that Y could substitute only La atoms, while Mn and/or Al could replace exclusively Ni. Based on the structure prototype the 4f1, 4f2 crystallographic sites were assumed to be filled with A elements while 4e, 4f3, 6h and 12k were assumed to be completely filled with B elements. The 2a site was assumed to be completely filled with Ni and not refined [21,31,38]. During the refinement cycles, the occupancy of the 4f1 and 4f2 sites were shared between La and Y, and constrained to 100% for each site. Initially, Ni, Mn and Al atoms were evenly distributed over the 4e, 4f3, 6h and 12k sites according to the nominal compositions. However, to correctly determine the multiple (three atoms) atom occupancy at these sites, their distribution in the crystal structure model was constrained as described in [60]. In the final refinement cycle, Ni was distributed over all five sites, with Mn atoms partly present at the 4e, 4f3 and 6h sites, and Al atoms partially occupying 6h and 12k.
Pressure–Composition–Temperature (PCT) measurements were performed with a Hy-Energy PCTPro-2000 Sieverts apparatus. In each measurement, 3 g of the intermetallic samples were placed into a stainless-steel sample holder with a calibrated volume between 12.5 and 13.0 mL. The sample holder was heated using an external thermal couple inserted into the sample holder. The material was first activated under dynamic vacuum at 70 °C for 1 h, and then exposed to hydrogen gas at 40 bar. Subsequently, the hydrogen was removed from the sample, keeping it under dynamic vacuum at 390 °C overnight. Following the activation, the samples were cooled down to 50, 70 and 90 °C, and the PCT hydrogen absorption data collected (P = 2 bar; no steady state criteria was used, instead a step time of 1.5 h for each point was decided on, ensuring each measured point was as close to equilibrium as possible; maximum applied P = 50 bar; Vreservoir = 11.530 cm3; Vsample holder = 12.430–13.298 cm3 depending on temperature and sample loading). Before the samples were exposed to hydrogen, the system used He gas to perform an automatic leak test. Prior to and after the three PCT experiments reported, sample phase compositions were investigated with a Bruker D2 PHASER ( = 1.5406 Å; 2 range: 20–80°, step size: 0.02°2).
The intermetallic and desorbed hydride powders were also investigated by scanning electron microscopy (SEM) and energy dispersive X-ray spectroscopy (EDX) with a Zeiss EVO MA10 microscope.
The thermal conductivity of the intermetallic powders was determined using the modified transient plane source (MTPS) with a C-Therm Trident system.
4. Conclusions
The structural and hydrogen storage properties of La2-xYxNi6.5Mn0.33Al0.17 sample series have been investigated. It was found that Y initially induced the formation of a H-A2B7-type structure, and that higher Y amounts induced the R-A2B7-type and R-AB3-type structures.
The Rietveld refinement showed that of the two sites (4f1 and 4f1) where La and Y are located, Y initially prefered to enter into the site of the A2B4 subunit (4f1 site), with a small amount entering the AB5 subunit. Instead, when x < 1.00, it was seen that Y primarily entered the AB5 subunit, similar to the behaviour of single substituted samples. Further, it was found that Al resided at the 6h and 12k sites, while Mn resided at the 4f3, 4e and 6h sites at lower Y amounts. When x < 1.00, and Y started entering the AB5 subunit, Al was only located on the 12k, while Mn was only located on the 4e and 6h sites. This indicates that the presence of the smaller Y atom on the 4f2 site, can influence which sites the substituted B atoms are located at.
It was found that if the Y amount was low, the material became amorphous immediately during hydrogen exposure, and at higher Y-contents the crystal structure of the material was preserved. This has been coupled to the subunit volumes, since it was also found that the subunit volumes of the main H-A2B7-type phase decreased with increasing Y content, leading to a better retention of the crystal structure and more defined plateau pressures. Further, by increasing the amount of Y present in the samples, higher hydrogen storage capacities were achieved.
No definitive conclusions could be drawn about the effects of Y on the thermal conductivity nor anti-pulverization ability, and will need further investigation.
Supplementary Materials
The following supporting information can be downloaded at: https://www.mdpi.com/article/10.3390/molecules28093749/s1, Figure S1: In-situ data for all samples: (a) Y0.67, (b) Y1.00, (c) Y1.33, (d) Y1.67 The black lines pristine powder, the red lines after exposure to hydrogen; Figure S2: HR SR-PXD data collected for hydrogenated materials at MCX at Elettra Sinchrotron (Trieste). The samples were stored at ambient conditions in a sealed steel container with Ar gas and in a glovebox over a couple of months. The data were obtained under the same conditions as the SR-HR PXD data presented in Figure 1; Figure S3: SEM micrographs obtained for Y1.00 before hydrogen exposure (a), after hydrogen exposure (b) Y1.33 before hydrogen exposure (c), after hydrogen exposure (d) and Y1.67 before hydrogen exposure (e), after hydrogen exposure (f) at 25,000×; Figure S4: The chosen areas of collecting EDX data. (a) Y1.00, (b) Y1.00 overview. (c) Y1.33, (d) Y1.33 overview. (e) Y1.67, (f) Y1.67 overview; Figure S5: Example of kinetic curve of absorption relative to one point of the PCT measurement. The curve is obtained for a single point at 50 °C for sample Y1.00. At 1.5 h, the measured pressure was 3% lower (2.61 bar) than the pressure after 30 min absorption (2.69 bars).
Author Contributions
Concept: D.N., S.S., E.H.J. and M.N.G.; Data collection: C.M., A.G., E.H.J., M.N.G. and L.L.; XRD Analysis: E.H.J., M.N.G. and P.W.; PCT and Thermal conductace analysis: A.G., C.M. and E.H.J.; Laboratory ressources: A.Z. and C.M.; Writing, editing and review: E.H.J.; Editing and review: A.G., C.M., M.N.G. and S.S. All authors have read and agreed to the published version of the manuscript.
Funding
Part of the project is funded by the UiO:Energy travel/internationalisation grant.
Institutional Review Board Statement
Not applicable.
Informed Consent Statement
Not applicable.
Data Availability Statement
Data can be provided for reasonable requests.
Acknowledgments
We acknowledge Elettra Sincrotrone Trieste (Italy) and the National Institute of Standards and Technology (USA), for providing access to the synchrotron radiation and to the neutron research facilities, respectively, and the technical staff in obtaining data used in this work. Further E.H.J acknowledges to have recieved funding from UiO:Energy.
Conflicts of Interest
The authors declare no conflict of interest.
Abbreviations
The following abbreviations are used in this manuscript:
| RE | Rare Earh |
| HIA | Hydrogen-Induced Amorphisation |
| HR SR-PXD | High-Resolution Synchrotron Radiation Powder X-ray Diffraction |
| PXD | Powder X-ray Diffraction |
| PND | Neutron Powder Diffraction |
| SEM | Scanning Electron Microscopy |
| EDX | Energy Dispersive X-ray Analysis |
| PCT | Pressure-Composition-Temperature |
References
- Robert, F.C.; Sisodia, G.S.; Gopalan, S. A Critical Review on the Utilization of Storage and Demand Response for the Implementation of Renewable Energy Microgrids. Sustain. Cities Soc. 2018, 40, 735–745. [Google Scholar] [CrossRef]
- Eberle, U.; Felderhoff, M.; Schuth, F. Chemical and Physical Solutions for Hydrogen Storage. Angew. Chem. Int. Ed. Engl. 2009, 48, 6608–6630. [Google Scholar] [CrossRef]
- Züttel, A. Materials for Hydrogen Storage. Mater. Today 2003, 6, 24–33. [Google Scholar] [CrossRef]
- Patel, A.K.; Duguay, A.; Tougas, B.; Schade, C.; Sharma, P.; Huot, J. Microstructure and First Hydrogenation Properties of TiFe Alloy with Zr and Mn as Additives. Int. J. Hydrogen Energy 2020, 45, 787–797. [Google Scholar] [CrossRef]
- Møller, K.T.; Jensen, T.R.; Akiba, E.; Li, H.w. Hydrogen—A Sustainable Energy Carrier. Prog. Nat. Sci. 2017, 27, 34–40. [Google Scholar] [CrossRef]
- Zhang, J.; Zhou, G.; Chen, G.; Latroche, M.; Percheron-Guégan, A.; Sun, D. Relevance of Hydrogen Storage Properties of ANi3 Intermetallics (A = La, Ce, Y) to the ANi2 Subunits in Their Crystal Structures. Acta Mater. 2008, 56, 5388–5394. [Google Scholar] [CrossRef]
- Shi, Y.; Leng, H.Y.; Wei, L.; Chen, S.L.; Li, Q. The Microstructure and Electrochemical Properties of Mn-doped La-Y-Ni-based Metal-Hydride Electrode Materials. Electrochim. Acta 2019, 296, 18–26. [Google Scholar] [CrossRef]
- Lin, X.; Yang, H.G.; Zhu, Q.; Li, Q. Numerical Simulation of a Metal Hydride Tank with LaNi4.25Al0.75 Using a Novel Kinetic Model at Constant Flows. Chem. Eng. J. 2020, 401, 11. [Google Scholar] [CrossRef]
- Fan, Y.; Zhang, L.; Xue, C.; Fan, G.; Liu, J.; Liu, B.; Han, S. Superior Electrochemical Performances of La Mg Ni Alloys with A2B7/A5B19 Double Phase. Int. J. Hydrogen Energy 2019, 44, 7402–7413. [Google Scholar] [CrossRef]
- Romero, G.; Lv, P.; Huot, J. Effect of Ball Milling on the First Hydrogenation of TiFe Alloy Doped with 4 wt.% (Zr + 2Mn) Additive. J. Mater. Sci. 2018, 53, 13751–13757. [Google Scholar] [CrossRef]
- Zhang, H.W.; Fu, L.; Xuan, W.D.; Qi, J.B. Surface Modification of the La1.7Mg1.3Ni9 Alloy with Trace Y2O3 Related to the Electrochemical Hydrogen Storage Properties. Renew. Energ. 2020, 145, 1572–1577. [Google Scholar] [CrossRef]
- Yan, H.; Xiong, W.; Wang, L.; Li, B.; Li, J.; Zhao, X. Investigations on AB3-, A2B7- and A5B19-Type La Y Ni System Hydrogen Storage Alloys. Int. J. Hydrogen Energy 2017, 42, 2257–2264. [Google Scholar] [CrossRef]
- Baddour-Hadjean, R.; Pereira-Ramos, J.P.; Latroche, M.; Percheron-Guégan, A. New Ternary Intermetallic Compounds Belonging to the R–Y–Ni (R=La, Ce) System as Negative Electrodes for Ni–MH Batteries. J. Alloys Compd. 2002, 330–332, 782–786. [Google Scholar] [CrossRef]
- Cao, Z.J.; Ouyang, L.Z.; Li, L.L.; Lu, Y.S.; Wang, H.; Liu, J.W.; Min, D.; Chen, Y.W.; Xiao, F.M.; Sun, T.; et al. Enhanced Discharge Capacity and Cycling Properties in High-Samarium, Praseodymium/Neodymium-Free, and Low-Cobalt A2B7 Electrode Materials for Nickel-Metal Hydride Battery. Int. J. Hydrogen Energy 2015, 40, 451–455. [Google Scholar] [CrossRef]
- Pan, H.; Jin, Q.; Gao, M.; Liu, Y.; Li, R.; Lei, Y. Effect of the Cerium Content on the Structural and Electrochemical Properties of the La0.7-xCexMg0.3Ni2.875Mn0.1Co0.525 (X=0–0.5) Hydrogen Storage Alloys. J. Alloys Compd. 2004, 373, 237–245. [Google Scholar] [CrossRef]
- Young, K.; Ouchi, T.; Shen, H.; Bendersky, L.A. Hydrogen Induced Amorphization of LaMgNi4 Phase in Metal Hydride Alloys. Int. J. Hydrogen Energy 2015, 40, 8941–8947. [Google Scholar] [CrossRef]
- Latroche, M.; Baddour-Hadjean, R.; Percheron-Guégan, A. Crystallographic and Hydriding Properties of the System La1-xCexY2Ni9 (xCe=0, 0.5 and 1). J. Solid State Chem. 2003, 173, 236–243. [Google Scholar] [CrossRef]
- Kohno, T.; Yoshida, H.; Kawashima, F.; Inaba, T.; Sakai, I.; Yamamoto, M.; Kanda, M. Hydrogen Storage Properties of New Ternary System Alloys: La2MgNi9, La5Mg2Ni23, La3MgNi14. J. Alloys Compd. 2000, 311, L5–L7. [Google Scholar] [CrossRef]
- Nowak, M.; Balcerzak, M.; Jurczyk, M. Effect of Substitutional Elements on the Thermodynamic and Electrochemical Properties of Mechanically Alloyed La1.5Mg0.5Ni7-xMx Alloys (M = Al, Mn). Metals 2020, 10, 578. [Google Scholar] [CrossRef]
- Zhai, T.t.; Yang, T.; Yuan, Z.m.; Zhang, Y.h. An Investigation on Electrochemical and Gaseous Hydrogen Storage Performances of As-Cast La1-xPrxMgNi3.6Co0.4 (x = 0–0.4) Alloys. Int. J. Hydrogen Energy 2014, 39, 14282–14287. [Google Scholar] [CrossRef]
- Guzik, M.N.; Lang, J.L.; Huot, J.; Sartori, S. Effect of Al Presence and Synthesis Method on Phase Composition of the Hydrogen Absorbing La-Mg-Ni-based Compounds. Int. J. Hydrogen Energy 2017, 42, 30135–30144. [Google Scholar] [CrossRef]
- Gao, Z.; Yang, Z.; Li, Y.; Deng, A.; Luo, Y.; Li, H.W. Improving the Phase Stability and Cycling Performance of Ce2Ni7-Type RE-Mg-Ni Alloy Electrodes by High Electronegativity Element Substitution. Dalton Trans. 2018, 47, 16453–16460. [Google Scholar] [CrossRef] [PubMed]
- Young, K.; Ouchi, T.; Huang, B. Effects of Annealing and Stoichiometry to (Nd, Mg)(Ni, Al)3.5 Metal Hydride Alloys. J. Power Sources 2012, 215, 152–159. [Google Scholar] [CrossRef]
- Zhang, J.; Villeroy, B.; Knosp, B.; Bernard, P.; Latroche, M. Structural and Chemical Analyses of the New Ternary La5MgNi24 Phase Synthesized by Spark Plasma Sintering and Used as Negative Electrode Material for Ni-MH Batteries. Int. J. Hydrogen Energy 2012, 37, 5225–5233. [Google Scholar] [CrossRef]
- Liu, J.; Han, S.; Han, D.; Li, Y.; Yang, S.; Zhang, L.; Zhao, Y. Enhanced Cycling Stability and High Rate Dischargeability of (La,Mg)2Ni7 -Type Hydrogen Storage Alloys with (La,Mg)5Ni19 Minor Phase. J. Power Sources 2015, 287, 237–246. [Google Scholar] [CrossRef]
- Tian, X.; Yun, G.; Wang, H.; Shang, T.; Yao, Z.; Wei, W.; Liang, X. Preparation and Electrochemical Properties of La–Mg–Ni-based La0.75Mg0.25Ni3.3Co0.5 Multiphase Hydrogen Storage Alloy as Negative Material of Ni/MH Battery. Int. J. Hydrogen Energy 2014, 39, 8474–8481. [Google Scholar] [CrossRef]
- Li, Y.M.; Liu, Z.C.; Zhang, G.F.; Zhang, Y.H.; Ren, H.P. Phase Transformation by a Step-Growth Mechanism in Annealed La-Mg-Ni-based Layered-Stacking Alloys. J. Alloys Compd. 2020, 834, 11. [Google Scholar] [CrossRef]
- Baddour-Hadjean, R.; Meyer, L.; Pereira-Ramos, J.P.; Latroche, M.; Percheron-Guegan, A. An Electrochemical Study of New La1-xCexY2Ni9 (0≤x≤1) Hydrogen Storage Alloys. Electrochim. Acta 2001, 46, 2385–2393. [Google Scholar] [CrossRef]
- Belgacem, Y.B.; Khaldi, C.; Boussami, S.; Lamloumi, J.; Mathlouthi, H. Electrochemical Properties of LaY2Ni9 Hydrogen Storage Alloy, Used as an Anode in Nickel-Metal Hydride Batteries. J. Solid State Electrochem. 2014, 18, 2019–2026. [Google Scholar] [CrossRef]
- Xiong, W.; Yan, H.; Wang, L.; Verbetsky, V.; Zhao, X.; Mitrokhin, S.; Li, B.; Li, J.; Wang, Y. Characteristics of A2B7-Type La Y Ni-based Hydrogen Storage Alloys Modified by Partially Substituting Ni with Mn. Int. J. Hydrogen Energy 2017, 42, 10131–10141. [Google Scholar] [CrossRef]
- Deng, A.; Luo, Y.; Zhou, J.; Xie, Y.; Yuan, Y.; Kang, X.; Shen, B.; Zhang, H. Effect of Mn Element on the Structures and Properties of A2B7-Type La–Y–Ni-Based Hydrogen Storage Alloys. Metals 2022, 12, 1122. [Google Scholar] [CrossRef]
- Zhao, S.; Wang, H.; Yang, L.; Liu, J.; Ouyang, L.; Zhu, M. Modulating Superlattice Structure and Cyclic Stability of Ce2Ni7-Type LaY2Ni10.5-Based Alloys by Mn, Al, and Zr Substitutions. J. Power Sources 2022, 524, 231067. [Google Scholar] [CrossRef]
- European Commission; Joint Research Centre; Institute for Energy; Broom, D. Hydrogen Sorption Measurements on Potential Storage Materials: Experimental Methods and Measurement Accuracy; Publications Office: Luxembourg, 2008.
- Liu, Y.; Yuan, H.; Guo, M.; Jiang, L. Effect of Y Element on Cyclic Stability of A2B7 -Type La–Y–Ni-based Hydrogen Storage Alloy. Int. J. Hydrogen Energy 2019, 44, 22064–22073. [Google Scholar] [CrossRef]
- Zhao, L.; Luo, Y.; Deng, A.; Jiang, W. Hydrogen Storage and Electrochemical Properties of the Mg-free A2B7-Type La1-xYxNi3.25Mn0.15Al0.1 Alloys with Superlattice Structure. Chem. J. Chinese U. 2018, 39, 1993–2002. [Google Scholar] [CrossRef]
- Paul-Boncour, V.; Crivello, J.C.; Madern, N.; Zhang, J.; Diop, L.V.B.; Charbonnier, V.; Monnier, J.; Latroche, M. Correlations between Stacked Structures and Weak Itinerant Magnetic Properties of La2-xYxNi7 Compounds. J. Phys. Condens. Matter 2020, 32, 415804. [Google Scholar] [CrossRef]
- Zhang, J.; Charbonnier, V.; Madern, N.; Monnier, J.; Latroche, M. Improvement of Reversible H Storage Capacity by Fine Tuning of the Composition in the Pseudo-Binary Systems A2-LaNi7 (A = Gd, Sm, Y, Mg). J. Alloys Compd. 2021, 852, 157008. [Google Scholar] [CrossRef]
- Wang, L.; Zhang, X.; Zhou, S.; Xu, J.; Yan, H.; Luo, Q.; Li, Q. Effect of Al Content on the Structural and Electrochemical Properties of A2B7 Type La–Y–Ni Based Hydrogen Storage Alloy. Int. J. Hydrogen Energy 2020, 45, 16677–16689. [Google Scholar] [CrossRef]
- Miracle, D.B.; Louzguine-Luzgin, D.V.; Louzguina-Luzgina, L.V.; Inoue, A. An Assessment of Binary Metallic Glasses: Correlations between Structure, Glass Forming Ability and Stability. Int. Mater. Rev. 2010, 55, 218–256. [Google Scholar] [CrossRef]
- Buschow, K.H.J.; Van Der Goot, A.S. The Crystal Structure of Rare-Earth Nickel Compounds of the Type R2Ni7. J. Less-Common Met. 1970, 22, 419–428. [Google Scholar] [CrossRef]
- Yartys, V.A.; Vajeeston, P.; Riabov, A.B.; Ravindran, P.; Denys, R.V.; Maehlen, J.P.; Delaplane, R.G.; Fjellvag, H. Crystal Chemistry and Metal-Hydrogen Bonding in Anisotropic and Interstitial Hydrides of Intermetallics of Rare Earth (R) and Transition Metals (T), RT3 and R2T7. Z. Krist. 2008, 223, 674–689. [Google Scholar] [CrossRef]
- Yasuoka, S.; Ishida, J.; Kai, T.; Kajiwara, T.; Doi, S.; Yamazaki, T.; Kishida, K.; Inui, H. Function of Aluminum in Crystal Structure of Rare Earth–Mg–Ni Hydrogen-Absorbing Alloy and Deterioration Mechanism of Nd0.9Mg0.1Ni3.5and Nd0.9Mg0.1Ni3.3Al0.2alloys. Int. J. Hydrogen Energy 2017, 42, 11574–11583. [Google Scholar] [CrossRef]
- Aoki, K.; Masumoto, T. Hydrogen-Induced Amorphization of Intermetallics. J. Alloy. Compd. 1995, 231, 20–28. [Google Scholar] [CrossRef]
- Hao, W.; Yong-Chun, L.U.O.; Lei, Z.; An-Qiang, D.; Wan-Ting, J. Annealing Temperatue on Structural and Electrochemical Property of Mg-Free La-Y-ni Based A2B7-Type Hydrogen Storage Alloys. J. Inorg. Mater. 2018, 33, 434–440. [Google Scholar] [CrossRef]
- Rudman, P. Hydriding and Dehydriding Kinetics. J. Less Common Met. 1983, 89, 93–110. [Google Scholar] [CrossRef]
- Denys, R.V.; Riabov, A.B.; Yartys, V.A.; Sato, M.; Delaplane, R.G. Mg Substitution Effect on the Hydrogenation Behaviour, Thermodynamic and Structural Properties of the La2Ni7-H(D)2 System. J. Solid State Chem. 2008, 181, 812–821. [Google Scholar] [CrossRef]
- Xiong, W.; Yan, H.Z.; Wang, L.; Zhao, X.; Li, J.; Li, B.Q.; Wang, Y. Effects of Annealing Temperature on the Structure and Properties of the LaY2Ni10Mn0.5 Hydrogen Storage Alloy. Int. J. Hydrogen Energy 2017, 42, 15319–15327. [Google Scholar] [CrossRef]
- Liu, J.; Han, S.; Li, Y.; Yang, S.; Shen, W.; Zhang, L.; Zhou, Y. An Investigation on Phase Transformation and Electrochemical Properties of As-Cast and Annealed La0.75Mg0.25Nix (X = 3.0, 3.3, 3.5, 3.8) Alloys. J. Alloys Compd. 2013, 552, 119–126. [Google Scholar] [CrossRef]
- Gao, J.; Yan, X.; Zhao, Z.; Chai, Y.; Hou, D. Effect of Annealed Treatment on Microstructure and Cyclic Stability for La–Mg–Ni Hydrogen Storage Alloys. J. Power Sources 2012, 209, 257–261. [Google Scholar] [CrossRef]
- Lai, Q.; Sun, Y.; Wang, T.; Modi, P.; Cazorla, C.; Demirci, U.B.; Ares Fernandez, J.R.; Leardini, F.; Aguey-Zinsou, K.F. How to Design Hydrogen Storage Materials? Fundamentals, Synthesis, and Storage Tanks. Adv. Sustain. Syst. 2019, 3, 1900043. [Google Scholar] [CrossRef]
- Mendelsohn, M.H.; Gruen, D.M.; Dwight, A.E. LaNi5-xAlx Is a Versatile Alloy System for Metal Hydride Applications. Nature 1977, 269, 45–47. [Google Scholar] [CrossRef]
- Khatamian, D.; Manchester, F.D. The H-Y (Hydrogen-Yttrium) System. Bull. Alloy Phase Diagr. 1988, 9, 252–260. [Google Scholar] [CrossRef]
- Khodja, K.; Seddik, L.; Bouhadda, Y. Solid-State Structure and Propertis of Yttrium Hydride. In Proceedings of the 3rd International Seminar on New and Renewable Energies, Ghardaia, Algeria, 13–14 October 2014. [Google Scholar]
- Nickels, E. Structural and Thermogravimetric Studies of Group I and II Borohydrides. Ph.D. Thesis, Oxford University, Oxford, UK, 2010. [Google Scholar]
- Fang, F.; Chen, Z.L.; Wu, D.Y.; Liu, H.; Dong, C.K.; Song, Y.; Sun, D.L. Subunit Volume Control Mechanism for Dehydrogenation Performance of AB3-Type Superlattice Intermetallics. J. Power Sources 2019, 427, 145–153. [Google Scholar] [CrossRef]
- Jensen, E.H.; Dornheim, M.; Sartori, S. Scaling up Metal Hydrides for Real-Scale Applications: Achievements, Challenges and Outlook. Inorganics 2021, 9, 37. [Google Scholar] [CrossRef]
- Rebuffi, L.; Plaisier, J.R.; Abdellatief, M.; Lausi, A.; Scardi, P. MCX: A Synchrotron Radiation Beamline for X-ray Diffraction Line Profile Analysis. Z. Anorg. Allg. Chem. 2014, 640, 3100–3106. [Google Scholar] [CrossRef]
- Mauron, P.; Bielmann, M.; Remhof, A.; Zuttel, A. High-Pressure and High-Temperature X-ray Diffraction Cell for Combined Pressure, Composition, and Temperature Measurements of Hydrides. Rev. Sci. Instrum. 2011, 82, 065108. [Google Scholar] [CrossRef]
- Rodríguez-Carvajal, J. Recent Advances in Magnetic Structure Determination by Neutron Powder Diffraction. Phys. B 1993, 192, 55–69. [Google Scholar] [CrossRef]
- Joubert, J.M.; Cerny, R.; Latroche, M.; Percheron-Guegan, A.; Yvon, K. Site Occupancies in the Battery Electrode Material LaNi3.55Mn0.4Al0.3Co0.75 as Determined by Multiwavelength Synchrotron Powder Diffraction. J. Appl. Crystallogr. 1998, 31, 327–332. [Google Scholar] [CrossRef]
Disclaimer/Publisher’s Note: The statements, opinions and data contained in all publications are solely those of the individual author(s) and contributor(s) and not of MDPI and/or the editor(s). MDPI and/or the editor(s) disclaim responsibility for any injury to people or property resulting from any ideas, methods, instructions or products referred to in the content. |
© 2023 by the authors. Licensee MDPI, Basel, Switzerland. This article is an open access article distributed under the terms and conditions of the Creative Commons Attribution (CC BY) license (https://creativecommons.org/licenses/by/4.0/).