


Nanocrystalline Skinnerite (Cu3SbS3) Prepared by High-Energy Milling in a Laboratory and an Industrial Mill and Its Optical and Optoelectrical Properties
 ,
,  ,
,  , ,
, ,  and
and 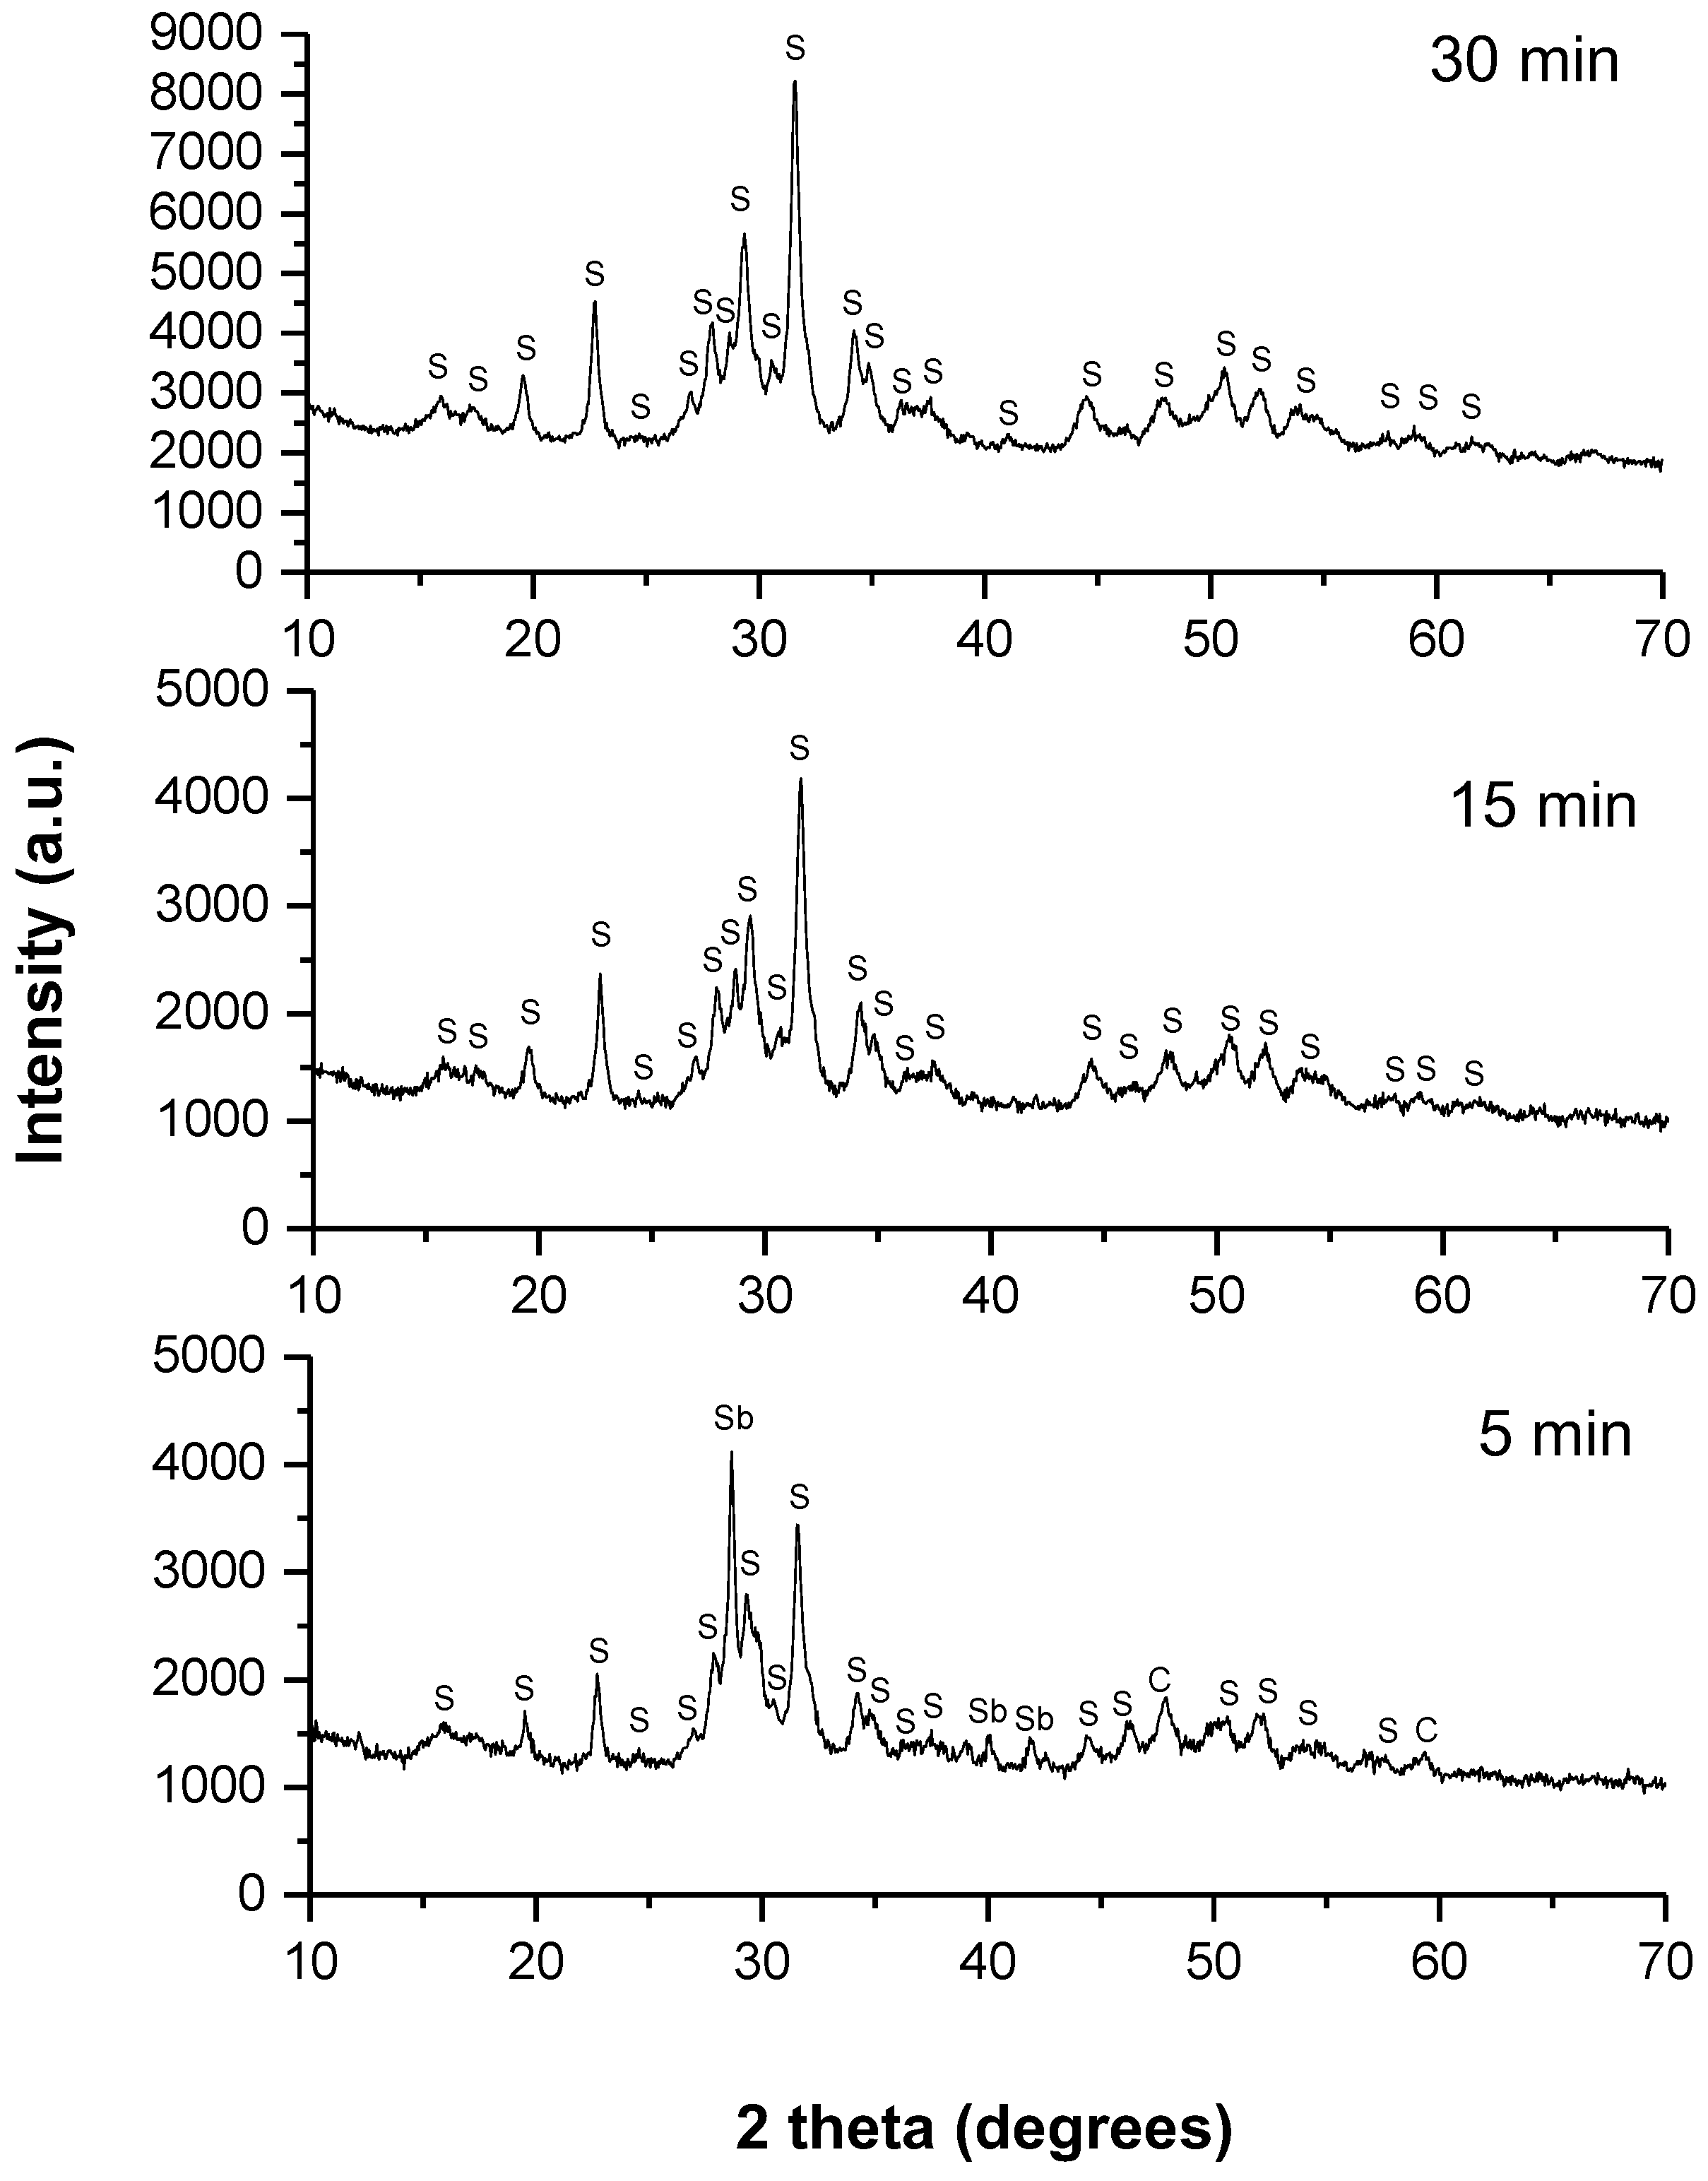
Abstract
1. Introduction
2. Results
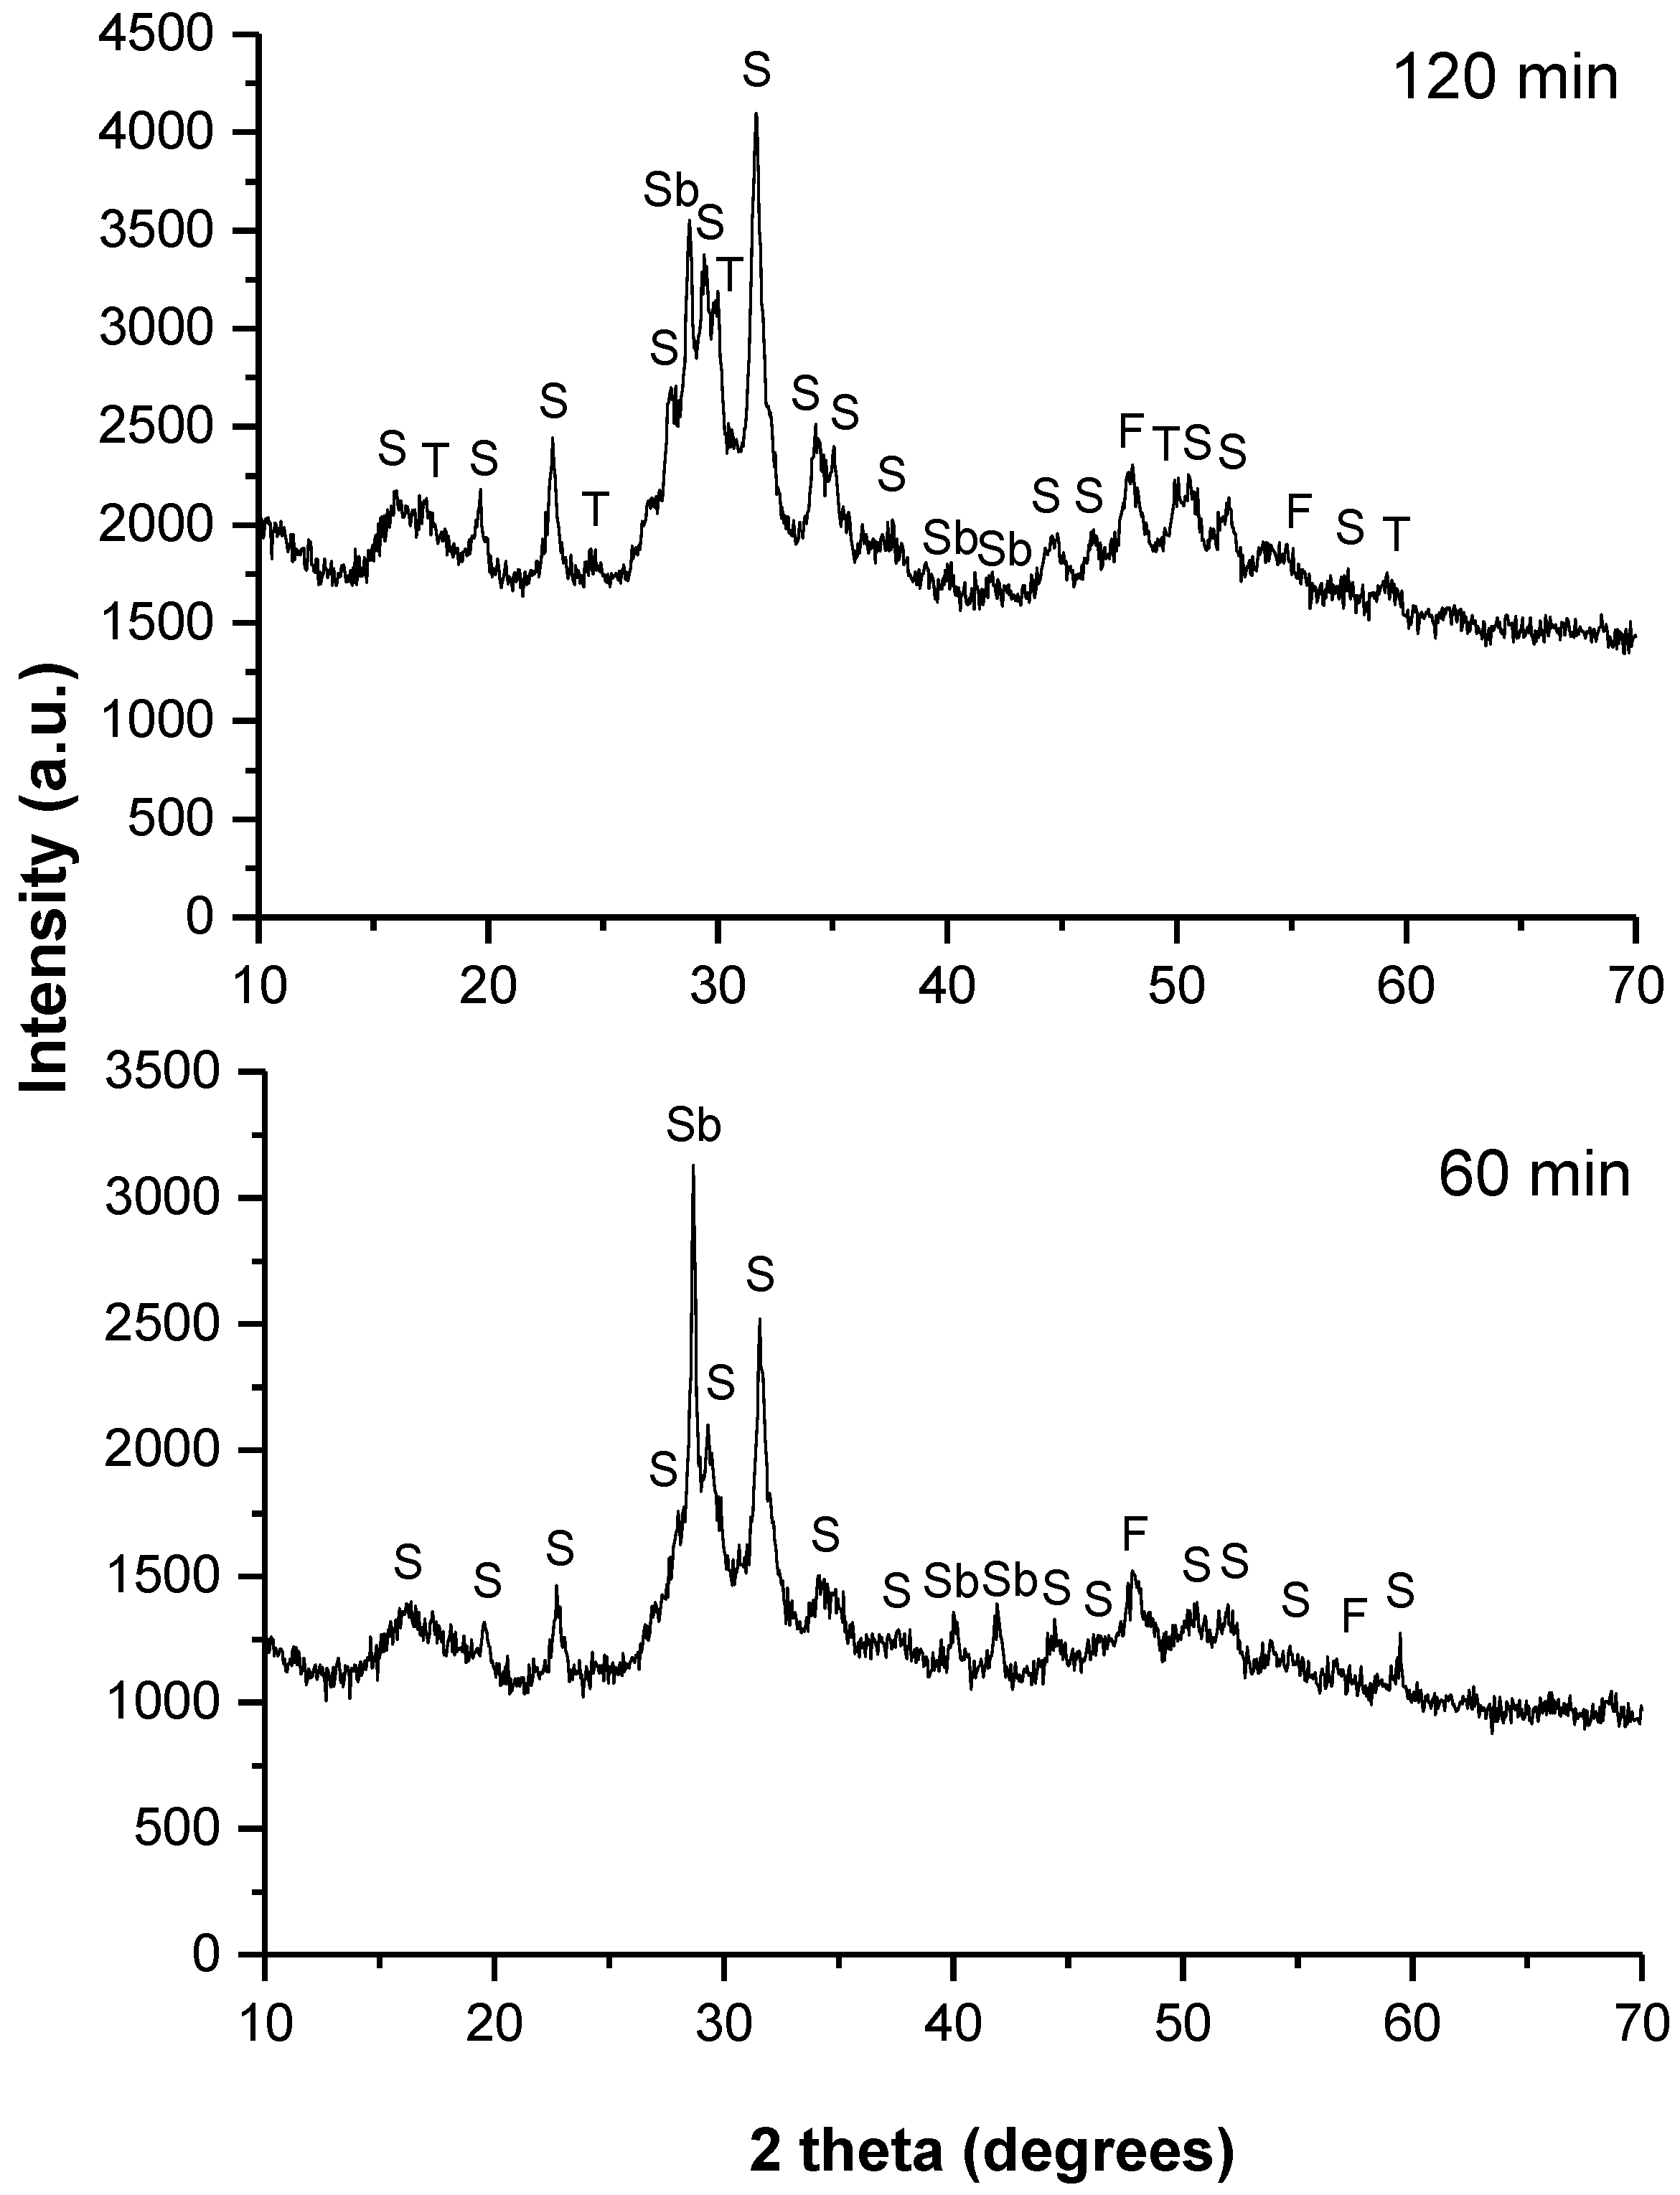
2.1. Reaction Kinetics and Structural Characterization of Skinnerite (Cu3SbS3) Mechanochemically Synthesized in a Laboratory and an Industrial Mill
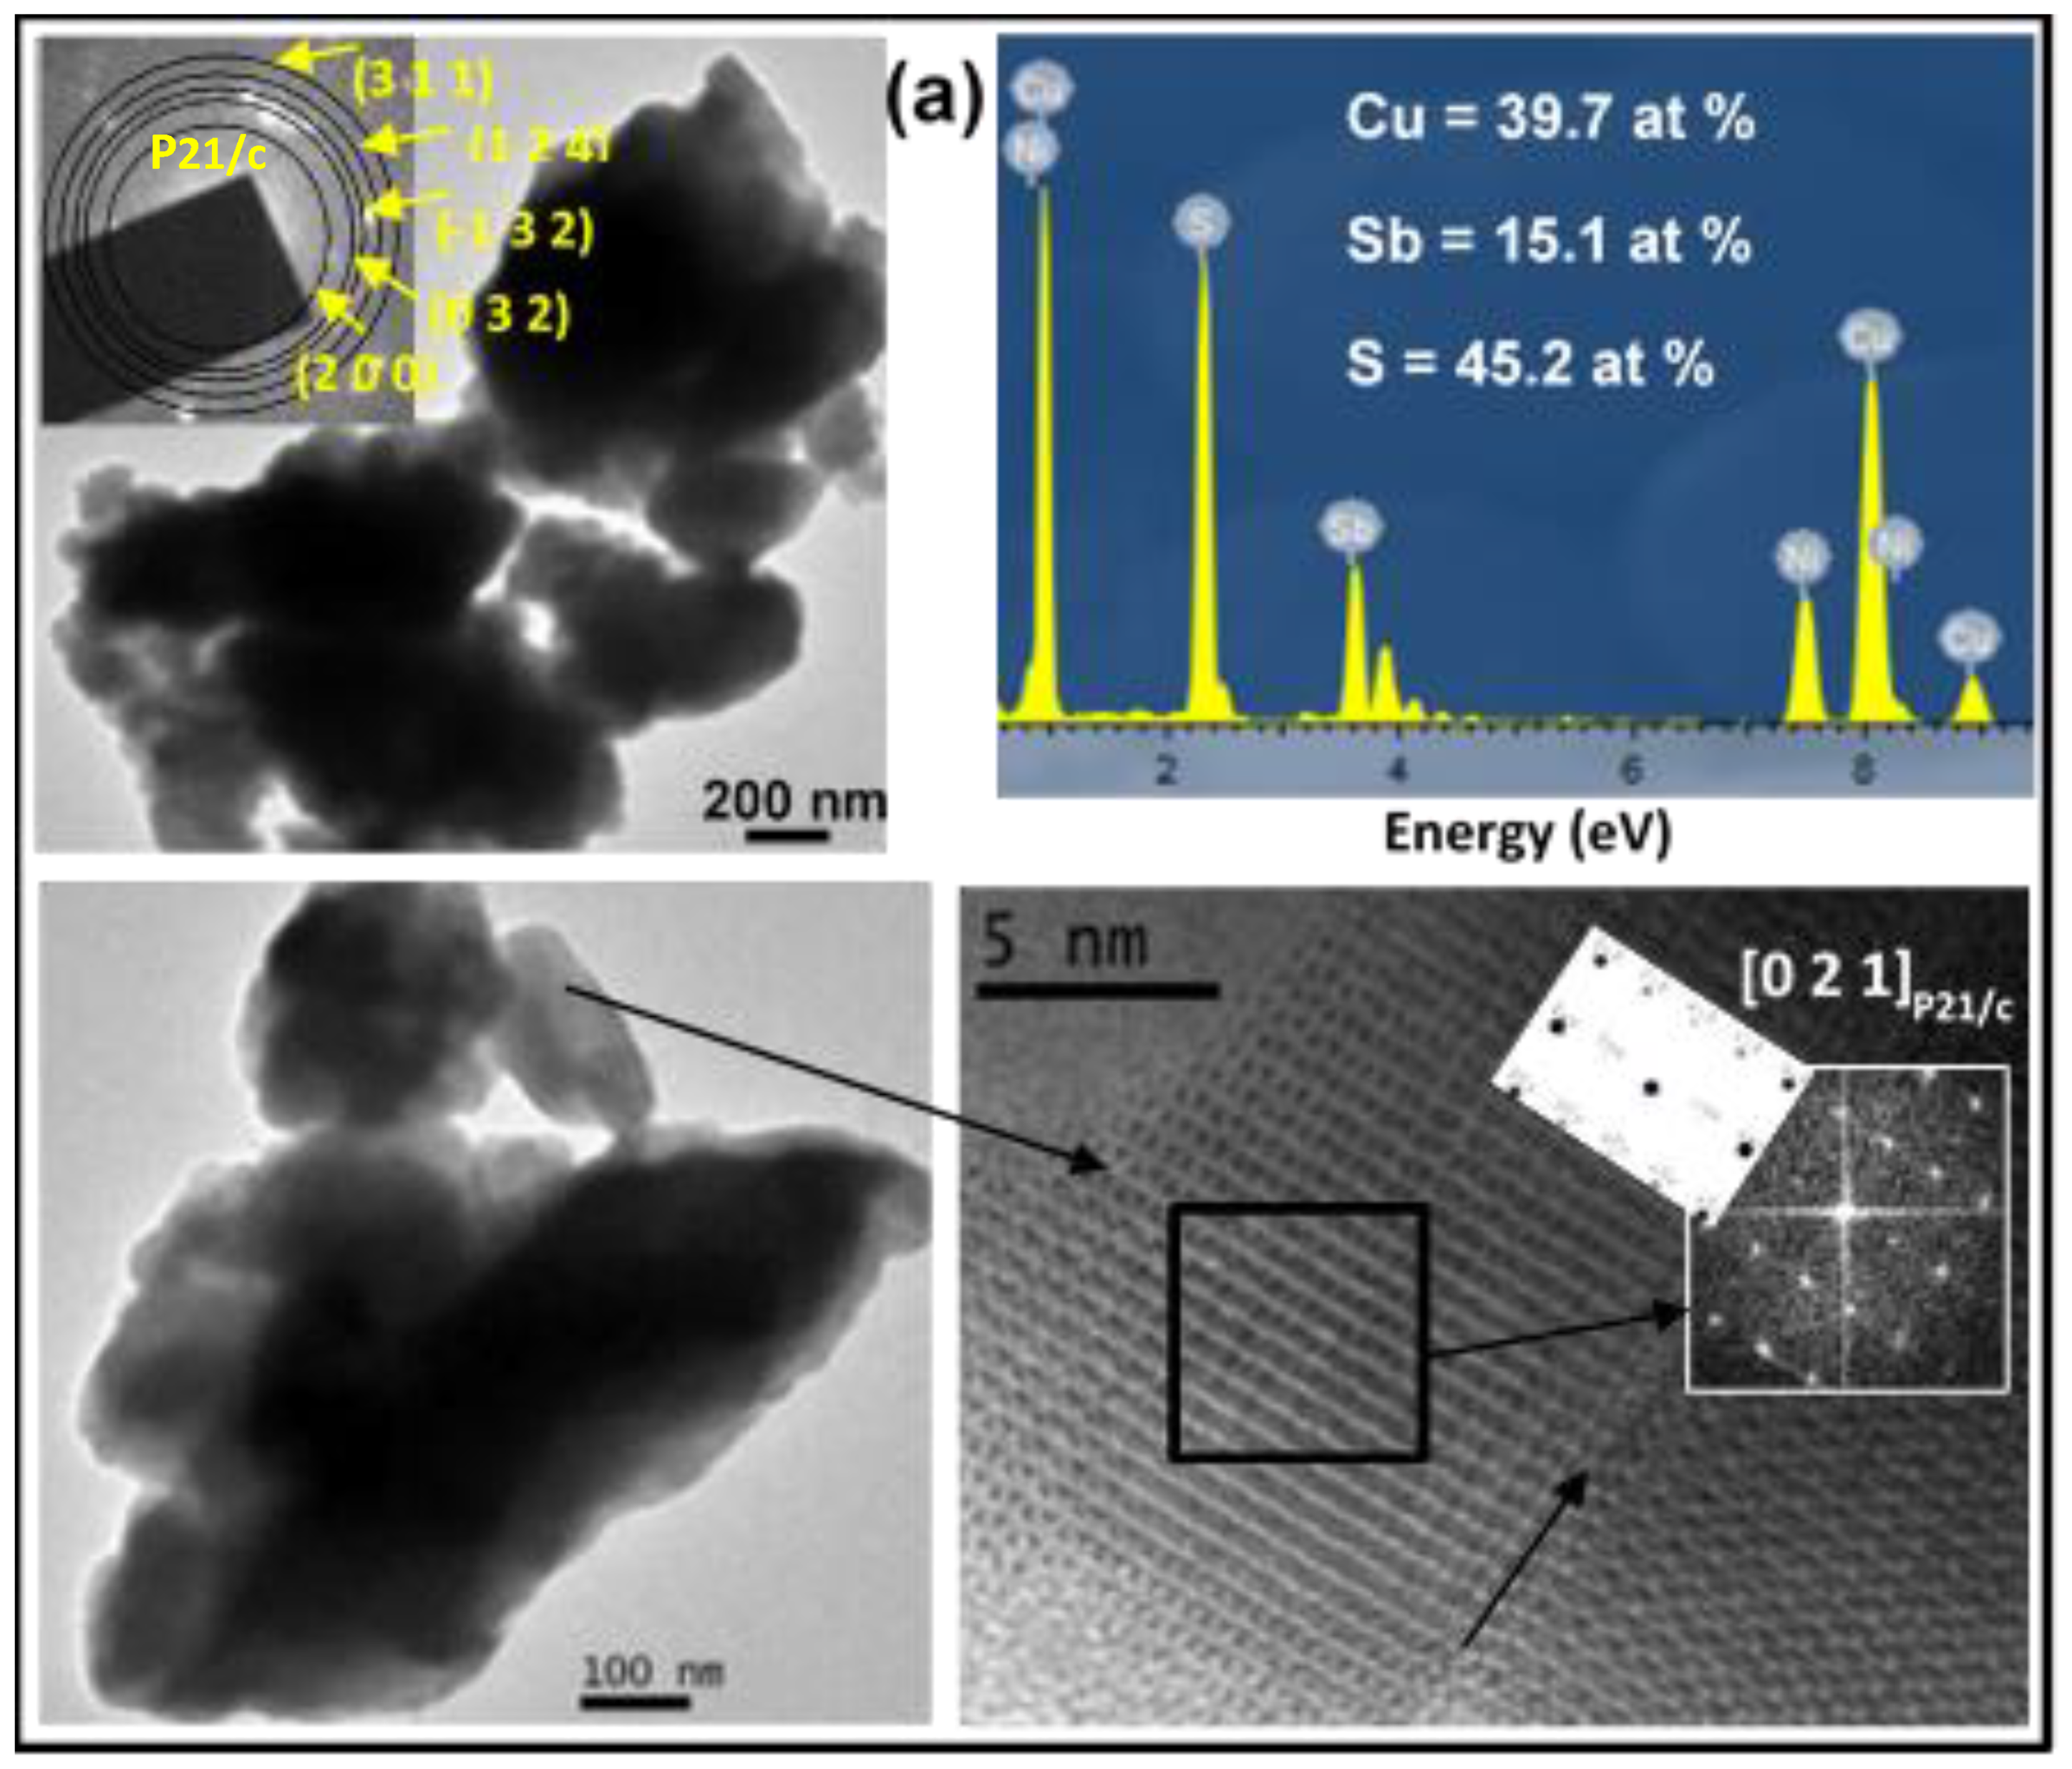
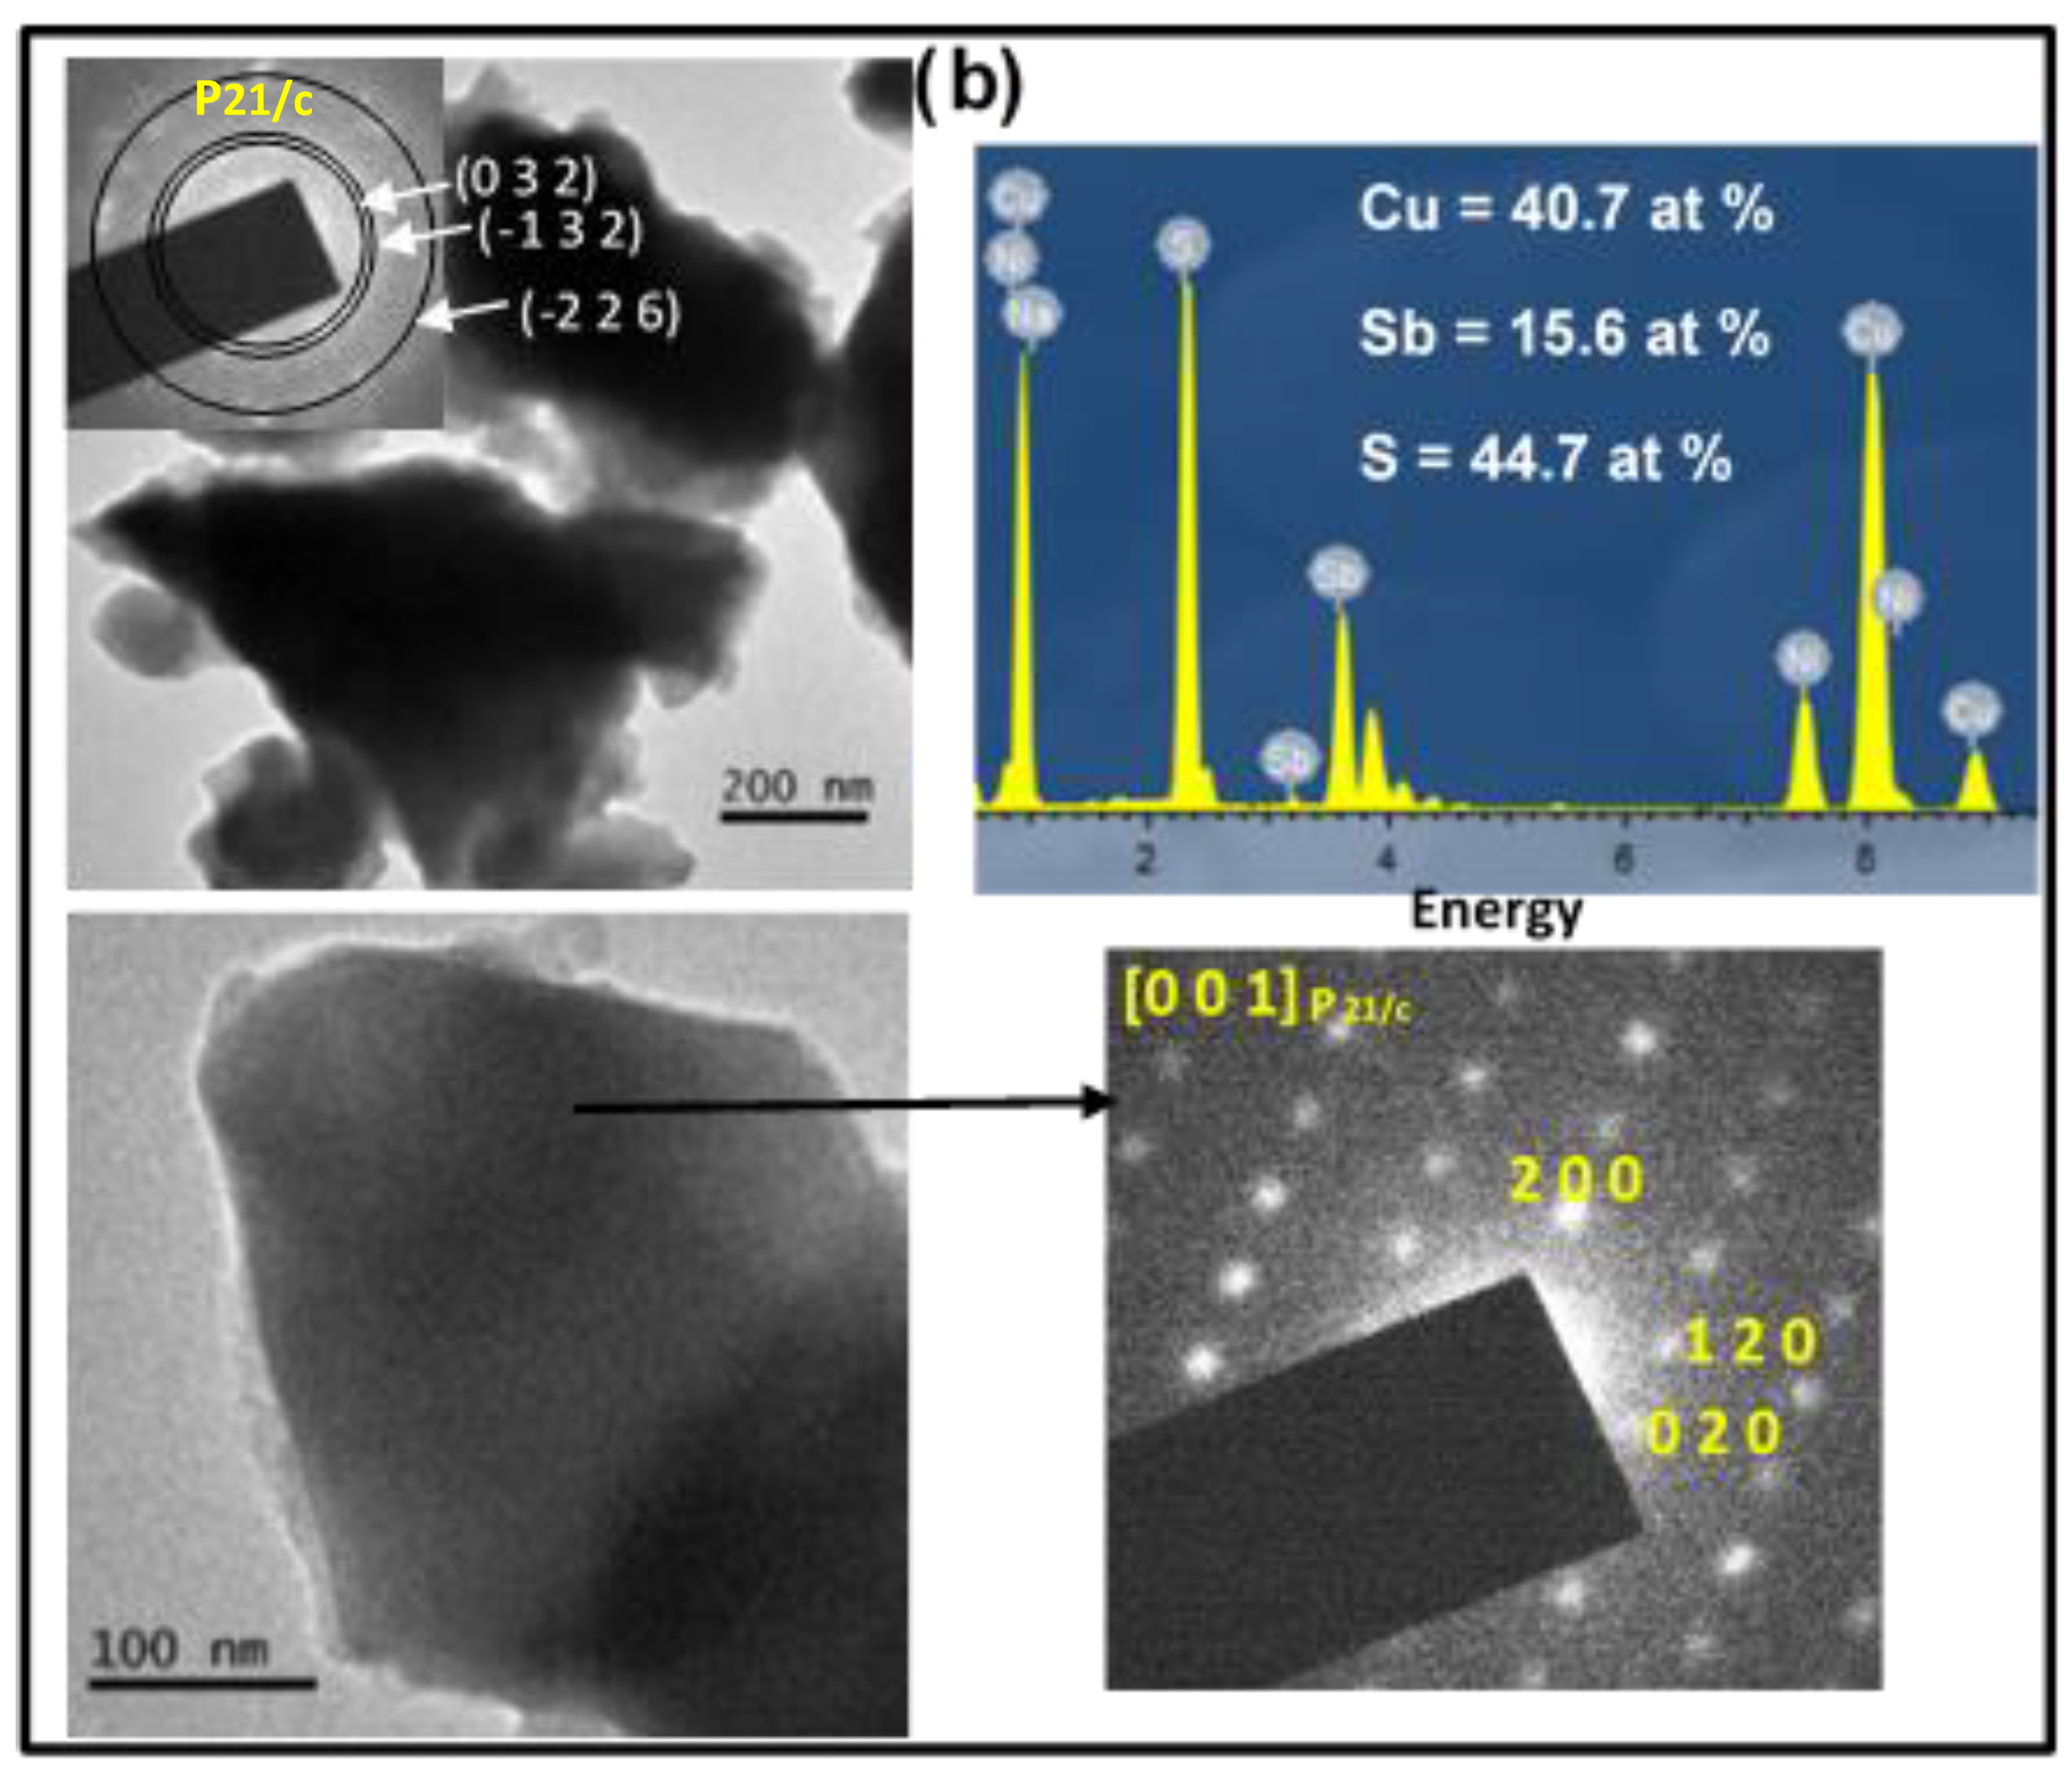
2.2. Microstructural Characterization of Final Products Prepared in Both Mills
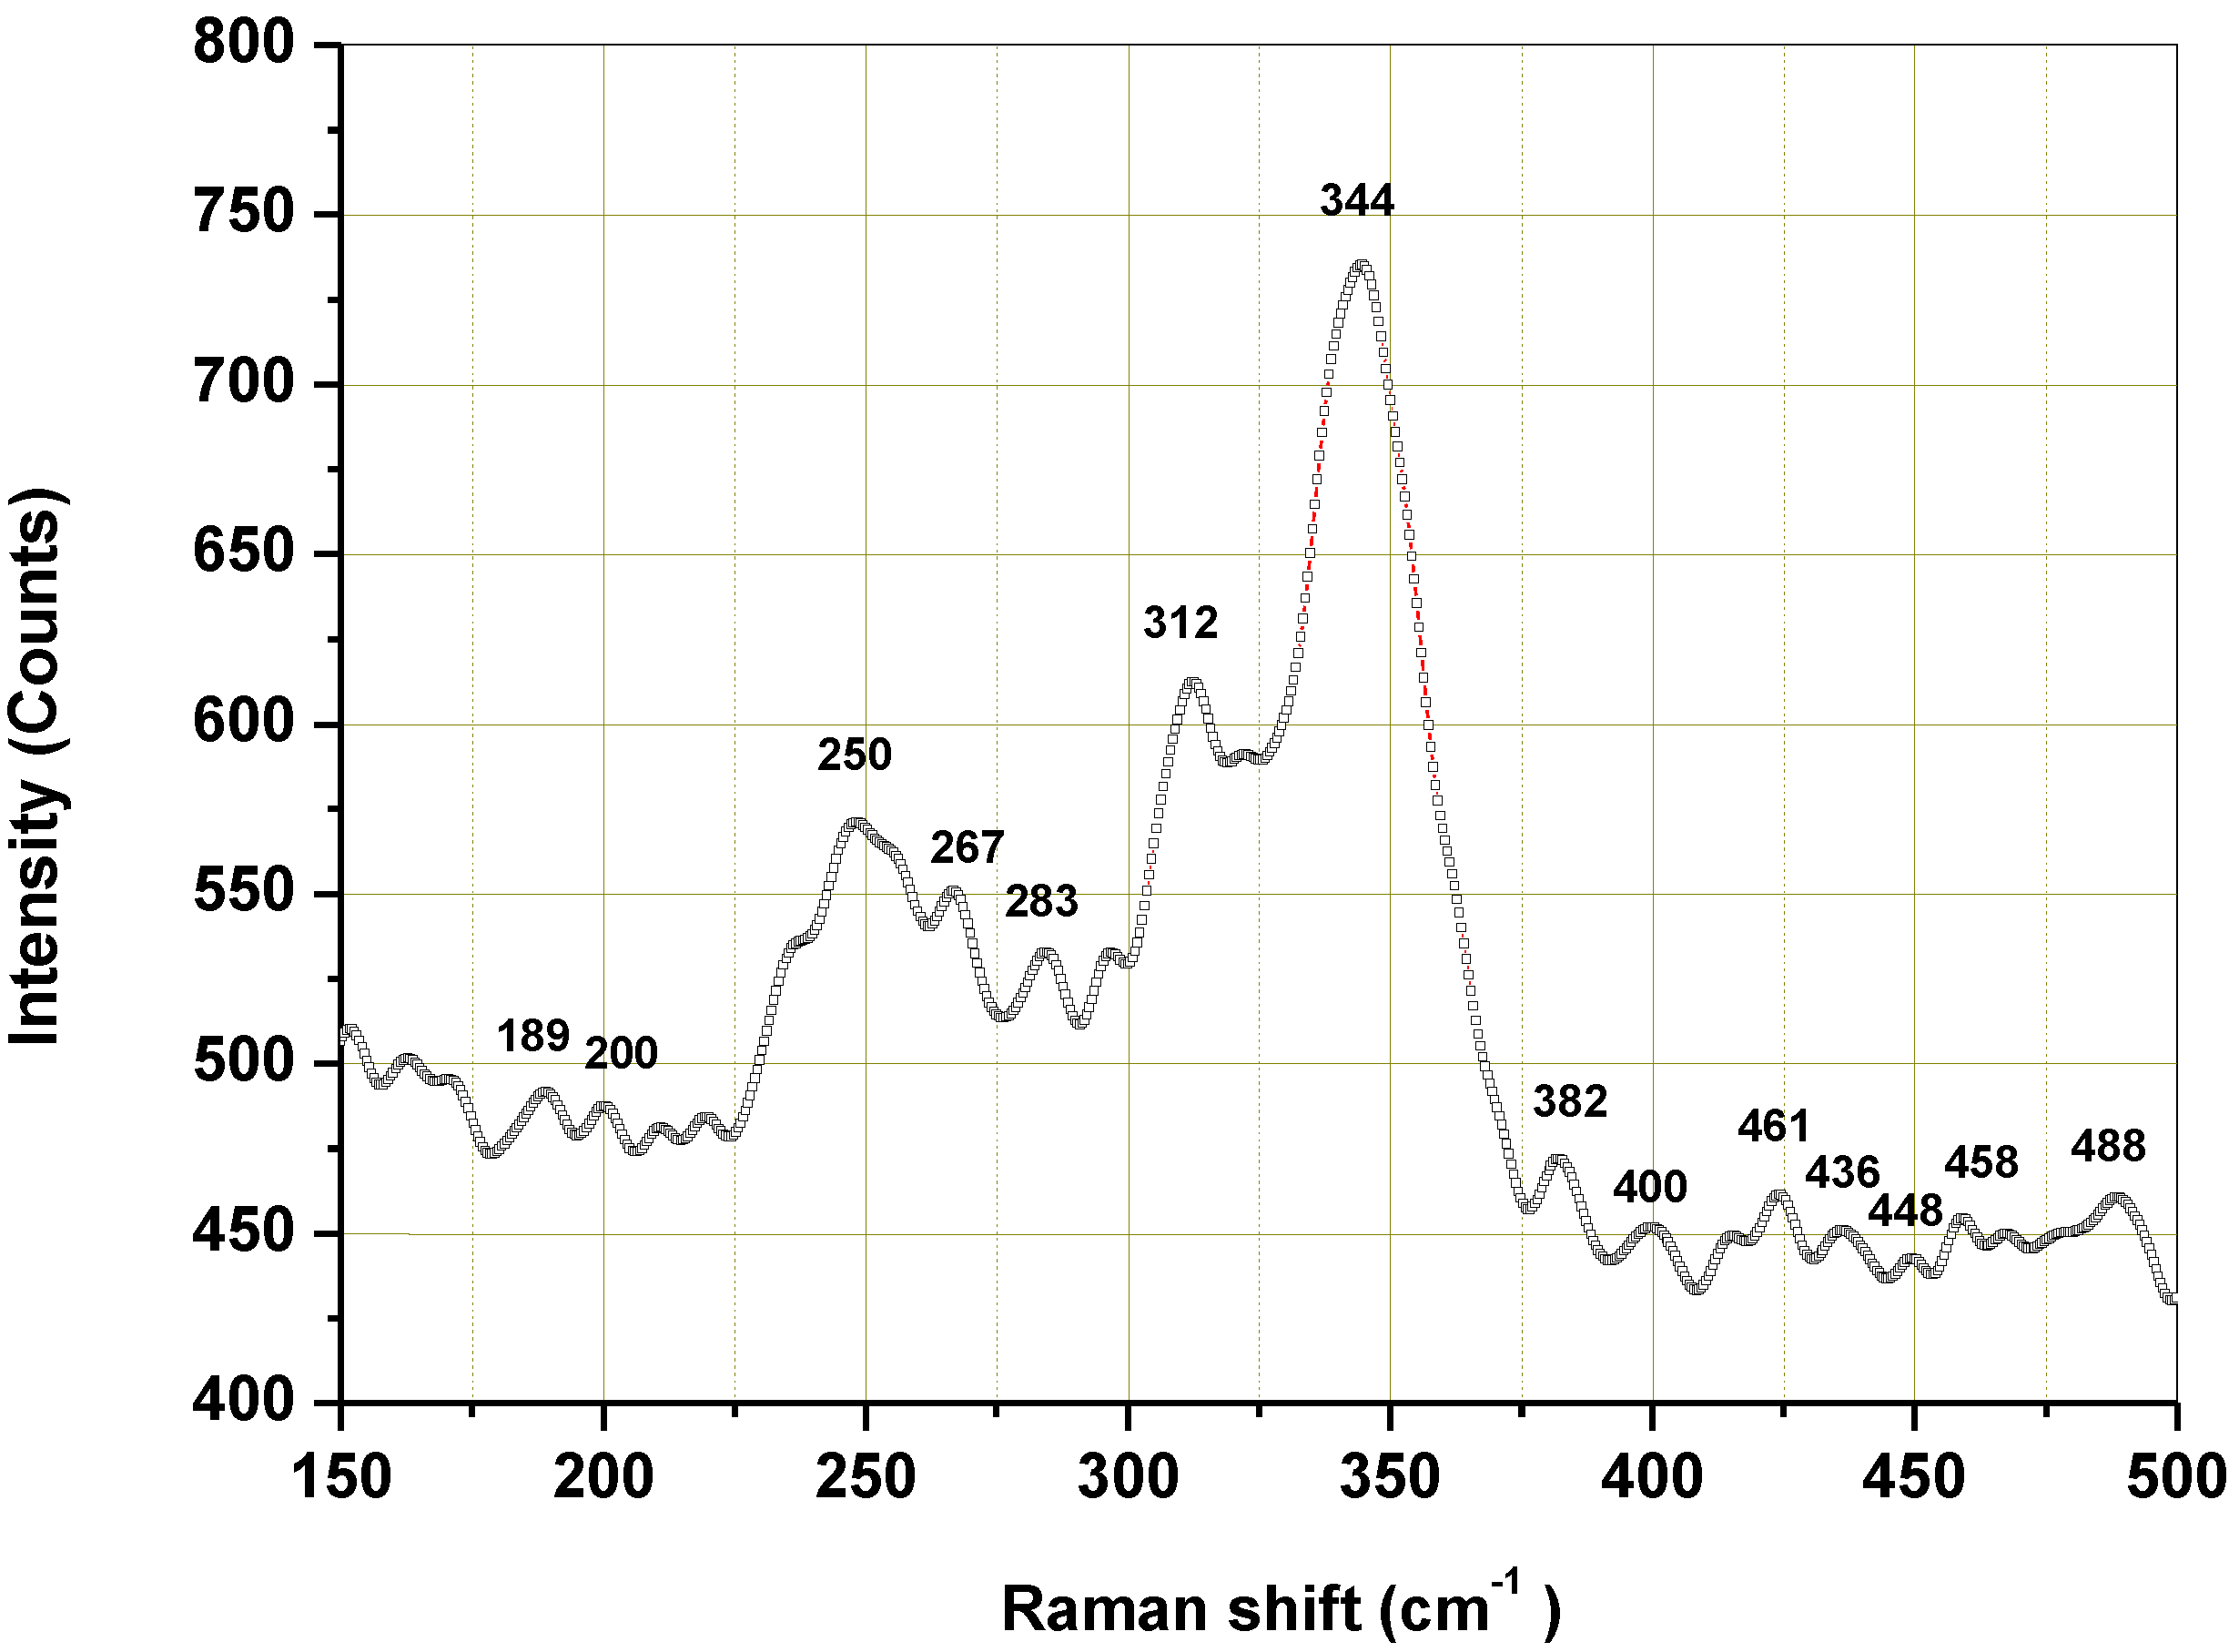
2.3. Morphological Characterization of Final Products Prepared in Both Mills
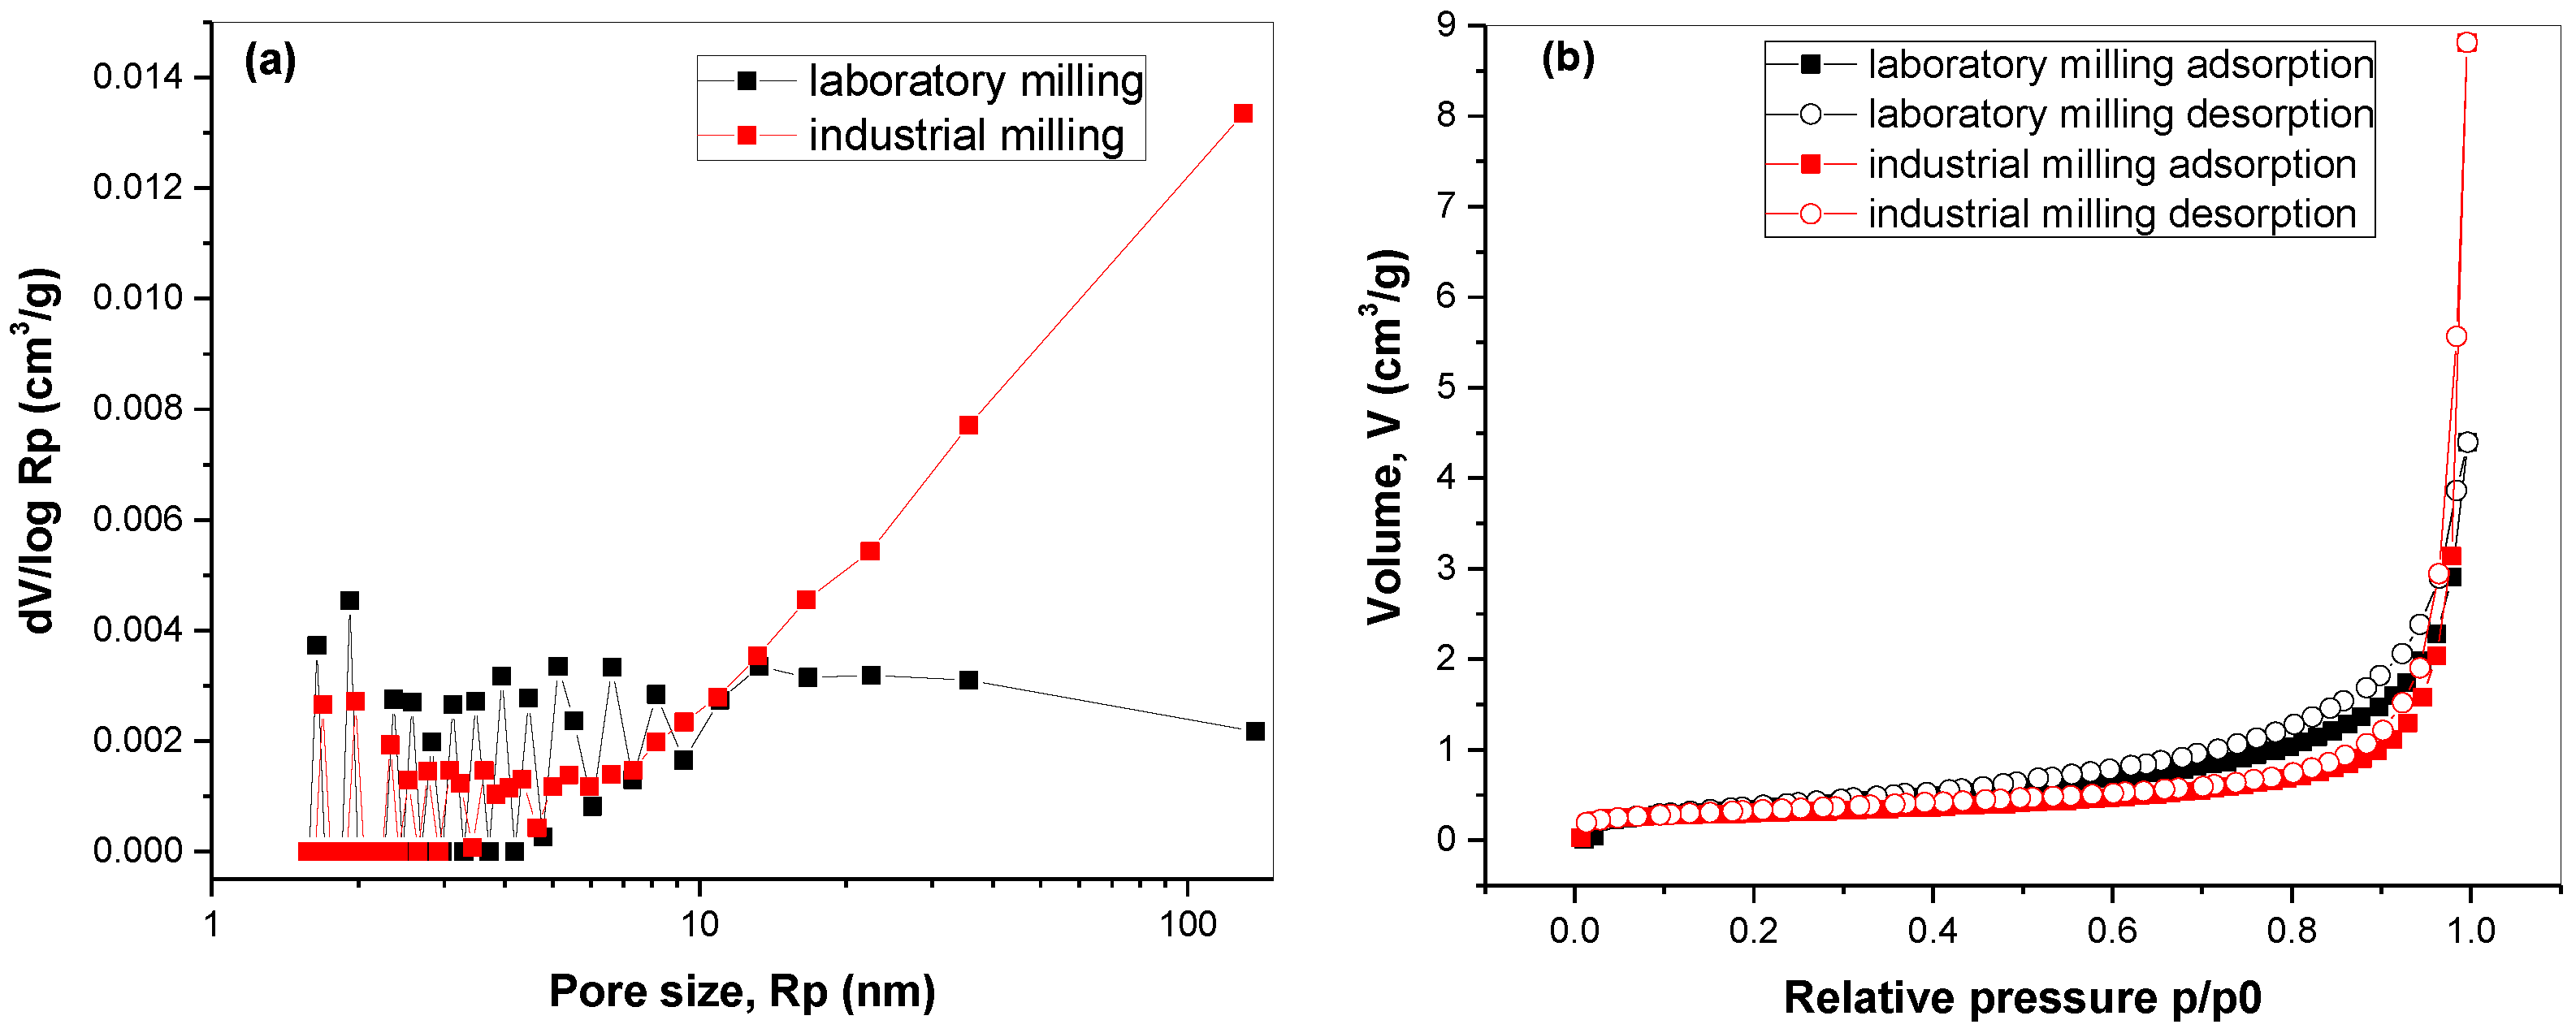
2.4. Surface Properties of Final Products Prepared in Both Mills
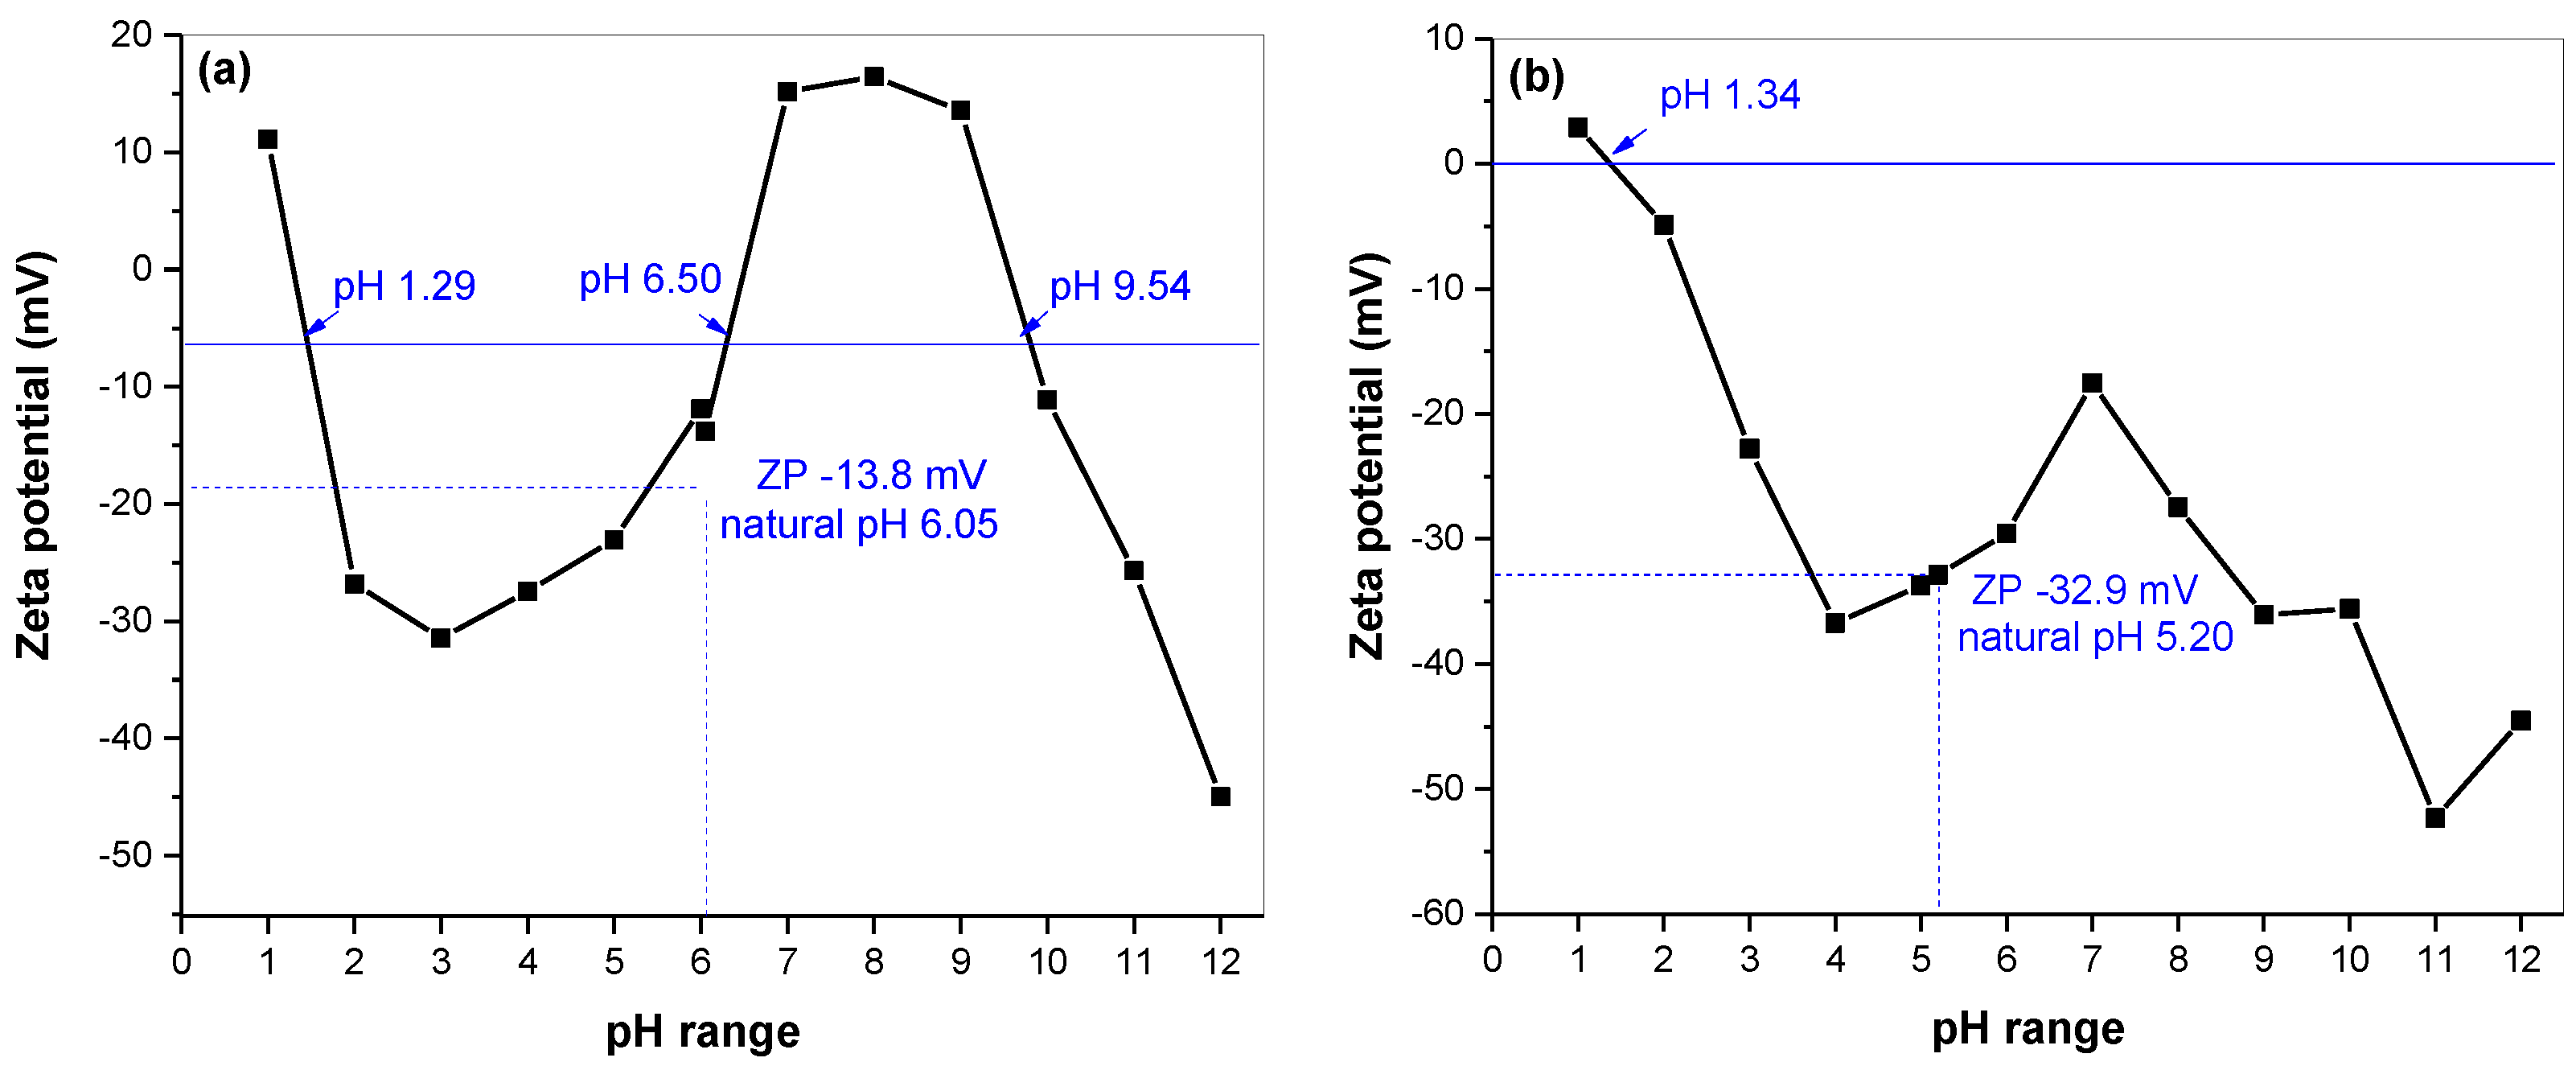
2.5. Zeta Potential of Final Products Prepared in Both Mills
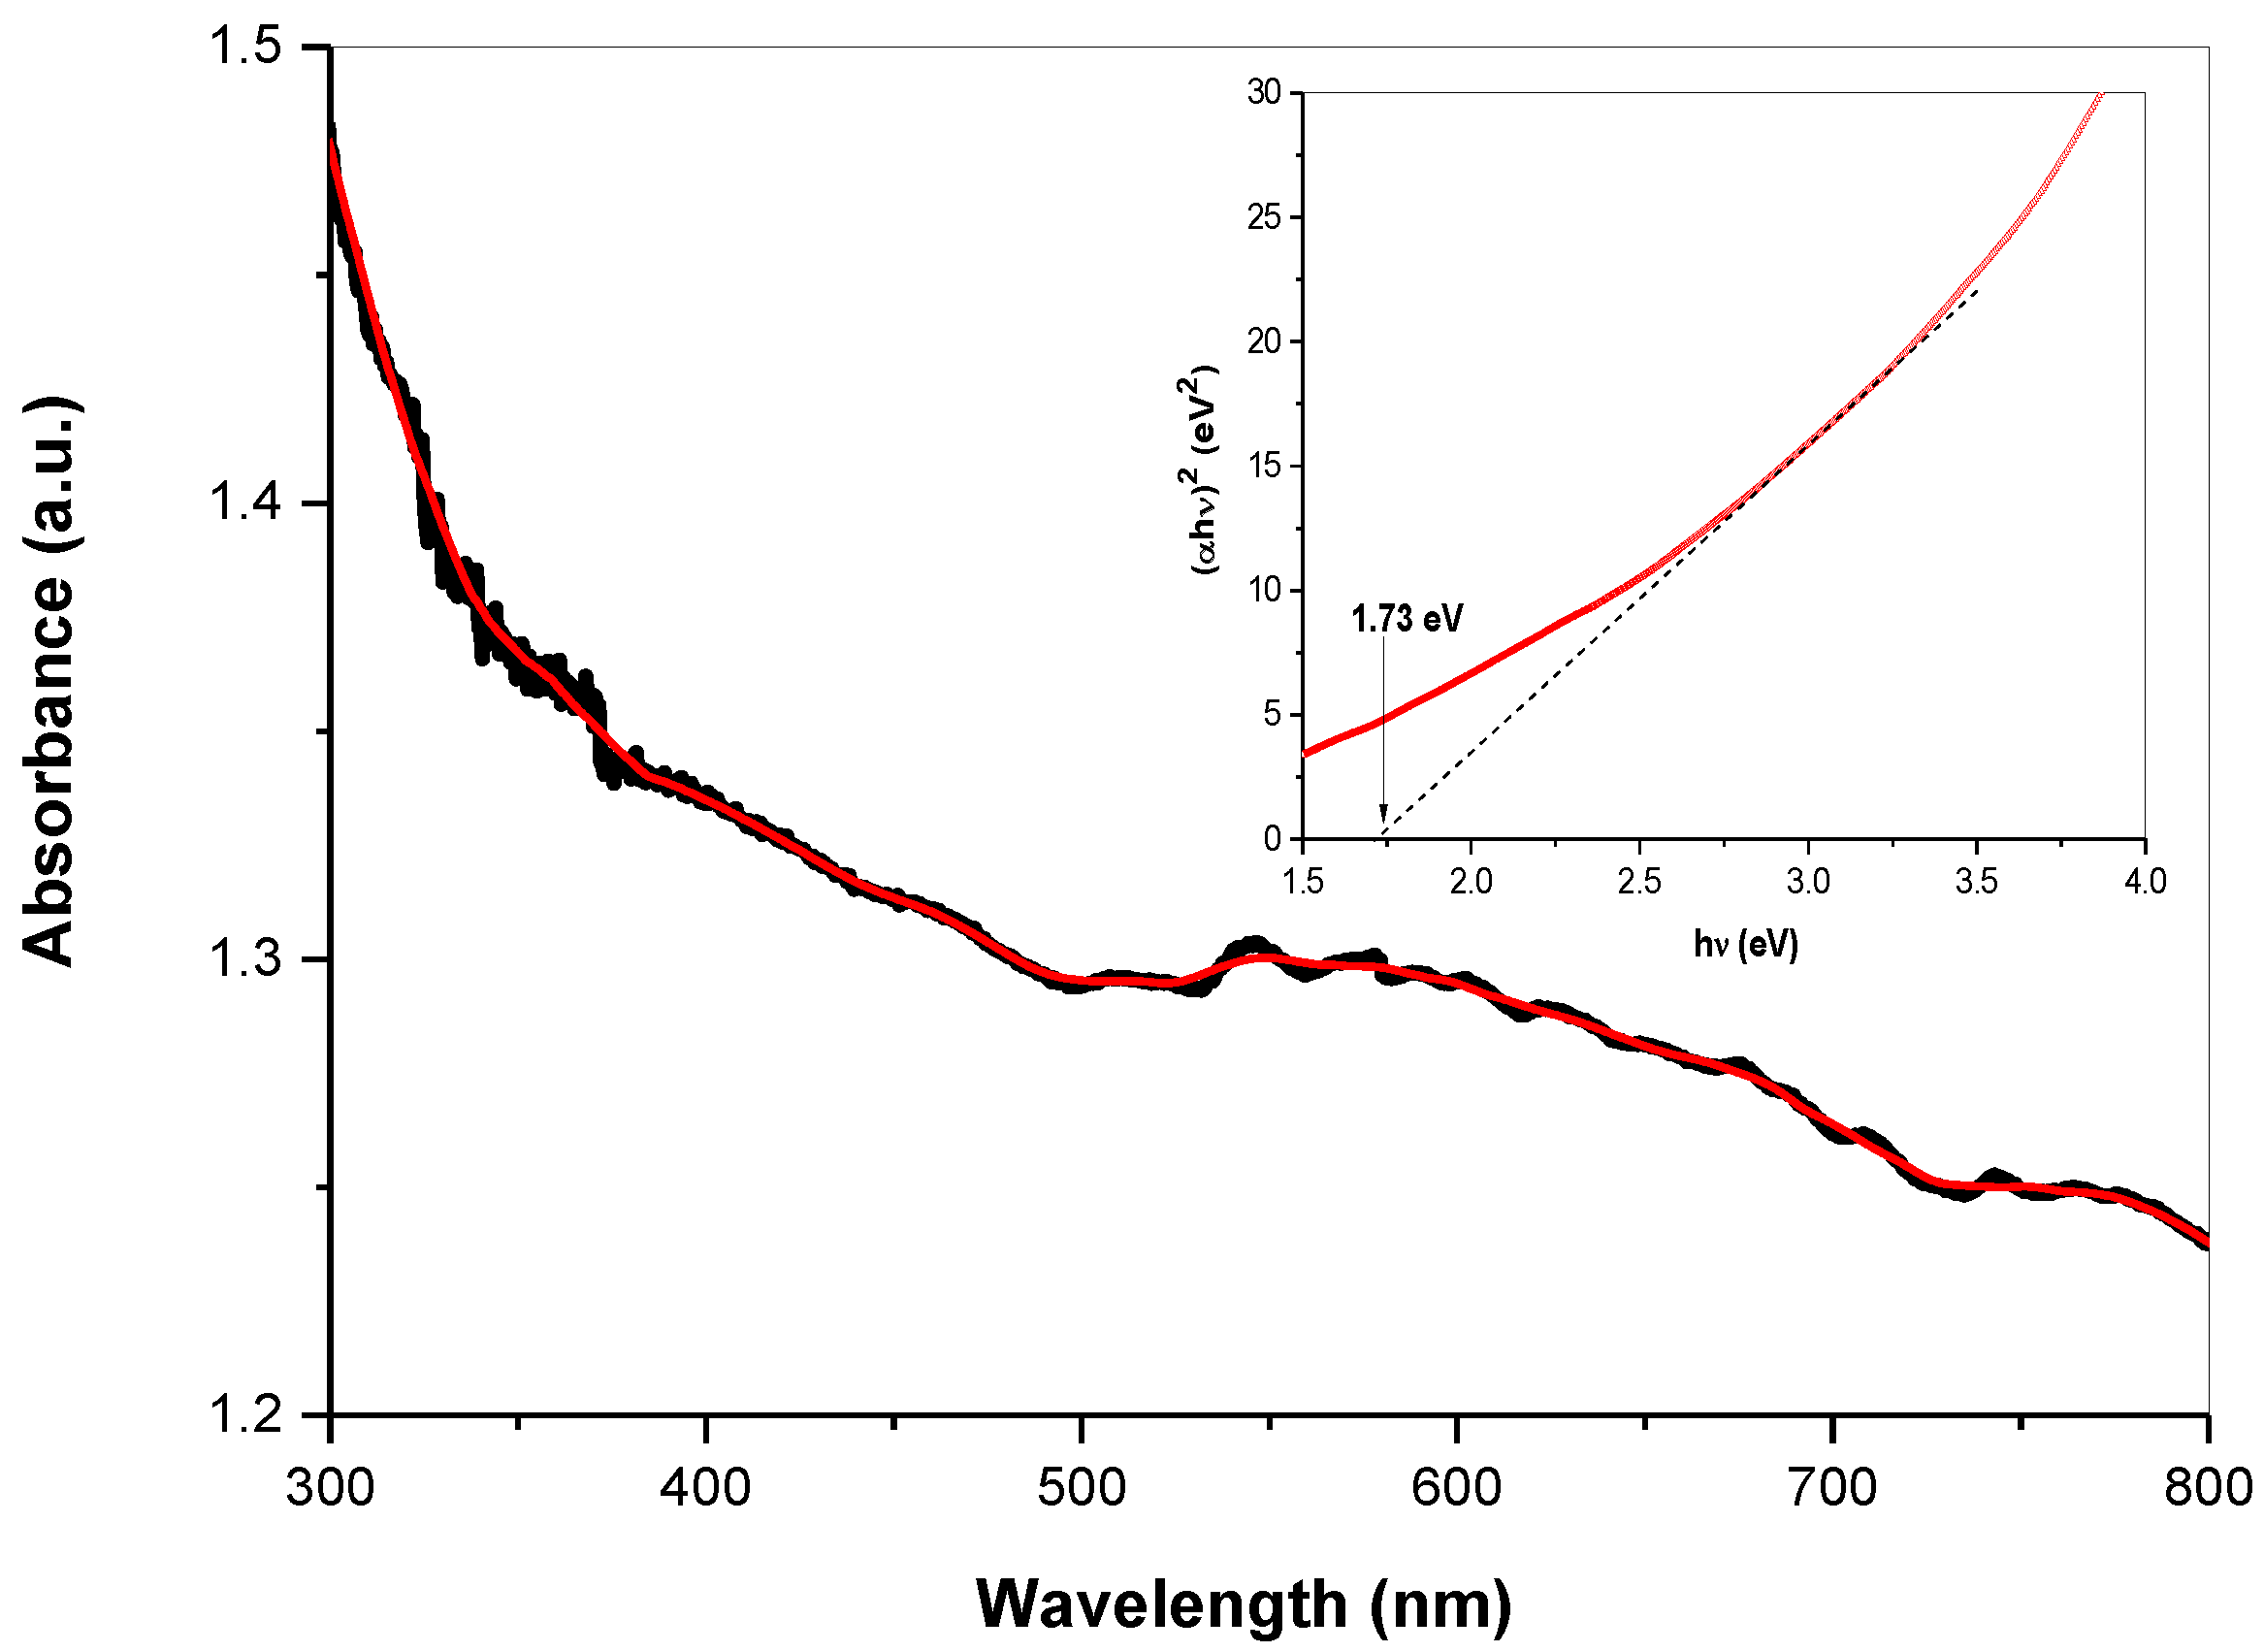
2.6. Optical Properties of Skinnerite Prepared in the Laboratory Mill
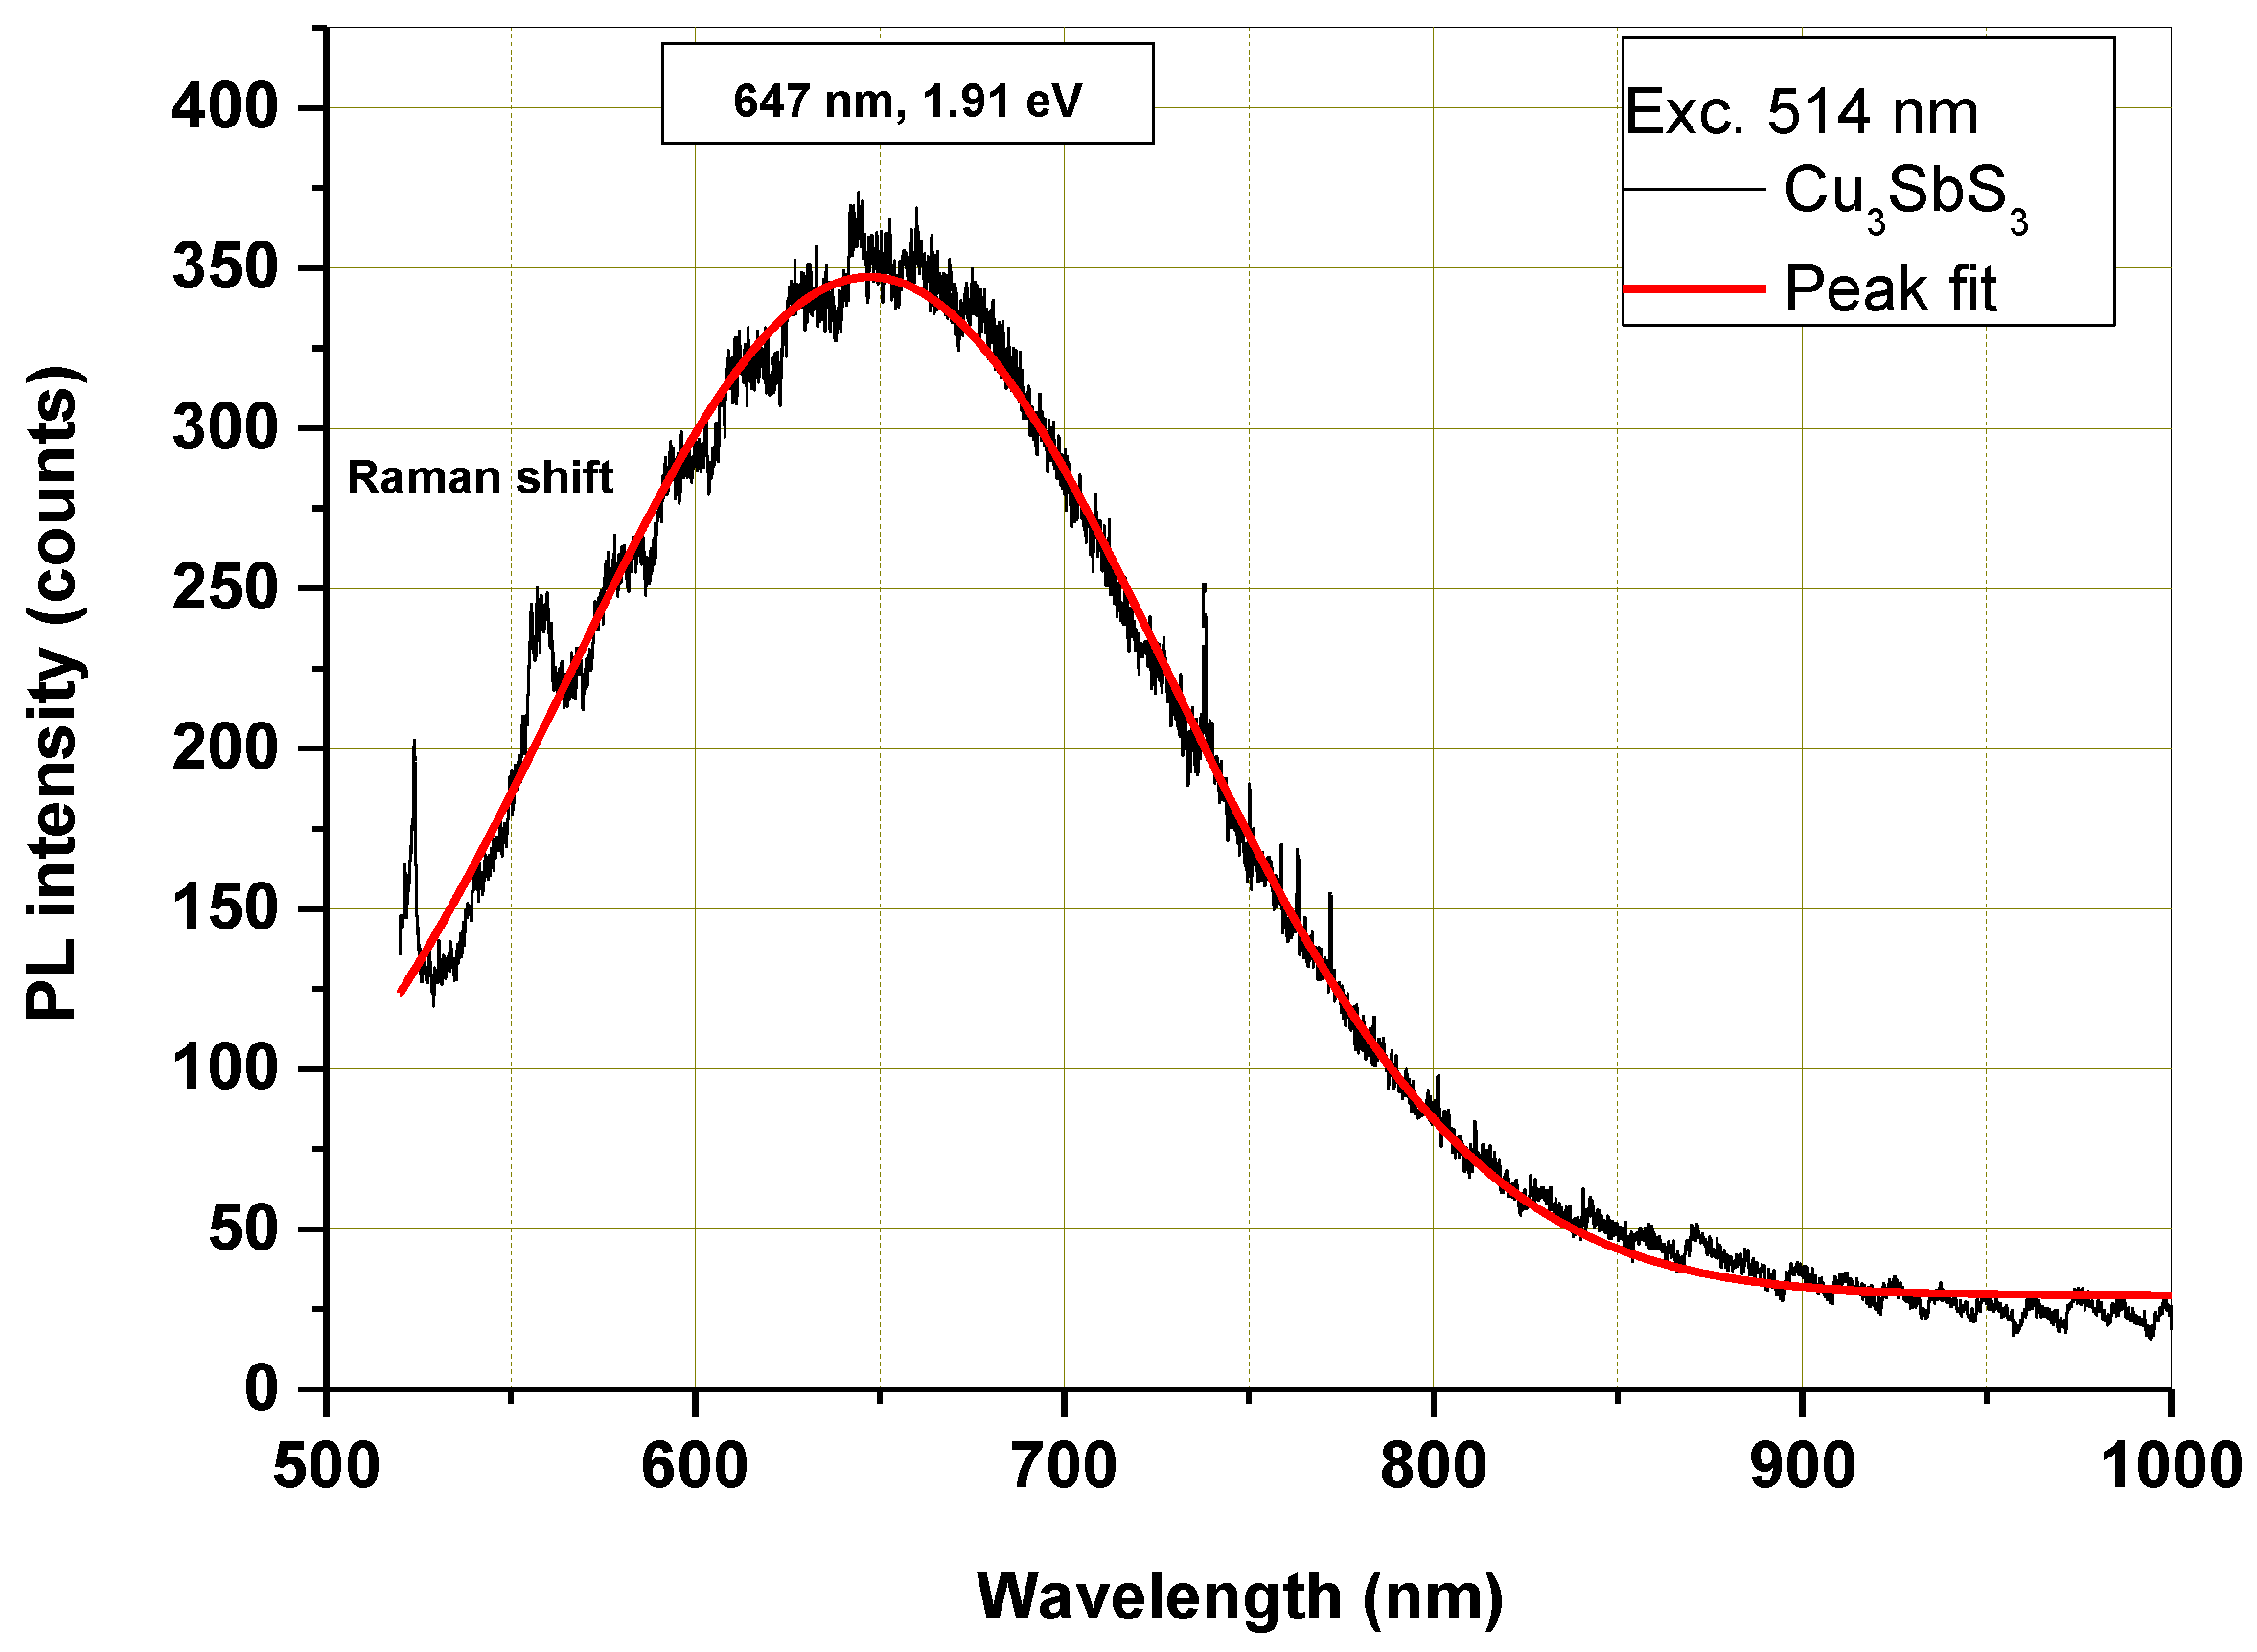
2.7. Optoelectrical Properties of Skinnerite Prepared in the Laboratory Mill
3. Materials and Methods
3.1. Mechanochemical Synthesis
3.2. Characterization Methods
4. Conclusions
Author Contributions
Funding
Institutional Review Board Statement
Informed Consent Statement
Data Availability Statement
Conflicts of Interest
Sample Availability
References
- van Embden, J.; Tachibana, Y. Synthesis and characterisation of famatinite copper antimony sulfide nanocrystals. J. Mater. Chem. 2012, 22, 11466–11469. [Google Scholar] [CrossRef]
- Kehoe, A.B.; Temple, D.J.; Watson, G.W.; Scanlon, D.O. Cu3MCh3 (M = Sb, Bi; Ch = S, Se) as candidate solar cell absorbers: Insights from theory. PCCP 2013, 15, 15477–15484. [Google Scholar] [CrossRef] [PubMed]
- Ramasamy, K.; Sims, H.; Butler, W.H.; Gupta, A. Selective Nanocrystal Synthesis and Calculated Electronic Structure of All Four Phases of Copper-Antimony-Sulfide. Chem. Mater. 2014, 26, 2891–2899. [Google Scholar] [CrossRef]
- Du, B.L.; Zhang, R.Z.; Liu, M.; Chen, K.; Zhang, H.F.; Reece, M.J. Crystal structure and improved thermoelectric performance of iron stabilized cubic Cu3SbS3 compound. J. Mater. Chem. C 2019, 7, 394–404. [Google Scholar] [CrossRef]
- Maiello, P.; Zoppi, G.; Miles, R.W.; Pearsall, N.; Forbes, I. Chalcogenisation of Cu-Sb metallic precursors into Cu3Sb(SexS1−x)3. Sol. Energy Mater. Sol. Cells 2013, 113, 186–194. [Google Scholar] [CrossRef]
- Bouaniza, N.; Hosni, N.; Maghraoui-Meherzi, H. Structural and optical properties of Cu3SbS3 thin film deposited by chemical bath deposition along with the degradation of methylene blue. Surf. Coat. Technol. 2018, 333, 195–200. [Google Scholar] [CrossRef]
- Qiu, X.D.; Ji, S.L.; Chen, C.; Liu, G.Q.; Ye, C.H. Synthesis, characterization, and surface-enhanced Raman scattering of near infrared absorbing Cu3SbS3 nanocrystals. CrystEngComm 2013, 15, 10431–10434. [Google Scholar] [CrossRef]
- Ikeda, S.; Sogawa, S.; Tokai, Y.; Septina, W.; Harada, T.; Matsumura, M. Selective production of CuSbS2, Cu3SbS3, and Cu3SbS4 nanoparticles using a hot injection protocol. RSC Adv. 2014, 4, 40969–40972. [Google Scholar] [CrossRef]
- Hussain, A.; Ahmed, R.; Ali, N.; Shaari, A.; Luo, J.T.; Fu, Y.Q. Characterization of Cu3SbS3 thin films grown by thermally diffusing Cu2S and Sb2S3 layers. Surf. Coat. Technol. 2017, 319, 294–300. [Google Scholar] [CrossRef]
- Zaki, S.A.; Abd-Elrahman, M.I.; Abu-Sehly, A.A.; Shaalan, N.M.; Hafiz, M.M. Solar cell fabrication from semiconducting Cu3SbS3 on n-Si: Parameters evolution. Mater. Sci. Semicond. Process. 2020, 115, 105123. [Google Scholar] [CrossRef]
- Nefzi, K.; Rabhi, A.; Kanzari, M. Investigation of physical properties and impedance spectroscopy study of Cu3SbS3 thin films. J. Mater. Sci.—Mater. Electron. 2016, 27, 1888–1896. [Google Scholar] [CrossRef]
- Daniel, T.; Mohanraj, K.; Sivakumar, G. Effect of annealing temperature on thermally evaporated Cu3SbS3 thin films. J. Mater. Sci.—Mater. Electron. 2018, 29, 9251–9257. [Google Scholar] [CrossRef]
- Wang, M.X.; Yue, G.H.; Fan, X.Y.; Yan, P.X. Properties and characterization of Cu3SbS3 nanowires synthesized by solvothermal route. J. Cryst. Growth 2008, 310, 3062–3066. [Google Scholar] [CrossRef]
- Zhong, J.S.; Xiang, W.D.; Jin, H.D.; Cai, W.; Liu, L.J.; Yang, X.Y.; Liang, X.J.; Liu, H.T. A simple L-cystine-assisted solvothermal approach to Cu3SbS3 nanorods. Mater. Lett. 2010, 64, 1499–1502. [Google Scholar]
- Hao, Z.M.; Zeng, D.M.; Chen, L.M.; Huang, F.J. Synthesis and characterization of Cu3SbS3 nanocrystallites: Effect of reaction time. Mater. Lett. 2014, 122, 338–340. [Google Scholar] [CrossRef]
- Atri, S.; Gusain, M.; Kumar, P.; Uma, S.; Nagarajan, R. Role of the solvent medium in the wet-chemical synthesis of CuSbS2, Cu3SbS3, and bismuth substituted Cu3SbS3. J. Chem. Sci. 2020, 132, 132. [Google Scholar] [CrossRef]
- Jones, W.; Eddleston, M.D. Introductory Lecture: Mechanochemistry, a versatile synthesis strategy for new materials. Faraday Discuss. 2014, 170, 9–34. [Google Scholar] [CrossRef]
- James, S.L.; Adams, C.J.; Bolm, C.; Braga, D.; Collier, P.; Friscic, T.; Grepioni, F.; Harris, K.D.M.; Hyett, G.; Jones, W.; et al. Mechanochemistry: Opportunities for new and cleaner synthesis. Chem. Soc. Rev. 2012, 41, 413–447. [Google Scholar] [CrossRef]
- Sepelak, V.; Duvel, A.; Wilkening, M.; Becker, K.D.; Heitjans, P. Mechanochemical reactions and syntheses of oxides. Chem. Soc. Rev. 2013, 42, 7507–7520. [Google Scholar] [CrossRef]
- Baláž, P.; Achimovičová, M.; Baláž, M.; Billik, P.; Cherkezova-Zheleva, Z.; Criado, J.M.; Delogu, F.; Dutková, E.; Gaffet, E.; Gotor, F.J.; et al. Hallmarks of mechanochemistry: From nanoparticles to technology. Chem. Soc. Rev. 2013, 42, 7571–7637. [Google Scholar] [CrossRef]
- Balaz, P.; Hegedus, M.; Achimovicova, M.; Balaz, M.; Tesinsky, M.; Dutkova, E.; Kanuchova, M.; Briancin, J. Semi-industrial Green Mechanochemical Syntheses of Solar Cell Absorbers Based on Quaternary Sulfides. ACS Sustain. Chem. Eng. 2018, 6, 2132–2141. [Google Scholar] [CrossRef]
- Hegedus, M.; Balaz, M.; Tesinsky, M.; Sayagues, M.J.; Siffalovic, P.; Krulakova, M.; Kanuchova, M.; Briancin, J.; Fabian, M.; Balaz, P. Scalable synthesis of potential solar cell absorber Cu2SnS3 (CTS) from nanoprecursors. J. Alloys Compd. 2018, 768, 1006–1015. [Google Scholar] [CrossRef]
- Balaz, P.; Hegedus, M.; Balaz, M.; Daneu, N.; Siffalovic, P.; Bujnakova, Z.; Tothova, I.E.; Tesinsky, M.; Achimovicova, M.; Briancin, J.; et al. Photovoltaic materials: Cu2ZnSnS4 (CZTS) nanocrystals synthesized via industrially scalable, green, one-step mechanochemical process. Prog. Photovolt. 2019, 27, 798–811. [Google Scholar] [CrossRef]
- Achimovicova, M.; Dutkova, E.; Tothova, E.; Bujnakova, Z.; Briancin, J.; Kitazono, S. Structural and optical properties of nanostructured copper sulfide semiconductor synthesized in an industrial mill. Front. Chem. Sci. Eng. 2019, 13, 164–170. [Google Scholar] [CrossRef]
- Balaz, P.; Hegedus, M.; Reece, M.; Zhang, R.Z.; Su, T.C.; Skorvanek, I.; Briancin, J.; Balaz, M.; Mihalik, M.; Tesinsky, M.; et al. Mechanochemistry for Thermoelectrics: Nanobulk Cu6Fe2SnS8/Cu2FeSnS4 Composite Synthesized in an Industrial Mill. J. Electron. Mater. 2019, 48, 1846–1856. [Google Scholar] [CrossRef]
- Zhang, J.J.; Wang, L.J.; Liu, M.; Wang, J.; Sun, K.; Yang, Y.; Hu, B.F.; Xu, J.; Su, T.C.; Du, B.L. Preparation and thermoelectric performance of tetrahedrite-like cubic Cu3SbS3 compound. J. Mater. Sci.—Mater. Electron. 2021, 32, 10789–10802. [Google Scholar] [CrossRef]
- Baláž, M.; Daneu, N.; Rajňák, M.; Kurimský, J.; Hegedűs, M.; Dutková, E.; Fabián, M.; Kaňuchová, M.; Baláž, P. Rapid mechanochemical synthesis of nanostructured mohite Cu2SnS3 (CTS). J. Mater. Sci. 2018, 53, 13631–13642. [Google Scholar] [CrossRef]
- Dutková, E.; Daneu, N.; Lukáčová Bujňáková, Z.; Baláž, M.; Kováč, J.; Kováč, J., Jr.; Baláž, P. Mechanochemical Synthesis and Characterization of CuInS2/ZnS Nanocrystals. Molecules 2019, 24, 1031. [Google Scholar] [CrossRef]
- Baláž, P.; Zorkovská, A.; Baláž, M.; Kováč, J.; Tešinský, M.; Osserov, T.; Guseynova, G.; Ketegenov, T. Mechanochemical reduction of chalcopyrite CuFeS2: Changes in composition and magnetic properties. Acta Phys. Pol. A 2017, 131, 1165–1167. [Google Scholar] [CrossRef]
- Regulacio, M.D.; Tee, S.Y.; Lim, S.H.; Teng, C.P.; Koh, L.D.; Liu, S.H.; Han, M.Y. Facile solvothermal approach to pristine tetrahedrite nanostructures with unique multiply-voided morphology. Nanoscale 2017, 9, 17865–17876. [Google Scholar] [CrossRef]
- Groen, J.C.; Peffer, L.A.A.; Perez-Ramirez, J. Pore size determination in modified micro- and mesoporous materials. Pitfalls and limitations in gas adsorption data analysis. Microporous Mesoporous Mater. 2003, 60, 1–17. [Google Scholar] [CrossRef]
- Fornasiero, D.; Eijt, V.; Ralston, J. An Electrokinetic Study of Pyrite Oxidation. Colloids Surf. 1992, 62, 63–73. [Google Scholar] [CrossRef]
- Fornasiero, D.; Li, F.; Ralston, J. Oxidation of galena: II. Electrokinetic study. J. Colloid Interface Sci. 1994, 164, 345–354. [Google Scholar] [CrossRef]
- Healy, T.; Moignard, M. Review of Electrokinetic Studies of Metal Sulphides. In Flotation—A. M. Gaudin Memorial; American Institute of Mining, Metallurgical, and Petroleum Engineers: New York, NY, USA, 1976. [Google Scholar]
- Liu, J.C.; Huang, C.P. Electrokinetic characteristics of some metal sulfide water interfaces. Langmuir 1992, 8, 1851–1856. [Google Scholar] [CrossRef]
- Mokone, T.; Van Hille, R.; Lewis, A. Effect of solution chemistry on particle characteristics during metal sulfide precipitation. J. Colloid Interface Sci. 2010, 351, 10–18. [Google Scholar] [CrossRef]
- Moignard, M.; James, R.; Healy, T. Adsorption of calcium at the zinc sulphide-water interface. Aust. J. Chem. 1977, 30, 733–740. [Google Scholar] [CrossRef]
- Acar, S.; Somasundaran, P. Effect of dissolved mineral species on the electrokinetic behaviour of sulfides. Miner. Eng. 1992, 5, 27–40. [Google Scholar] [CrossRef]
- Derjaguin, B.; Dukhin, S.; Matijevic, E. Nonequilibrium double layer and electrokinetic phenomena. Surf. Colloid Sci. 1974, 7, 273–335. [Google Scholar]
- Konkena, B.; Vasudevan, S. Understanding aqueous dispersibility of graphene oxide and reduced graphene oxide through pKa measurements. J. Phys. Chem. Lett. 2012, 3, 867–872. [Google Scholar] [CrossRef]
- Cho, A.; Banu, S.; Kim, K.; Park, J.H.; Yun, J.H.; Cho, J.S.; Yoo, J. Selective thin film synthesis of copper-antimony-sulfide using hybrid ink. Sol. Energy 2017, 145, 42–51. [Google Scholar] [CrossRef]
- Vinayakumar, V.; Shaji, S.; Avellaneda, D.; Das Roy, T.K.; Castillo, G.A.; Martinez, J.A.A.; Krishnan, B. CuSbS2 thin films by rapid thermal processing of Sb2S3-Cu stack layers for photovoltaic application. Sol. Energy Mater. Sol. Cells 2017, 164, 19–27. [Google Scholar] [CrossRef]
- Chalapathi, U.; Poornaprakash, B.; Park, S.H. Growth and properties of Cu3SbS4 thin films prepared by a two-stage process for solar cell applications. Ceram. Int. 2017, 43, 5229–5235. [Google Scholar] [CrossRef]
- Han, G.; Lee, J.W.; Kim, J. Fabrication and Characterization of Cu3SbS4 Solar Cell with Cd-free Buffer. J. Korean Phys. Soc. 2018, 73, 1794–1798. [Google Scholar] [CrossRef]
- Rahman, A.A.; Hossian, E.; Vaishnav, H.; Parmar, J.B.; Bhattacharya, A.; Sarma, A. Synthesis and characterization of Cu3SbS4 thin films grown by co-sputtering metal precursors and subsequent sulfurization. Mater. Adv. 2020, 1, 3333–3338. [Google Scholar] [CrossRef]


Disclaimer/Publisher’s Note: The statements, opinions and data contained in all publications are solely those of the individual author(s) and contributor(s) and not of MDPI and/or the editor(s). MDPI and/or the editor(s) disclaim responsibility for any injury to people or property resulting from any ideas, methods, instructions or products referred to in the content. |
© 2022 by the authors. Licensee MDPI, Basel, Switzerland. This article is an open access article distributed under the terms and conditions of the Creative Commons Attribution (CC BY) license (https://creativecommons.org/licenses/by/4.0/).
Share and Cite
Dutková, E.; Sayagués, M.J.; Fabián, M.; Baláž, M.; Kováč, J.; Kováč Junior, J.; Stahorský, M.; Achimovičová, M.; Lukáčová Bujňáková, Z. Nanocrystalline Skinnerite (Cu3SbS3) Prepared by High-Energy Milling in a Laboratory and an Industrial Mill and Its Optical and Optoelectrical Properties. Molecules 2023, 28, 326. https://doi.org/10.3390/molecules28010326
Dutková E, Sayagués MJ, Fabián M, Baláž M, Kováč J, Kováč Junior J, Stahorský M, Achimovičová M, Lukáčová Bujňáková Z. Nanocrystalline Skinnerite (Cu3SbS3) Prepared by High-Energy Milling in a Laboratory and an Industrial Mill and Its Optical and Optoelectrical Properties. Molecules. 2023; 28(1):326. https://doi.org/10.3390/molecules28010326
Chicago/Turabian StyleDutková, Erika, María Jesús Sayagués, Martin Fabián, Matej Baláž, Jaroslav Kováč, Jaroslav Kováč Junior, Martin Stahorský, Marcela Achimovičová, and Zdenka Lukáčová Bujňáková. 2023. "Nanocrystalline Skinnerite (Cu3SbS3) Prepared by High-Energy Milling in a Laboratory and an Industrial Mill and Its Optical and Optoelectrical Properties" Molecules 28, no. 1: 326. https://doi.org/10.3390/molecules28010326
APA StyleDutková, E., Sayagués, M. J., Fabián, M., Baláž, M., Kováč, J., Kováč Junior, J., Stahorský, M., Achimovičová, M., & Lukáčová Bujňáková, Z. (2023). Nanocrystalline Skinnerite (Cu3SbS3) Prepared by High-Energy Milling in a Laboratory and an Industrial Mill and Its Optical and Optoelectrical Properties. Molecules, 28(1), 326. https://doi.org/10.3390/molecules28010326