Article

Three-Dimensional Pinecone-like Binder-Free Pt–TiO2 Nanorods on Ti Mesh Structures: Synthesis, Characterization and Electroactivity towards Ethanol Oxidation

by
Naser Mohammadi
,
Juan Carlos Abrego-Martinez
and
Mohamed Mohamedi
*
Énergie, Matériaux et Télécommunications (EMT), Institut National de la Recherche Scientifique (INRS), 1650 Boulevard Lionel Boulet, Varennes, QC J3X 1P7, Canada
*
Author to whom correspondence should be addressed.
Molecules 2022, 27(6), 1921; https://doi.org/10.3390/molecules27061921
Submission received: 13 January 2022 / Revised: 2 March 2022 / Accepted: 13 March 2022 / Published: 16 March 2022

Abstract

:
We report here the synthesis of binderless and template-less three-dimensional (3D) pinecone-shaped Pt/TiO2/Ti mesh structure. The TiO2 hydrothermally synthesized onto Ti mesh is composed of a mixture of flower-like nanorods and vertically aligned bar-shaped structures, whereas Pt film grown by pulsed laser deposition displays a smooth surface. XRD analyses reveal an average crystallite size of 41.4 nm and 68.5 nm of the TiO2 nanorods and Pt, respectively. In H2SO4 solution, the platinum oxide formation at the Pt/TiO2/Ti mesh electrode is 180 mV more negative than that at the Pt/Ti mesh electrode, indicating that TiO2 provides oxygeneous species at lower potentials, which will facilitate the removal of CO-like intermediates and accelerate an ethanol oxidation reaction (EOR). Indeed, the Pt/TiO2/Ti mesh catalyst exhibits current activity of 1.19 mA towards an EOR at a remarkably superior rate of 4.4 times that of the Pt/Ti mesh electrode (0.27 mA). Moreover, the presence of TiO2 as a support to Pt delivers a steady-state current of 2.1 mA, with an increment in durability of 6.6 times compared to Pt/Ti mesh (0.32 mA). Pt is chosen here as a benchmark catalyst and we believe that with catalysts that perform better than Pt, such 3D pinecone structures can be useful for a variety of catalytic or photoelectrochemical reactions.

Graphical Abstract

1. Introduction

There is a growing need for lightweight, higher efficiency, cheap, durable and safe energy storage and conversion devices to meet special needs for next-generation high-performance portable electronic devices. Current research is focusing on flexible and wearable electronic devices such as roll-up display, light-emitting diodes, smart watches, fitness-tracking and implantable sensors that can monitor blood pressure and other health metrics [1]. Such devices are being developed rapidly and essentially require low power source systems with flexible electrodes, separators and substrates to accomplish all-in-one flexible systems. Several types of lightweight power sources are being developed worldwide, including Li-ion batteries, supercapacitors, solar cells, fuel cells and biofuel cells [2,3,4,5,6].
Generally, traditional electrodes used in electrochemical power sources (EPSs) are composed of mixtures of active materials, polymeric binders and conductivity enhancers, like carbon black, graphite and carbon nanotubes, which are ink-coated over metal current collectors such as copper, aluminum or carbon paper. The additives, the metal collector elements are not only unsuitable for flexibility but add extra-weight to the EPS device. Hence, the ability to eliminate such additives and fabricate a binder and additive-free, flexible electrode would signify notable advancement for high-performance flexible EPSs. A flexible electrode could be either an electroactive material with inherent flexibility, or a composite catalyst layer built on a flexible substrate.
Metallic grids or meshes based on Ti as flexible current collectors are receiving a lot of attention due to their excellent flexibility, conductivity, and three-dimensional (3D) structures that can host active materials. A few examples of using Ti mesh in electrochemical technology include fabrication of high performance Pt/Ti counter electrodes on Ti mesh for flexible large-area dye-sensitized solar cells [7], TiO2 nanotubes on Ti mesh electrodes for improved photoelectrochemical reaction [8], TiO2 nanotube arrays formed on Ti meshes for flexible dye-sensitized solar cells [9], TiO2 nanotubes grown on Ti grid as an anode for Li-ion microbatteries [10], MnO2-modified TiN nanotube arrays on Ti mesh for flexible supercapacitor electrodes [11] and electrochemical glucose sensors using ternary NiCoP nanosheet arrays deposited on a Ti mesh [12].
In addition to the fact that TiO2 is not expensive to synthesize, non-toxic, possesses high mechanical and corrosion resistance, chemical stability in both alkaline, acidic, and oxidative environments; TiO2 has been investigated as a substitute catalyst support to carbon in fuel cells such as H2/O2 [13,14,15], direct methanol fuel cells (DMFC) [16,17,18,19] and microbial fuel cells [20,21].
In this work, we report for the first time the synthesis of original 3D pinecone-like Pt–TiO2 nanorods on Ti mesh electrodes. TiO2 arrays are grown via a hydrothermal technique on Ti mesh, whereas Pt film is grown by pulsed laser deposition (PLD) onto the TiO2/Ti mesh. For comparison, Pt is also synthesized by PLD on bare Ti mesh. The structural properties of these materials are studied with scanning electron microscopy (SEM), X-ray diffraction (XRD) and X-ray photoelectron spectroscopy (XPS). The electron transfer properties of the Pt/TiO2/Ti mesh are assessed for the ethanol oxidation reaction (EOR) with linear scan voltammetry (LSV). The EOR was chosen first, because of its importance for direct ethanol fuel cell (DEFC) technology and also, because we have been actively studying the EOR for years. Pt is selected here as a model catalyst because of its well-known behavior towards EOR. Finally, the durability of the synthesized Pt/TiO2/Ti mesh compared with Pt/Ti mesh is studied with long-term chronoamperometry (CA).

2. Results and Discussion

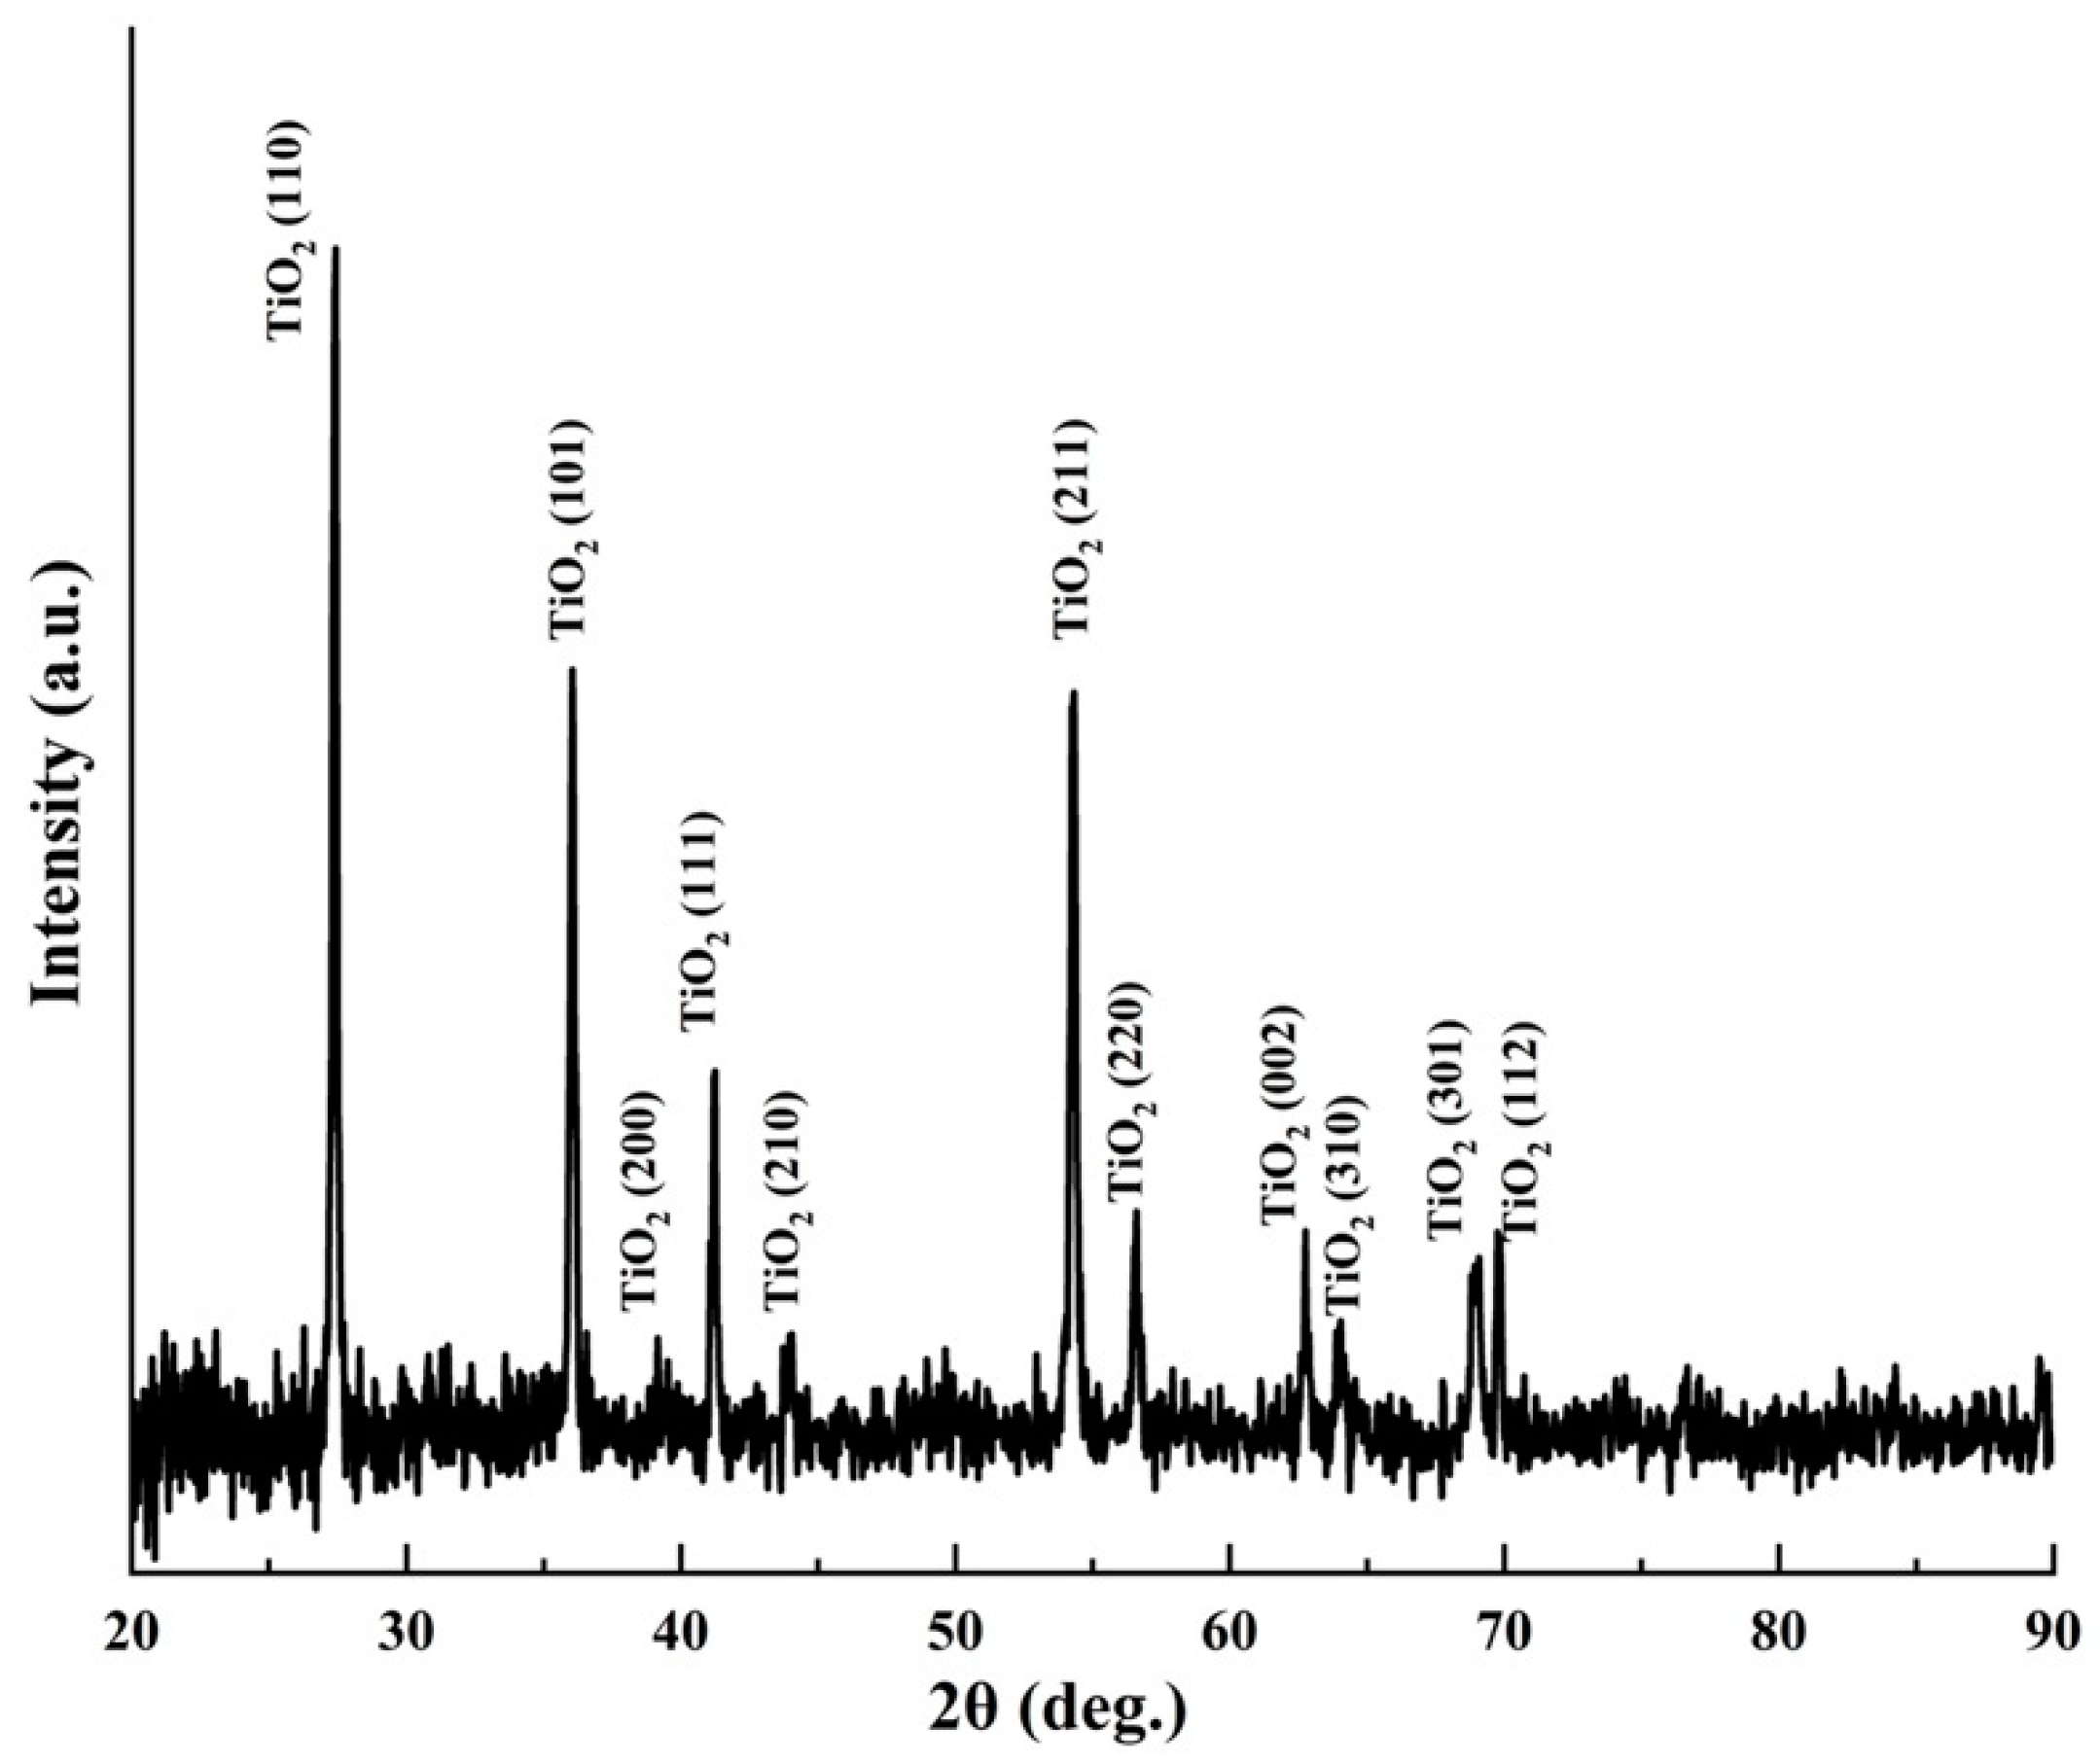
2.1. Materials Characterization

The photograph and SEM images of the pristine Ti mesh are shown in Figure S1 (Supplementary Materials) for comparison. Figure 1 reports SEM micrographs at increasing magnifications of the TiO2 grown by the hydrothermal technique on Ti mesh. As can be seen from SEM the images, the Ti mesh was evenly coated with TiO2. Higher magnifications show that the as-prepared TiO2 is composed of a mixture of flower-like nanorods and vertically aligned bar-shaped structures.
The XRD crystalline structure corresponding to the TiO2/Ti mesh is reported in Figure 2. The peaks relate to rutile TiO2 (JCPDS 21-1276). The highest peak TiO2 (110) was employed to calculate the average crystallite size (L). This was done using the Debye–Scherrer equation: L = 0.89 λ/β cos θ, with λ corresponding to the wavelength of 1.5406 Å, β to the full-width at half-maximum (FWHM) and θ is the Bragg angle. Accordingly, the average crystallite size of the TiO2 nanorods was estimated to be 414 Å.
Figure 3 shows the XPS spectra of the TiO2/Ti mesh structure. The survey spectrum (Figure 3a) contains the most prominent lines of Ti 2p, O 1s and C 1s at standard positions. Carbon contamination is practically impossible to avoid. Fortunately, it is usually restricted to the film-air interface. Figure 3b,c reveal, respectively, the high-resolution XPS Ti 2p and O 1s peaks at the surface of TiO2/Ti mesh. The positions of the Ti 2p1/2 and Ti 2p3/2 separated by 5.60 to 5.64 eV demonstrating by that Ti was in the Ti4+ state at the surface [22,23,24]. The O 1s peak is asymmetrical, which signifies that oxygen appears in two different chemical states at least. The O 1s spectrum (Figure 3c) could be deconvoluted into two contributions that are OI and OII. The first contribution (OI) occurring within binding energies of 529.9~530 eV is ascribed the normal lattice sites occupied by oxygen in the TiO2 structure. The second contribution (OII) appearing at 531~532 eV is ascribed to non-lattice oxygen [25]. This high binding energy component has been assigned to oxygen bonded to Ti+3 (O–Ti3+) or to hydroxyl species that are simply created at the surface of oxide films [26]. By considering the relative areas related to the main O 1s component (linked principally to Ti4+–O bonds) and the relative area of the main Ti 2p contribution, we obtain an [O]/[Ti] ratio of 3.8. Meng et al. have studied the porosities of titanium oxide films prepared by d.c. reactive magnetron sputtering at different oxygen partial and total pressures [27]. They have ascribed the presence of the non-lattice O component to porosity, as a result of the moisture that accrues mainly in the pores or void between the TiO2 columns of the material, which might be responsible for the deviation from stoichiometry. The same authors have employed the ratio of OII/(OI + OII) as a measure of the porosity. In our case, we found the OII/(OI + OII) ratio equal to 0.44, which is slightly higher than 0.38 obtained by Meng et al. for porous TiO2 film that had a higher O-H bonding component. Therefore, it may be assumed that our synthesized TiO2 arrays display porosity higher than the stoichiometric films.

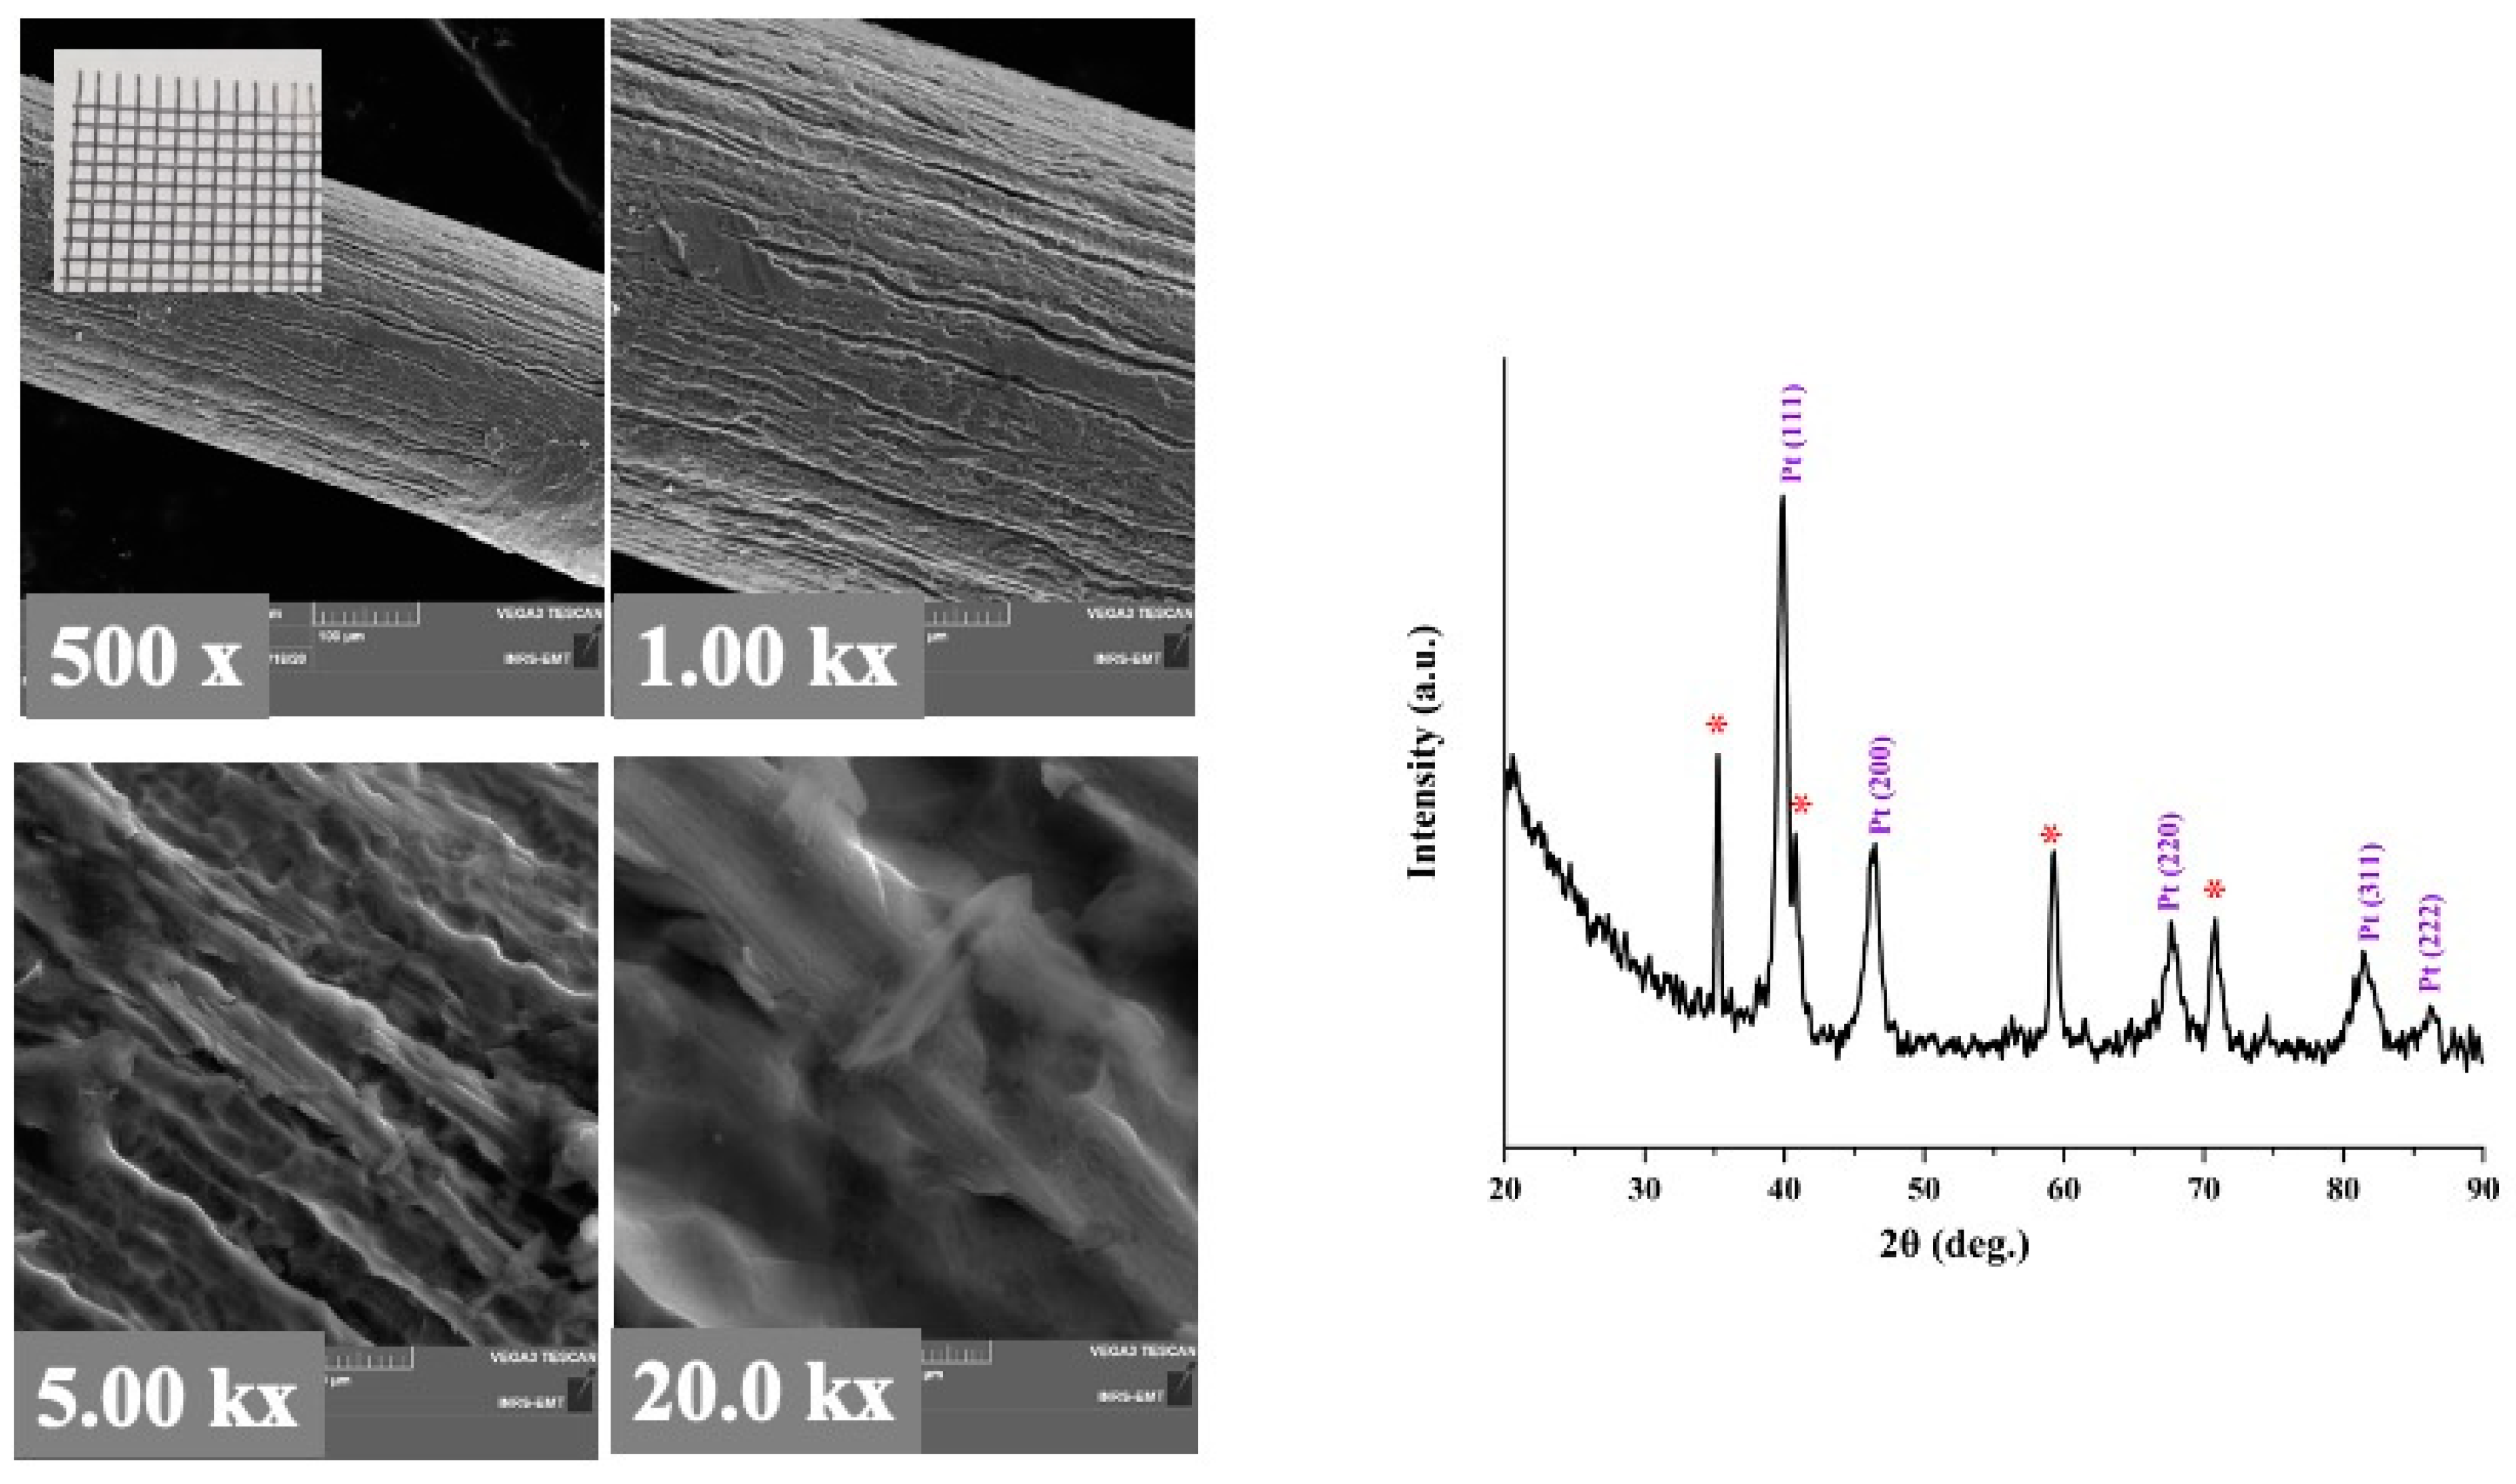
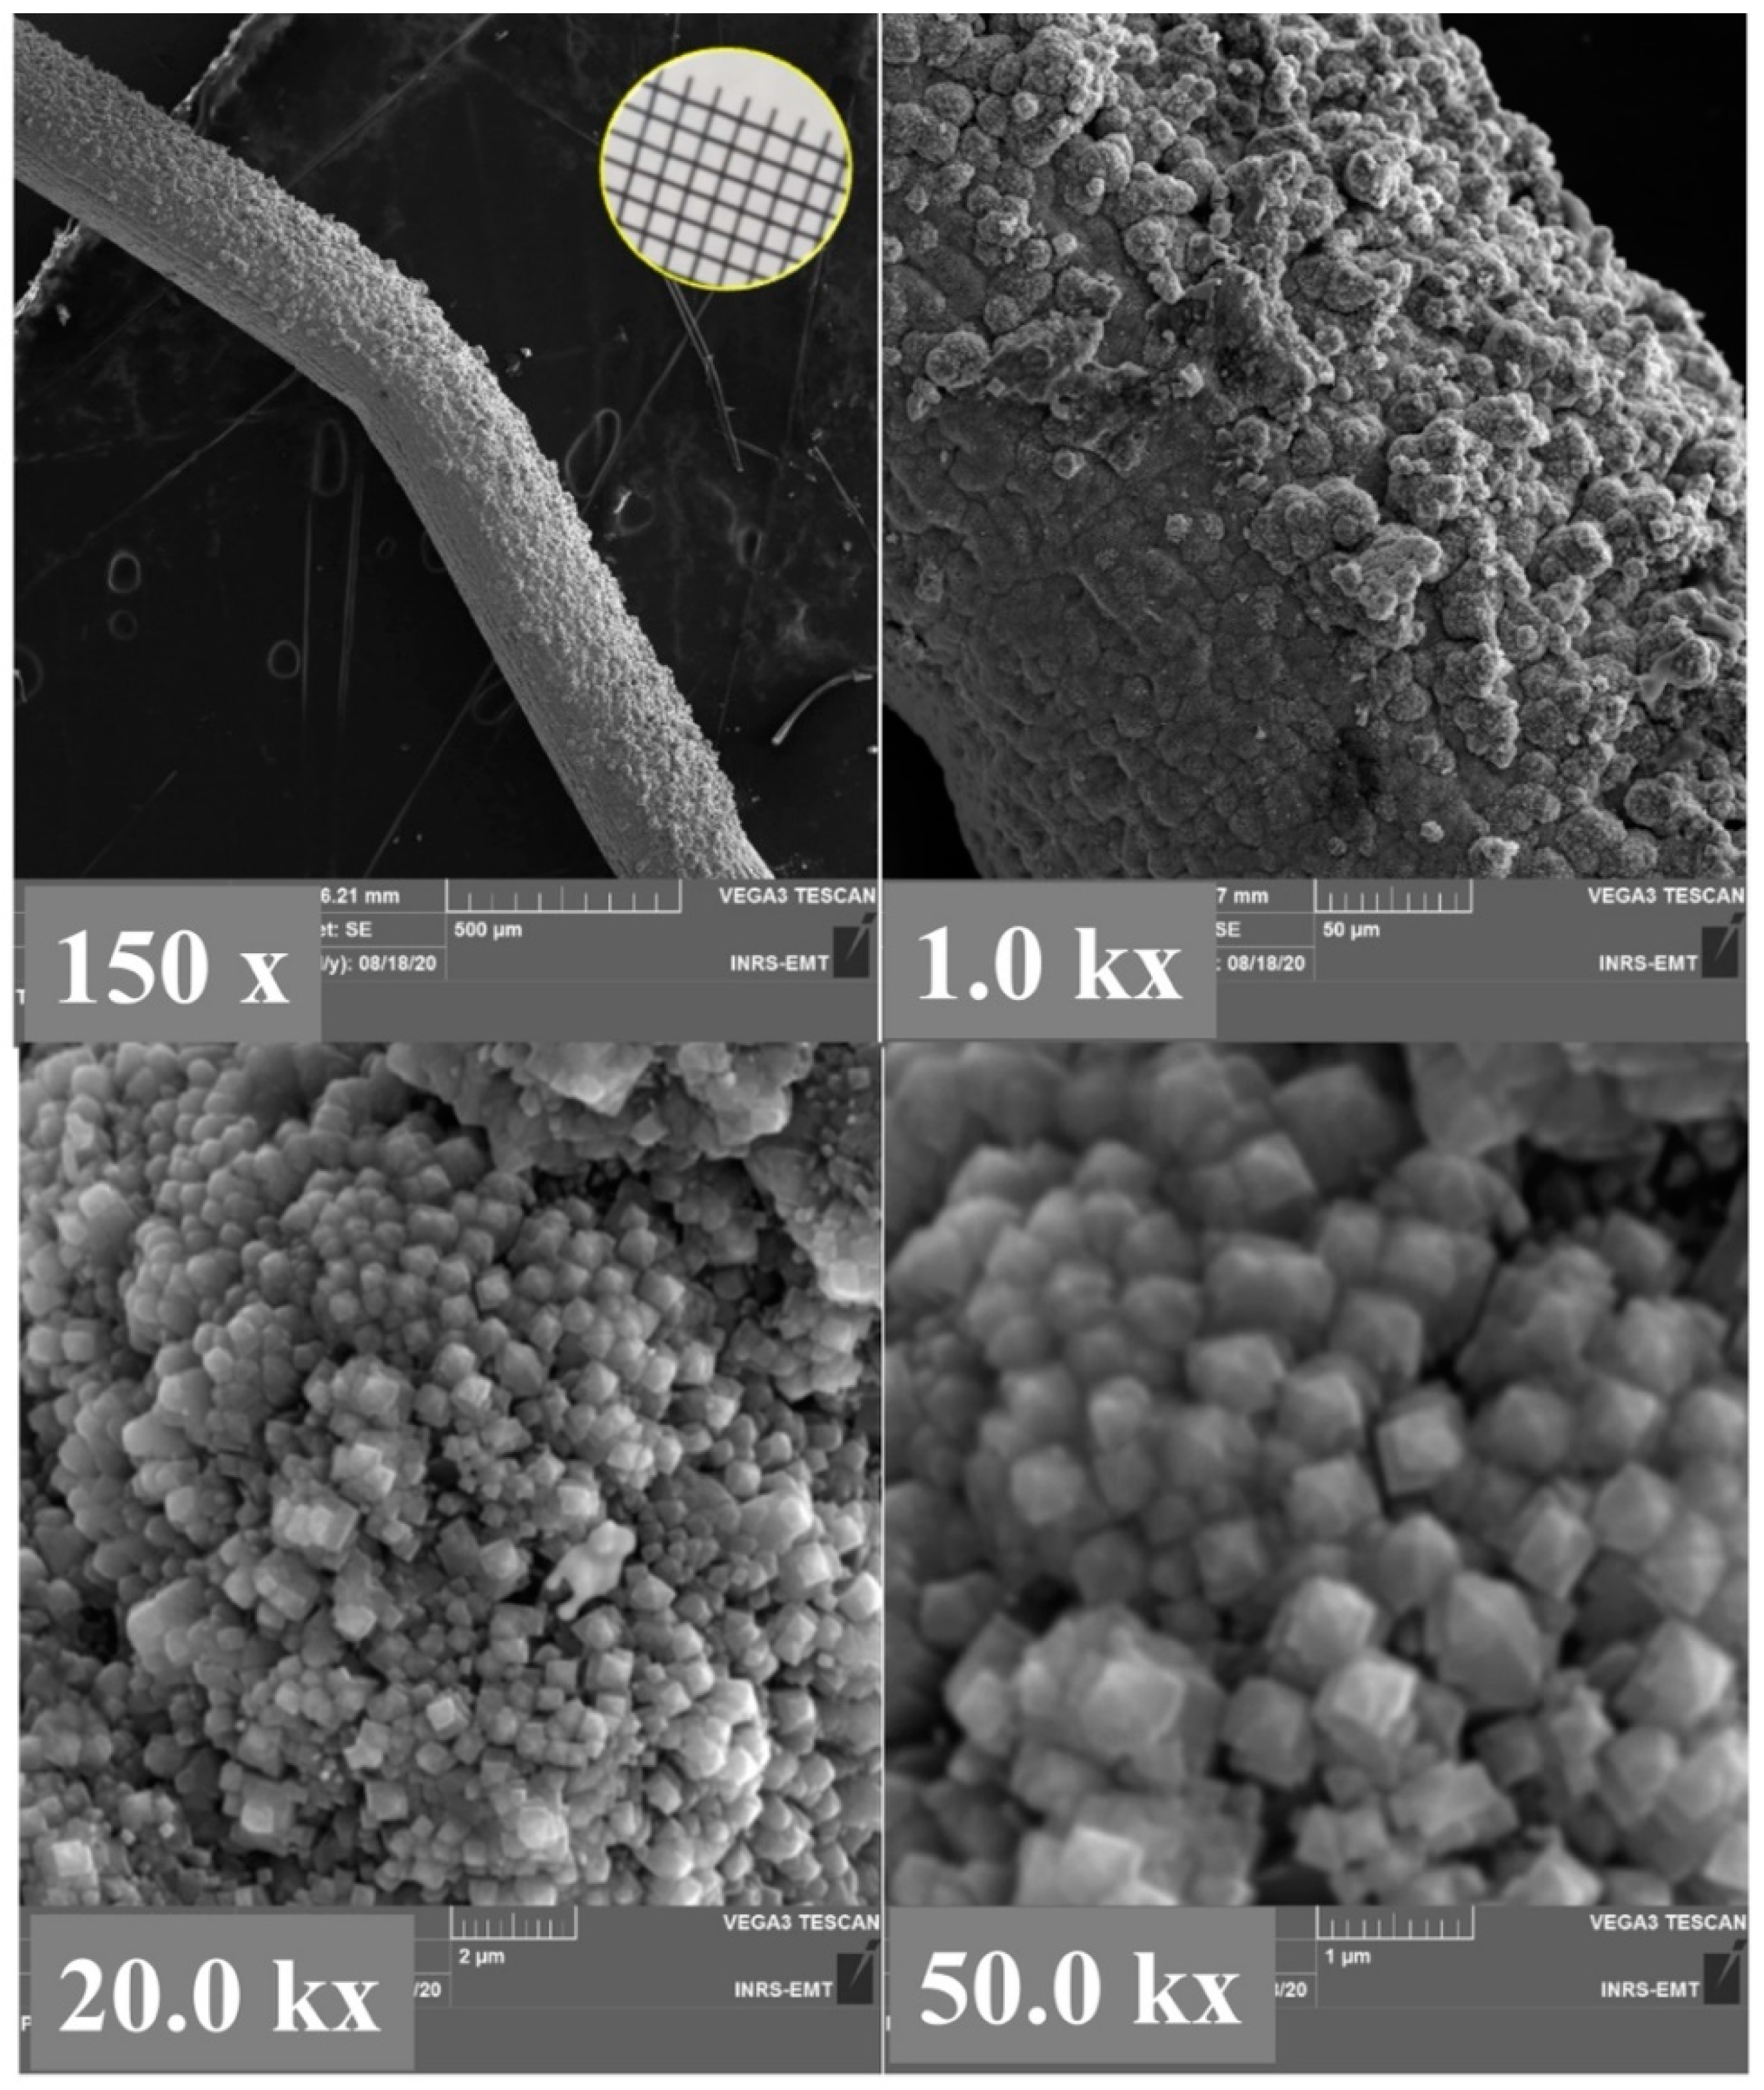
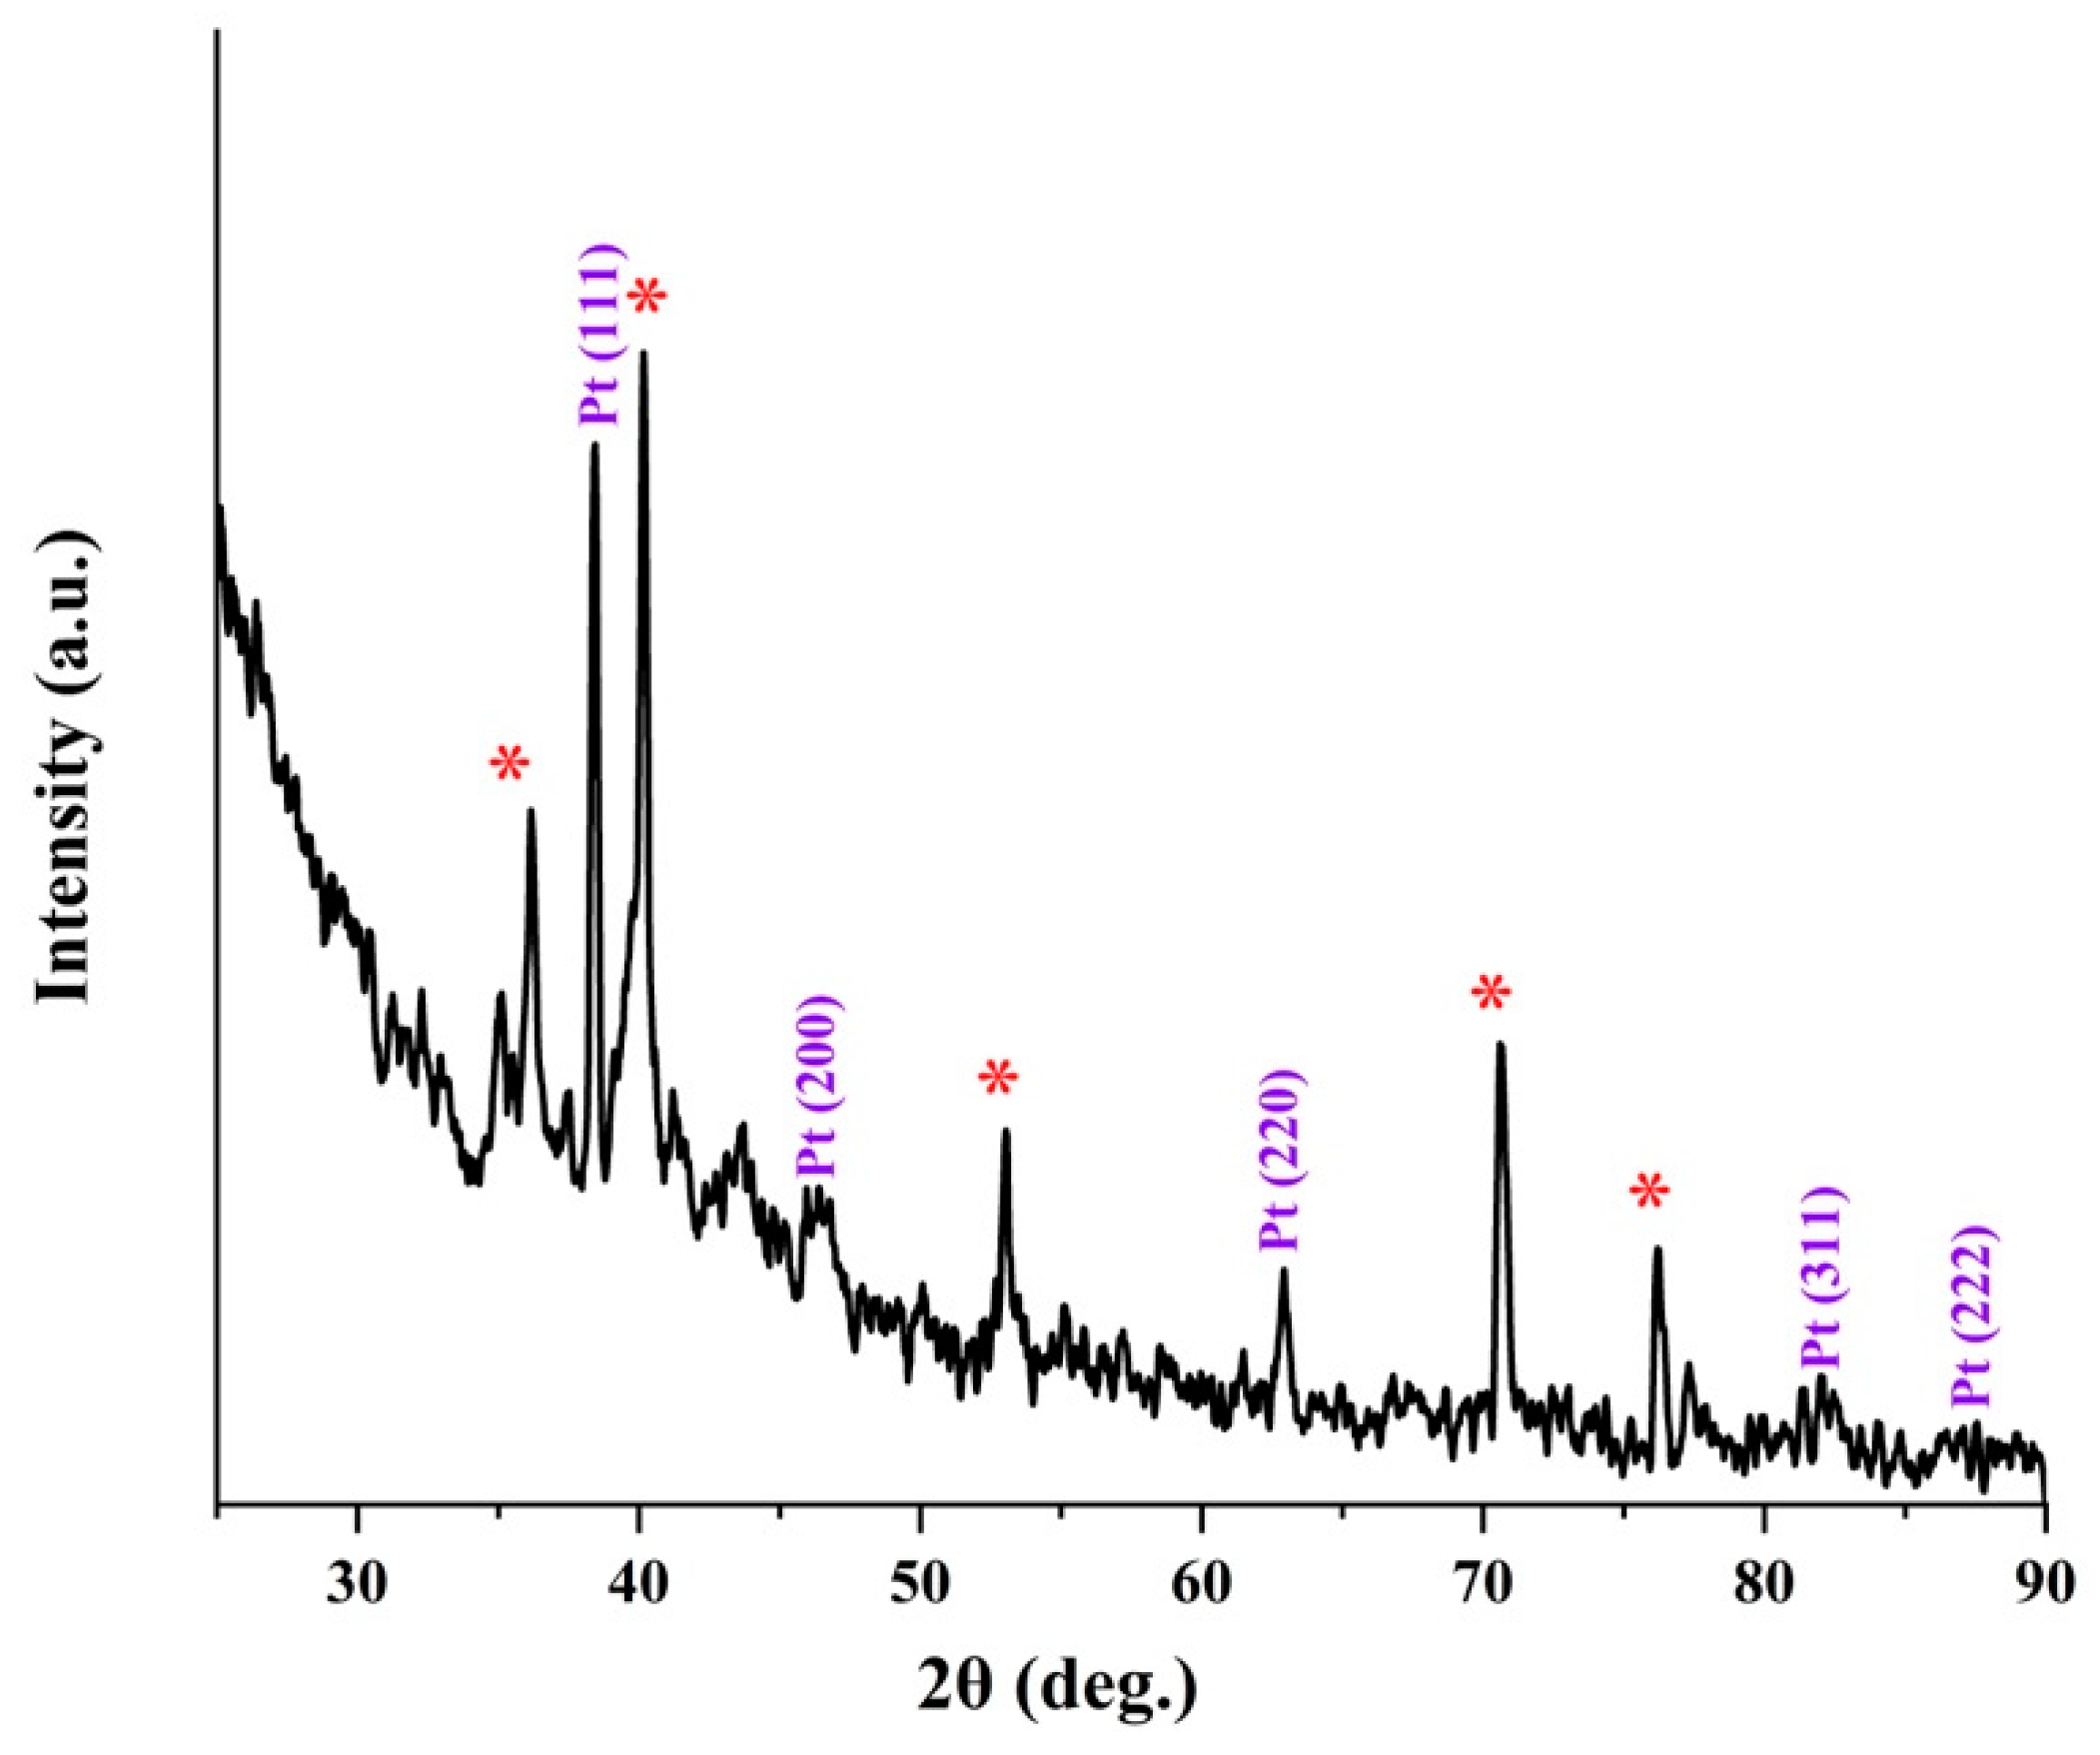
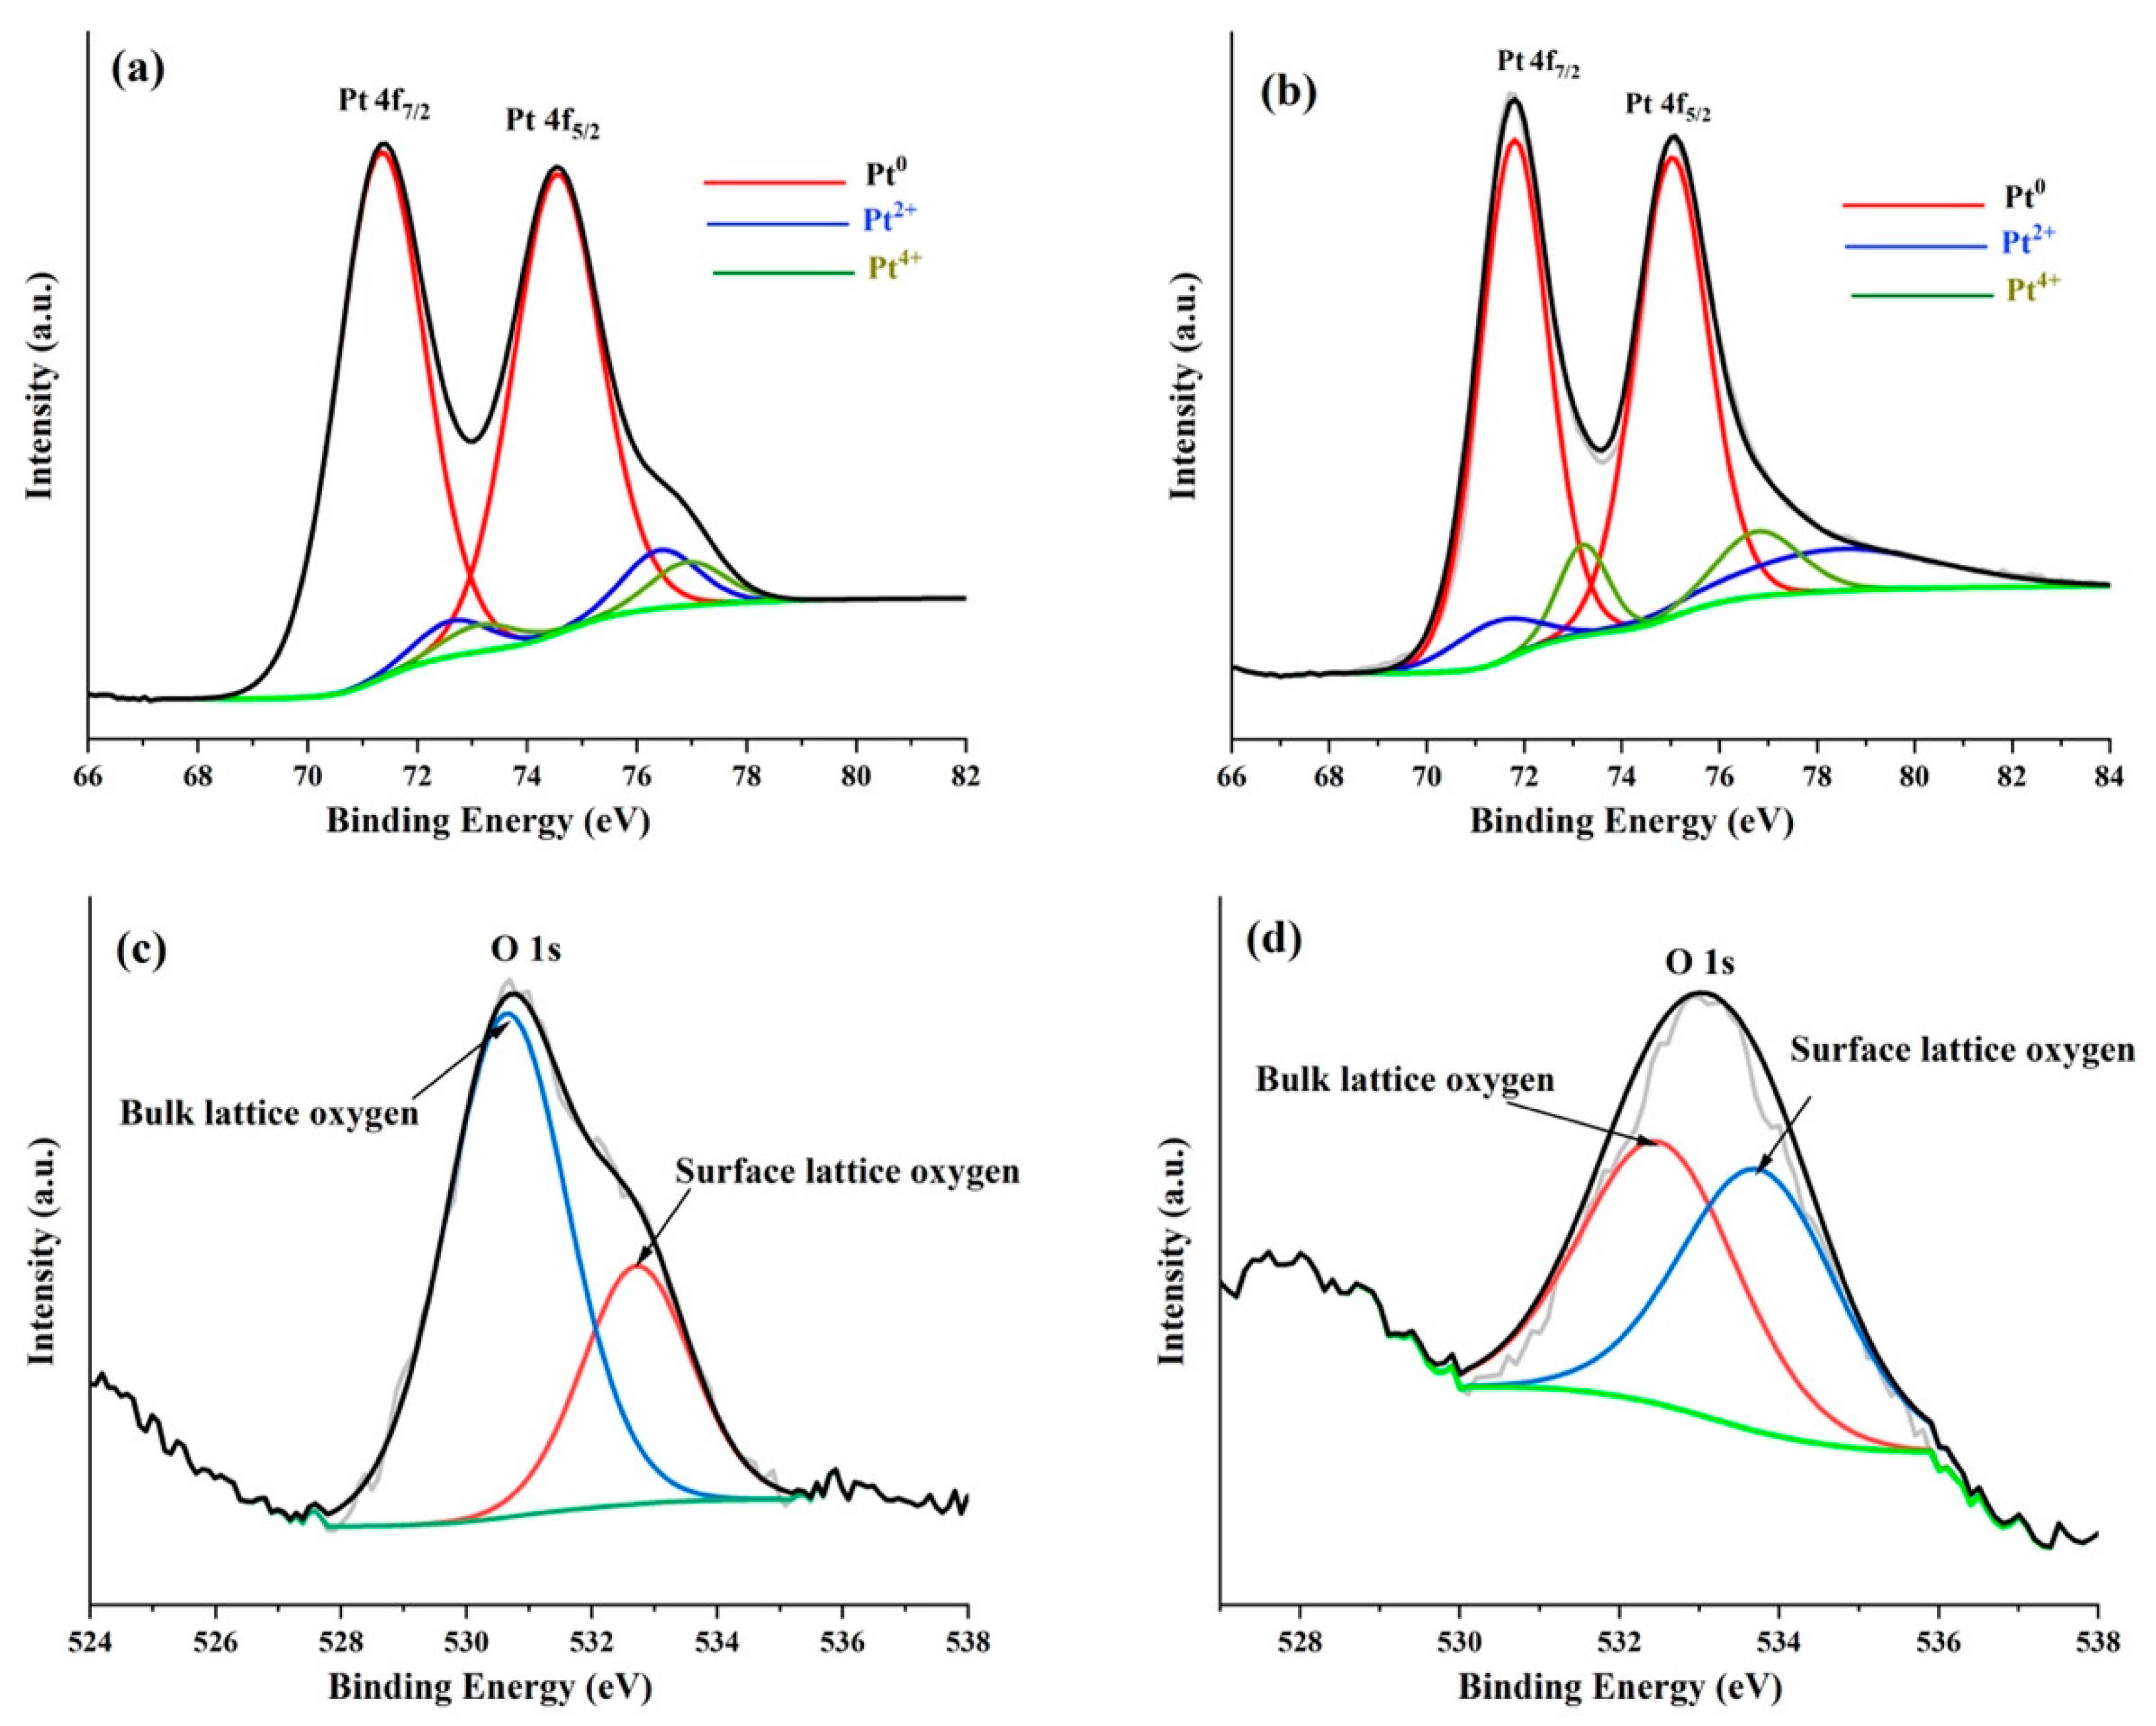
2.2. Characterization of Pt/TiO2/Ti Mesh

SEM images of the Pt/Ti mesh structure revealed that the surface morphology of the Pt film is very smooth (Figure 4). The XRD indexation (Figure 4, right side) of Pt peaks is in agreement with (111), (200), (220), (311) and (222) planes, respectively, of a face centered cubic (fcc) structure (JCPDS PDF No. 04-0802). The most intensive diffraction peak Pt (111) was selected to calculate the lattice constant (a) and the average crystallite size of Pt by Bragg’s law and Debye–Scherrer equation, respectively. The average crystallite size of Pt deposited Ti mesh was found to be 932 Å. On the other hand, the lattice constant was calculated to be close to 3.924 Å, which is close to the theoretical value of 3.923 Å.
The morphology of Pt films deposited on the TiO2 arrays is unlike Pt synthesized on Ti mesh. Figure 5, at higher magnification, shows that the Pt/TiO2 resembles to 3D pinecone-shaped structure. The lattice parameter and the average crystallite size calculated from XRD of Figure 6 were found to be 3.885 Å and 685 Å, respectively. Table 1, resumes the various XRD characteristics of the Ti mesh, TiO2/Ti mesh, Pt/Ti mesh and Pt/TiO2/Ti mesh. From the table, it can be seen that the average crystallite size of Pt is smaller than that of Pt grown on Ti mesh, suggesting that TiO2 enhanced the distribution quality of the Pt nanoparticles. It can also be observed that the lattice parameter of Pt synthesized on TiO2 is lesser than that of Pt produced on Ti mesh. This might exhibit a size-induced lattice contraction in the as-prepared state with respect to bulk Pt. The interaction of oxides with metallic nanostructures has been extensively investigated with particular emphasis on the effect of surface oxygen vacancies [28]. Oxygen vacancies at the metal support interface are recognized to induce charge transfer from the oxide to the metal easing the binding of the metal to the oxide. It has been reported that Pt is strongly adsorbed at oxygen vacancy sites in TiO2 [29]. It has previously been discussed that lattice strain can dramatically affect electrochemical activity [30,31,32]. Hence it is anticipated that the support-induced lattice strain observed in Pt/TiO2 could potentially enhance electrocatalytic activity, compared with Pt/Ti mesh.
The XPS survey spectrum of the Pt/TiO2 material shown in Figure S2 (Supplementary Materials) reveals that the surface exclusively consists of Pt, O and C elements. No Ti metal is detected indicating that the Pt film homogenously coats the underneath TiO2 nanorods. Figure 7a,b report the high-resolution Pt 4f core-level spectrum at the Pt/Ti mesh and Pt/TiO2/Ti mesh, respectively. The spectra show that Pt exists in the form of at least three oxidation states. The spectra were indeed adequately deconvoluted into three overlapping curves assigned to Pt0, Pt2+ and Pt4+ species. Table 2 shows the binding energy (BE) and relative amount of these three species assessed from the relative area of the integrated peak intensities. The peak positions of Pt0, Pt2+ and Pt4+ are in agreement with the values found in the literature [33,34]. The shift toward higher BE values compared to literature values (71.0 eV) is ascribed to the metal−support interaction and to small Pt nanoparticle sizes [35,36]. This positive shift may also imply metal−support interactions between TiO2 and Pt as observed with XRD analyses. This interaction can change the electronic properties of Pt by increasing the Pt d-vacancy via electronic donation to Lewis acid centers such as Tix+ at the Pt/TiO2 interface [37,38,39].
From Table 2, it can be noted that in the Pt/Ti mesh, Pt0 is widely distributed on the surface with 87.7 at% followed by slight relative concentrations (<7 at%) of Pt2+ and Pt4+. It should be noted that for Pt deposition on the Ti mesh, the former has not been etched on purpose, in order to better assess the effect of TiO2 morphology (layer vs. nanorods) on the electrochemical performance. Hence, the oxygen is due to the native TiO2 layer present on the surface of the mesh. On the other hand, the concentration of Pt0 decreased while those of Pt2+ and Pt4+ increased at the Pt/TiO2 sample. From Table 2, compared to the Pt/Ti mesh, it was noticed that in the Pt/TiO2/Ti mesh the position of Pt0 shifted by 0.45 eV toward higher BEs while the position of Pt2+ moved by 1.26 eV toward lower BEs. These shifts can be explained by different sizes of Pt particles and different degrees of interaction with the TiO2 support, signifying a strong interaction between the TiO2 nanorods and the Pt film above. Other researchers have observed Pt/TiO2 composites exhibiting ionized platinum, which was also ascribed to the strong interaction between Pt and the TiO2 support [37,38,40]. This behavior can be assumed to the presence of oxygen vacancies at the TiO2 support interface. The Pt4+ (PtO2) is the result of Pt cations replacing those of Ti in the TiO2 lattice, and the Pt atoms at the surface creating Pt2+ species. The O 1s core level peaks for the Pt/Ti mesh and Pt/TiO2/Ti mesh materials are shown in Figure 7c,d, respectively. A simple visual inspection of the O1s peak showed that it was wide and asymmetrical (Figure 7c,d). Therefore, the peak could be deconvoluted in two peaks. The resulting parameters are reported in Table 2. In this case, the OI element is ascribed to the bulk lattice oxygen, whereas the OII component is attributed to the surface lattice oxygen [41].

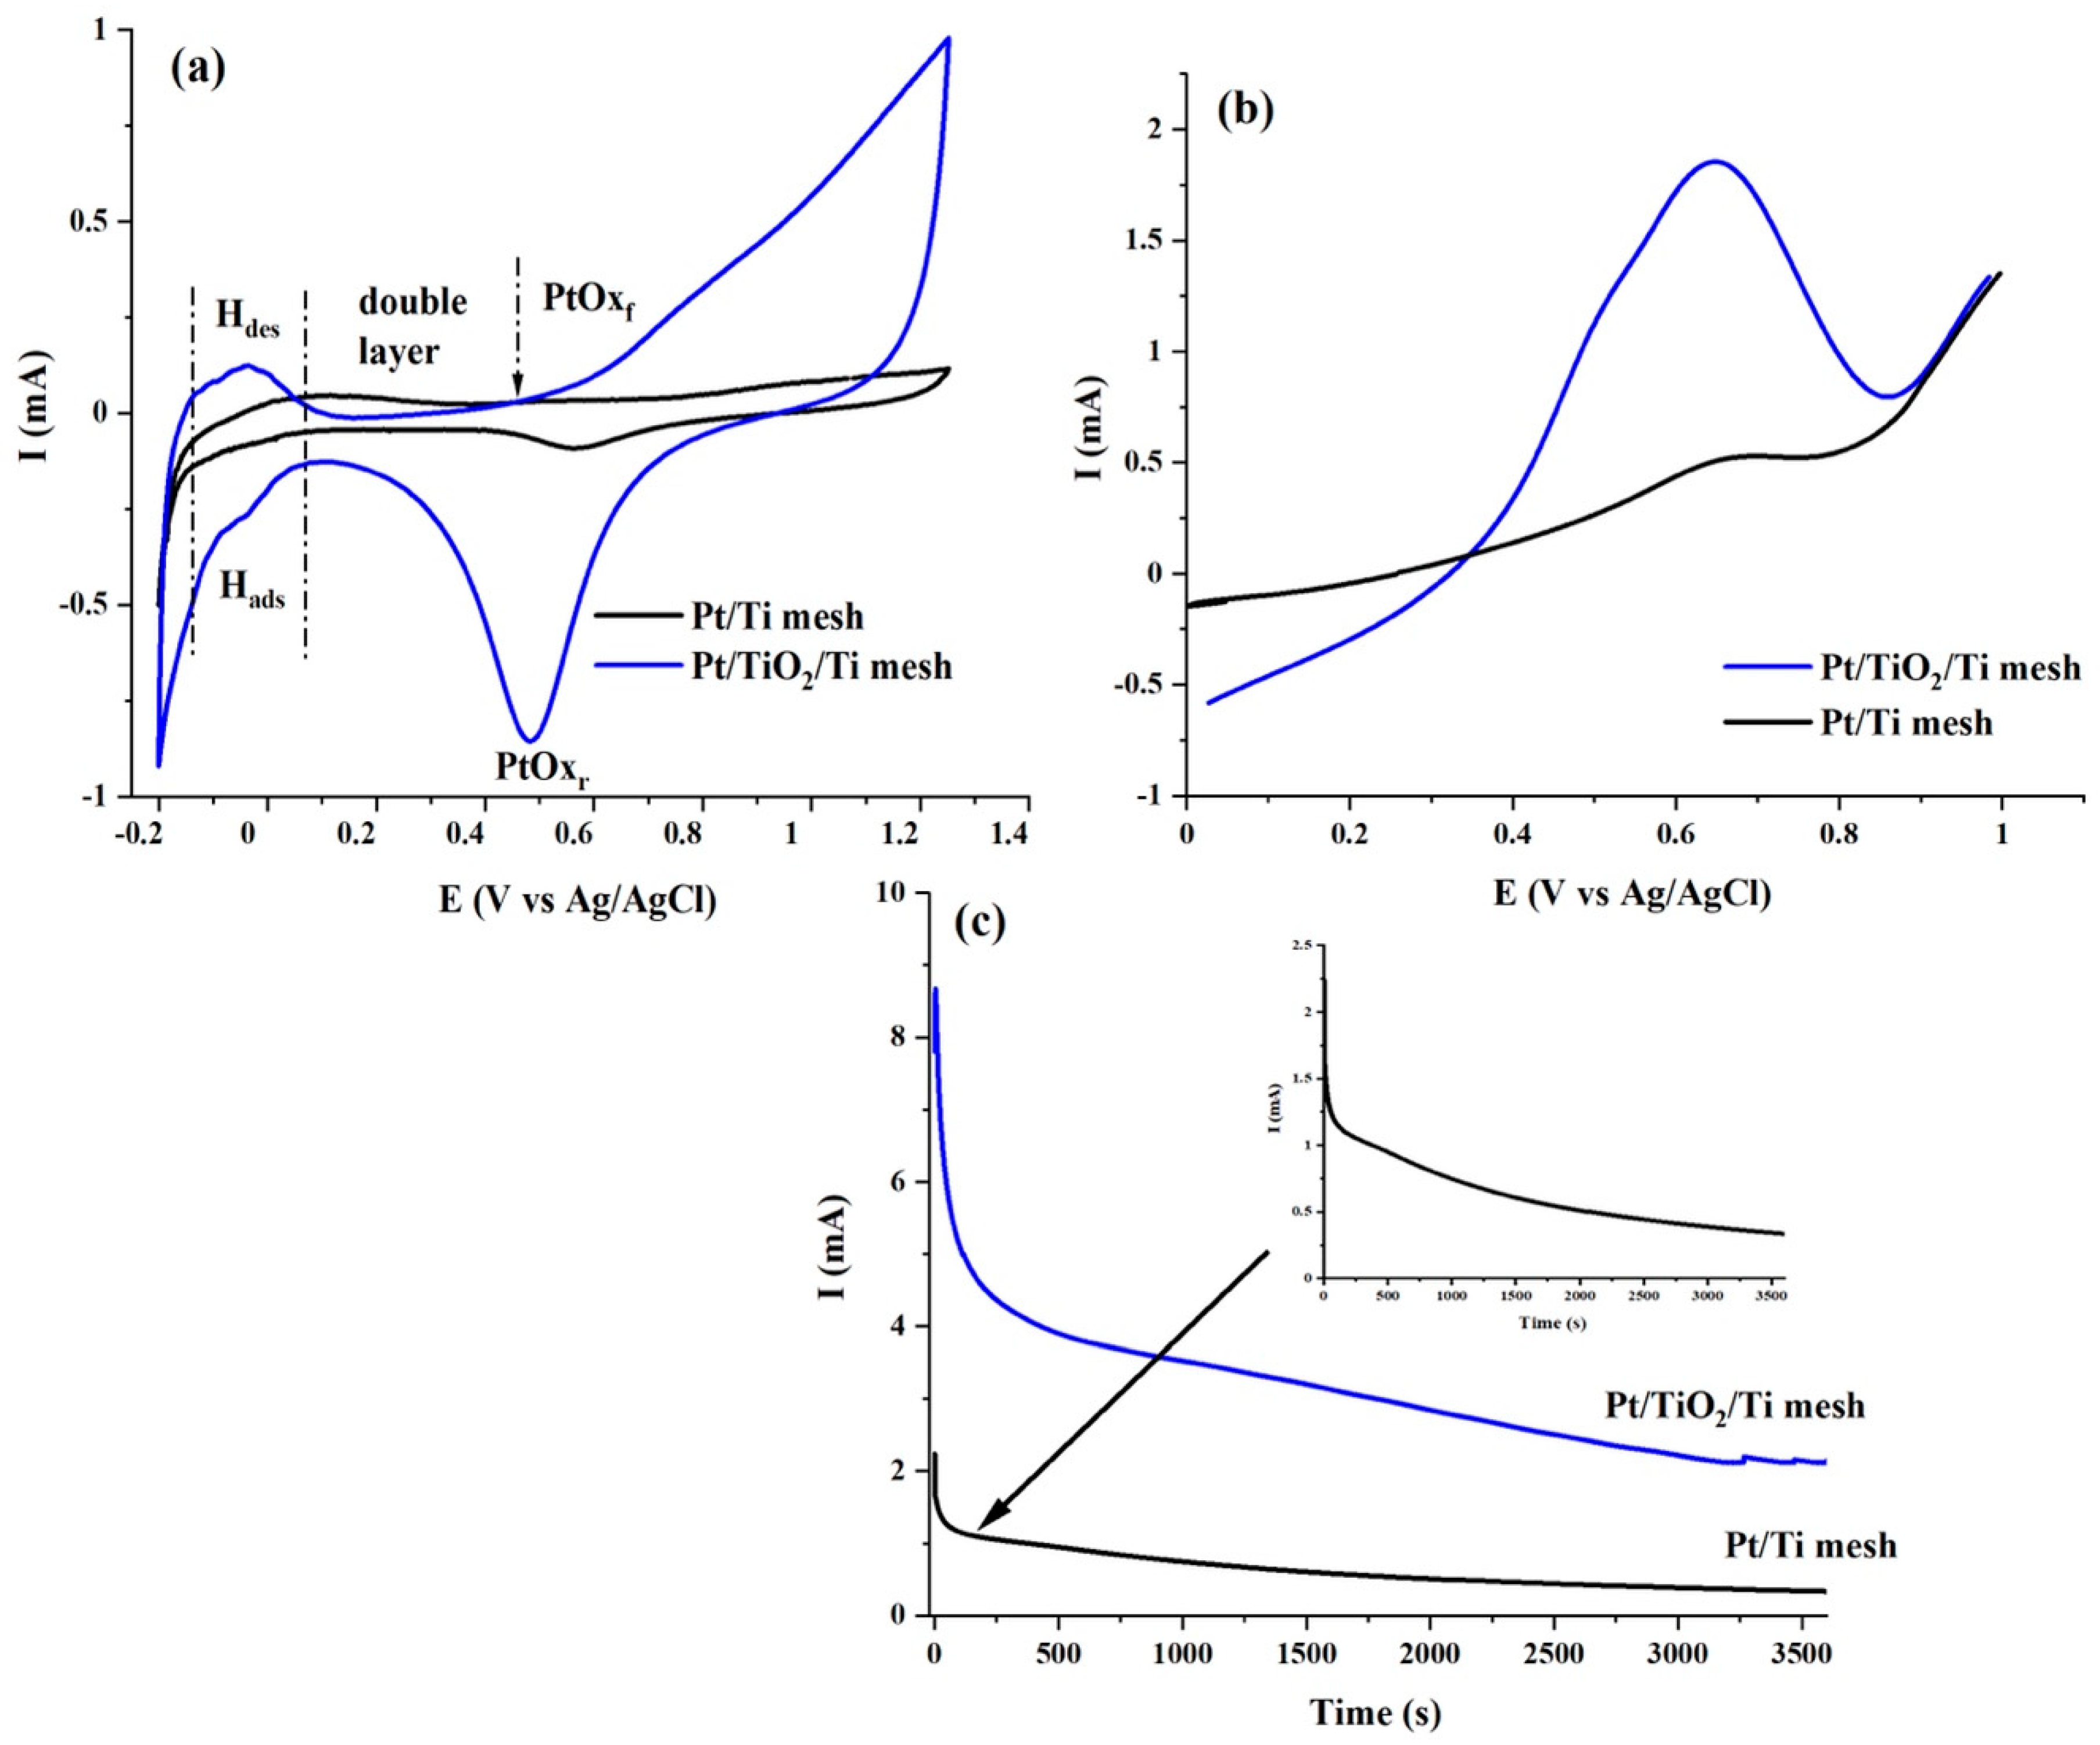
2.3. Electrochemical Characterization

Figure 8a recorded with 50 mV s−1 compares CVs of Pt/Ti mesh and Pt/TiO2/Ti mesh electrodes in 0.5 M H2SO4 deaerated solution. It has to be reiterated that both electrodes contained a similar amount of Pt (0.120 mg cm−2). At the Pt/TiO2/Ti mesh electrode, the CV contained the classical features of hydrogen atom adsorption (Hads) and hydrogen atom desorption (Hdes) peaks from −0.2 to 0.1 V [42,43,44,45]. On the other hand, the Hads/Hdes features were ill-defined at the Pt/Ti mesh electrode. In addition, the current of the Hads/Hdes peaks at the Pt/TiO2/Ti mesh were distinctively greater than those delivered by the Pt/Ti mesh, which clearly indicates the greater surface area at the former electrode [45]. This also means that Pt/TiO2 has a larger surface area than the Pt/Ti mesh. The larger surface area signifies smaller particle size, confirming that TiO2 improved the dispersion and utilization of the Pt nanoparticles [46], which is in line with the XRD analyses (Table 1). The Pt oxide formation (PtOxf) at the Pt/Ti mesh starts at 0.74 V whereas its equivalent reduction (PtOxr) peak potential takes place at 0.56 V vs. Ag/AgCl. On the other hand, PtOxf and PtOxr were located at 0.44 V and 0.48 V, respectively at the Pt/TiO2/Ti mesh. This implies that TiO2 can provide oxygeneous species at lower potentials, which will facilitate the removal of CO-like intermediates and accelerate EOR.
Subsequently, the effect of the TiO2 arrays on the electrocatalytic behaviour of Pt was investigated towards electrooxidation of ethanol. Figure 8b shows comparative LSVs obtained in 0.5 M H2SO4 + 1 M C2H5OH solution at 5 mV s−1 (quasi-steady state) at Pt/Ti mesh and Pt/TiO2/Ti mesh electrodes. Forward and backward CVs in the 0.5 M H2SO4 + 1 M C2H5OH solution are shown in Figure S3. The LSVs at both electrodes showed characteristic EOR waves in accordance with the literature [47,48,49]. The onset potential, Eonset, peak potential (Ep), I@0.50 V, and peak current Ip values extracted from LSVs of Figure 8b are reported in Table 3. Eonset is a criterion that provides knowledge about the kinetics of an electrochemical reaction and is identified here as the value at which a current begins for the electrooxidation of ethanol. I@0.50 V is an experimental condition near to the projected functioning potential of DEFCs devices and allows comparison of the progress of the EOR catalytic activity using different electrocatalysts. Hence from Table 3, it can be observed that Eonset and Ep are not significantly different at both electrodes. However, Pt/TiO2/Ti mesh demonstrated the best catalytic activity toward EOR in terms Ip of 1.85 mA which is remarkably 3.5 times greater than the Ip delivered by Pt/Ti mesh. A further outstanding performance of the Pt/TiO2/Ti mesh is obviously its value of I@0.5 V, which is 4.4 times greater than the Pt/Ti mesh.
Chronoamperometric (CA) experiments were performed to examine the electrodes durability. Figure 8c shows the current-time (I-t) curves of the Pt/Ti mesh and Pt/TiO2/Ti mesh for EOR at 0.6 V upon 3600 s testing. It can be seen that in both CA profiles, the current increased abruptly, then decreased and ultimately attained quasi-steady-state behavior. In Figure 8c, one can observe that the current decay for the EOR on the Pt/TiO2/Ti mesh catalyst is significantly slower than that on the bare Pt/Ti catalyst. The first current increase is due to the double-layer charging effect, whereas the initial decay was caused by the rapid increase of the surface coverage by intermediate species, such as adsorbed CO during EOR [48]. After 3600 s, the quasi steady-state current density (Iss) at the Pt/TiO2/Ti mesh was 6.6 times greater than that of Pt/Ti mesh (Table 3).
In summary, it is clear that incorporating TiO2 flower-like nanorods and vertically aligned bar-shaped structures as a supporting material considerably increased the electrochemical activity of the Pt catalyst. Therefore, it can be suggested that the Pt/TiO2/CP catalyst offers a higher Pt utilization than the unsupported Pt/Ti mesh catalyst.

3. Materials and Methods

3.1. Growth of TiO2 Arrays onto Ti Mesh

Titanium meshes of 1.5 cm × 2 cm with 0.5 mm thickness were placed in an ultrasonic bath containing acetone and washed for 20 min. After rinsing with water and drying in air, the titanium meshes were subjected to chemical etching in a solution containing 15 mL of HCl (18 wt%) solution. The chemical etching was conducted at a temperature of 80 °C and a duration of 15 min. This operation was necessary to remove the native TiO2 layer. Afterward, the Ti meshes were placed inside a Teflon stainless steel autoclave (23 mL, Parr Instrument, Moline, IL, USA) containing 10 mL of 0.6 M of HCl aqueous solution. The hydrothermal synthesis was conducted at 180 °C and lasted 10 h. The synthesis condition effects on the microstructure of the obtained materials can be found in our previous publication [50].

3.2. Growth of Pt onto Ti Mesh and TiO2 Arrays

Platinum films were deposited onto Ti mesh and TiO2/Ti mesh substrates at room temperature by PLD method employing pure Pt target (99.99%, Kurt J. Lesker Co, Jefferson Hills, PA, USA). Details on the operating principle of the PLD are reported elsewhere [51,52]. The deposition conditions were: 50 kp laser pulses, 2 Torr of helium, KrF excimer laser (λ = 248 nm), pulse width of 17 ns, repetition rate of 50 Hz, 4 Joules per cm2 as the laser fluence and 5 cm as the distance between the substrate (Ti or TiO2) and the Pt target. Prior to every deposition of Pt, evacuation of the PLD chamber was done at 4 × 10⁻⁵ Torr by a turbo pump. The amount of the deposited Pt assessed with neutron activation analysis was 120 μg cm−2. The PLD deposition parameters were optimal and reported in our previous publications [53,54].

3.3. Materials Characterization

An SEM (TESCAN, LYRA3) operated at 20 kV was used to analyze the surface morphology of the synthesized materials. The crystalline structure of all samples was determined by XRD using a Bruker D8 Advance diffractometer equipped with a Cu Kα source (λ = 1.5406 Å). The tube current was 40 mA with a tube voltage of 40 kV. Diffractograms were acquired with an acquisition time of 5 s per step in the Grazing Incidence Diffraction (GID) scan mode using an incident angle of 3° and a 2θ angular of 0.04° step size. XPS analysis was conducted to examine the concentration of the elements and their valence states at the surface of the samples with a VG Escalab 220i-XL outfitted with an Al Kα source (1486.6 eV). 10 kV, 20 mA and pass energy of the analyzer 20 eV were the conditions that operated the anode. Survey spectra were first recorded from 0 to1350 eV. Afterwards, higher resolution multiplex scans (Ti 2p, Pt 4f, C1 s and O 1s core levels) were acquired. CasaXPS software (Casa Software Ltd, Teignmouth, UK.) was employed to analyze and quantify the elements by fitting the core level spectra to a Shirley background exclusion. The metallic components of the Pt 4f and Ti 2p regions were fitted using a Gaussian/Lorentzian asymmetrically modified line shape, and a Gaussian/Lorentzian line shape was used to fit the other components. The C 1s core level located at 284.6 eV, stemming from hydrocarbon impurities present at the surface of the samples, was employed as an internal reference. All XPS spectra were readjusted with regard to the C 1s core level of accidental carbon impurity.

3.4. Electrochemical Experiments

Ethanol (100% purity) and sulfuric acid (H2SO4, 96%) were acquired from Commercial Alcohols Inc. (Toronto, ON, Canada) and Agros Organics (Fisher Scientific, Mississauga, ON, Canada), respectively. The reactants were used as received. The electrochemical properties were studied by voltammetry or LSV. The electrolytic solution was either 0.5 M H2SO4 or 1 M C2H5OH + 0.5 M H2SO4. The 3-electrode cell contained Ag/AgCl (4 M NaCl) that acted as a reference electrode, a platinum coil as an auxiliary electrode and Pt/Ti mesh or Pt/TiO2 arrays/Ti mesh as working electrodes. In this paper, the potentials are reported against Ag/AgCl. Before commencing each electrochemical experiment, argon was bubbled through the electrolytic solution for 30 min to remove dissolved oxygen. Then the surface of the Pt/Ti mesh and Pt/TiO2/Ti mesh were subjected to electrochemical cleaning and activation in 0.5 M H2SO4 by multicycling voltammetry from −0.2 V to 1.3 V at 50 mV s−1 potential scan rate until a steady state voltammogram was reached. EOR experiments were performed with LSV using a mixture of 1 M C2H5OH and 0.5 M H2SO4 within 0 V to 1.0 V at 5 mV s−1. The Ti meshes in all cases had the same geometric size. Electrochemical measurements were conducted at ambient temperature using an Autolab, PGSTAT 20.

4. Conclusions

TiO2 arrays were successfully synthesized directly on the Ti mesh by a hydrothermal method in acidic medium. The hydrothermal method does not necessitate the utilization of templates, it is easily scalable, cheap and environmentally benign. SEM observations revealed that as-prepared TiO2 is constituted of a mixture of flower-like nanorods and vertically aligned bar-shaped structures corresponding to rutile phase, as identified by XRD. By means of XPS, the [O]/[Ti] atomic ratio was found to 3.8. This deviation from stoichiometry is ascribed to porosity that permits moisture to accrue between the voids of the perpendicularly arranged TiO2 bars or within the arranged flower-like TiO2 nanorods.
Afterwards, Pt catalyst as a benchmark catalyst was deposited by PLD onto synthesized TiO2 structures in order to assess their catalytic supporting properties. SEM imaging revealed an interesting 3D pinecone-shaped Pt/TiO2 structure. XRD analysis showed that the crystallite size of Pt in Pt/TiO2 was smaller than that in Pt/Ti mesh, which demonstrates that the TiO2 support enhances the dispersion quality of Pt nanoparticles. Furthermore, XPS analysis confirmed the strong interaction between Pt and the TiO2 support, which induces ionized platinum (Pt2+ and Pt4+).
Notwithstanding having a similar amount of Pt, the three-dimensional pinecone-shaped Pt/TiO2 structure exhibited current catalytic activity towards EOR at a remarkably greater rate of 4.4 times more than unsupported Pt. Moreover, the presence TiO2 as support enables 6.6 times increased current durability relative to the Pt/Ti mesh. As mentioned in this work, Pt was chosen here as a model catalyst and we believe that with catalysts that perform better than platinum such 3D mesh architectured electrodes are promising not only for fuel cells in general but can be useful for a variety of catalytic or photoelectrochemical reactions for other catalysts.

Supplementary Materials

The following supporting information can be downloaded online https://www.mdpi.com/article/10.3390/molecules27061921/s1, Figure S1: SEM micrographs at increasing magnifications of pristine Ti mesh. Figure S2: XPS survey scan of Pt film grown onto TiO2 nanorods; Figure S3: Cyclic voltammetry in 0.5 M H2SO4+ 1 M C2H5OH solution with a potential scan rate of 5 mV s−1.

Author Contributions

Data curation, N.M.; formal analysis, N.M.; methodology, N.M. and J.C.A.-M.; writing—original draft preparation, N.M. and J.C.A.-M.; writing—review and editing, M.M. All authors have read and agreed to the published version of the manuscript.

Funding

This research was funded by the Natural Sciences Engineering Research Council of Canada (NSERC) through the Discovery grant and The Centre Québécois sur les Matériaux Fonctionnels (CQMF). J. C. Abrego-Martínez is grateful to UNESCO-MATECSS Excellence PhD Scholarship Program.

Conflicts of Interest

The authors declare no conflict of interest.

Sample Availability

Samples of the compounds are not available from the authors.

References

  1. Gu, Y.; Zhang, T.; Chen, H.; Wang, F.; Pu, Y.; Gao, C.; Li, S. Mini Review on Flexible and Wearable Electronics for Monitoring Human Health Information. Nanoscale Res. Lett. 2019, 14, 263. [Google Scholar] [CrossRef] [PubMed] [Green Version]
  2. Zhao, Y.; Guo, J. Development of flexible Li-ion batteries for flexible electronics. InfoMat 2020, 2, 866–878. [Google Scholar] [CrossRef] [Green Version]
  3. Kim, D.W.; Jung, S.M.; Jung, H.Y. A super-thermostable, flexible supercapacitor for ultralight and high performance devices. J. Mater. Chem. A 2020, 8, 532–542. [Google Scholar] [CrossRef]
  4. Ning, F.; He, X.; Shen, Y.; Jin, H.; Li, Q.; Li, D.; Li, S.; Zhan, Y.; Du, Y.; Jiang, J.; et al. Flexible and Lightweight Fuel Cell with High Specific Power Density. ACS Nano 2017, 11, 5982–5991. [Google Scholar] [CrossRef] [PubMed]
  5. Hashemi, S.A.; Ramakrishna, S.; Aberle, A.G. Recent progress in flexible–wearable solar cells for self-powered electronic devices. Energy Environ. Sci. 2020, 13, 685–743. [Google Scholar] [CrossRef]
  6. Kwon, C.H.; Ko, Y.; Shin, D.; Kwon, M.; Park, J.; Bae, W.K.; Lee, W.S.; Cho, J. High-power hybrid biofuel cells using layer-by-layer assembled glucose oxidase-coated metallic cotton fibers. Nat. Commun. 2018, 9, 4479. [Google Scholar] [CrossRef] [PubMed] [Green Version]
  7. Yaoming, X.; Jihuai, W.; Gentian, Y.; Jianming, L.; Miaoliang, H.; Leqing, F.; Zhang, L. Fabrication of high performance Pt/Ti counter electrodes on Ti mesh for flexible large-area dye-sensitized solar cells. Electrochim. Acta 2011, 58, 621–627. [Google Scholar]
  8. Kim, H.; Khamwannah, J.; Choi, C.; Shi, Y.; Jin, S. Hydrothermally grown TiO2 nanotubes on multi-layered Ti mesh electrodes for enhanced photoelectrochemical reaction. MRS Commun. 2013, 3, 235–240. [Google Scholar] [CrossRef]
  9. Luo, D.; Liu, B.; Fujishima, A.; Nakata, K. TiO2 Nanotube Arrays Formed on Ti Meshes with Periodically Arranged Holes for Flexible Dye-Sensitized Solar Cells. ACS Appl. Nano Mater. 2019, 2, 3943–3950. [Google Scholar] [CrossRef]
  10. Sugiawati, V.A.; Vacandio, F.; Galeyeva, G.; Kurbatov, A.P.; Djenizian, T. Enhanced Electrochemical Performance of Electropolymerized Self-Organized TiO2 Nanotubes Fabricated by Anodization of Ti Grid. Front. Phys. 2019, 7, 179. [Google Scholar] [CrossRef] [Green Version]
  11. Chen, C.; Yang, X. MnO2 modified TiN nanotube arrays on Ti mesh for flexible supercapacitors electrode. RSC Adv. 2017, 7, 56440–56446. [Google Scholar] [CrossRef] [Green Version]
  12. Wang, Z.; Cao, X.; Liu, D.; Hao, S.; Du, G.; Asiric, A.M.; Sun, X. Ternary NiCoP nanosheet array on a Ti mesh: A high-performance electrochemical sensor for glucose detection. Chem. Commun. 2016, 52, 14438–14441. [Google Scholar] [CrossRef] [PubMed]
  13. Jiang, S.; Yi, B.; Zhang, C.; Liu, S.; Yu, H.; Shao, Z. Vertically aligned carbon-coated titanium dioxide nanorod arrays on carbon paper with low platinum for proton exchange membrane fuel cells. J. Power Sources 2015, 276, 80–88. [Google Scholar] [CrossRef]
  14. Kim, D.S.; Abo Zeid, E.F.; Kim, Y.T. Additive treatment effect of TiO2 as supports for Pt-based electrocatalysts on oxygen reduction reaction activity. Electrochim. Acta 2010, 55, 3628–3633. [Google Scholar] [CrossRef]
  15. Tominaka, S.; Ishihara, A.; Nagai, T.; Ota, K. Noncrystalline Titanium Oxide Catalysts for Electrochemical Oxygen Reduction Reactions. ACS Omega 2017, 2, 5209–5214. [Google Scholar] [CrossRef]
  16. Abdullah, M.; Kamarudin, S.K.; Shyuan, L.K. TiO2 Nanotube-Carbon (TNT-C) as Support for Pt-based Catalyst for High Methanol Oxidation Reaction in Direct Methanol Fuel Cell. Nanoscale Res. Lett. 2016, 11, 553. [Google Scholar] [CrossRef] [Green Version]
  17. Drew, K.; Girishkumar, G.; Vinodgopal, K.; Kamat, P.V. Boosting Fuel Cell Performance with a Semiconductor Photocatalyst:  TiO2/Pt−Ru Hybrid Catalyst for Methanol Oxidation. J. Phys. Chem. B 2005, 109, 11851–11857. [Google Scholar] [CrossRef] [PubMed]
  18. Antolini, E. Photo-assisted methanol oxidation on Pt-TiO2 catalysts for direct methanol fuel cells: A short review. Appl. Catal. B Environ. 2018, 237, 491–503. [Google Scholar] [CrossRef]
  19. Wu, X.; Zhuang, W.; Lu, L.; Li, L.; Zhu, J.; Mu, L.; Li, W.; Zhu, Y.; Lu, X. Excellent performance of Pt-C/TiO2 for methanol oxidation: Contribution of mesopores and partially coated carbon. Appl. Surf. Sci. 2017, 426, 890–896. [Google Scholar] [CrossRef] [Green Version]
  20. Ait Ali Yahia, S.; Hamadou, L.; Salar-García, M.J.; Kadri, A.; Ortiz-Martínez, V.M.; Hernández-Fernández, F.J.; Pérez de los Rios, A.; Benbrahim, N. TiO2 nanotubes as alternative cathode in microbial fuel cells: Effect of annealing treatment on its performance. Appl. Surf. Sci. 2016, 387, 1037–1045. [Google Scholar] [CrossRef]
  21. Yin, T.; Lin, Z.; Su, L.; Yuan, C.; Fu, D. Preparation of Vertically Oriented TiO2 Nanosheets Modified Carbon Paper Electrode and Its Enhancement to the Performance of MFCs. ACS Appl. Mater. Interfaces 2015, 7, 400–408. [Google Scholar] [CrossRef] [PubMed]
  22. Erdem, B.; Hunsicker, R.A.; Simmons, G.W.; Sudol, E.D.; Dimonie, V.L.; El-Aasser, M.S. XPS and FTIR Surface Characterization of TiO2 Particles Used in Polymer Encapsulation. Langmuir 2001, 17, 2664–2669. [Google Scholar] [CrossRef]
  23. Marco, J.F.; Cuesta, A.; Gracia, M.; Gancedo, J.R.; Panjan, P.; Hanzel, D. Influence of a deposited TiO2 thin layer on the corrosion behaviour of TiN-based coatings on iron. Thin Solid Films 2005, 492, 158–165. [Google Scholar] [CrossRef]
  24. Sanjinés, R.; Tang, H.; Berger, H.; Gozzo, F.; Margaritondo, G.; Lévy, F. Electronic structure of anatase TiO2 oxide. J. Appl. Phys. 1994, 75, 2945–2951. [Google Scholar] [CrossRef]
  25. Bharti, B.; Kumar, S.; Lee, H.N.; Kumar, R. Formation of oxygen vacancies and Ti3+ state in TiO2 thin film and enhanced optical properties by air plasma treatment. Sci. Rep. 2016, 6, 32355. [Google Scholar] [CrossRef] [PubMed]
  26. Pan, X.; Yang, M.Q.; Fu, X.; Zhang, N.; Xu, Y.J. Defective TiO2 with oxygen vacancies: Synthesis, properties and photocatalytic applications. Nanoscale 2013, 5, 3601–3614. [Google Scholar] [CrossRef]
  27. Meng, L.J.; Moreira de Sá, C.P.; dos Santos, M.P. Study of porosity of titanium oxide films by X-ray photoelectron spectroscopy and IR transmittance. Thin Solid Films 1994, 239, 117–122. [Google Scholar] [CrossRef]
  28. Pacchioni, G. Electronic interactions and charge transfers of metal atoms and clusters on oxide surfaces. Phys. Chem. Chem. Phys. 2013, 15, 1737–1757. [Google Scholar] [CrossRef]
  29. Strasser, P.; Koh, S.; Anniyev, T.; Greeley, J.; More, K.; Yu, C.; Liu, Z.; Kaya, S.; Nordlund, D.; Ogasawara, H.; et al. Lattice-strain control of the activity in dealloyed core–shell fuel cell catalysts. Nat. Chem. 2010, 2, 454–460. [Google Scholar] [CrossRef]
  30. Kitchin, J.R.; Nørskov, J.K.; Barteau, M.A.; Chen, J.G. Role of strain and ligand effects in the modification of the electronic and chemical properties of bimetallic surfaces. Phys. Rev. Lett. 2004, 93, 156801. [Google Scholar] [CrossRef] [Green Version]
  31. Wang, J.X.; Inada, H.; Wu, L.; Zhu, Y.; Choi, Y.; Liu, P.; Zhou, W.-P.; Adzic, R.R. Oxygen reduction on well-defined core− shell nanocatalysts: Particle size, facet, and Pt shell thickness effects. J. Am. Chem. Soc. 2009, 131, 17298–17302. [Google Scholar] [CrossRef] [PubMed]
  32. Datye, A.; Kalakkad, D.; Yao, M.; Smith, D.J. Comparison of metal-support interactions in Pt/TiO2 and Pt/CeO2. J. Catal. 1995, 155, 148–153. [Google Scholar] [CrossRef]
  33. Bera, P.; Priolkar, K.R.; Gayen, A.; Sarode, P.R.; Hegde, M.S.; Emura, S.; Kumashiro, R.; Jayaram, V.; Subbanna, G.N. Ionic dispersion of Pt over CeO2 by the combustion method: Structural investigation by XRD, TEM, XPS, and EXAFS. Chem. Mater. 2003, 15, 2049–2060. [Google Scholar] [CrossRef]
  34. Tang, X.; Zhang, B.; Li, Y.; Xu, Y.; Xin, Q.; Shen, W. The role of Sn in Pt-Sn/CeO2 catalysts for the complete oxidation of ethanol. J. Mol. Catal. A Chem. 2005, 235, 122–129. [Google Scholar] [CrossRef]
  35. Dablemont, C.; Lang, P.; Mangeney, C.; Piquemal, J.Y.; Petkov, V.; Herbst, F.; Viau, G. FTIR and XPS Study of Pt Nanoparticle Functionalization and Interaction with Alumina. Langmuir 2008, 24, 5832–5841. [Google Scholar] [CrossRef] [PubMed]
  36. Kobayashi, H.; Teranishi, M.; Negishi, R.; Naya, S.; Tada, H. Reaction Mechanism of the Multiple-Electron Oxygen Reduction Reaction on the Surfaces of Gold and Platinum Nanoparticles Loaded on Titanium(IV) Oxide. J. Phys. Chem. Lett. 2016, 7, 5002–5007. [Google Scholar] [CrossRef]
  37. Bedolla-Valdez, Z.I.; Verde-Gómez, Y.; Valenzuela-Muñiz, A.M.; Gochi-Ponce, Y.; Oropeza-Guzmán, M.T.; Berhault, G.; Alonso-Núñez, G. Sonochemical Synthesis and Characterization of Pt/CNT, Pt/TiO2, and Pt/CNT/TiO2 Electrocatalysts for Methanol Electro-Oxidation. Electrochim. Acta 2015, 186, 76–84. [Google Scholar] [CrossRef]
  38. Xia, B.Y.; Wang, B.; Wu, H.B.; Liu, Z.; Wang, X.; Lou, X.W. Sandwich-Structured TiO2−Pt−graphene Ternary Hybrid Electrocatalysts with High Efficiency and Stability. J. Mater. Chem. 2012, 22, 16499–16505. [Google Scholar] [CrossRef]
  39. Qin, Y.H.; Li, Y.; Lv, R.L.; Wang, T.L.; Wang, W.G.; Wang, C.W. Enhanced Methanol Oxidation Activity and Stability of Pt Particles Anchored on Carbon-Doped TiO2 Nanocoating Support. J. Power Sources 2015, 278, 639–644. [Google Scholar] [CrossRef]
  40. Esfandiar, A.; Ghasemi, S.; Irajizad, A.; Akhavan, O.; Gholami, M. The decoration of TiO2/reduced graphene oxide by Pd and Pt nanoparticles for hydrogen gas sensing. Int. J. Hydrogen Energy 2012, 37, 15423–15432. [Google Scholar] [CrossRef]
  41. Szuber, J.; Czempik, G.; Larciprete, R.; Koziej, D.; Adamowicz, B. XPS study of the L-CVD deposited SnO2 thin films exposed to oxygen and hydrogen. Thin Solid Films 2001, 391, 198–203. [Google Scholar] [CrossRef]
  42. Jerkiewicz, G. Electrochemical Hydrogen Adsorption and Absorption. Part 1: Under-potential Deposition of Hydrogen. Electrocatalysis 2010, 1, 179–199. [Google Scholar] [CrossRef]
  43. Kinoshita, K.; Ferrier, D.R.; Stonehart, P. Effect of electrolyte environment and Pt crystallite size on hydrogen adsorption—V. Electrochim. Acta 1978, 23, 45–54. [Google Scholar] [CrossRef]
  44. Schmidt, T.J.; Gasteiger, H.A.; Stäb, G.D.; Urban, P.M.; Kolb, D.M.; Behm, R.J. Characterization of High-Surface-Area Electrocatalysts Using a Rotating Disk Electrode Configuration. J. Electrochem. Soc. 1998, 145, 2354–2358. [Google Scholar] [CrossRef]
  45. Chen, Q.S.; Vidal-Iglesias, F.J.; Solla-Gullon, J.; Sun, S.G.; Feliu, J.M. Role of surface defect sites: From Pt model surfaces to shape-controlled nanoparticles. Chem. Sci. 2012, 3, 136–147. [Google Scholar] [CrossRef]
  46. Kuriganova, A.; Faddeev, N.; Gorshenkov, M.; Kuznetsov, D.; Leontyev, I.; Smirnova, N. A Comparison of “Bottom-Up” and “Top-Down” Approaches to the Synthesis of Pt/C Electrocatalysts. Processes 2020, 8, 947. [Google Scholar] [CrossRef]
  47. Wang, H.; Jusys, Z.; Behm, R.J. Ethanol electro-oxidation on carbon-supported Pt, PtRu and Pt3Sn catalysts: A quantitative DEMS study. J. Power Sources 2006, 154, 351–359. [Google Scholar] [CrossRef]
  48. Iwasita, T.; Pastor, E. A dems and FTir spectroscopic investigation of adsorbed ethanol on polycrystalline platinum. Electrochim. Acta 1994, 39, 531–537. [Google Scholar] [CrossRef]
  49. Antolini, E. Platinum-based ternary catalysts for low temperature fuel cells: Part II. Electrochemical properties. Appl. Catal. B 2007, 74, 337–350. [Google Scholar] [CrossRef]
  50. Mohammadi, N.; Benabid, C.; Wang, H.; Abrego-Martinez, J.C.; Wang, Y.; Mohamedi, M. Three-dimensional Pt catalyst on TiO2 structures: Synthesis, characterization, and optimal morphology for efficient ethanol electro-oxidation in acidic medium. Electrochem. Sci. Adv. 2021, 1, e2000020. [Google Scholar]
  51. Ashfold, M.N.; Claeyssens, F.; Fuge, G.M.; Henley, S.J. Pulsed laser ablation and deposition of thin films. Chem. Soc. Rev. 2004, 33, 23–31. [Google Scholar] [CrossRef] [PubMed] [Green Version]
  52. Eason, R. Pulsed Laser Deposition of Thin Films: Applications-led Growth of Functional Materials; John Wiley & Sons: Hoboken, NJ, USA, 2007. [Google Scholar]
  53. Hamoudi, Z.; El Khakani, M.A.; Mohamedi, M. Binderless Nanothin Catalyst Layers for Next Generation of Micro-Fuel Cells: Concept, Fabrication, Results and Prospective. J. Electrochem. Soc. 2012, 159, B331–B339. [Google Scholar] [CrossRef]
  54. Wang, Y.; Tabet-Aoul, A.; Mohamedi, M. Room Temperature Synthesis of Mixed Platinum and Tin Oxide Nanocomposite Catalyst with Enhanced Mass Activity and Durability for Ethanol Electrooxidation in an Acidic Medium. J. Electrochem. Soc. 2016, 163, F1272–F1278. [Google Scholar] [CrossRef]
Figure 1. SEM images at different magnifications of hydrothermally-grown TiO2 on Ti mesh. Inset at the top left figure is a photograph of TiO2/Ti mesh.
Molecules 27 01921 g001
Figure 2. XRD analysis of TiO2 grown on Ti mesh via the hydrothermal method.
Molecules 27 01921 g002
Figure 3. XPS analyses of TiO2/Ti mesh. (a) Survey scan, (b) high-resolution XPS spectrum of Ti 2p core level and (c) high-resolution XPS spectrum O 1s core level.
Molecules 27 01921 g003
Figure 4. SEM micrographs at increasing magnifications of Pt grown by PLD on Ti mesh. Inset at the top left of the figure is a photograph of Pt/Ti mesh. The figure on the right side is the XRD analysis of Pt/Ti mesh. (*) Corresponds to the TiO2 substrate.
Molecules 27 01921 g004
Figure 5. SEM micrographs at increasing magnifications of Pt grown by PLD on a TiO2/Ti mesh structure. Inset at the top left of the figure is a photograph of Pt/TiO2/Ti mesh.
Molecules 27 01921 g005
Figure 6. XRD analysis of Pt grown on TiO2/Ti mesh. (*) Corresponds to the TiO2 substrate.
Molecules 27 01921 g006
Figure 7. High-resolution XPS spectra of Pt 4f core level and O 1s core level. (a,c) Pt/Ti mesh. (b,d) Pt/TiO2/Ti mesh.
Molecules 27 01921 g007
Figure 8. Electrochemical studies (a) Cyclic voltammetry in 0.5 M H2SO4-argon purged solution with a potential scan rate of 50 mV s−1. (b) Linear scan voltammetry in 0.5 M H2SO4 + 1 M C2H5OH solution with a potential scan rate of 5 mV s−1. (c) Chronoamperometry in 0.5 M H2SO4 + 1 M C2H5OH solution.
Molecules 27 01921 g008
Table 1. XRD characteristics of the Ti mesh, TiO2/Ti mesh, Pt/Ti mesh and Pt/TiO2/Ti mesh.
Ti MeshTiO2/Ti MeshPt/Ti MeshPt/TiO2
TiTiTiPtTiPt
Latticea = 2.953a = 2.957a = 2.951a = 3.924a = 2.960a = 2.953
constant (Å)c = 4.687c = 4.599c = 4.682 c = 4.598c = 4.687
L (Å)607.1581.7551.8932.3414.6685.5
Table 2. XPS fitting parameters from the core-level spectra of Pt 4f and O 1s.
SamplePt0Pt2+Pt4+ O 1s
BE (eV)at%BE (eV)at%BE (eV)at%Pt2/Pt4+OIOII
Pt/Ti mesh71.3387.7372.637.0173.135.251.34530.64 (70.5)532.71 (29.5)
Pt/TiO271.7875.9071.3713.1573.2010.951.20532.50 (50)533.75 (50.0)
Note: Numbers between brackets are species surface percentage.
Table 3. Comparative main electrochemical performance parameters.
EORDurability
Eonset
(V)
Ep
(V)
Ip
(mA)
I@0.5 V
(mA)
Iss
(mA)
Pt/Ti mesh0.260.670.530.270.32
Pt/TiO2/Ti mesh0.300.651.851.192.1
Publisher’s Note: MDPI stays neutral with regard to jurisdictional claims in published maps and institutional affiliations.

