Abstract
This study was performed to extract and separate the volatiles with solid-phase microextraction (SPME), and was conducted to analyze volatile odor compounds qualitatively and quantitatively in the production of a strong aroma tallow by mild oxidation. A total of 51 odor compounds were detected in the tallow smelted under different conditions. It was found that the high proportion of aldehydes was an important feature of the aroma components in the oxidized melted tallow, such as 1-hexanal, heptanal, nonanal, octanal, benzaldehyde, etc. Through the determination of various indicators, sensory evaluation, and the gas chromatography-olfaction–mass spectrometry (GC-O–MS) analysis and, in combination with response surface methodology, the optimal process parameters for oxidative smelting of tallow were determined as follows: a reaction temperature of 149.61 °C, a reaction time of 31.68 min, and an airflow rate of 97.44 L/h. The accelerated oxidation test further verified the quality of the oxidized tallow.
1. Introduction
Tallow is a form of rendered fat and is classically made from beef. When the slaughtered cattle are raised to the slaughter condition, a large amount of adipose tissue will be accumulated under the epidermis, between muscles, in the abdominal cavity, intestinal region, and other parts, and the tallow adipose tissue obtained by segmentation is refined by using an appropriate processing method to obtain edible grease, which is called tallow [1].
Tallow is widely used in food processing because of its good flavor and is often used as the processing raw material of shortening, cakes, and other foods [2]. As the soul of the Sichuan and Chongqing hotpot, tallow played an important role in the formation of the hotpot flavor, both in its own flavor and the flavor changes produced during the cooking process [3]. According to the previous analysis of the aroma of 41 old hot pot tallow, it was found that the strong aroma tallow was particularly popular. Therefore, in this experiment, the strong aroma tallow was prepared through the mild oxidation of fat to meet the needs of consumers [4].
Lipid oxidation is an important pathway for the formation of characteristic meat flavor compounds. The research by Pearson et al. [5] has shown that the basic meat flavors of all kinds of meat flavors are the same, while the differences in characteristic meat flavors mainly come from the thermal oxidation degradation reaction of fat, in which heating-induced oxidation of unsaturated hydrocarbon chains in lipids is an important pathway and generates a variety of volatile compounds, including fatty aldehydes, ketones, and acids. Oxidation of fat at a normal temperature will produce a rancid taste, while oxidation under heating conditions will produce characteristic flavor substances, which are the main basis for adding fat and regulating fat oxidation in the production process of meat flavor essence. Therefore, in order to obtain the oxidized fat rich in volatile compound components, air heating can be used to regulate fat oxidation. The thermal reaction meat flavor product prepared by adding oxidized fat has the advantages of strong aroma, prominent characteristic flavor, etc. [6]. Due to the complexity of lipid oxidation and the uncertainty of factors, as well as the limitation of analytical methods, the research progress on the regulation of the preparation of flavor precursors from oxidized fat is relatively slow, but some research results have been achieved.
The research on the regulation of fat on oxidation is not systematic and it has only been reported in the early patents. For example, Aishima and Nobuhara [7] treated tallow with air heating under conditions of 150–170 °C, and then mixed and heated the obtained oxidized tallow with fermented soy sauce to prepare the roast beef essence. Haring [8] controlled the triglyceride oxidation process by altering the moisture and metal ions in the system and prepared the flavor concentrate by mild oxidation. Haring [9] prepared milk flavor by mildly oxidizing milk fat to increase the content of 3-methylbutanal and 2-nonenal. There were many studies on the regulated oxidation of fats in China. In general, there were mainly two oxidation methods: high-temperature heating-controlled oxidation and enzymatic mild oxidation. There were differences in the fragrance of the products obtained from the thermal reaction of these two kinds of oxidized fats, with the former being the “barbecue” flavor, and the latter being the “stewed” flavor [10]. For example, Li [11] oxidized tallow at 160–170 °C for 40 min and then thermally reacted with fermented soy sauce and cysteine to produce beef essence. Xiao and Sun [12] explored the regulation of tallow oxidation by response surface methodology and determined the optimal process conditions as follows: a reaction temperature of 158.2 °C, a reaction time of 5.28 h, an airflow rate of 1.49 L/min, and an antioxidant VE addition of 0.15%. Ouyang et al. [13] subjected the fat to an air oxidation treatment to obtain a peroxide value of 8–10 meq/kg and then added the peroxide value into a thermal reaction system to prepare the fat essence. Sun et al. [14] studied the regulation of tallow oxidation through single factor experiment and orthogonal test and concluded that the optimal process conditions were as follows: a reaction time of 3 h at 140 °C, an airflow rate of 0.018–0.035 m3/h 100 g fat, and an added antioxidant VE of 0.01%. Yang [15] took vegetable oil (sunflower oil) and animal oil (chicken fat) as raw materials, and prepared the Qing Xiang flavoring agent and meat precursor after catalytic oxidation with lipoxygenase. Zhong et al. [16] used lipoxygenase to catalyze the oxidation of chicken fat. By measuring the peroxidation value of chicken fat and examining the effects of time, substrate (chicken fat) concentration, buffer pH value, and concentration on the oxidation of chicken fat, they finally determined the optimal oxidation process parameters. Yan and Tang [17] treated chicken fat with Novozyme lipase and added it into the Maillard reaction system to prepare chicken essence.
At present, research on the process of beef tallow flavoring is still relatively scarce. The butter used in the Sichuan and Chongqing hotpot is mainly refined butter. After deacidification, decoloration, deodorization, refining, and other production processes, the crude butter has a clear color and mellow flavor. It contains a variety of volatile flavor components, such as aldehydes, alcohols, ketones, and other compounds. These substances continue to react with protein and amino acids in tallow to produce a certain special odor, and form the unique volatile flavor of tallow [18]. The unique flavor of tallow mainly comes from aldehydes, alcohols, esters, ketones, and so on, and the formation process of flavor substances is complicated and is influenced by many conditions. In order to produce strong-flavor beef tallow, a combination of mild oxidation technology was used to obtain a beef tallow product with a stronger aroma than common beef tallow so as to optimize its flavor. Some lipid oxidative degradation and a Maillard reaction will occur in the oxygen evolution process, which will change the type and content of volatile compounds to a certain extent and cause flavor changes [19].
In view of the above background, solid-phase microextraction (SPME) was mainly used to extract and separate the volatiles in this study and then the gas chromatography-olfaction–mass spectrometry (GC-O–MS) technology was used to qualitatively and quantitatively analyze the aroma active compounds. The changes in aroma compounds in the oxidation of beef tallow were studied. Combined with sensory evaluation, the optimal conditions were determined, which provided a scientific basis for exploring the development and utilization of Nongxiang tallow hot pot seasoning, quality control, and use safety.
2. Results and Discussion
2.1. Effects of Different Factors on AV, PV, and P-AV of Oxidized Melted Tallow
When the temperature is 150 °C, the time is 35 min, and the airflow rate is 108 L/h (Figure 1, Figure 2 and Figure 3), the hydroperoxide, the primary oxidation product of tallow, reaches the maximum value. When it exceeds this value, the tallow oxidation is already in the termination stage. It can be seen in the figure that the PV and P-AV values change significantly beyond a specific node, so it is speculated that the oxidation induction period should be less than 35 min and the reaction is already in the oxidation transfer period; that is, the generation of hydroperoxide in the primary oxidation reaction and the pyrolysis of hydroperoxide in the secondary oxidation reaction are both increasing significantly, but the primary oxidation reaction is the main reaction, so both PV and p-AV values increase. At 150 °C, the primary oxidation product of tallow hydroperoxide reached the maximum value. When the temperature exceeds 150 °C, the oxidation of tallow was in the end stage and the generation of secondary oxidation products, namely the pyrolysis reaction of hydroperoxide, became the leading reaction and the generation of primary oxidation products took a back seat, so the PV value began to decline while the P-AV value increased significantly. From the aspect of the reaction mechanism, the higher the melting temperature and oxygen supply, the lower the AV value. It reached the lowest point at 150 °C and 108 L/h, which may be due to the oxidation of unsaturated fatty acid to generate hydroperoxide. Considering the influence of oxidation temperature on the PV, P-AV, and AV value, the oxidation melting of tallow at 150 °C for 35 min and an airflow rate of 108 L/h was selected.
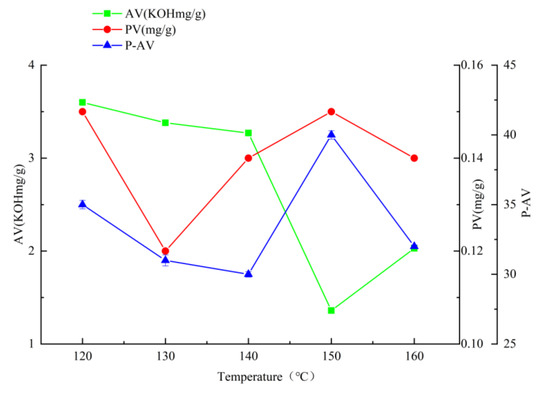
Figure 1.
The effect of reaction temperature on AV, PV, and P-AV.
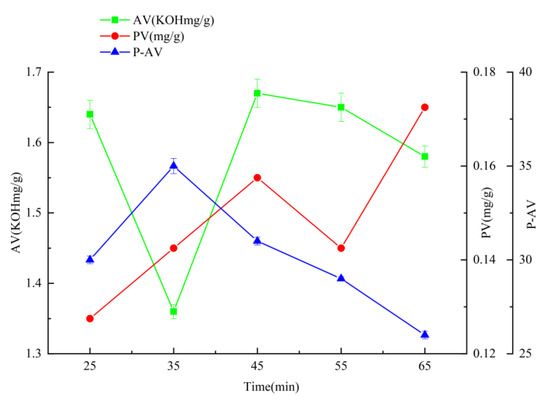
Figure 2.
The effect of reaction time on AV, PV, and P-AV.
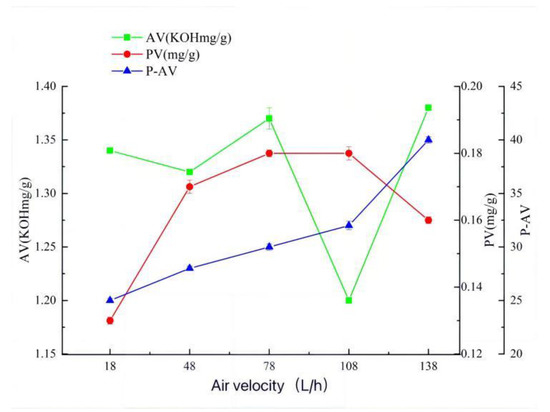
Figure 3.
The effect of air velocity on AV, PV, and P-AV.
2.2. Sensory Evaluation of the Sample
The weighted scores of each flavor type of melted tallow were different under different conditions (Table 1). Under reaction temperature conditions, the weighted total score was a maximum of 2.54 at 150 °C and a minimum of 2.14 at 120 °C. The milk flavor, sweet taste, and fruit flavor were the most intense at 150 °C, while each flavor type was relatively weak at 120 °C. In addition, the animal fat at 140 °C and 160 °C had a thick taste but, at the same time, the acid odor also increased. Under the reaction time conditions, the weighted total score for 35 min was the highest at 3.29, and the weighted score for 65 min was the lowest at 1.83. Milk flavor, animal fat flavor, and sweet taste were the most prominent at 25 min and 35 min, while each flavor type was relatively weak at 65 min. Under the airflow rate condition, the weighted total score of 108 L/h was the highest at 3.12 and the weighted total score of 138 L/h was the lowest at 1.83, of which the “shan” flavor and sweet taste at 108 L/h were higher than those under other flow rate conditions, while each flavor type at 138 L/h was relatively weak.

Table 1.
Sensory score results of oxidized melted tallow under different conditions.
2.3. SPME-GC–MS Analysis Results of Oxidized Melted Tallow under Different Conditions
SPME-GC–MS was used for qualitative and quantitative analysis of compounds with aroma characteristics. A total of 51 aroma compounds were detected in tallow melted under different conditions (Table 2, Table 3 and Table 4). Among them, twenty-nine aroma compounds, including fifteen aldehydes, four alcohols, four acids, three esters, and three heterocyclic compounds were detected in tallow melting at different reaction temperatures. A total of thirty-nine aroma compounds were detected in melted tallow at different reaction times, including seventeen aldehydes, six acids, six ketones, five esters, two alcohols, and three heterocyclic compounds. A total of twenty-nine aroma compounds, including fourteen aldehydes, eight acids, three alcohols, three esters, and one other compound were detected in tallow melting at different air flow rates.
Table 2.
SPME-GC-O–MS results of oxidized melted tallow at different temperatures.
Table 3.
SPME-GC-O–MS results of oxidized melted tallow at different times.
Table 4.
SPME-GC-O–MS results of oxidized melted tallow at different airflow rates.
- (1)
- Qualitative results
The aromatic compounds in the melted tallow were different under different conditions. The compounds 1-pentanal (almond), 1-hexanal (green, grassy), 1-heptanal (fatty), 1-octanal (fatty), (E)-2-heptenal (fatty), (E)-2-decenal (fatty), 1-nonanal (fresh), (E)-2-nonenal (cucumber), (E)-2-octenal (cucumber), (E,E)-2,4-decadienal (fried), 1-pentanol (spicy), 1-octen-3-ol (mushroom), benzaldehyde (nutty), 2-undecenal (orange peel), acetic acid (sour), octanoic acid (rot), and decanoic acid (putrid) are all contained in the melted tallow under different conditions, which are the basic components of the fragrance of oxidized melted tallow. Differences in other components led to differences in the aroma of oxidized melted tallow under different conditions.
- (2)
- Quantitative results
A heat map was drawn according to the content of aroma compounds in the oxidized melted tallow under different conditions, as shown in Figure 4. In the figure, blue represents content below the average level, red represents content above the average level, and red also indicates higher content.
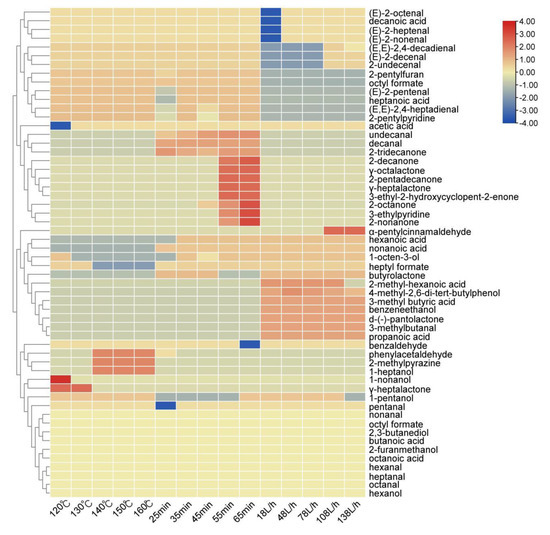
Figure 4.
A content thermogram of aroma compounds in oxidized melted tallow under different conditions.
It could be seen that the overall content of aldehydes at 120 °C was higher than other temperatures in the reaction temperature, especially 1-hexanal (green, grassy), 1-nonanal (fatty), 1-octanal (fatty), (E)-2-nonenal (cucumber), (E)-2-decenal (fatty) and 2-undecenal (orange peel). The 1-heptanal (fatty), benzaldehyde (nutty), and 2-methylpyrazine (nutty) at 150 °C were more prominent. However, according to the sensory evaluation and determination of the oxidation index, it was found that although the overall substance content was high at 120 °C, the flavor was not very popular, largely because the temperature did not reach the melting point during the melting process, resulting in a slight fishy and greasy taste of the overall flavor and, thus, the aldehyde content was higher than that of samples at other temperatures.
The overall content of aldehydes was the highest in the reaction time of 65 min, especially 1-nonanal (fresh), (E)-2-nonenal (cucumber), (E)-2-decenal (fatty), 2-undecenal (orange peel), and (E,E)-2,4-decadienal (fried). In addition, it also contains high acid substances, such as acetic acid (vinegar), octanoic acid (putrid), nonanoic acid (waxy), etc. At the same time, it added many ketone substances, such as 2-octanone (earthy), 2-nonone (refreshing), 2-decanone (orange peel), etc. However, according to the sensory evaluation and determination of the oxidation index, it was found that although the overall substance content of beef tallow under 65 min was higher than that of samples under other conditions, the long reaction time further oxidized and degraded the fat and produced more small molecule aldehydes, ketones, and acid compounds, thus showing serious sour and rancid odor.
The total substance content of 108 L/h in the airflow rate was relatively high, especially 1-hexanal (green, grassy), 1-heptanal (fatty), 1-octanal (fatty), 1-nonanal (fresh), (E)-2-decenal (fatty), (E,E)-2,4-decadienal (fried), 2-undecenal (orange peel), α-pentyl cinnamic aldehyde (floral), etc. According to the sensory evaluation and determination of the oxidation index, it was found that the overall substance content of the 108 L/h melted tallow was not too high and it had the characteristic flavor of tallow, such as fat aroma.
2.4. Composition Characteristics of Aroma Compounds in Oxidized Melted Tallow under Different Conditions
By calculating the proportion of various aroma compounds in the melted tallow under different conditions (Table 5), it was found that the high proportion of aldehydes was an important feature of the aroma components in the oxidized melted tallow. The reaction temperature was kept within the range of 140–160 °C, the reaction time was within the range of 25–45 min, and the airflow rate was within the range of 78–138 L/h. The proportion of aldehydes was the highest, with an average of 53.46%.
Table 5.
The proportion of aroma compounds in oxidized melted tallow under different conditions.
2.5. Principal Component Analysis
In order to further clarify the aroma characteristics of oxidized melted tallow under different conditions, principal component analysis was performed on 15 levels of oxidized melted tallow with different factors according to the compositions and contents of different aroma compounds, as shown in Figure 5. It could be seen from the figure that the samples of 15 levels of oxidation-smelting tallow with different factors were relatively concentrated and could be divided into three types after dimension reduction treatment with a principal component.
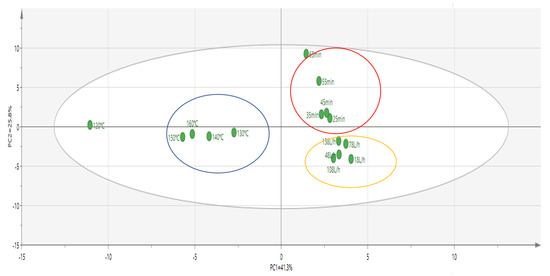
Figure 5.
A SPME−GC−MS analysis of different factors of oxidized melted tallow samples, and principal component analysis of aroma compound proportion.
Type I was oxidized melted tallow samples at different temperatures, which mainly contained five kinds of samples at 120 °C, 130 °C, 140 °C, 150 °C, and 160 °C. The content of 1-pentanal (almond), 1-hexanal (green, grassy), (E)-2-pentenal (fruity), 1-heptanal (fatty), 1-octanal (fatty), (E)-2-heptenal (fatty), 1-nonanal (fresh), (E)-2-octenal (cucumber), (E)-2-nonenal (cucumber), (E)-2-decenal (fatty), 2-undecenal (orange peel), and (E,E)-2,4-decadienal (fried) compounds were relatively high, and the characteristic odor of these compounds affected the overall odor of the five samples. The interaction between each odor caused each sample in Type I to, overall, present strong fruity and animal fat notes.
Type II samples mainly included 25 min, 35 min, 45 min, 55 min, and 65 min. The content of 1-pentanal (almond), (E)-2-decenal (fatty), (E)-2-heptenal (fatty), benzaldehyde (nutty), (E,E)-2,4-heptadienal (fatty), (E,E)-2,4-decadienal (fried), 1-octanal (fatty), 1-hexanal (green, grassy), (E)-2-pentenal (fresh), 1-heptanal (fatty), 2-tridecanone (creamy), 2-pentadecanone (floral), 2-octanone (fresh), 2-nonone (fresh), 2-decanone (orange peel), and 3-ethyl-cyclopentane-1,2-dione (caramel) were relatively high, and the characteristic odor of aldehyde and ketone compounds affected the overall odor of these five samples, it made the overall odor profiles of each sample in Type II show the odor of animal fat, muttony and sweet.
Type III mainly consisted of five samples at 18 L/h, 48 L/h, 78 L/h, 108 L/h, and 138 L/h. Compounds 3-methylbutyraldehyde (fresh), 1-pentanal (almond), 1-hexanal (green, grassy), (E)-2-pentenal (fruity), 1-heptanal (fatty), 1-octanal (fatty), (E)-2-nonenal (fatty), 1-nonanal (fresh), (E)-2-octenal (cucumber), (E)-2-nonenal (cucumber), (E)-2-decenal (fatty), α-pentylcinnamic aldehyde (floral), 3-methylbutyric acid (sweaty), 2- methylpropionic acid (fruity), hexanoic acid (cheese), and 2,6-ditertbutyl-4-methylphenol (camphor) and other compounds were relatively high. In addition, the characteristic odor of aldehyde and acid compounds affected the overall odor of the five samples, making each sample in Type III present a strong sweet and char flavor.
The proportion of aromatic compounds was analyzed by principal component analysis (PCA) based on the different factors of oxidized melted tallow sample by SPME-GC–MS. It was found that the principal components had significant differences among the different factors, but there was no significant difference at each level. Finally, according to the comprehensive evaluation of the oxidation index and sensory evaluation, the optimal reaction temperature was determined to be within the range of 140–160 °C, the reaction time was within the range of 25–45 min, and the airflow rate was within the range of 78–138 L/h.
2.6. Response Surface Optimization
Based on the single-factor test, three factors, including reaction temperature, reaction time, and airflow rate, were selected to design the response surface test. The factor-level table is shown in Table 6 and the response surface analysis scheme and results are shown in Table 7. The results were analyzed by Design-Expert data software and the response surface diagrams for the obtained data were shown in Figure 6, Figure 7 and Figure 8.
Table 6.
Factors and levels of the response surface analysis.
Table 7.
Variance analysis of the response surface quadratic model.
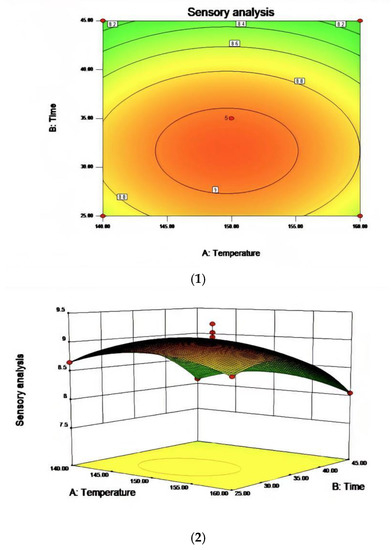
Figure 6.
The effect of the interaction between reaction temperature and reaction time on sensory evaluation (1) and a contour map of the reaction temperature and reaction time (2).
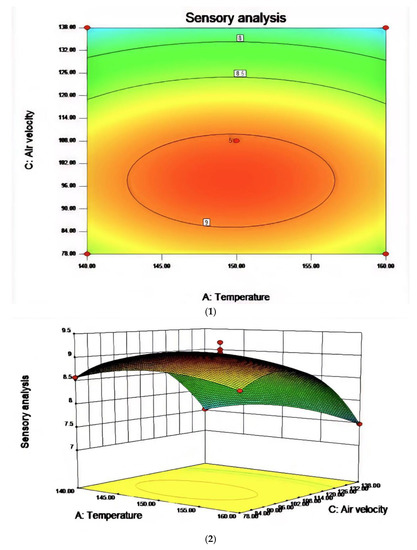
Figure 7.
The effect of the interaction between reaction temperature and air velocity on sensory evaluation (1) and the contour map of reaction temperature and air velocity (2).
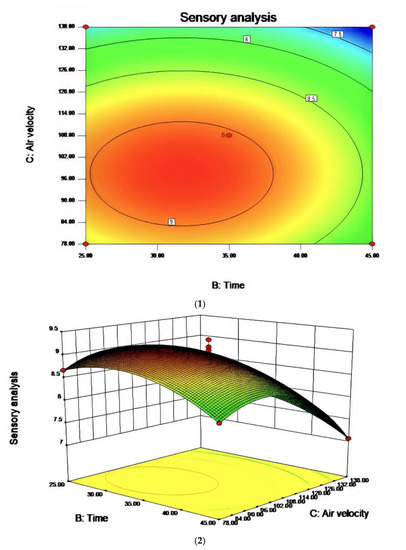
Figure 8.
The effect of the interaction between reaction time and air velocity on sensory evaluation (1) and the contour map of reaction time and air velocity (2).
The significance test and analysis of variance for the regression equation are shown in Table 5. The significance for regression analysis of variance indicates that the regression is extremely significant, p = 0.0001, and non-significant, p = 1.0000, for the missing term, with R2 = 0.9726 and R2Adj = 0.9374. The model indicates that the equation fits the experiment well. When describing the relationship between each factor and response value, the linear relationship between the dependent variable and the independent variable is significant for the regression equation.
In the process of studying the influence of related variables on the processing results, in order to further study the interaction between variables, the quadratic regression model was analyzed by software and the response surface stereogram was drawn. The response surface isochronal diagram could intuitively reflect the effects of various factors on the response value to identify the optimal process parameters and the interaction between the parameters. The stereogram of the response surface showed that the fitting surface had the true minimum value. The center point of the smallest ellipse in the contour map was the lowest point of the response surface. The shape of the contour line could reflect the strength of the interaction effect. The ellipse indicated that the interaction between the two factors was significant, while the circle indicated the opposite. Figure 6, Figure 7 and Figure 8 show the effect of temperature, time, and airflow rate on sensory evaluation, and the contour plot shows that the influence of factors on sensory evaluation is significant.
After regression fitting of each factor, the regression equation was obtained as follows:
R1 = 9.03 − 0.020A − 0.28B − 0.53C + 0.000AB + 0.000AC + 0.000BC + 3.81BD − 0.26A2 − 0.42B2 − 0.75C2. The RSM analysis system showed that the optimal conditions for oxidative melting of tallow were a reaction temperature of 149.61 °C, a reaction time of 31.68 min, and an airflow rate of 97.44 L/h.
2.7. Accelerated Oxidation Test
After the determination of various oxidation indexes, sensory evaluation, and SPME-GC-O–MS analysis, the optimized oxidized melted tallow was subjected to an accelerated oxidation test, so as to ensure that various indexes of the produced oxidized tallow reached the standards.
The determination of each index in the accelerated oxidation test of oxidized melted tallow is shown in Figure 9. After being placed in an oven at 62 ± 1 °C for 15 d (the equivalent of 15 months), the AV value exceeded the standard after 13 d, and all indicators were qualified but not exceeding the standard before 12 d [19]. In addition, according to the analysis results of SPME-GC–MS, as shown in the Table 8, there was no significant difference in all substances of oxidized melted tallow in 0–15 d, such as the contents of acid compounds such as propionic acid, butanoic acid, octanoic acid, and decanoic acid, to confirm the quality of oxidized melted tallow.
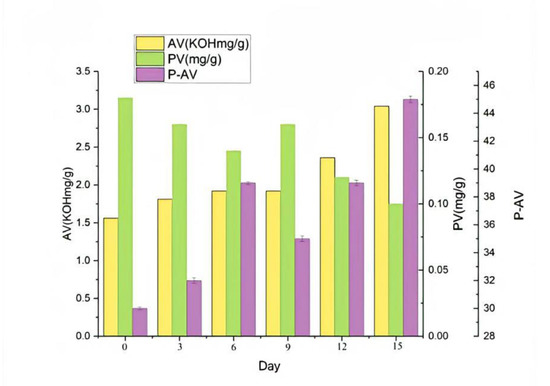
Figure 9.
The test index chart of accelerated oxidation of oxidized tallow.
Table 8.
SPME-GC-O–MS results of accelerated oxidation test of melted tallow.
3. Materials and Methods
3.1. Samples and Chemicals
Samples were provided by China Sichuan Guanghan Maidele Food Co., Ltd.
Raw tallow (200 g) was minced in a meat grinder, placed in a three-necked round-bottom flask, and placed in a 150 °C oil bath in which air was introduced at a rate of 108 L/h. The stirring speed was 200 r/min. The samples were smelled at 25 min, 35 min, 45 min, 55 min, and 65 min, respectively.
Ethyl ether, n-hexane, and anhydrous sodium sulfate, all having purities >99%, were purchased from the Lab Gou e-mall (Beijing, China). The compounds 2,4,5-Trimethylthiazole and n-alkanes (C7–C30) were provided by Sigma-Aldrich (St. Louis, MO, USA.). Air (99.999% purity) was obtained from Beijing Shuangquan lucky chance Industrial Gas Co., Ltd. and the liquid nitrogen was obtained from Xian Heyu Trading Co., Ltd. (Beijing, China).
3.2. Determination of Acid Value
The acid value of the sample was determined according to the GB 5009.229-2016 National Food Safety Standard [20].
3.3. Determination of Peroxide Value
The peroxide value of samples was determined according to the GB 5009.227-2016 National Food Safety Standard [21].
3.4. Determination of Anisidine Value
The anisidine value of samples was determined according to the GB/T 24304-2009 determination of the anisidine value of animal and vegetable fats and oils [22].
3.5. Analysis of Volatile Compounds
3.5.1. Gas Chromatography-Olfactometry–Mass Spectrometry (GC-O–MS) Analysis
A GC–MS (7890A-7000, Agilent Technologies Inc., Santa Clara, CA, USA) instrument combined with an olfactory detection port (ODP4, Gerstel, Germany) was used to identify volatile odor compounds. Separation of odor-active substances in samples was performed on a polar DB-WAX capillary column (30 mm × 0.32 mm, 0.25 µm film thickness; J & W Scientific, Folsom, CA, USA). The gas chromatographic instrument condition includes an initial column temperature setting of 40 °C, holding for 3 min, followed by an increase in temperature up to 230 °C at 4 °C/min and holding for 3 min. Ultra-pure helium (99.999%, Beijing AP BAIF Gas Industry Co., Ltd., Beijing, China) was used as the carrier gas. The electron impact mass spectra were generated at an ionization energy of 70 eV with an m/z scan range of 25–370 amu. The temperatures of the mass spectrometer source and quadrupole were programmed at 230 °C and 150 °C, respectively. Moisture gas was delivered to the olfactory detection port through a blank capillary column.
3.5.2. SPME-GC–MS Analysis of Volatile Compounds
The manual solid-phase microextraction technology was used to extract the volatile aroma compounds from the tallow. Five grams of the tallow sample and 1 μL of 2,4,5-Trimethylthiazole (concentration of 1.013 μg/μL, dissolved in n-hexane) were added into a 20 mL empty bottle as internal standard, mixed, and sealed. The sample was put in a constant-temperature water bath for 30 min, the temperature of the water bath was set at 60 °C, and the solid-phase microextraction fiber head (CAR/DVB/PDMS) was inserted for headspace adsorption for 30 min. After the adsorption, the SPME fiber was inserted into the GC inlet and desorpted at 250 °C for 5 min. Parameters of gas chromatography were as follows: the initial temperature was set at 40 °C in the heating program and the temperature was kept for 3 min. Firstly, the temperature was raised to 142 °C at 3.5 °C/min, then to 150 °C at 2 °C/min, then to 177 °C at 3.5 °C/min, and then to 200 °C at 6 °C/min. The carrier gas was helium, the constant flow rate was set at 1.2 mL/min, the temperature of the injection port was set at 250 °C, and the split ratio was set at splitless. The parameter of mass spectrometry were as follows: the ion source type was the electron bombardment, the electron energy was 70 eV, the transmission line temperature was 280 °C, the ion source temperature was maintained at 230 °C, the quadrupole temperature was set at 150 °C, the mass scanning range m/z was 40~250, and the solvent delay was 4 min.
3.5.3. Qualitative and Quantitative Methods of Volatile Aroma Compounds
The qualitative methods of compounds specifically included matching mass spectra with the NIST 08 library to identify compounds and identifying compounds by the standardized compound retention index (RI) and smell (O).
The RI value is calculated according to the peak time of the target compound and the peak time of a series of alkane standards under the same gas quality parameters, and the formula is as follows:
where ta in the formula represents the retention time of sample a and tn represents the retention time of Cn in normal paraffin standard (the retention time of sample A is between two adjacent normal paraffin Cn and Cn + 1) [23].
Combined with SPME-GC-O–MS technology, a human nose was employed as a detector to smell the odor compounds separated by chromatographic column at the same time, and the odor description was recorded and compared with the RI value, and odor characteristics reported in the literature.
3.5.4. Qualitative Analysis
All the standards used in this study were diluted with n-hexane to a certain concentration. In this study, an internal standard was added to semi-quantitate the aroma compounds in tallow and the relative concentrations of all volatile organic compounds were calculated using 2,4,5-trimethylthiazole as an internal standard. The concentration of each compound was calculated using the following formula:
where Ci is the concentration of the compound, Cis is the internal standard concentration of 1.013 μg/μL, Aj is the chromatographic peak area of the compound, and Ais is the chromatographic peak area of the internal standard.
3.6. Sensory Analysis
Sensory evaluation of oxidized melted tallow under different conditions, Samples of 7.5 g were weighted into an empty vial, put in a 60 °C water bath, and the smell after melting was evaluated. The sensory evaluation team is composed of 13 laboratory professionals. Sensory evaluation is conducted on eight aroma types, such as milky, muttony, animal fat, sweet, burnt, sour, fruit, and spoiled. The scores are from light to strong, with no smell at all being 0, a slight smell but not lasting being 1–2, and a strong smell being 3–4. The eight aroma types were weighted (Table 9), and the weighted total score of the sensory evaluation of each sample was calculated.
Table 9.
The weighted score of each flavor type.
3.7. Accelerated Oxidation Analysis of Oil
This study used an oven heating accelerated oxidation test (the Schaal oven test). Different oil samples were placed in a colorless cover and put in a thermostat at 62 ± 1 °C for continuous heating and oxidation for 30 days and treated every 12 h [24].
Shook them and changed their positions in the thermostat at will. The acid value (AV), peroxide value (PV), and anisidine value (P-AV) were measured at 0, 3, 6, 9, 12, and 15 days after oxidation in order to understand the formation kinetics of oxidation products of the above-mentioned oils and fats.
3.8. Statistical Analysis
The obtained data were analyzed by one-way ANOVA with SPSS 13.0 (SPSS Inc, Chicago, IL, USA) software and p < 0.05 was significant. All data are expressed as mean standard deviation (SD, n = 3). Response surface optimization was analyzed by Design-Expert 8.0.6. PCA analysis was made by SIMCA-P + 11 software.
4. Conclusions
In this study, a qualitative and quantitative analysis of compounds with aroma characteristics was performed using SPME-GC–MS. A total of 51 aroma compounds were detected in melted tallow under different conditions. Through the determination of various indicators, sensory evaluation, and SPME-GC-O–MS analysis, the single factor range of the oxidation conditions of melted tallow was determined to be a reaction temperature within the range of 140–160 °C and a reaction time within the range of 25 min–45 min. The airflow rate was within the range of 78–138 L/h. The response surface methodology was used to determine the optimal process parameters for oxidative melting of tallow as follows: a reaction temperature of 149.61 °C, a reaction time of 31.68 min, and an airflow rate of 97.44 L/h. The accelerated oxidation test further verified the quality of oxidized tallow. In addition, because the aroma of oxidized beef tallow was complex and its flavor was unique, it was necessary to carry out the research on frying beef tallow condiments on this basis to further determine the flavor analysis of strong flavor beef tallow and the flavor performance during the actual application of beef tallow condiments. These studies would be conducive to the comprehensive analysis of the aroma characteristics and taste of a beef tallow hot pot.
Author Contributions
Y.J.: Data curation, Methodology, Writing—original draft. J.R.: Data curation, Methodology. H.S.: Supervision, Conceptualization, Methodology, Writing—review & editing. L.W.: Supervision. Q.W.: Investigation, Resources. G.M.: Investigation, Resources. Y.X.: Resources. All authors have read and agreed to the published version of the manuscript.
Funding
This study is financially supported by China SiChuan Guanghan Maidele Food Co., Ltd.
Institutional Review Board Statement
Not applicable.
Informed Consent Statement
Not applicable.
Data Availability Statement
The authors will make the raw data supporting the conclusions of this manuscript available to any qualified researcher.
Conflicts of Interest
The authors declare no conflict of interest.
References
- Feng, W.L. Study on Screening Characteristic Flavor Compounds and Quality Control of Tallow; Xihua University: Chengdu, China, 2018. [Google Scholar]
- Zhou, S.Y. Study on the production technology of refined tallow. Cereals Oils Food Sci. Technol. 2011, 19, 30–32. [Google Scholar] [CrossRef]
- Li, B.B. A preliminary Study on the Flavor and Quality Optimization of Chongqing Tallow Hot Pot Base. Southwest University. 2021. Available online: https://kns.cnki.net/KCMS/detail/detail.aspx?dbname=CMFD202201&filename=1021768174.nh (accessed on 17 January 2022).
- Qin, Y.L. Identification Preparation by Maillard Method of Key Aroma Compounds in Tallow; Jiangnan University: Wuxi, China, 2022. [Google Scholar]
- Pearson, A.M.; Wenham, L.M.; Carse, W.A.; McLeod, K.; Davey, C.L.; Kirton, A.H. Observations on the contributions of fat and lean to the aroma of cooked beef and lamb. J. Anim. Sci. 1973, 36, 511–515. [Google Scholar] [CrossRef]
- Xie, J.C.; Sun, B.G.; Zheng, F.P.; Xiao, Y.H.; Liu, J.X. Supercritical CO2 extraction of volatile flavor components in oxidized sheep fat. Food Sci. 2009, 30, 168–171. [Google Scholar]
- Aishima, T.; Nobuhara, A. Beef Flavor Substance, Process for Producing Same and Beef- Flavoring Agent. U.S. Patent 4,094,997, 13 June 1978. [Google Scholar]
- Haring, P.G.M. Process for the preparation of a flavoured foodstuff as well as a foodstuff obtainable by such a process. Eur. Pat. Appl. 1989, 298552. [Google Scholar]
- Haring, P.G.P.R. Process for the preparing a flavour concentrate. Eur. Pat. Appl. 1992, 463668. [Google Scholar]
- Zhong, Q.; Xie, J.C.; Sun, B.G.; Zheng, F.P. “Enzymatic oxidation of chicken fat-thermal reaction” to prepare chicken flavor. Food Sci. 2010, 10, 124–129. [Google Scholar] [CrossRef]
- Li, X. Experimental Report on the Synthesis of Beef Flavor by Maillard Reaction. Chin. Condiments 1993, 6, 20–22. [Google Scholar]
- Xiao, Z.B.; Sun, J. Application of response surface analysis in preparation of beef flavor precursor by controlled oxidation of beef tallow. Food Ind. 2009, 30, 22–24. [Google Scholar]
- Ouyang, J.; Wei, L.Q.; Wu, Y.Z.; Yuan, D.H. Research on the application technology of new fat flavor. China Condiments 2008, 4, 80–82. [Google Scholar]
- Sun, B.G.; Peng, Q.J.; Liang, M.L.; Xie, J.C. Study on the technology of controlled oxidation of tallow. Food Sci. 2005, 04, 133–136. [Google Scholar]
- Yang, G.M.; Xie, J.C.; Sun, B.G. Research progress in preparation of flavoring materials by enzymatic oxidation of oils and fats. Food Sci. Technol. 2006, 31, 5. [Google Scholar]
- Liu, X.Z.; Kong, Y.C.; Li, D. Research progress of fat oxidation in meat and meat products. Meat Ind. 2017, 3, 47–49. [Google Scholar]
- Yan, W.Q.; Tang, B.J. Study on the application of fat degradation and its products in Maillard reaction. Food Sci. 2006, 3, 272–274. [Google Scholar]
- Shi, X.X. Study on the Formation of Characteristic Flavor Precursors by Enzymatic Hydrolysis of Beef Tallow-Mild Heating Oxidation; Jiangnan University: Wuxi, China, 2013. [Google Scholar]
- Shi, X.; Zhang, X.; Song, S.; Tan, C.; Jia, C.; Xia, S. Identification of characteristic flavour precursors from enzymatic hydrolysis-mild thermal oxidation tallow by descriptive sensory analysis and gas chromatography–olfactometry and partial least squares regression. J. Chromatogr. B Anal. Technol. Biomed. Life Sci. 2013, 2, 69–76. [Google Scholar] [CrossRef] [PubMed]
- National Health and Family Planning Commission (NHFPC). National Food Safety Standards Determination of Acid Value in Food; GB 5009.229; NHFPC: Beijing, China, 31 August 2016. [Google Scholar]
- National Health and Family Planning Commission (NHFPC). National Food Safety Standards Determination of Peroxide Value in Food; GB 5009.227; NHFPC: Beijing, China, 31 August 2016. [Google Scholar]
- National Standardization Administration Committee, General Administration of Quality Supervision, Inspection and Quarantine. Fats and Oils Determination of Anisidine Value; GB T 24304; NHFPC: Beijing, China, 30 September 2009. [Google Scholar]
- Acree, T.; Arn, H. Flavornet and Human Odor Space. 2004. Available online: http://flavornet.org/flavornet.html (accessed on 17 January 2022).
- Cao, J. Study on Oxidation Law and Kinetics of Edible Oils with Different Fatty Acid Structures; Nanchang University: Nanchang, China, 2015. [Google Scholar]
Publisher’s Note: MDPI stays neutral with regard to jurisdictional claims in published maps and institutional affiliations. |
© 2022 by the authors. Licensee MDPI, Basel, Switzerland. This article is an open access article distributed under the terms and conditions of the Creative Commons Attribution (CC BY) license (https://creativecommons.org/licenses/by/4.0/).