Article

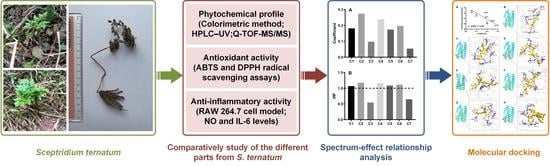
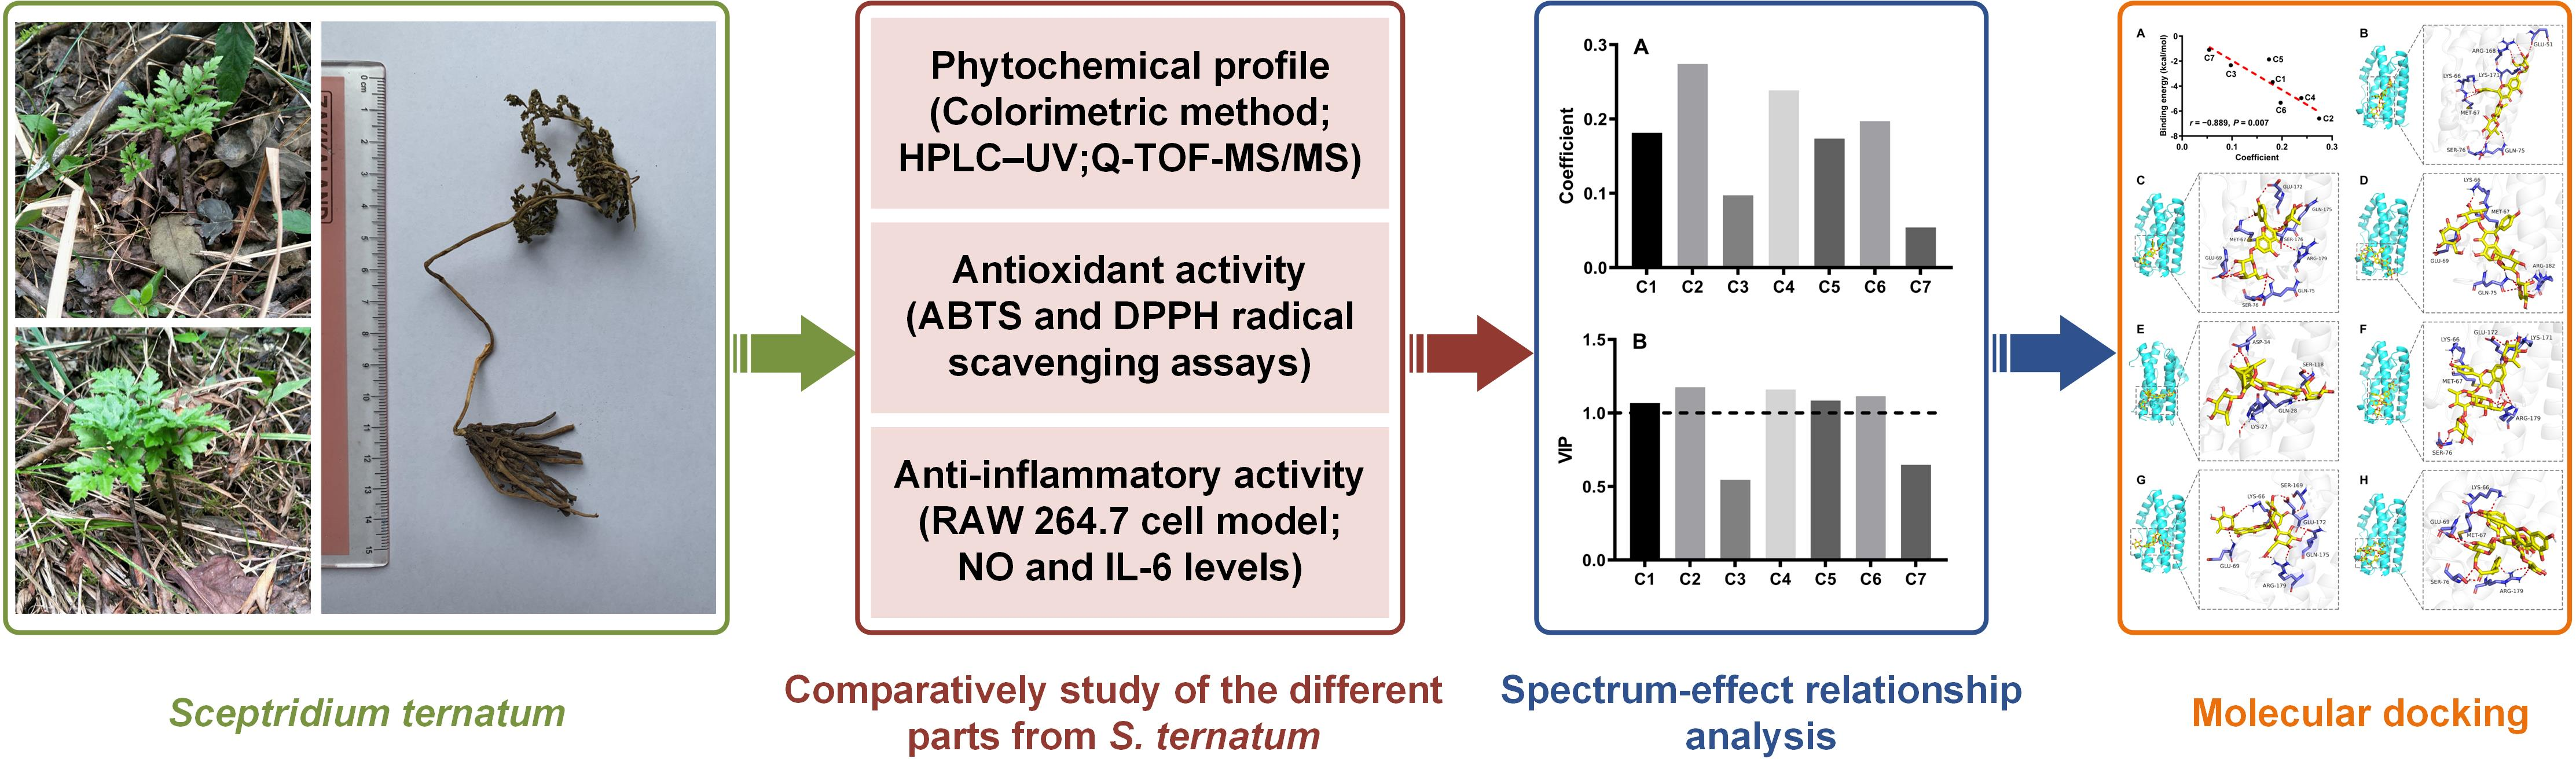
Spectrum-Effect Relationship-Based Strategy Combined with Molecular Docking to Explore Bioactive Flavonoids from Sceptridium ternatum

1
Department of Pharmacy, The Cancer Hospital of the University of Chinese Academy of Sciences (Zhejiang Cancer Hospital), Institute of Basic Medicine and Cancer (IBMC), Chinese Academy of Sciences, Hangzhou 310022, China
2
Department of Pharmacy, Affiliated Hangzhou Xixi Hospital, Zhejiang University School of Medicine, Hangzhou 310023, China
*
Authors to whom correspondence should be addressed.
Molecules 2022, 27(17), 5698; https://doi.org/10.3390/molecules27175698
Submission received: 30 July 2022 / Revised: 25 August 2022 / Accepted: 2 September 2022 / Published: 4 September 2022

Abstract

:
Sceptridium ternatum is a herbaceous plant with significant potential for pharmaceutical and cosmetic applications. In this study, we established a spectrum-effect relationship-based strategy to investigate the bioactive basis and tissue distribution in S. ternatum. First, a phytochemical analysis on the ethanol extracts from roots, stems, and leaves of S. ternatum was performed using the colorimetric method, high-performance liquid chromatography–ultraviolet (HPLC–UV), and high-performance liquid chromatography–electrospray ionization quadrupole time-of-flight mass spectrometry (HPLC–ESI-Q-TOF-MS/MS). Then, radical scavenging assays and the lipopolysaccharide-stimulated RAW 264.7 cell model were used to estimate the antioxidant and anti-inflammatory activities, respectively. Spectrum-effect relationship analysis and molecular docking were further employed to evaluate the correlation between the phytochemical profile and anti-inflammatory activity. Our results demonstrate that S. ternatum leaves contained the most abundant flavonoids and exerted the best biological activities. Their IC50 values for scavenging 2,2ʹ-azino-bis (3-ethylbenzthiazoline-6-sulfonic acid) and 1,1-diphenyl-2-picrylhydrazyl radicals were 2.43 ± 0.13 and 5.36 ± 0.54 mg/mL, respectively. In lipopolysaccharide-stimulated RAW 264.7 cells, the leaf extract caused the greatest reduction in nitric oxide production (38.15%) and interleukin-6 release (110.86%). Spectrum-effect relationship analysis and molecular docking indicated that quercetin 3-O-rhamnoside-7-O-glucoside possessed high anti-inflammatory activity by binding with interleukin-6. In conclusion, S. ternatum is a rich source of bioactive flavonoids with potential for exploitation in the prevention and treatment of oxidative stress and inflammation-related pathologies.

Graphical Abstract

1. Introduction

Flavonoids are a large group of naturally occurring polyphenolic compounds that typically contain a C6-C3-C6 skeleton structure [1]. These phytochemicals are broadly distributed in fruits, vegetables, herbs, and many other plants [2,3]. Studies have shown that the pharmacological properties of flavonoids include antioxidant, anti-inflammatory, antitumor, antiviral, neuroprotective, and cardioprotective activities [4,5,6]. In recent decades, natural products containing abundant flavonoids, such as Matricaria chamomilla L., have been widely utilized in the pharmaceutical and cosmetic industries because of their excellent biological benefits [7,8]. Therefore, bioactive flavonoids derived from natural sources are of particular interest.
Sceptridium ternatum (Thunb.) Lyon, also known as Botrychium ternatum (Thunb.) Sw. or Osmunda ternata Thunb., is a perennial herbaceous plant that is primarily distributed in eastern Asia, such as Japan, the Korean Peninsula, and China [9,10]. As a folk medicine in these areas, the whole S. ternatum herb is commonly used to treat asthma, cough, and fever [10]. The antiasthmatic mechanism of S. ternatum has been attributed to the elevated Th1/Th2 ratio and reduced cysteinyl leukotriene receptor-1 expression [11,12]. S. ternatum can also relieve pulmonary arterial hypertension by inhibiting NF-κB p65 and α-smooth muscle actin [13]. Additionally, S. ternatum has gained increasing attention because of its vast potential in the cosmetic field. For example, an external skin composition containing S. ternatum extract has been used for whitening, anti-aging, and moisturizing purposes [14]. In a 2,4-dinitrochlorobenzene-induced mouse model, S. ternatum attenuated allergic contact dermatitis-like skin lesions, which suggested that S. ternatum is a promising treatment option for skin inflammation [15]. Our previous study reported that S. ternatum is a rich source of flavonoids and shows an obvious antioxidant capacity [16]. However, studies related to the bioactive basis and underlying mechanisms of its anti-inflammatory activity are still scarce, and the tissue distribution of bioactive flavonoids in S. ternatum remains unknown.
Spectrum-effect relationship analysis integrates chemical profiles and pharmacological activities to identify the major active constituents in complex samples. This method has been successfully applied to reveal the material basis of traditional Chinese medicines. By correlating high-performance liquid chromatography (HPLC) chromatograms with cell inhibitory activities, Liu et al. [17] found that three compounds in Scheflera heptaphylla were positively correlated with the anti-hepatoma effect. Zhou et al. [18] found that ginsenoside Ro is responsible for the antiproliferative activity of Panax ginseng. Since S. ternatum contains dozens of flavonoids, and none of them have commercially available standards, spectrum-effect relationship analysis combined with high-resolution mass spectrometry identification could be a potential strategy with which to identify bioactive components in S. ternatum.
In the present study, we hypothesized that chemical differences in different parts of S. ternatum would result in different pharmacological activities. Therefore, we established a spectrum-effect relationship-based strategy to investigate the bioactive basis and tissue distribution in S. ternatum. First, the phytochemical profiles and biological activities of ethanol extracts from different parts of S. ternatum were comparatively analyzed. Then, HPLC chromatogram-effect correlation analysis combined with high-resolution mass spectrometry was performed to identify the bioactive components in S. ternatum. Finally, molecular docking was used to validate the interactions between the active compounds and the target. The results of our study lay a solid theoretical foundation for further research on the pharmaceutical and cosmetic applications of S. ternatum and may also contribute to the rational utilization of different parts of medicinal plants.

2. Results and Discussion

2.1. Phytochemical Characterization

The yields of ethanol extracts from S. ternatum whole plants or specific organs after vacuum treatment are shown in Table 1. The S. ternatum stems had the highest yield of 39.79 ± 4.93%, while the roots had the lowest yield of 17.99 ± 0.22%. The Folin–Ciocalteu and AlCl3 methods were used to evaluate the total phenol and flavonoid contents in the different S. ternatum parts, respectively. Compared with the other plant parts, the stems were poor in phenols and flavonoids. The S. ternatum leaves are particularly rich in flavonoids. These results suggest that the different parts of S. ternatum vary considerably in their chemical composition.

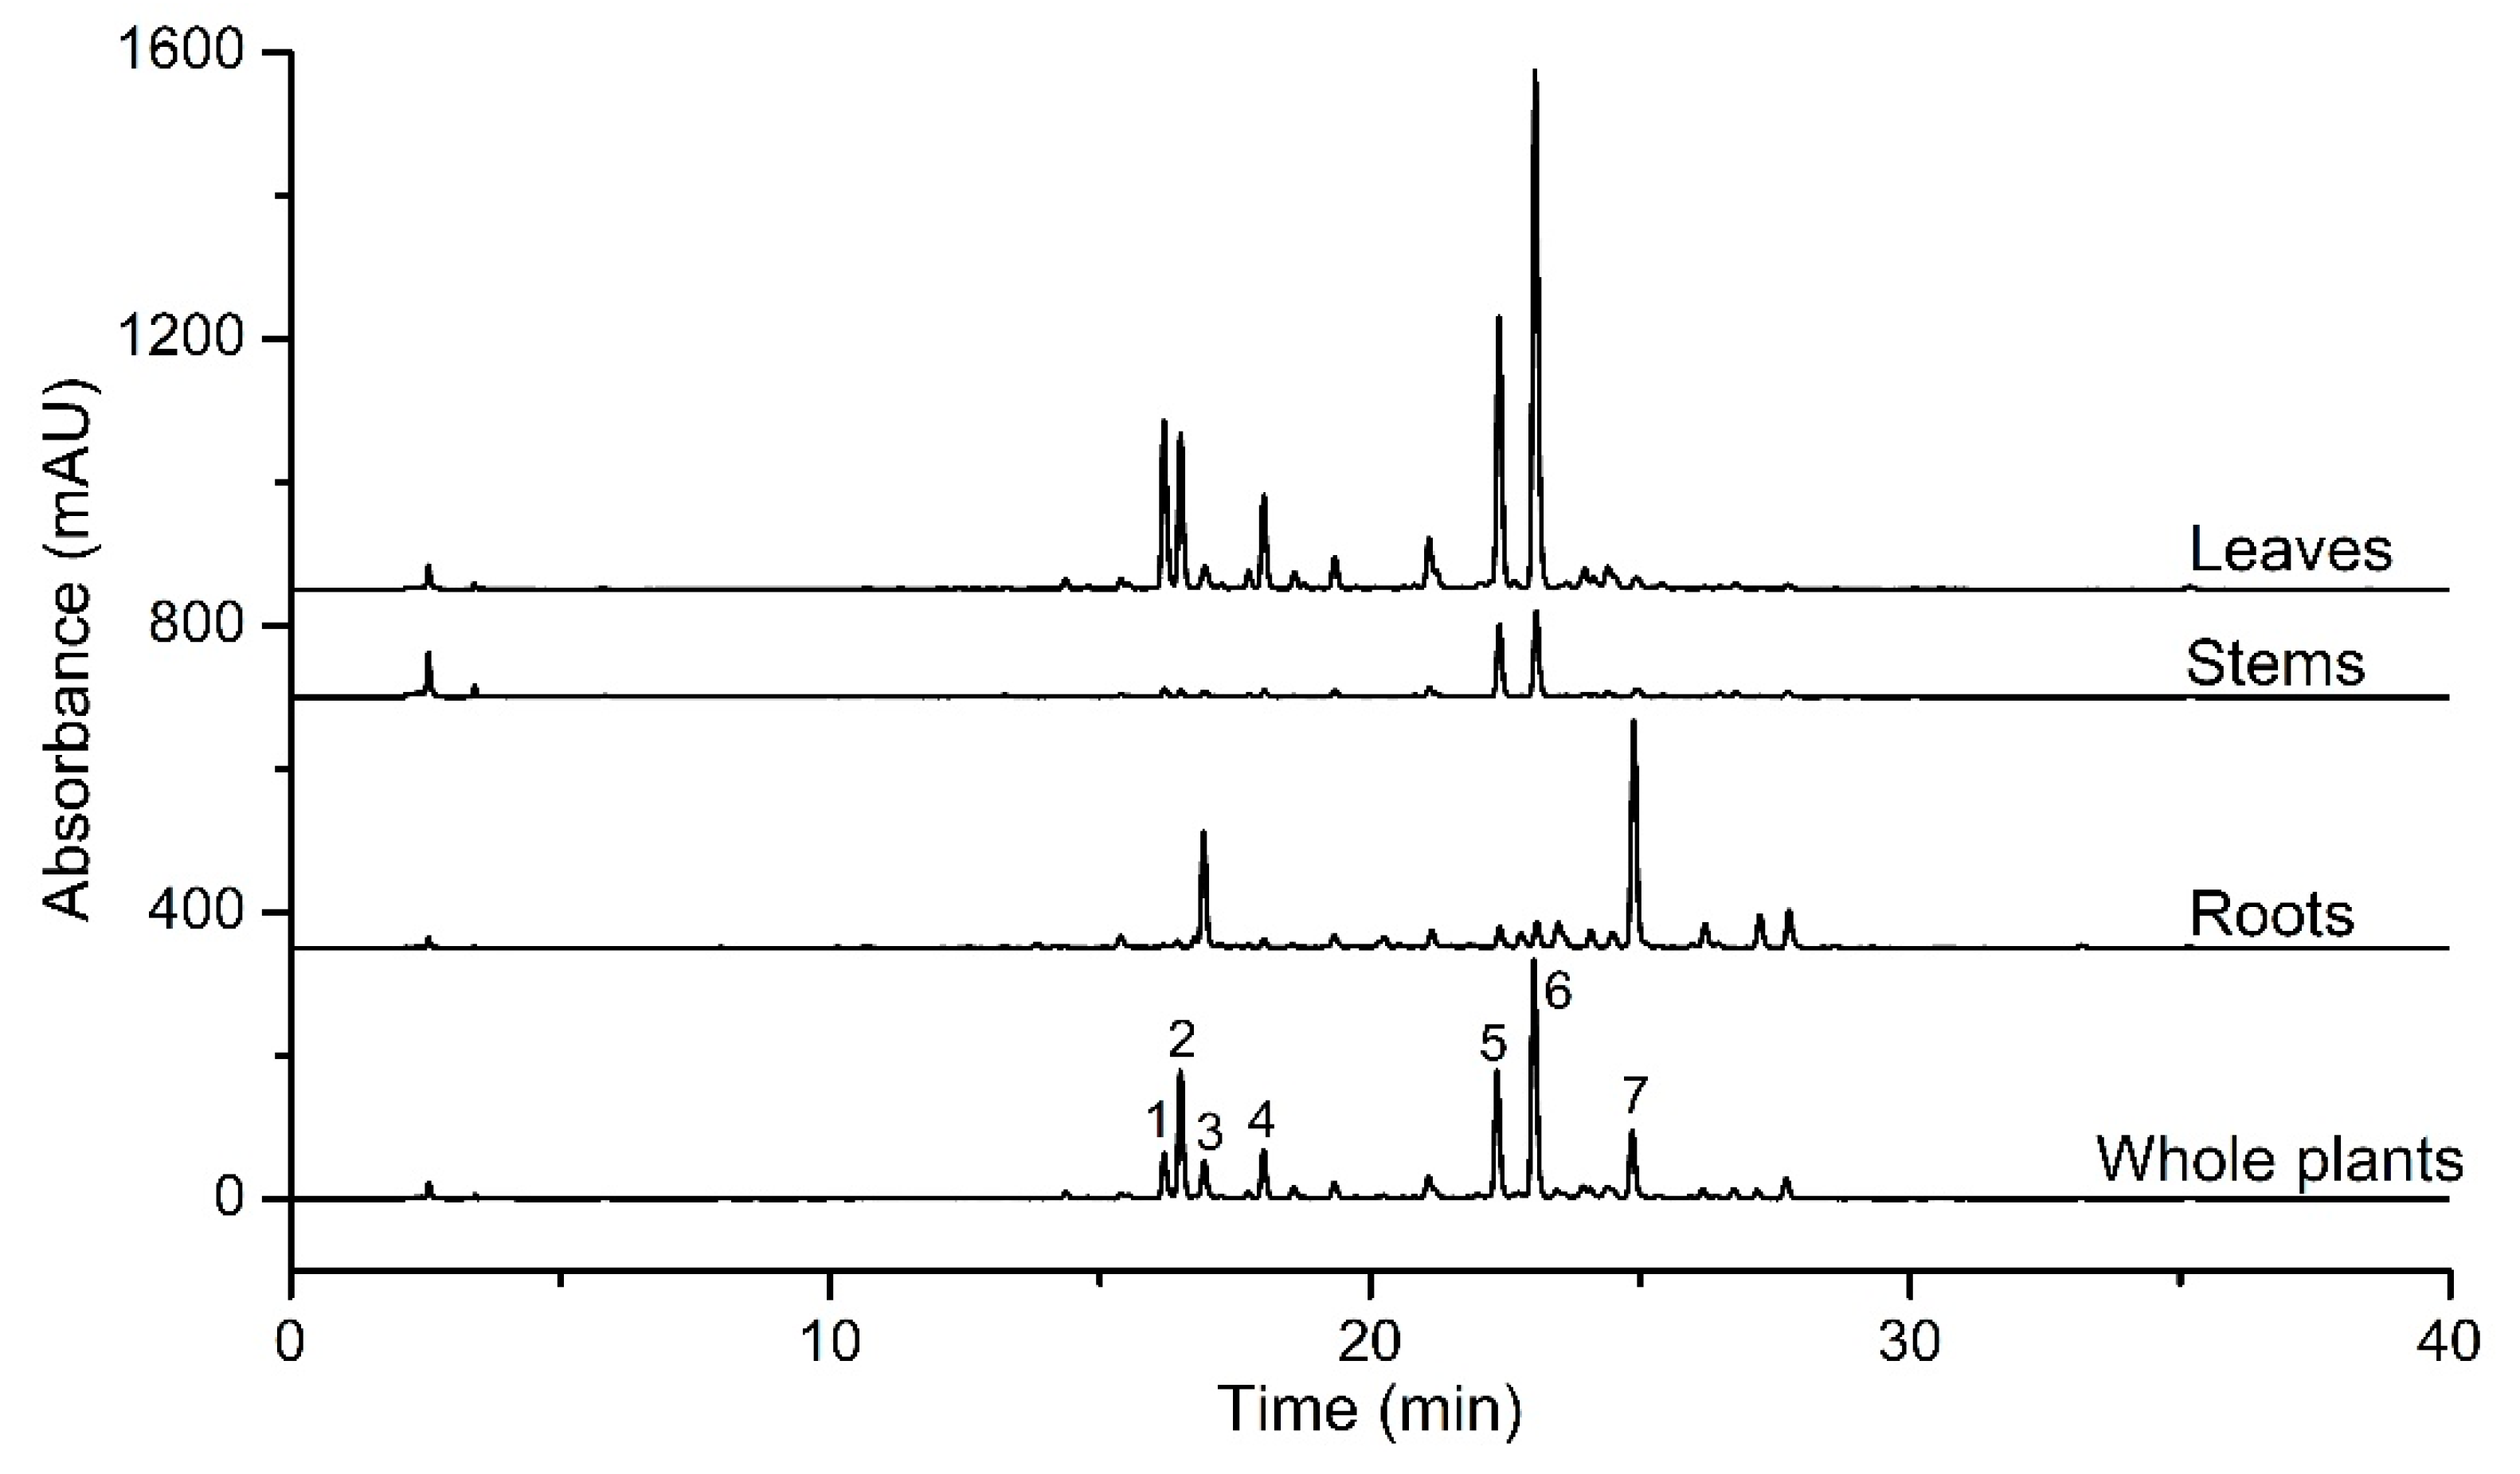
2.2. Chromatographic Analyses

Chromatographic analyses were performed to compare the distribution of secondary metabolites in different S. ternatum organs. As shown in Figure 1, the composition and abundance of the chromatographic peaks varied markedly in the chromatograms, indicating significant differences in secondary metabolites between the different S. ternatum organs. Generally, a relatively simple metabolic pattern was observed in the S. ternatum stem extract, whereas the leaf extract exhibited a more diverse profile. By comparing the retention time and mass spectra with those from our previous study [16], major common peaks were identified using HPLC coupled with electrospray ionization quadrupole time-of-flight mass spectrometry (HPLC–ESI-Q-TOF-MS/MS). As shown in Table 2, the peaks all represented flavonoid glycosides, with quercetin or kaempferol appearing as aglycones. These results indicate a specific distribution of secondary metabolites in different S. ternatum organs.

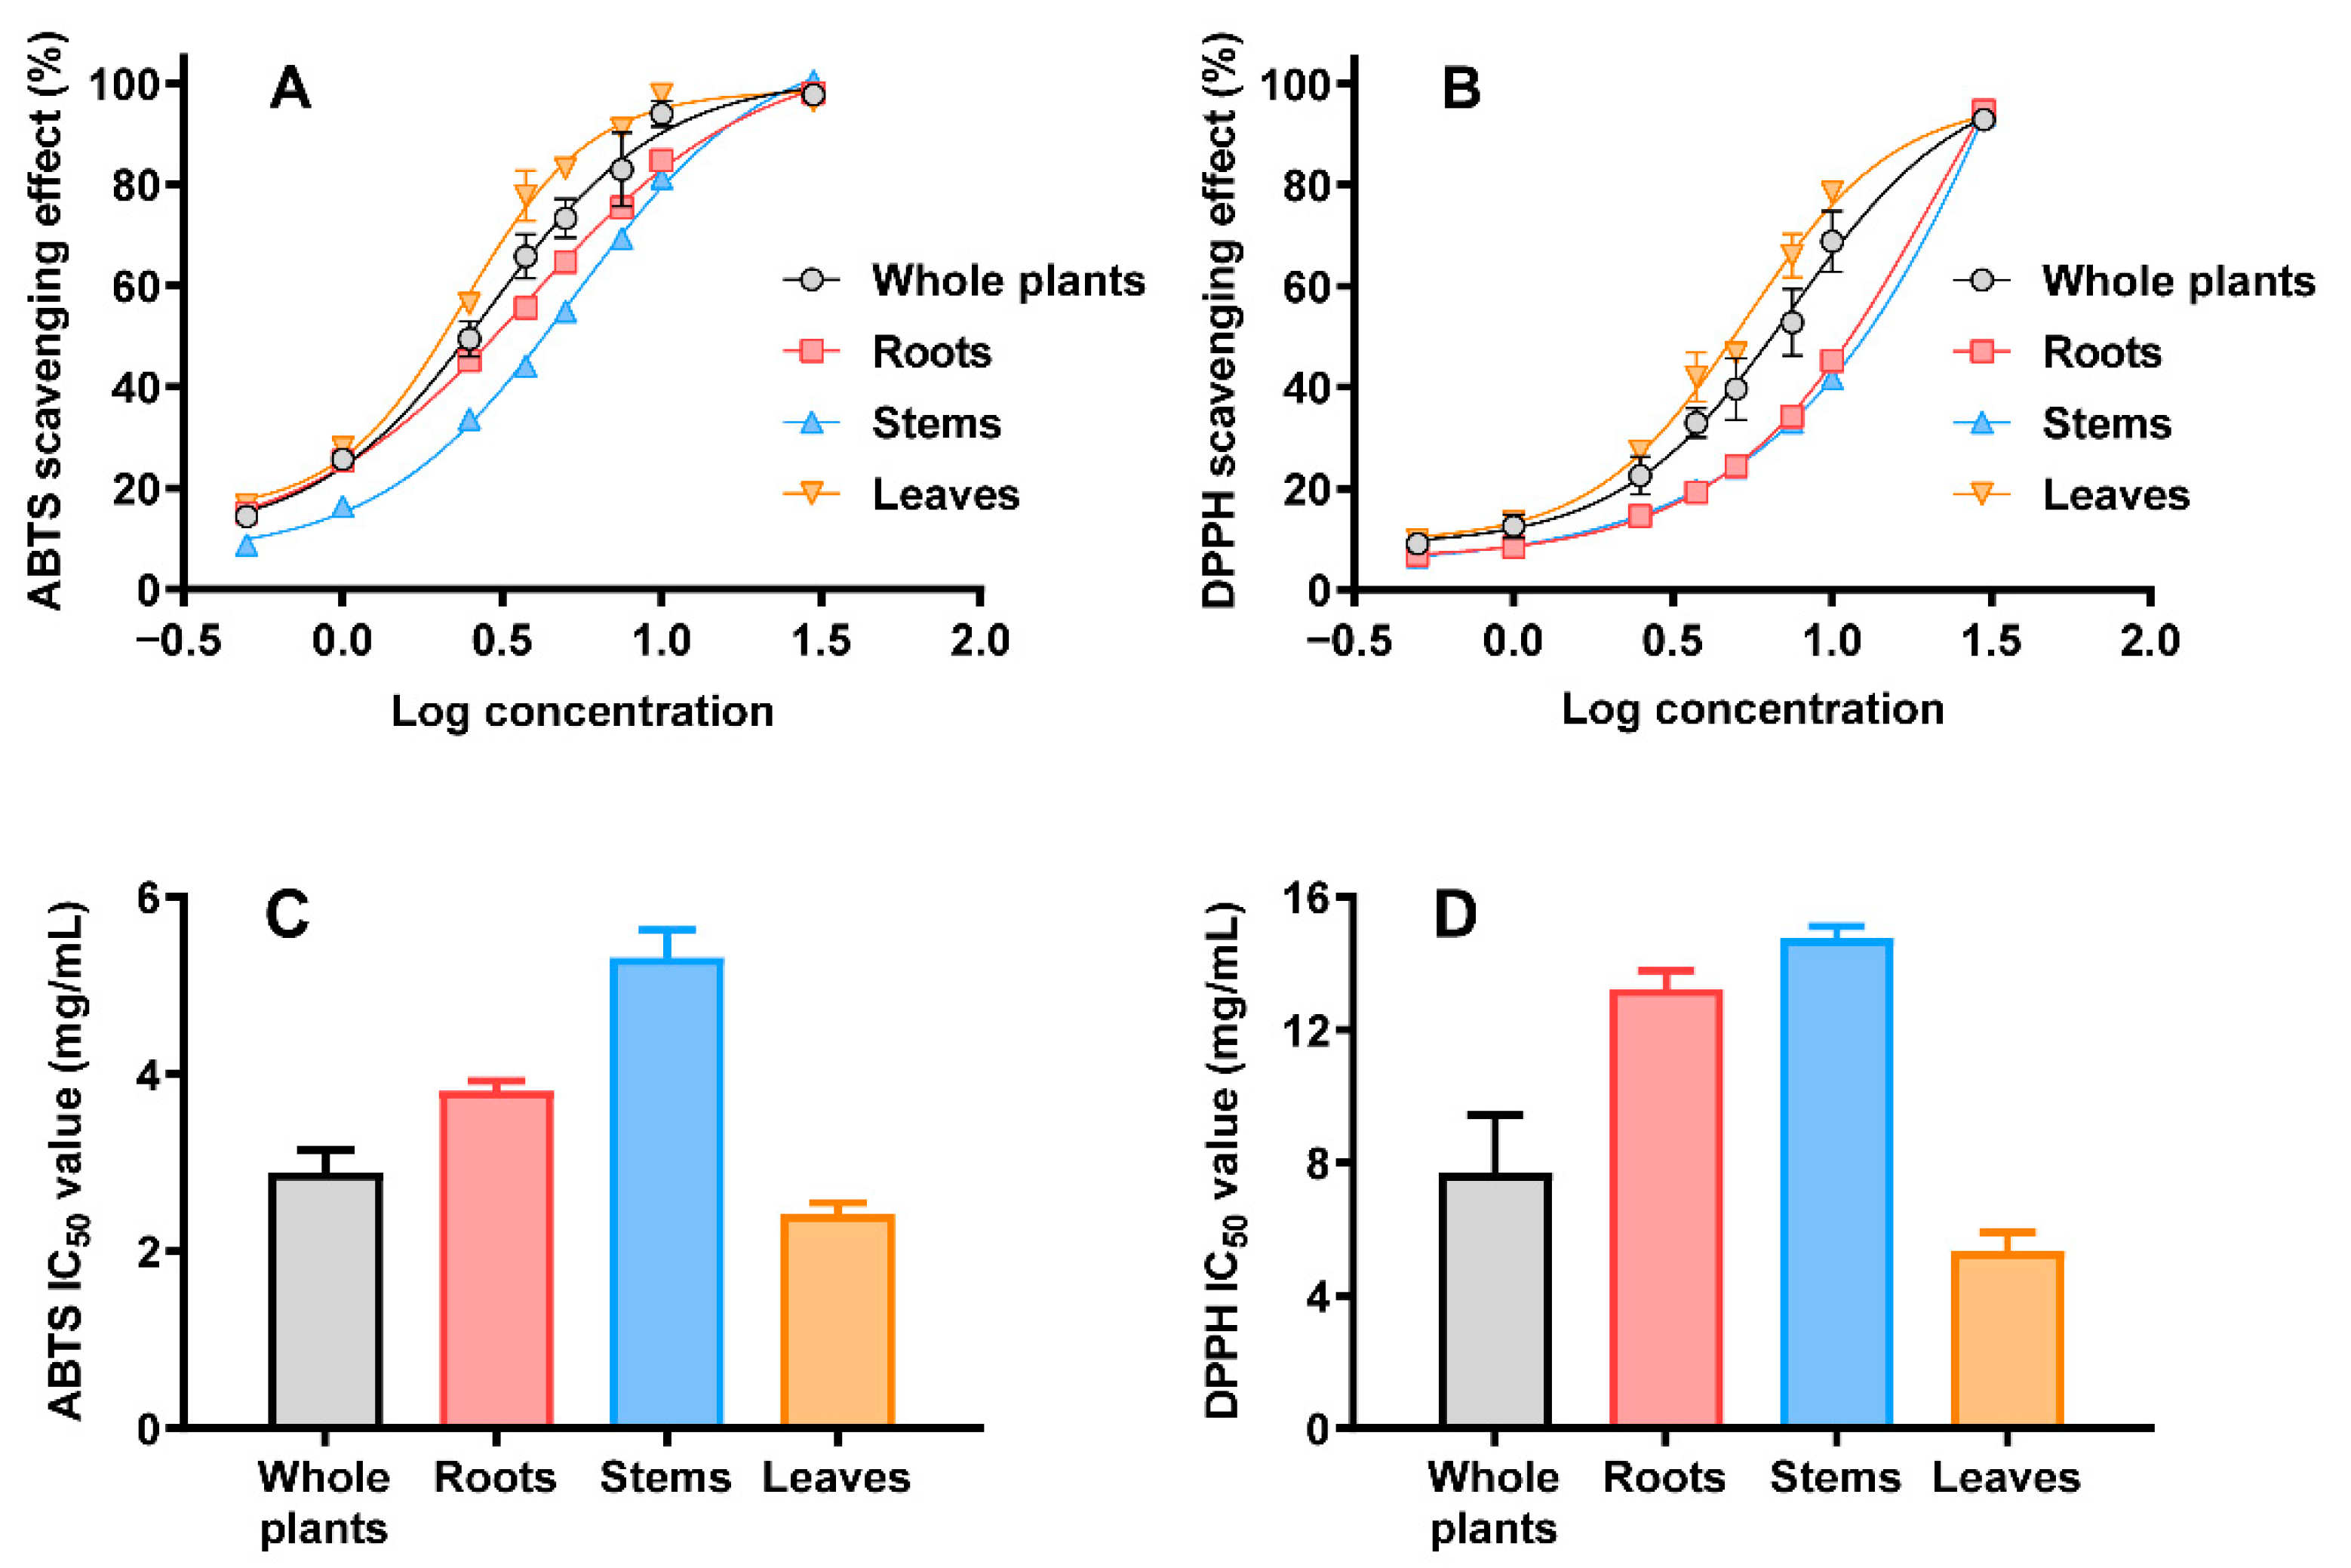
2.3. Antioxidant Activity

Figure 2A,B shows the 2,2ʹ-azino-bis (3-ethylbenzthiazoline-6-sulfonic acid) (ABTS) and 1,1-diphenyl-2-picrylhydrazyl (DPPH) radical scavenging abilities of the dried plant extracts, respectively. All ethanol extracts from different parts of S. ternatum exerted a radical-scavenging effect in a dose-dependent manner. The ABTS IC50 values of the ethanol extracts from whole plants, roots, stems, and leaves were 2.90 ± 0.25, 3.81 ± 0.11, 5.32 ± 0.31, and 2.43 ± 0.13 mg/mL, respectively (Figure 2C). The DPPH IC50 values of the ethanol extracts from whole plants, roots, stems, and leaves were 7.68 ± 1.76, 13.25 ± 0.54, 14.75 ± 0.36, and 5.36 ± 0.54 mg/mL, respectively (Figure 2D). Compared with L-ascorbic acid (VC) and 2,6-di-tert-butyl-4-methylphenol (BHT), the ABTS and DPPH IC50 values of the extracts were much higher. The ABTS IC50 values of VC and BHT were 75.44 ± 1.00 and 179.37 ± 5.92 μg/mL, respectively. The DPPH IC50 values of VC and BHT were 111.57 ± 2.25 and 223.80 ± 5.51 μg/mL, respectively. In summary, the ethanol extracts from different parts of S. ternatum presented a moderate radical scavenging ability. Meanwhile, the leaves showed higher antioxidant activity than the roots and stems. This may be related to the total phenol and flavonoid contents, which have significant antioxidant activities. As mentioned above, the S. ternatum leaves contained the highest phenol and flavonoid levels.

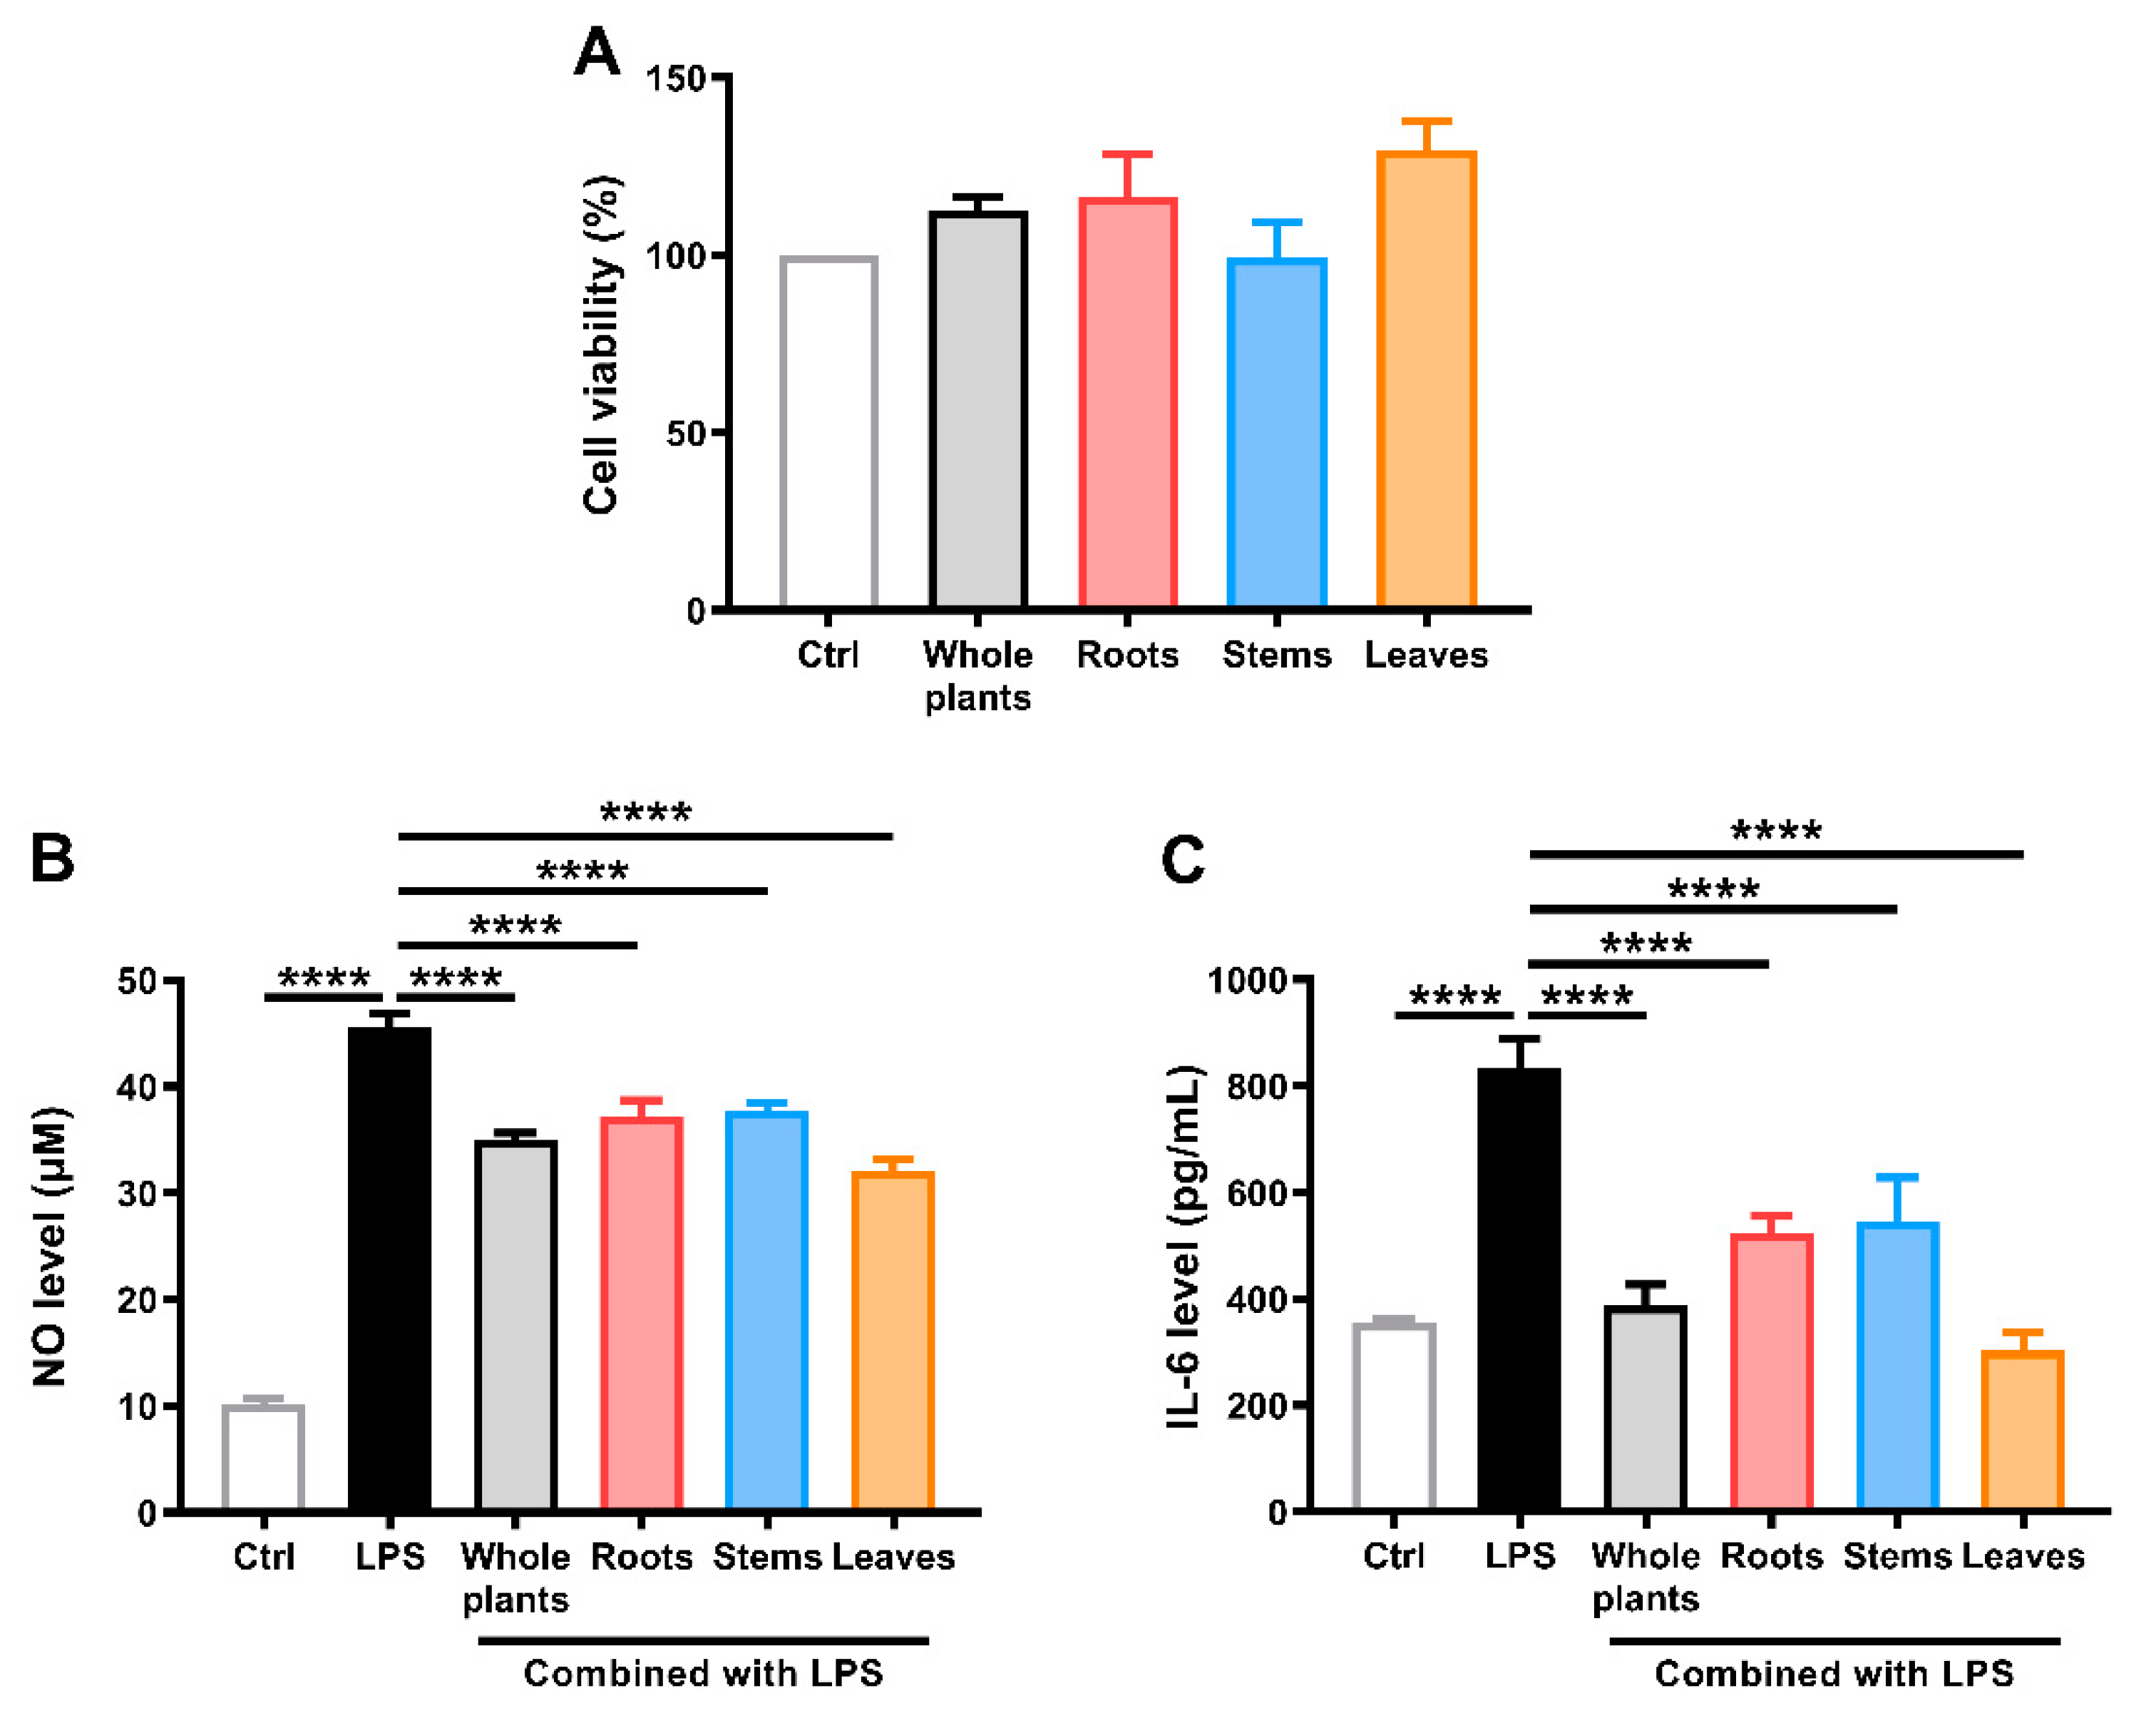
2.4. Anti-Inflammatory Activity

First, the cytotoxicity of the ethanol extracts from different parts of S. ternatum to RAW 264.7 cells was investigated using the Cell Counting Kit-8 (CCK-8) assay (Figure 3A). Cells were treated with the extracts (50 μg/mL) for 25 h. All plant extracts demonstrated no cytotoxicity to RAW 264.7 cells. Then, the anti-inflammatory properties of the plant extracts were studied in a model of lipopolysaccharide (LPS)-stimulated RAW 264.7 macrophages, and nitric oxide (NO) and interleukin-6 (IL-6) levels were evaluated. As shown in Figure 3B,C, NO and IL-6 levels increased significantly in the supernatant of LPS-stimulated cells (p < 0.0001). Co-treatment with ethanol extracts from different parts of S. ternatum decreased the inflammatory marker levels. Compared with the LPS-stimulated group, cells co-treated with ethanol extracts from the whole plants, roots, stems, and leaves of S. ternatum showed 29.81%, 23.59%, 22.07%, and 38.15% reductions in NO production, respectively. Similarly, cells co-treated with these ethanol extracts showed 93.18%, 64.93%, 60.26%, and 110.86% reductions in IL-6 release, respectively. These results suggest that the ethanol extracts from different parts of S. ternatum exerted obvious anti-inflammatory activity (p < 0.0001). Notably, the leaf extract exhibited the strongest effect.

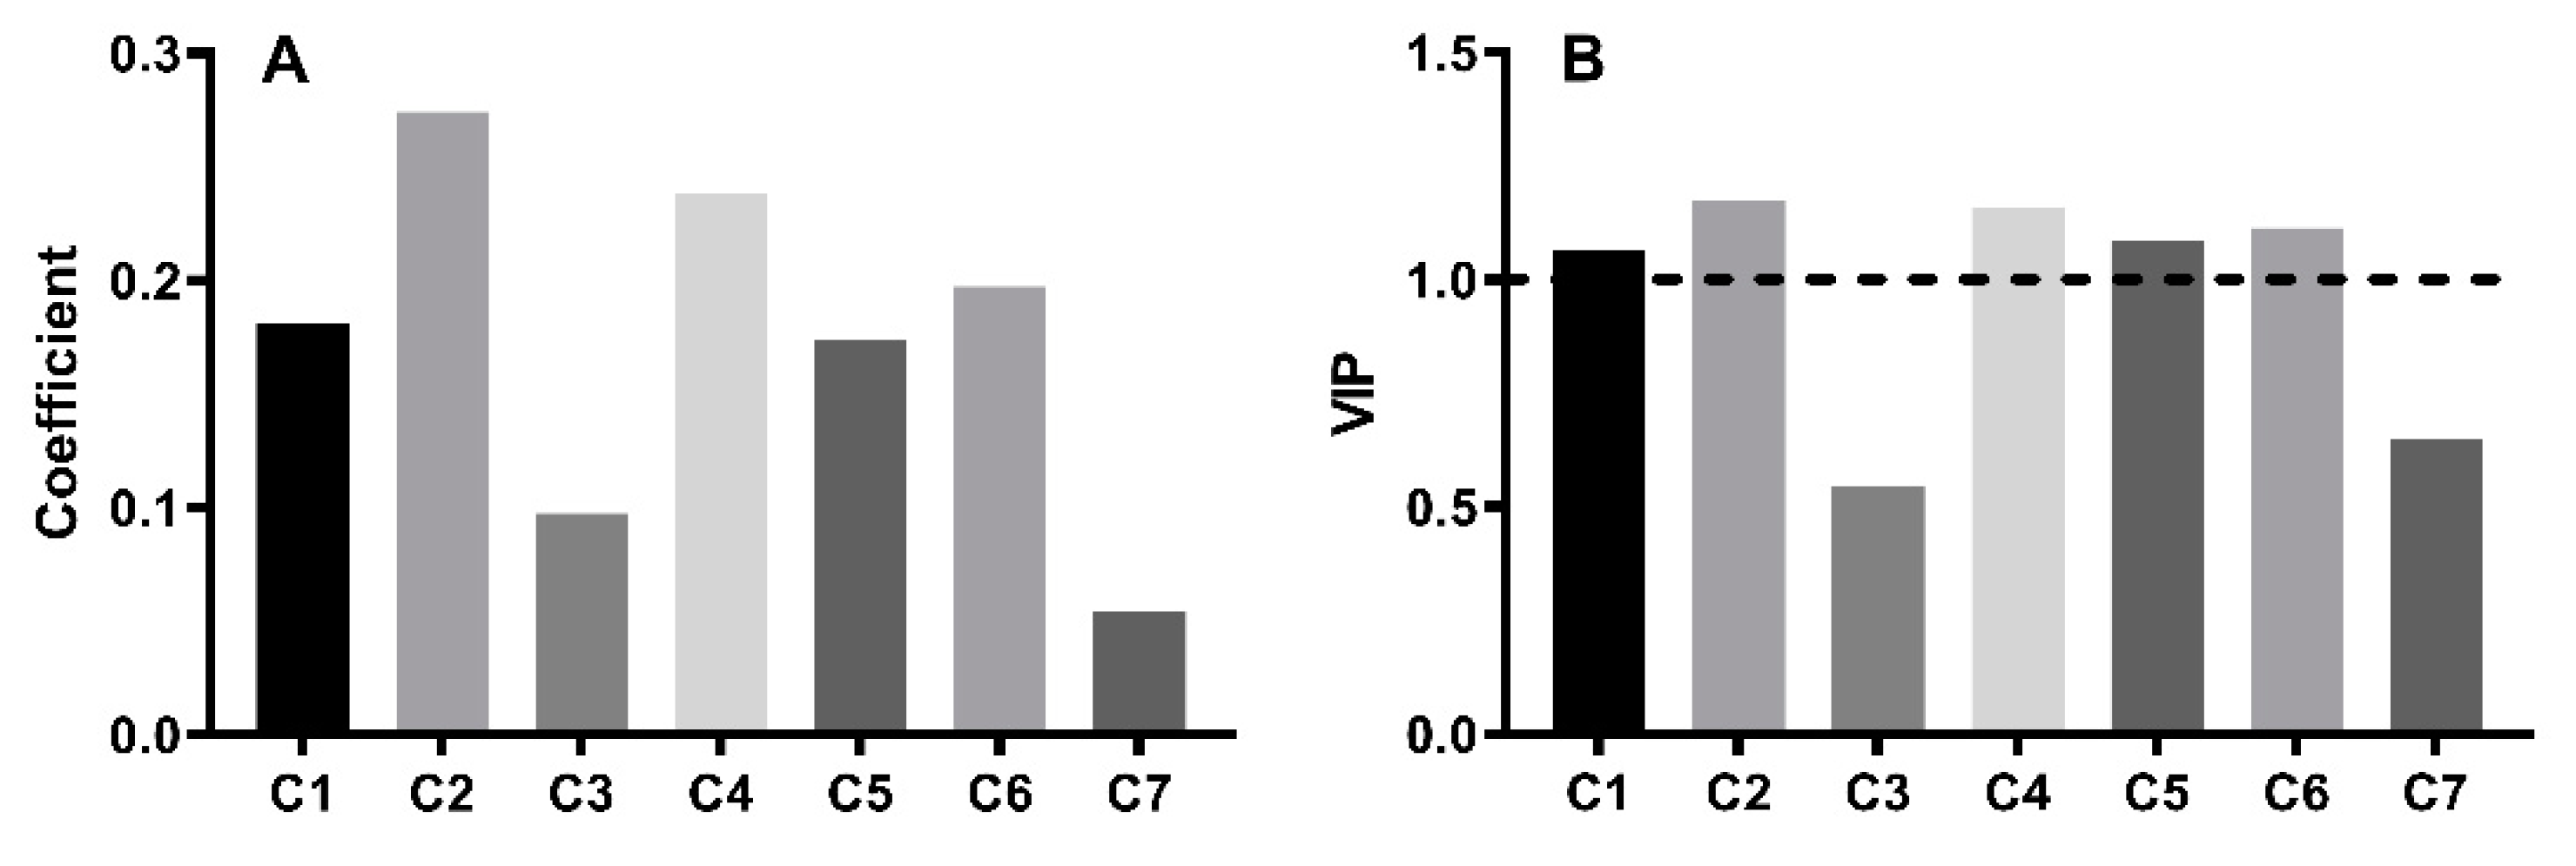
2.5. Spectrum-Effect Relationship Analysis

To evaluate the correlation between the phytochemical profile and anti-inflammatory activity, spectrum-effect relationship analysis was performed using partial least squares regression (PLSR). IL-6 has been recognized as a key marker of inflammation [19,20]. Thus, its level was selected as the dependent variable for model development. The regression coefficient of the established PLSR model is displayed in Figure 4A. All seven compounds are positively correlated with an IL-6 reduction. C2 shows the highest coefficient (R = 0.274), followed by C4 (R = 0.239) and C6 (R = 0.197). Figure 4B demonstrates the variable importance in the projection (VIP) of each compound. The VIP values of C2, C4, C6, C5, and C1 are > 1, indicating that these compounds have a significant impact on the reduction in IL-6. Of which, C2 made the largest contribution to the model (VIP = 1.175). The obtained results suggest that C2 exhibited the strongest anti-inflammatory activity.

2.6. Molecular Modeling

To further validate the anti-inflammatory activities of compounds C1−C7, molecular docking was employed to evaluate the interactions between the compounds and their anti-inflammatory target. Similarly, IL-6 was selected as a representative anti-inflammatory target for molecular docking in this study because of its importance in inflammation. Site I in IL-6 is the binding domain of IL-6R and is closely associated with classic signaling pathways [21,22]. Therefore, a grid box (126 Å × 126 Å × 114 Å, 0.375 Å spacing) was constructed around site I and centered at the following coordinates: x = 1.301, y = −19.932, z = 8.838. The docking results of the seven compounds with IL-6 (PDB ID:1ALU) are presented in Table 3. The free binding scores ranged from −1.10 to −6.60 kcal/mol. Additionally, Pearson’s correlation analysis was performed to assess the relationship between the binding energy and the coefficient obtained from the spectrum-effect relationship analysis [23]. As shown in Figure 5A, the binding energy was highly related to the coefficient (r = −0.889, p = 0.007). Thus, the molecular docking results were consistent with the conclusion of the spectrum-effect relationship analysis.
A lower binding energy indicates better binding affinity with the active site [24]. C2 exhibited the lowest binding energy, implying the most stable binding with IL-6. C2 also demonstrated the best anti-inflammatory activity. The 3D docking patterns of the seven compounds and IL-6 are shown in Figure 5B–H. As shown in Figure 5C, the high affinity between C2 and IL-6 was mainly attributed to hydrogen bonding with GLU-172, GLN-175, SER-176, ARG-179, GLN-75, SER-76, GLU-69, and MET-67.

3. Materials and Methods

3.1. Chemicals and Reagents

VC, Folin–Ciocalteu reagent, and dimethyl sulfoxide (DMSO) were purchased from Sigma–Aldrich (St. Louis, MO, USA). Sodium carbonate aqueous solution (Na2CO3, 1.0 M), aluminum chloride hexahydrate (AlCl3·6H2O), potassium acetate (CH3COOK), ABTS, potassium persulfate (K2S2O8), BHT, and GA were procured from Aladdin (Shanghai, China). DPPH was purchased from Yuanye (Shanghai, China). LPS was purchased from Beyotime (Shanghai, China). QE was purchased from Desite (Chengdu, China). Acetonitrile was of high-purity spectroscopic grade and was obtained from Merck (Darmstadt, Germany). Other chemicals and solvents were of analytical grade and were procured locally.

3.2. Plant Material and S. ternatum Extraction Protocol

Whole S. ternatum was collected during the winter of 2020 in Taishun County, Wenzhou, China. The collected plants were identified using pertinent literature and authenticated through comparison with the species preserved in our laboratory [16]. The whole plants or different parts of S. ternatum were ground and sieved to a fine powder after being completely air-dried. Then, 1 g of powder from each part was extracted twice using ultrasound with 10 mL of 70% aqueous ethanol for 30 min each. The supernatants were combined, filtered, and vacuum-dried at a low temperature. Three replicates were performed for each experiment. The residue powders of each part were stored at −30 °C until further use.

3.3. Spectrophotometric Analysis

All determinations were performed in 96-well plates using a BioTek EPOCH 2 microplate reader.

3.3.1. Determination of Total Phenols

The total phenolic content of ethanol extracts from different parts of S. ternatum was determined using a modified Folin–Ciocalteu method [25]. Briefly, 75 µL of Folin–Ciocalteu reagent (15%, diluted with ultrapure water) was added to 40 µL of a suitable dissolved extract (6 mg/mL, dissolved in 30% methanol). After proper mixing, 85 µL of a Na2CO3 aqueous solution (1.0 M) was added to the mixture. The 96-well plate containing the mixture was further incubated at 45 °C for 15 min, and the absorbance at 765 nm was recorded. The total phenolic content was expressed as GA equivalents (µg GA equivalents per mg of dry extract) through a calibration curve, with GA ranging from 10 to 250 µg/mL (R2 = 1.00).

3.3.2. Determination of Total Flavonoids

The total flavonoid content of the extracts was determined through the AlCl3 method, using QE as a standard [25]. Briefly, 60 µL of ethanol (95%), 40 μL of AlCl3 (1%), 40 μL of CH3COOK (0.1 M), and 60 μL of pure water were successively added to 40 µL of dissolved extract (6 mg/mL, dissolved in 30% methanol). The 96-well plate containing the mixture was incubated at room temperature for 30 min, and the absorbance at 415 nm was recorded. The total flavonoid content was expressed as QE equivalents (µg QE equivalents per mg of dry extract) through a calibration curve, with QE ranging from 10 to 500 µg/mL (R2 = 1.00).

3.3.3. ABTS Radical Scavenging Assay

The ABTS radical scavenging assay was performed as described in our previous study [16]. Briefly, equal volumes of ABTS aqueous solution (6.83 mM) and K2S2O8 aqueous solution (2.47 mM) were mixed and incubated in the dark for 16 h to prepare ABTS radical stock solutions. The ABTS radical working solution was prepared via 25-fold dilution of the stock solution with ultrapure water. In the assay, the dried plant extract was diluted in 30% methanol at eight concentrations ranging from 0.5 to 30 mg/mL, and 10 μL of each sample was then added to 150 μL of ABTS radical working solution. The mixture was incubated at room temperature for 30 min before measuring the absorbance at 734 nm. The ABTS scavenging activity was calculated as (Acontrol − Asample)/Acontrol × 100%, where Acontrol is the absorbance of the control, and Asample is the absorbance of the sample.

3.3.4. DPPH Radical Scavenging Assay

The DPPH radical scavenging assay was performed as described in our previous study [26]. Briefly, the dried plant extract was diluted in 30% methanol at eight concentrations ranging from 0.5 to 30 mg/mL, and 10 μL of each sample was then added to 150 μL of DPPH methanol solution (150 µM). The mixture was incubated for 45 min in the dark before measuring the absorbance at 517 nm. The DPPH scavenging activity was calculated as (Acontrol − Asample)/Acontrol × 100%, where Acontrol is the absorbance of the control, and Asample is the absorbance of the sample.

3.4. HPLC–UV and HPLC–ESI-Q-TOF-MS/MS Analyses

Dried ethanol extracts from different parts of S. ternatum were dissolved in 30% methanol to a final concentration of 15 mg/mL. High-performance liquid chromatography–ultraviolet (HPLC–UV) and HPLC–ESI-Q-TOF-MS/MS analyses were carried out using the same chromatographic and mass spectrometric conditions as those described in our previous work [16]. Briefly, HPLC–UV analysis was carried out using an Agilent 1260 HPLC system. Chromatographic separations were performed on a Waters Xselect HSS T3 column (4.6 mm × 150 mm, 3.5 μm) using a gradient mobile phase consisting of 0.1% formic acid in water (A) and acetonitrile (B) at a flow rate of 0.8 mL/min. The gradient elution program was performed as follows: 0–40 min, 5–35% B. The column was maintained at 35 °C, and the injection volume was 10 μL. The detection wavelength was set at 345 nm.
HPLC–ESI-Q-TOF-MS/MS analysis was carried out using an AB SCIEX TripleTOF 5600+ mass spectrometer equipped with a Waters Acquity UPLC system. Chromatographic conditions were the same with HPLC–UV. The experimental parameters of the Q-TOF-MS analysis were: scan mode, full scan; scan range, 100–2000 Da and 50–2000 Da for MS1 and MS2, respectively; ion spray voltage, +5500 V and −4500 V for positive and negative ion mode, respectively; ion source heater, 600 °C and 550 °C for positive and negative ion mode, respectively; collision energy, +40 V and −40 V for positive and negative ion mode, respectively; collision energy spread, 20 V; GS1, 50 psi; GS2, 50 psi; curtain gas, 30 psi. Data were processed using the Peakview software (AB SCIEX, version 1.2) provided with the instrument.

3.5. Cell Culture and Cell Viability Assay

Murine macrophage cells (RAW 264.7) were purchased from Meisen Chinese Tissue Culture Collections (MeisenCTCC, Hangzhou, China). The cells were cultured in Dulbecco’s modified Eagle’s medium supplemented with 10% fetal bovine serum (FBS) and penicillin–streptomycin (100 U/mL) in a humidified atmosphere (5% CO2, 37 °C). Dried ethanol extracts from different parts of S. ternatum were dissolved to 50 mg/mL in DMSO and diluted in culture medium before use. The cytotoxicity of S. ternatum to RAW 264.7 cells was evaluated using a CCK-8 assay. Briefly, 1 × 10⁴ cells/well were seeded in 96-well plates and incubated overnight. The medium was then replaced with FBS-free medium containing 50 μg/mL of extracts from different parts of S. ternatum. Cells treated with DMSO (0.1%) were used as controls. After 25 h of treatment, 10 μL of CCK-8 solution (GLPBIO, Montclair, NJ, USA) was added to each well and incubated for 4 h. The optical density (OD) was measured at 450 nm. Cell viability (%) = ODsample/ODcontrol × 100, where ODsample is the OD value of the treated sample, and ODcontrol is the OD value of the control.

3.6. NO Assay and Enzyme-Linked Immunosorbent Assay (ELISA)

RAW 264.7 cells (5 × 10⁵ cells/well) were grown in a 12-well plate overnight. Thereafter, the medium was replaced with FBS-free medium containing 50 μg/mL of extracts from different parts of S. ternatum. After 1 h of incubation, the cells were stimulated with LPS (1 μg/mL) for 24 h. NO level in the supernatant was measured by the Griess method using Griess reagent (Beyotime, Shanghai, China). Briefly, 50 µL of Griess Reagent I and 50 μL of Griess Reagent II were successively added to 50 µL of supernatant, and the absorbance at 540 nm was recorded. The NO concentration was calculated through a calibration curve, with sodium nitrite ranging from 1 to 100 µM (R2 = 1.00). IL-6 level in the supernatant was measured using a mouse IL-6 ELISA Kit (Beyotime, Shanghai, China) according to the manufacturer’s protocol.

3.7. Spectrum-Effect Relationship Analysis

The spectrum-effect relationship between the phytochemical profiles and biological activities of the ethanol extracts from different parts of S. ternatum was analyzed using PLSR. The common chromatographic peak areas were defined as independent variables (X), while the reduction in the IL-6 level was set as a dependent variable (Y). SIMCA 14.1 software was used to establish the PLSR model. The regression coefficient was regarded as an index that exhibited the relative impact of the independent variables on the dependent variables. The VIP value was used to identify chromatographic peaks significantly correlated with the biological activities of the extracts.

3.8. Compound-Target Molecular Modeling

Molecular docking was performed to compare the anti-inflammatory activities of the major phytochemicals in S. ternatum. Briefly, the docking steps were as follows. (1) The compound structure (sdf format) was obtained from the PubChem database (https://pubchem.ncbi.nlm.nih.gov/ (accessed on 3 May 2022).). The 3D conformation was constructed using ChemBio3D Ultra 12.0 software (CambridgeSoft Corp., Waltham, MA, USA), and the energy was minimized using MM2 force field optimization [27]. Then, the 3D structure was hydrogenated and saved in pdbqt file format using AutoDockTools 1.5.6 (http://mgltools.scripps.edu/ (accessed on 2 August 2021)). (2) The crystal structure of the anti-inflammatory target was downloaded from the RCSB PDB database (https://www.rcsb.org/ (accessed on 9 May 2022)) and imported into PyMOL 2.5.0 software (Schrödinger, LLC, New York, NY, USA) to remove the solvent molecules and ligands. The receptor structure was further modified by deleting water molecules and adding all polar hydrogens using AutoDockTools, and a docking grid box was subsequently constructed at the active site. (3) AutoDockTools was employed to investigate the molecular interactions between compounds and targets, as well as to calculate the binding energy. The best conformer was obtained using the Lamarckian genetic algorithm in flexible docking [19,28]. (4) The conformation with the lowest binding energy was considered the most suitable binding mode and was visualized using PyMOL.

3.9. Statistical Analysis

Statistical analysis was performed using GraphPad Prism software (version 6.0; La Jolla, CA, USA). The data are expressed as means ± SD. The level of significance between groups was determined using one-way analysis of variance, followed by Fisher’s LSD multiple comparison. Results with p < 0.05 were considered statistically significant.

4. Conclusions

In this study, a spectrum-effect relationship-based strategy was used to explore the bioactive basis and tissue distribution in S. ternatum. The chemical profiles and the antioxidant and anti-inflammatory properties of ethanol extracts from roots, stems, and leaves of S. ternatum were comparatively analyzed. The leaves contained the most abundant flavonoids and exerted the best biological activities. Spectrum-effect relationship analysis and molecular docking indicated that quercetin 3-O-rhamnoside-7-O-glucoside (C2) possess high anti-inflammatory activity by binding with IL-6. These results show that S. ternatum is a rich source of bioactive flavonoids with potential exploitation in pharmaceutical and cosmetic industries.

Author Contributions

Conceptualization and methodology, J.Z., X.Y. and L.F.; investigation, software, data curation, formal analysis, visualization, and writing—original draft preparation, J.Z. and X.Y.; validation and writing—review and editing, H.D., L.Z. and W.X.; supervision and project administration, X.Y. and L.F.; funding acquisition, J.Z., H.D. and W.X. All authors have read and agreed to the published version of the manuscript.

Funding

This research was funded by National Natural Science Foundation of China (Grant numbers: 82003920 and 81903898), Zhejiang Provincial Natural Science Foundation of China (Grant numbers: LYY22H310006 and LQ19H280001), Zhejiang Provincial Project of Traditional Chinese Medicine Science and Technology (Grant number: 2021ZB040), and the “30” Talent Program of the Cancer Hospital of the University of Chinese Academy of Sciences (to Junfeng Zhu).

Institutional Review Board Statement

Not applicable.

Informed Consent Statement

Not applicable.

Data Availability Statement

The data presented in this study are available on request from the corresponding author. The data are not publicly available due to privacy.

Acknowledgments

Not applicable.

Conflicts of Interest

The authors declare no conflict of interest.

Sample Availability

Samples of the compounds are available from the authors.

References

  1. Badshah, S.L.; Faisal, S.; Muhammad, A.; Poulson, B.G.; Emwas, A.H.; Jaremko, M. Antiviral activities of flavonoids. Biomed. Pharmacother. 2021, 140, 111596. [Google Scholar] [CrossRef] [PubMed]
  2. Ullah, A.; Munir, S.; Badshah, S.L.; Khan, N.; Ghani, L.; Poulson, B.G.; Emwas, A.H.; Jaremko, M. Important flavonoids and their role as a therapeutic agent. Molecules 2020, 25, 5243. [Google Scholar] [CrossRef]
  3. Uddin, M.S.; Kabir, M.T.; Niaz, K.; Jeandet, P.; Clément, C.; Mathew, B.; Rauf, A.; Rengasamy, K.R.R.; Sobarzo-Sánchez, E.; Ashraf, G.M.; et al. Molecular insight into the therapeutic promise of flavonoids against alzheimer’s disease. Molecules 2020, 25, 1267. [Google Scholar] [CrossRef]
  4. Kopustinskiene, D.M.; Jakstas, V.; Savickas, A.; Bernatoniene, J. Flavonoids as anticancer agents. Nutrients 2020, 12, 457. [Google Scholar] [CrossRef]
  5. Lalani, S.; Poh, C.L. Flavonoids as antiviral agents for Enterovirus A71 (EV-A71). Viruses 2020, 12, 184. [Google Scholar] [CrossRef]
  6. Rufino, A.T.; Costa, V.M.; Carvalho, F.; Fernandes, E. Flavonoids as antiobesity agents: A review. Med. Res. Rev. 2021, 41, 556–585. [Google Scholar] [CrossRef]
  7. Duan, X.; Li, J.; Cui, J.; Li, H.; Hasan, B.; Xin, X. Chemical component and in vitro protective effects of Matricaria chamomilla (L.) against lipopolysaccharide insult. J. Ethnopharmacol. 2022, 296, 115471. [Google Scholar] [CrossRef]
  8. Zhang, J.; Liang, X.; Li, J.; Yin, H.; Liu, F.; Hu, C.; Li, L. Apigenin attenuates acetaminophen-induced hepatotoxicity by activating AMP-activated protein kinase/carnitine palmitoyltransferase I pathway. Front. Pharmacol. 2020, 11, 549057. [Google Scholar] [CrossRef]
  9. Botrychium Ternatum (Thunb.) Sw. Available online: http://www.iplant.cn/info/Botrychium%20ternatum?t=foc (accessed on 26 June 2022).
  10. Zou, X.; Wagner, W.H. A preliminary review of Botrychium in China. Am. Fern J. 1988, 78, 122–135. [Google Scholar]
  11. Yuan, Y.; Yang, B.; Ye, Z.; Zhang, M.; Yang, X.; Xin, C.; Lin, M.; Huang, P. Sceptridium ternatum extract exerts antiasthmatic effects by regulating Th1/Th2 balance and the expression levels of leukotriene receptors in a mouse asthma model. J. Ethnopharmacol. 2013, 149, 701–706. [Google Scholar] [CrossRef]
  12. Huang, P.; Xin, W.; Zheng, X.; Fang, L.; Li, Q.; Lv, G. Screening of Sceptridium ternatum for antitussive and antiasthmatic activity and associated mechanisms. J. Int. Med. Res. 2017, 45, 1985–2000. [Google Scholar] [CrossRef] [PubMed] [Green Version]
  13. Xin, W.X.; Li, Q.L.; Fang, L.; Zhong, L.K.; Zheng, X.W.; Huang, P. Preventive effect and mechanism of ethyl acetate extract of Sceptridium ternatum in monocrotaline-induced pulmonary arterial hypertension. Chin. J. Integr. Med. 2020, 26, 205–211. [Google Scholar] [CrossRef] [PubMed]
  14. Jin, Y.S.; Yun, B.S.; Kyoung, C.H.; Suk, Y.M.; Yeon, K.J. Skin External Composition Containing Sceptridium Ternatum Extract. Korean Patent No. KR-20130099610-A, 6 September 2013. [Google Scholar]
  15. Lim, D.; Kim, M.K.; Jang, Y.P.; Kim, J. Sceptridium ternatum attenuates allergic contact dermatitis-like skin lesions by inhibiting T helper 2-type immune responses and inflammatory responses in a mouse model. J. Dermatol. Sci. 2015, 79, 288–297. [Google Scholar] [CrossRef] [PubMed]
  16. Zhu, J.; Zhong, L.; Kong, S.; Zhang, Y.; Huang, P. Comprehensive evaluation of the antioxidant capacity of Sceptridium ternatum using multiple colorimetric methods and 1,1-diphenyl-2-picrylhydrazyl-high-performance liquid chromatography analysis. J. Sep. Sci. 2020, 43, 3615–3624. [Google Scholar] [CrossRef] [PubMed]
  17. Liu, X.; Jiang, N.; Xu, X.; Liu, C.; Liu, Z.; Zhang, Y.; Kang, W. Anti-hepatoma compound determination by the method of spectrum effect relationship, component knock-out, and UPLC-MS2 in Scheflera heptaphylla (L.)Frodin Harms and its mechanism. Front. Pharmacol. 2020, 11, 1342. [Google Scholar] [CrossRef]
  18. Zhou, X.; Liu, H.; Zhang, M.; Li, C.; Li, G. Spectrum-effect relationship between UPLC fingerprints and anti-lung cancer effect of Panax ginseng. Phytochem. Anal. 2021, 32, 339–346. [Google Scholar] [CrossRef]
  19. Yin, B.; Bi, Y.M.; Fan, G.J.; Xia, Y.Q. Molecular mechanism of the effect of Huanglian Jiedu Decoction on Type 2 diabetes mellitus based on network pharmacology and molecular docking. J. Diabetes. Res. 2020, 2020, 5273914. [Google Scholar] [CrossRef]
  20. Zhao, R.; Liu, Y.; Wang, H.; Yang, J.; Niu, W.; Fan, S.; Xiong, W.; Ma, J.; Li, X.; Phillips, J.B.; et al. BRD7 plays an anti-inflammatory role during early acute inflammation by inhibiting activation of the NF-κB signaling pathway. Cell. Mol. Immunol. 2017, 14, 830–841. [Google Scholar] [CrossRef]
  21. Aoki, Y.; Narazaki, M.; Kishimoto, T.; Tosato, G. Receptor engagement by viral interleukin-6 encoded by Kaposi sarcoma-associated herpesvirus. Blood 2001, 98, 3042–3049. [Google Scholar] [CrossRef]
  22. Berg, A.F.; Ettich, J.; Weitz, H.T.; Krusche, M.; Floss, D.M.; Scheller, J.; Moll, J.M. Exclusive inhibition of IL-6 trans-signaling by soluble gp130FlyR Fc. Cytokine: X 2021, 3, 100058. [Google Scholar] [CrossRef]
  23. Xing, L.; Zhang, X.; Zhang, X.; Tong, D. Expression scoring of a small-nucleolar-RNA signature identified by machine learning serves as a prognostic predictor for head and neck cancer. J. Cell. Physiol. 2020, 235, 8071–8084. [Google Scholar] [CrossRef] [PubMed] [Green Version]
  24. An, W.; Huang, Y.; Chen, S.; Teng, T.; Shi, Y.; Sun, Z.; Xu, Y. Mechanisms of Rhizoma Coptidis against type 2 diabetes mellitus explored by network pharmacology combined with molecular docking and experimental validation. Sci. Rep. 2021, 11, 20849. [Google Scholar] [CrossRef] [PubMed]
  25. Bazylko, A.; Parzonko, A.; Jeż, W.; Osińska, E.; Kiss, A.K. Inhibition of ROS production, photoprotection, and total phenolic, flavonoids and ascorbic acid content of fresh herb juice and extracts from the leaves and flowers of Tropaeolum majus. Ind. Crops Prod. 2014, 55, 19–24. [Google Scholar]
  26. Zhu, J.F.; Yi, X.J.; Zhang, J.H.; Chen, S.Q.; Wu, Y.J. Rapid screening of brain-penetrable antioxidants from natural products by blood-brain barrier specific permeability assay combined with DPPH recognition. J. Pharm. Biomed. Anal. 2018, 151, 42–48. [Google Scholar] [CrossRef] [PubMed]
  27. Li, R.; Li, Y.; Liang, X.; Yang, L.; Su, M.; Lai, K.P. Network pharmacology and bioinformatics analyses identify intersection genes of niacin and COVID-19 as potential therapeutic targets. Brief. Bioinform. 2021, 22, 1279–1290. [Google Scholar] [CrossRef]
  28. Zhu, J.F.; Yi, X.J.; Huang, P.; Chen, S.Q.; Wu, Y.J. Drug-protein binding of Danhong injection and the potential influence of drug combination with aspirin: Insight by ultrafiltration LC-MS and molecular modeling. J. Pharm. Biomed. Anal. 2017, 134, 100–107. [Google Scholar] [CrossRef]
Figure 1. HPLC–UV chromatograms of ethanol extracts from whole plants, roots, stems, and leaves of S. ternatum.
Molecules 27 05698 g001
Figure 2. The radical scavenging ability of whole plants, roots, stems, and leaves from S. ternatum. ABTS (A) and DPPH (B) scavenging curves. The calculated IC50 values for ABTS (C) and DPPH (D). The data are shown as means ± SD (n = 3).
Molecules 27 05698 g002
Figure 3. Assessment of the anti-inflammatory activities of the whole plants, roots, stems, and leaves from S. ternatum. (A) RAW 264.7 cell viability detected through the CCK-8 assay. (B) NO level measurement. (C) IL-6 level measurement. The data are shown as means ± SD (n = 3). **** p < 0.0001 vs. the LPS-stimulated group.
Molecules 27 05698 g003
Figure 4. Spectrum-effect relationship analysis between the phytochemical profile and IL-6 level: (A) Regression coefficient. (B) VIP value.
Molecules 27 05698 g004
Figure 5. (A) Correlation analysis of the binding energy and the coefficient. (BH) Docking patterns of the seven compounds and IL-6. (B) C1; (C) C2; (D) C3; (E) C4; (F) C5; (G) C6; (H) C7.
Molecules 27 05698 g005
Table 1. Extraction yields, total phenols, and total flavonoids of ethanol extracts from S. ternatum whole plants or specific organs.
Plant PartYieldTotal PhenolsTotal Flavonoids
%μg GA/mg Dry Extractμg QE/mg Dry Extract
Whole plants21.39 ± 1.0520.32 ± 1.277.96 ± 0.87
Roots17.99 ± 0.2220.80 ± 0.35 b3.29 ± 0.19 d
Stems39.79 ± 4.9314.49 ± 0.342.51 ± 0.09
Leaves26.19 ± 2.3922.24 ± 0.82 a,b12.87 ± 0.40 b,c
GA: gallic acid; QE: quercetin. Data are shown as the means ± SD (n = 3). a p < 0.05 vs. roots; b p < 0.0001 vs. stems; c p < 0.0001 vs. roots; d p < 0.05 vs. stems.
Table 2. Identification of the main phytochemicals in S. ternatum using HPLC–ESI-Q-TOF-MS/MS.
No.tR (min)IdentificationFormulaSelected IonMeasured m/zError (ppm)MS2
C116.188Quercetin 3-O-glucosyl-(1→2)-rhamnoside-7-O-glucosideC33H40O21[M + H]+773.21420.9611.1621, 465.1041, 303.0500
[M − H]771.19940.6609.1544, 462.0839, 301.0360, 300.0283, 299.0198
C216.489Quercetin 3-O-rhamnoside-7-O-glucosideC27H30O16[M + H]+611.1606−0.1465.1004, 303.0486
[M − H]609.1461−0.7463.0943, 462.0843, 447.0981, 301.0364, 300.0283, 299.0203
C316.925Kaempferol 3-O-glucosyl-(1→2)-rhamnoside-7-O-glucosyl-(1→2)-glucosideC39H50O25[M + H]+919.27352.3757.2162, 611.1598, 449.1068, 433.1130, 287.0541
[M − H]917.25781.0593.1622
C418.026Kaempferol 3-O-glucosyl-(1→2)-rhamnoside-7-O-glucosideC33H40O20[M + H]+757.21920.8595.1667, 449.1080, 287.0545
[M − H]755.20440.5593.1579, 446.0886, 285.0401, 284.0327, 283.0251
C522.354Kaempferol 3-O-(2,3-di-O-glucosyl)-rhamnoside-7-O-rhamnosideC39H50O24[M + H]+903.27761.2741.2276, 595.1672, 433.1132, 287.0551
[M − H]901.26291.1755.2154, 284.0326
C623.036Kaempferol 3-O-glucosyl-(1→2)-rhamnoside-7-O-rhamnosideC33H40O19[M + H]+741.22511.9433.1141, 287.0552
[M − H]739.20950.5593.1583, 430.0932, 413.0913, 285.0401, 284.0327, 283.0248
C724.855Kaempferol 3-O-[glucosyl-(1→4)]-[6-O-[4-hydroxy-(E)-cinnamoyl]-glucosyl-(1→3)]-6-O-[4-hydroxy-(E)-cinnamoyl]-glucosyl-(1→2)-rhamnosideC57H62O29[M + H]+1211.35246.1903.2617, 763.2479, 595.1625, 455.1514, 449.1094, 419.1353, 309.0975, 287.0550
[M − H]1209.33241.71047.3040, 901.2650
Table 3. Docking results between the main compounds in S. ternatum and IL-6.
No.PubChem CIDBinding Energy (kcal/mol)
C174978226−3.68
C214484601−6.60
C378100944−2.33
C474978107−4.96
C578100943−1.86
C6162950015−5.33
C778100892−1.10
Publisher’s Note: MDPI stays neutral with regard to jurisdictional claims in published maps and institutional affiliations.

