
13C CP MAS NMR and DFT Studies of 6-Chromanyl Ethereal Derivatives †


Abstract
:1. Introduction
2. Results and Discussion
2.1. 1H and 13C NMR
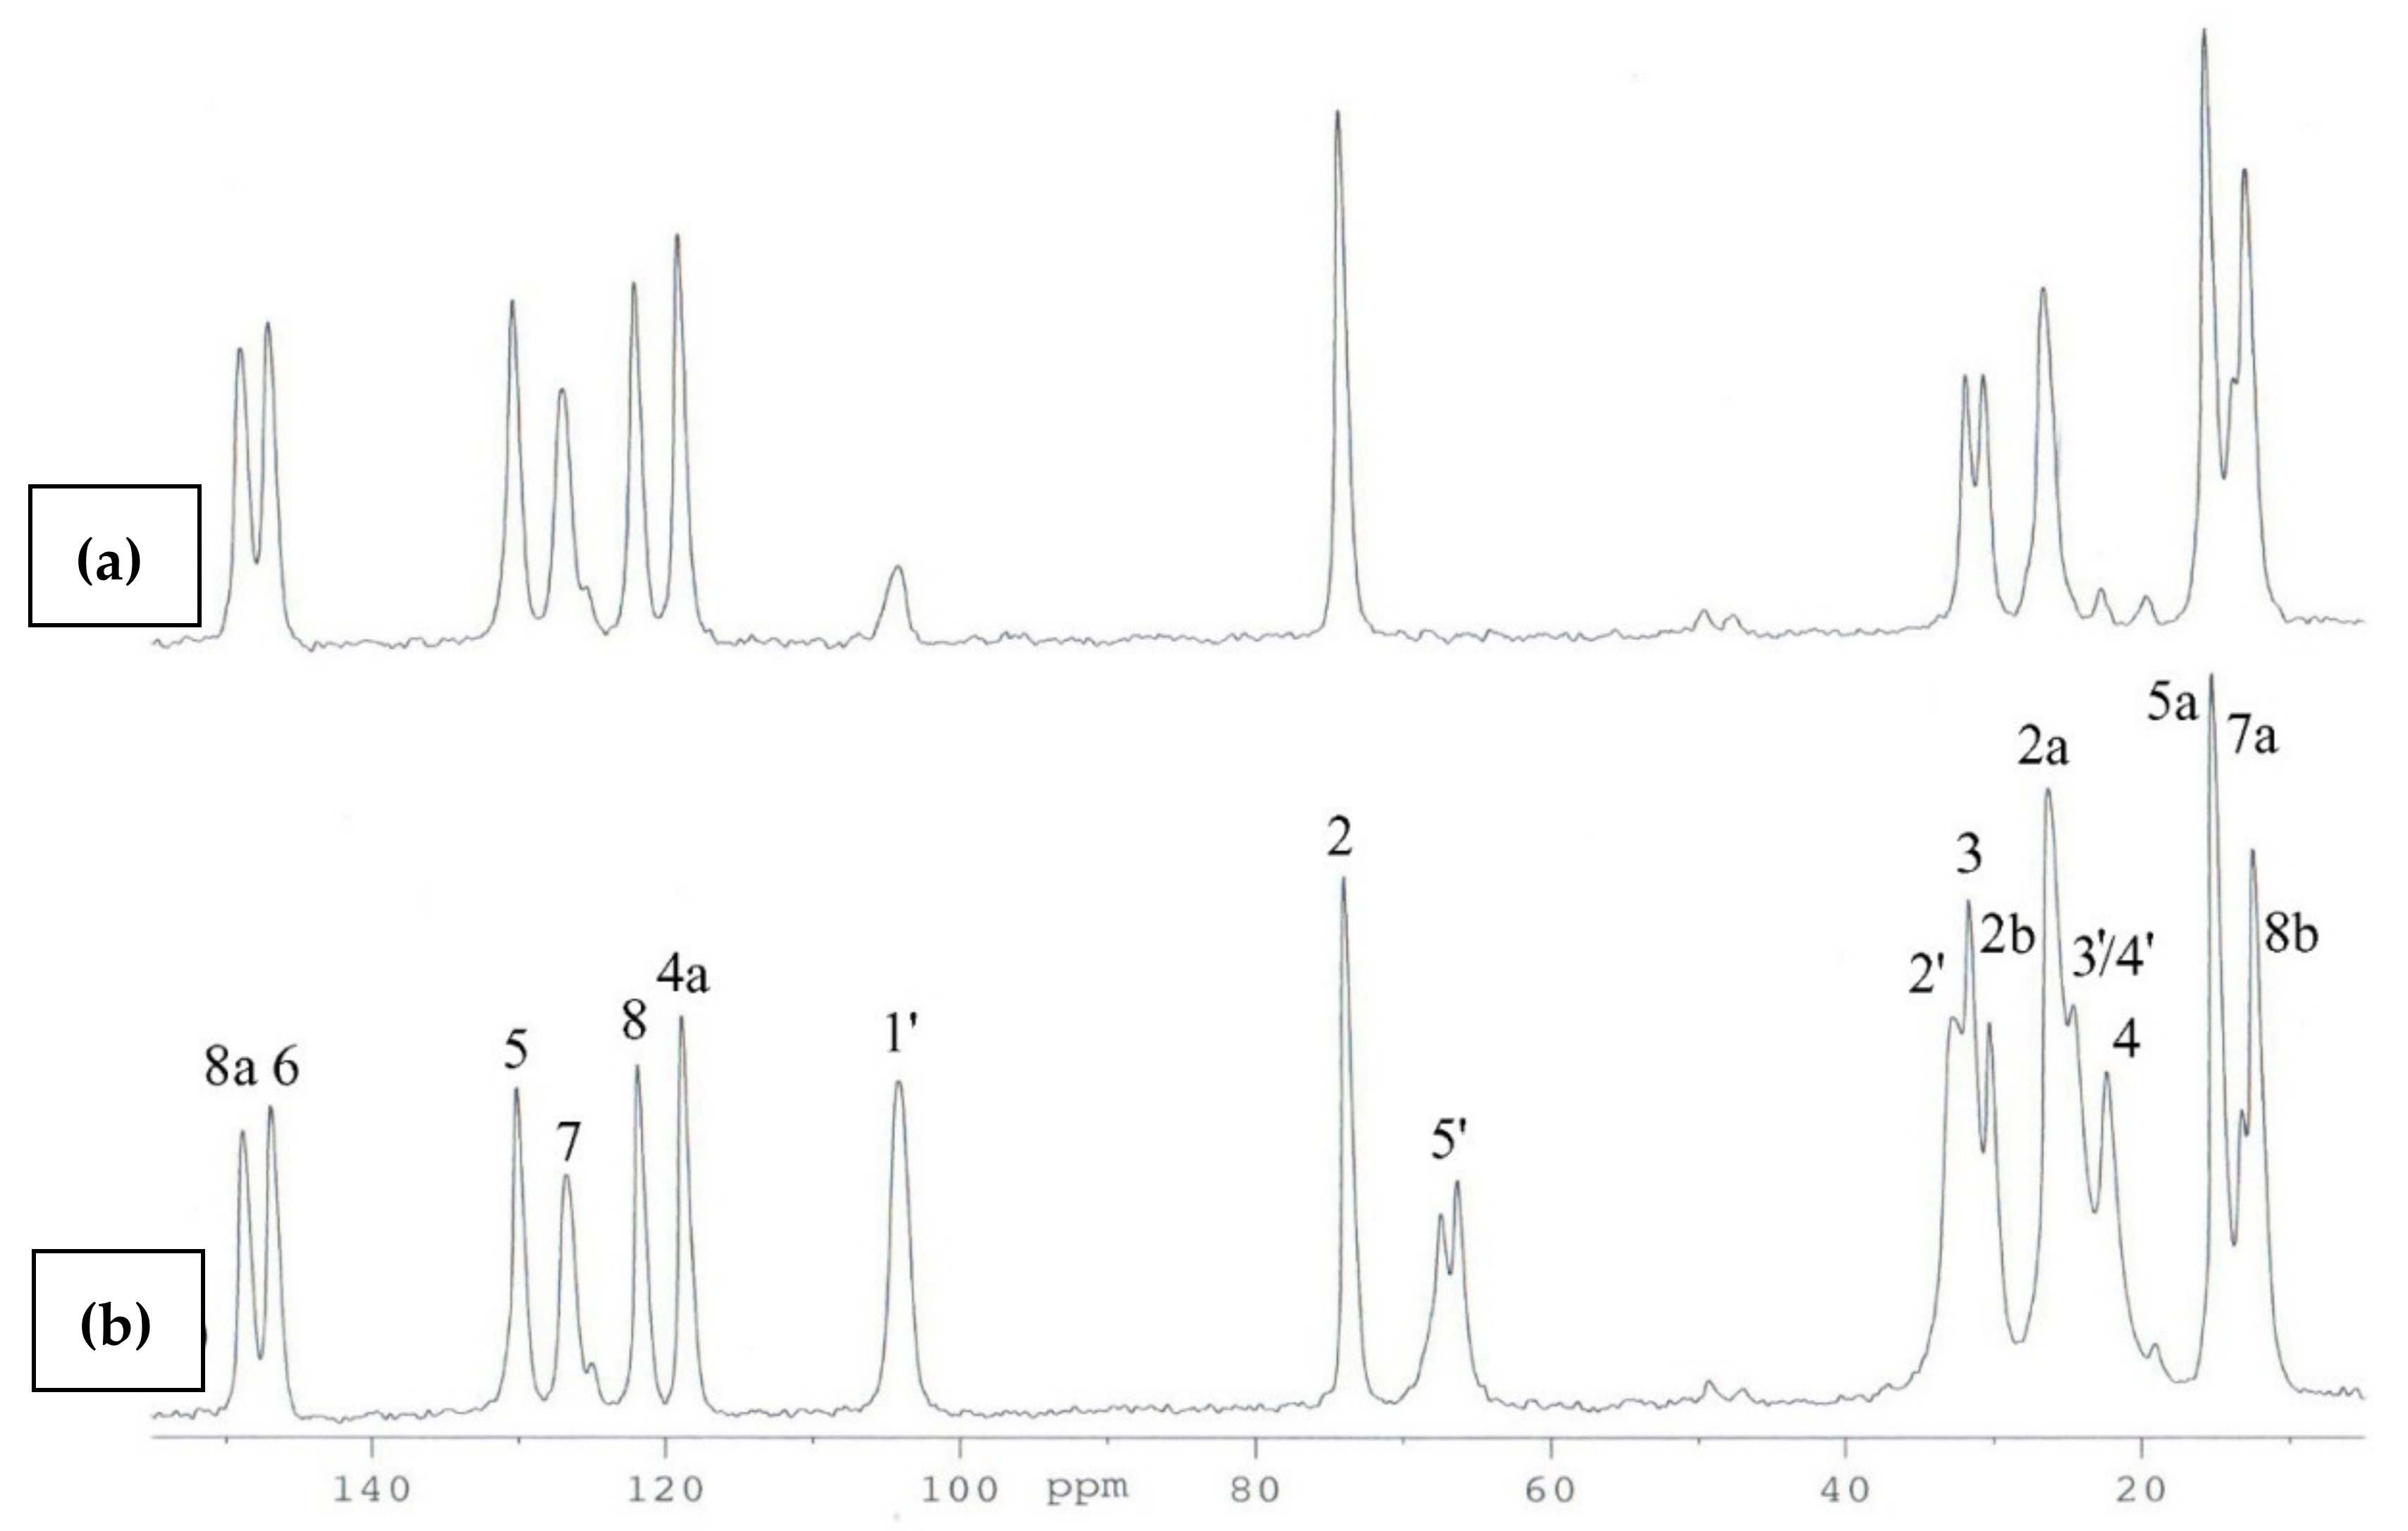
2.2. 13C CP MAS NMR
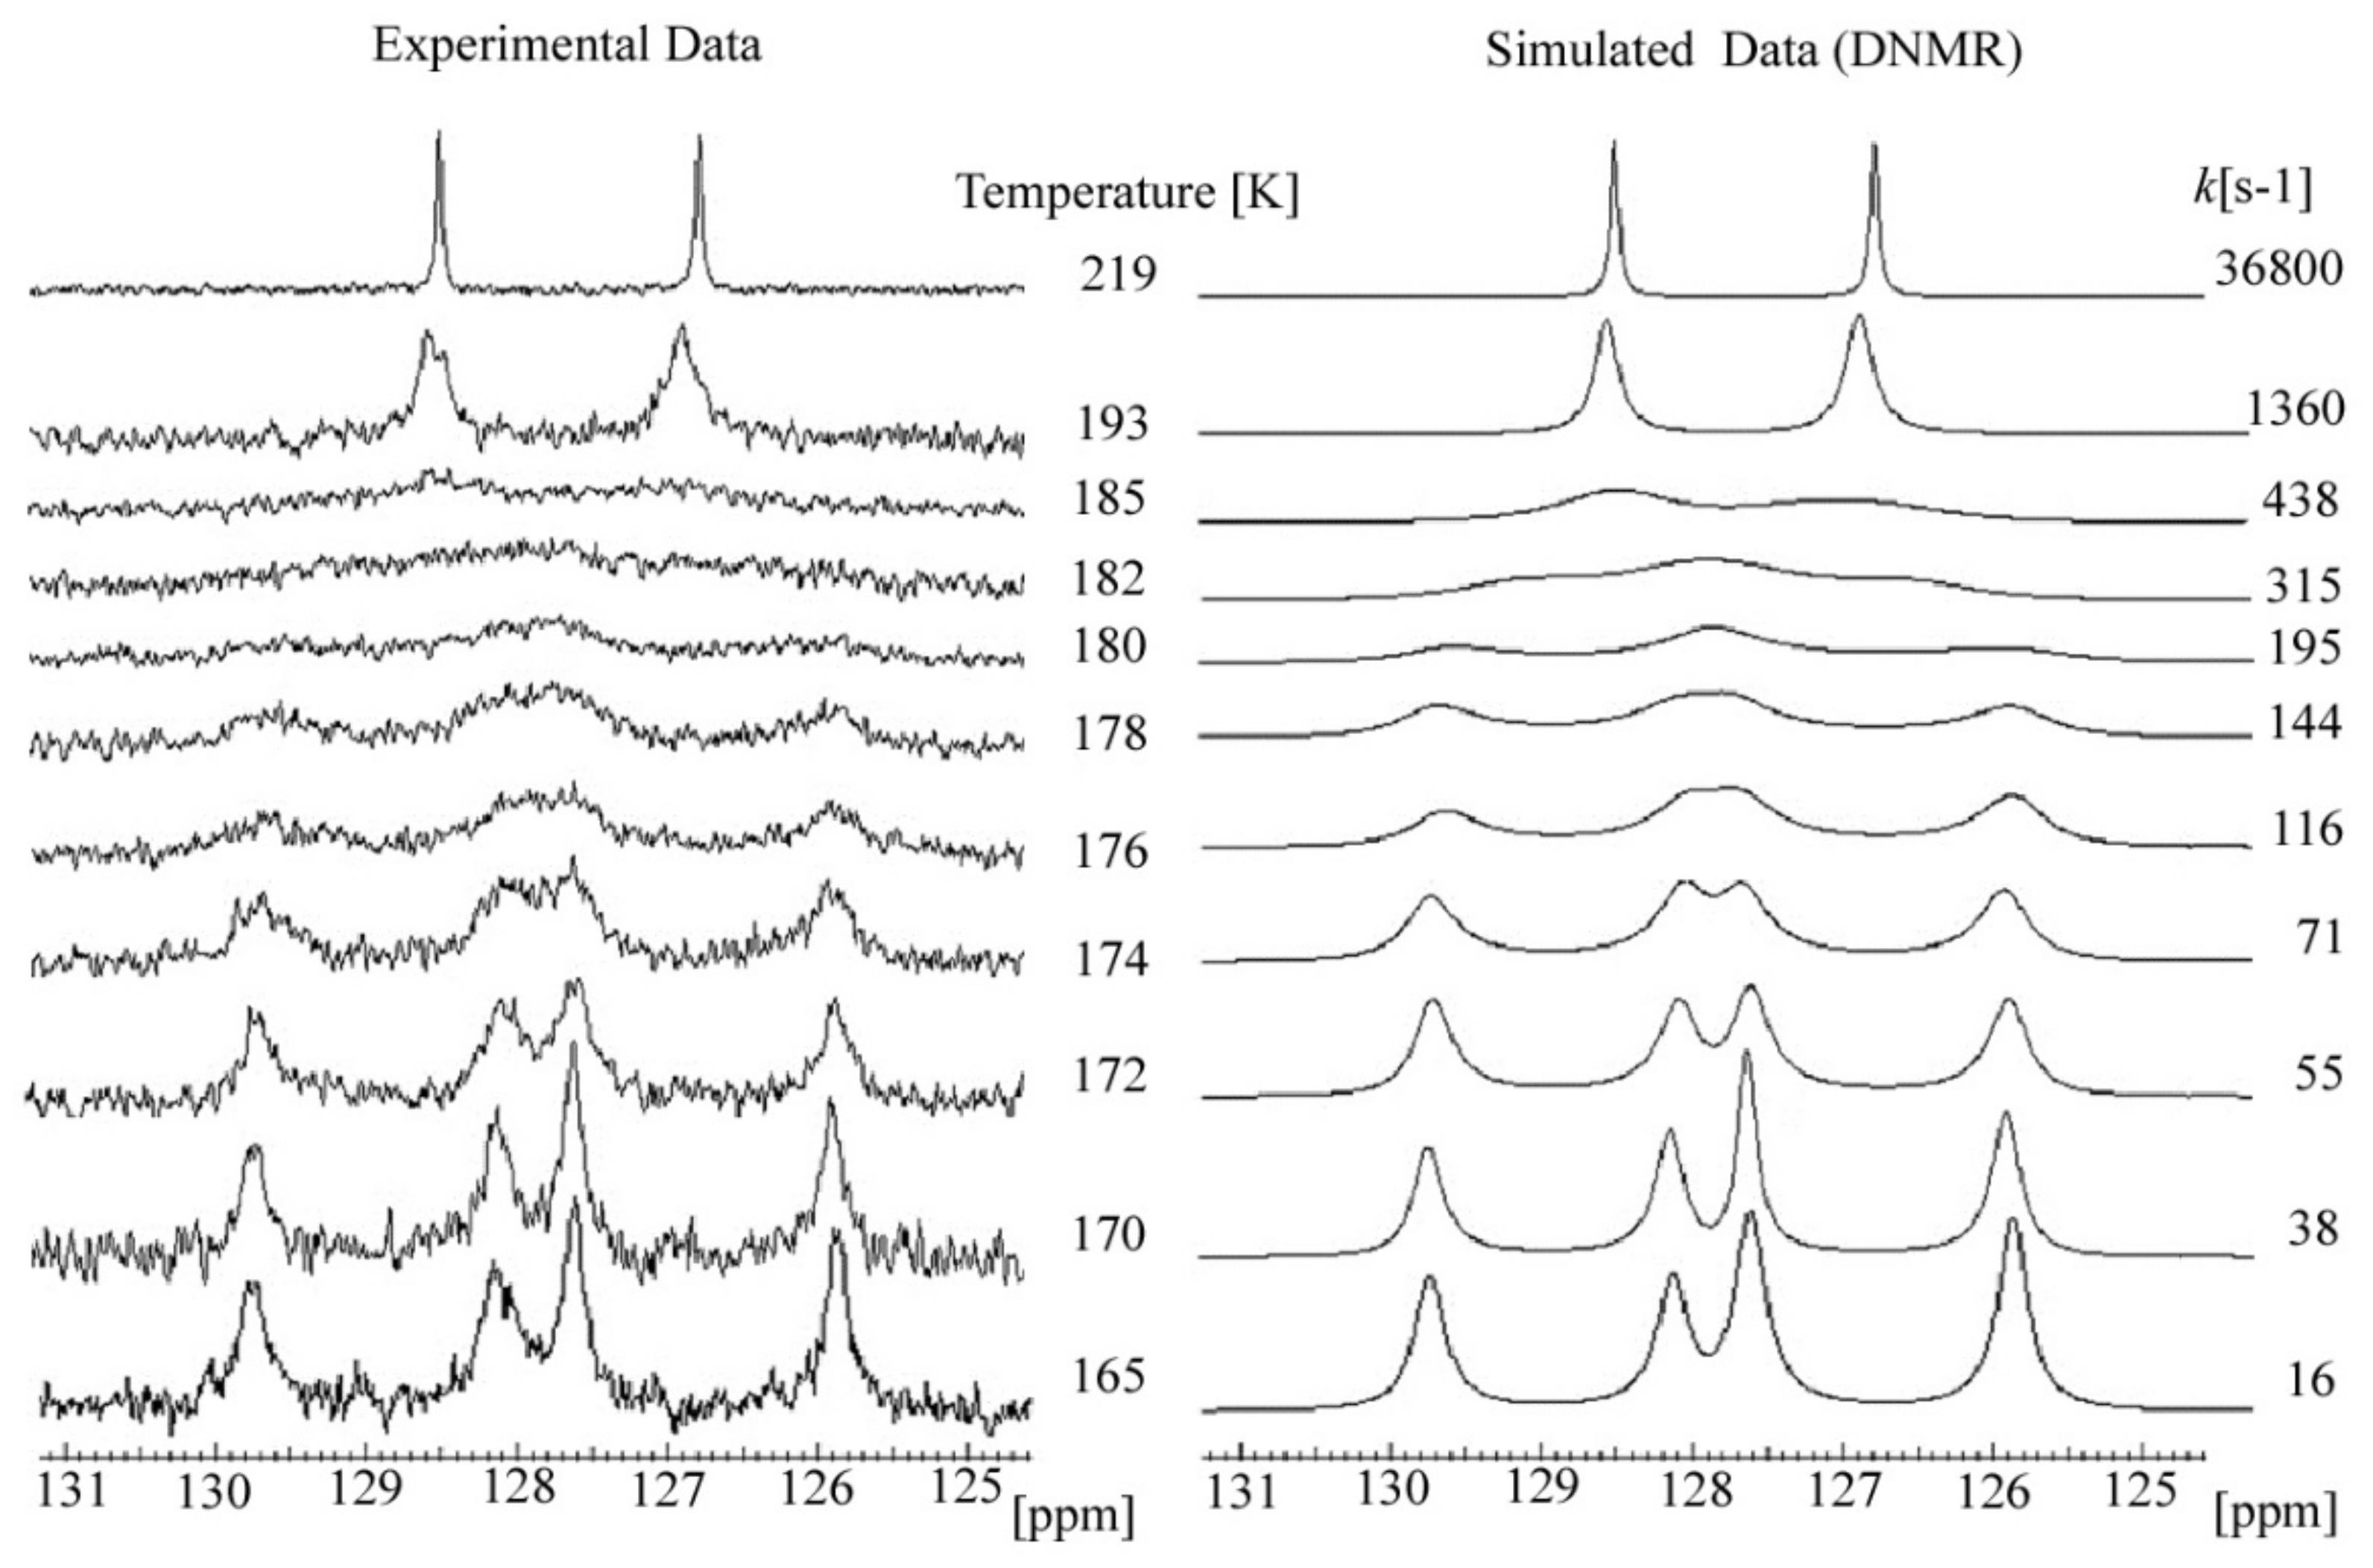
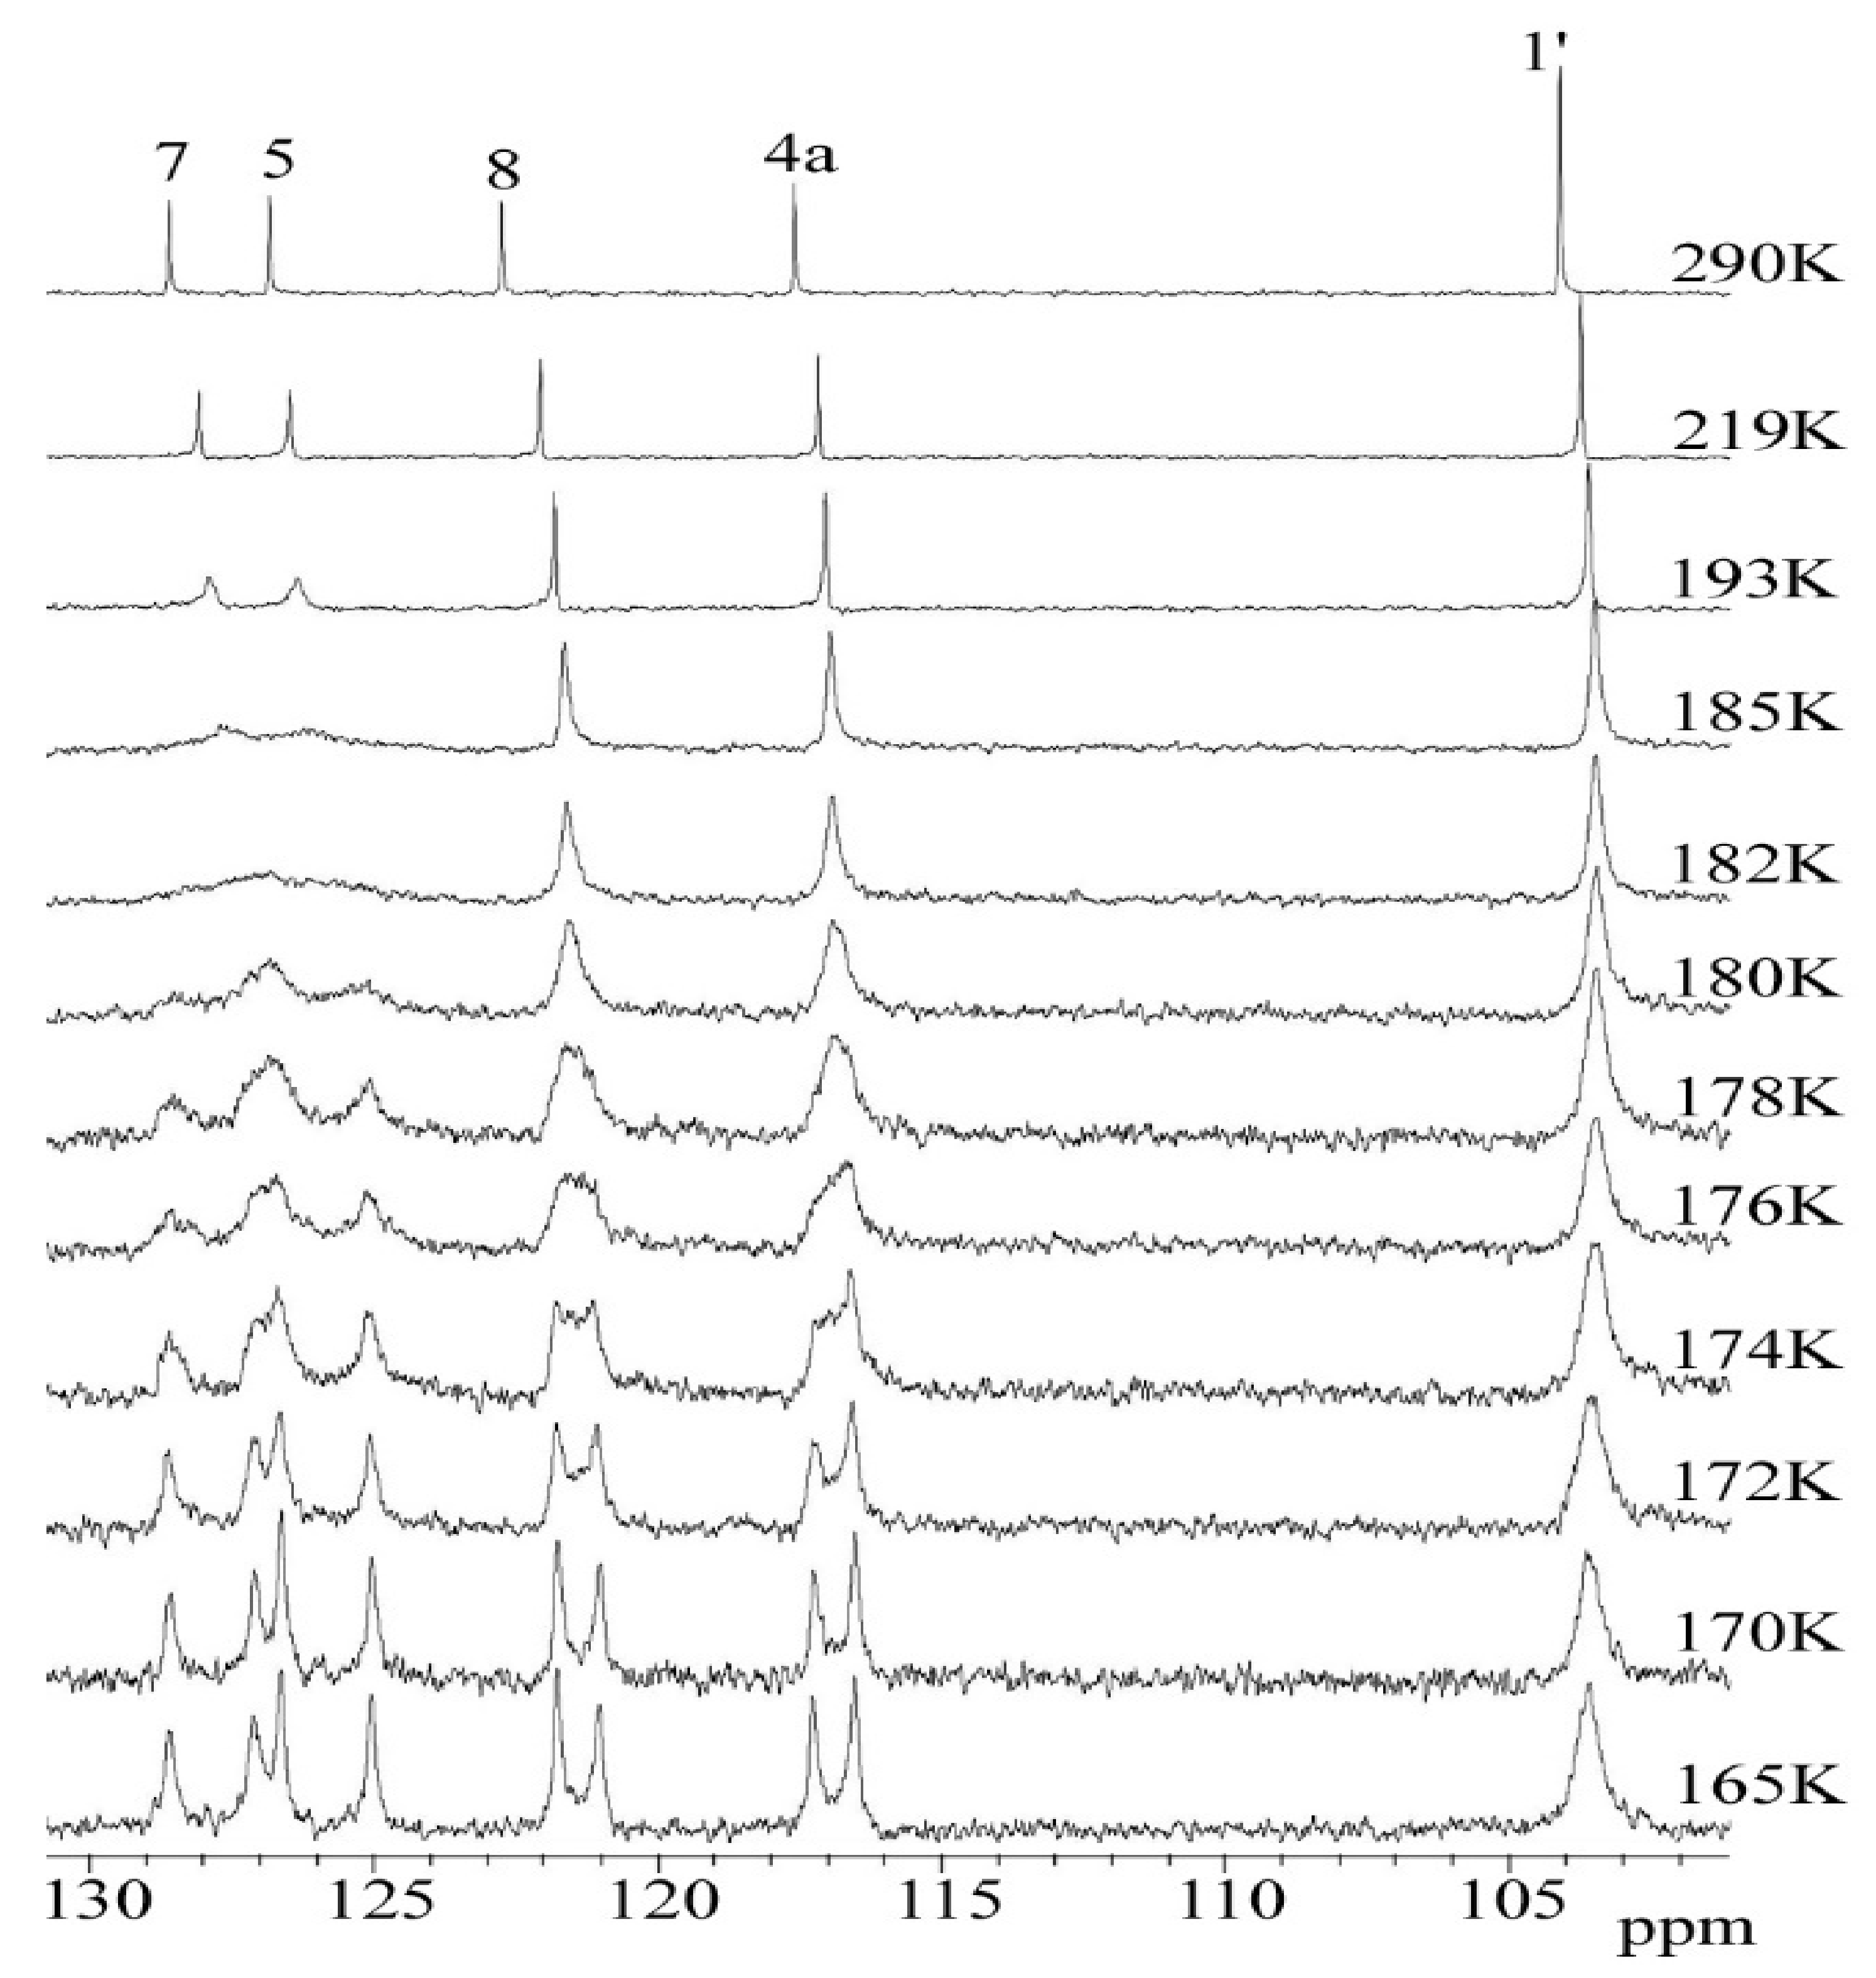
2.3. C DNMR Study
3. Materials and Methods
3.1. Synthesis
3.2. NMR Analysis
3.3. X-ray Diffraction Measurements
3.4. DFT Calculations for Isolated Molecules
3.5. Periodic DFT Calculations for 3
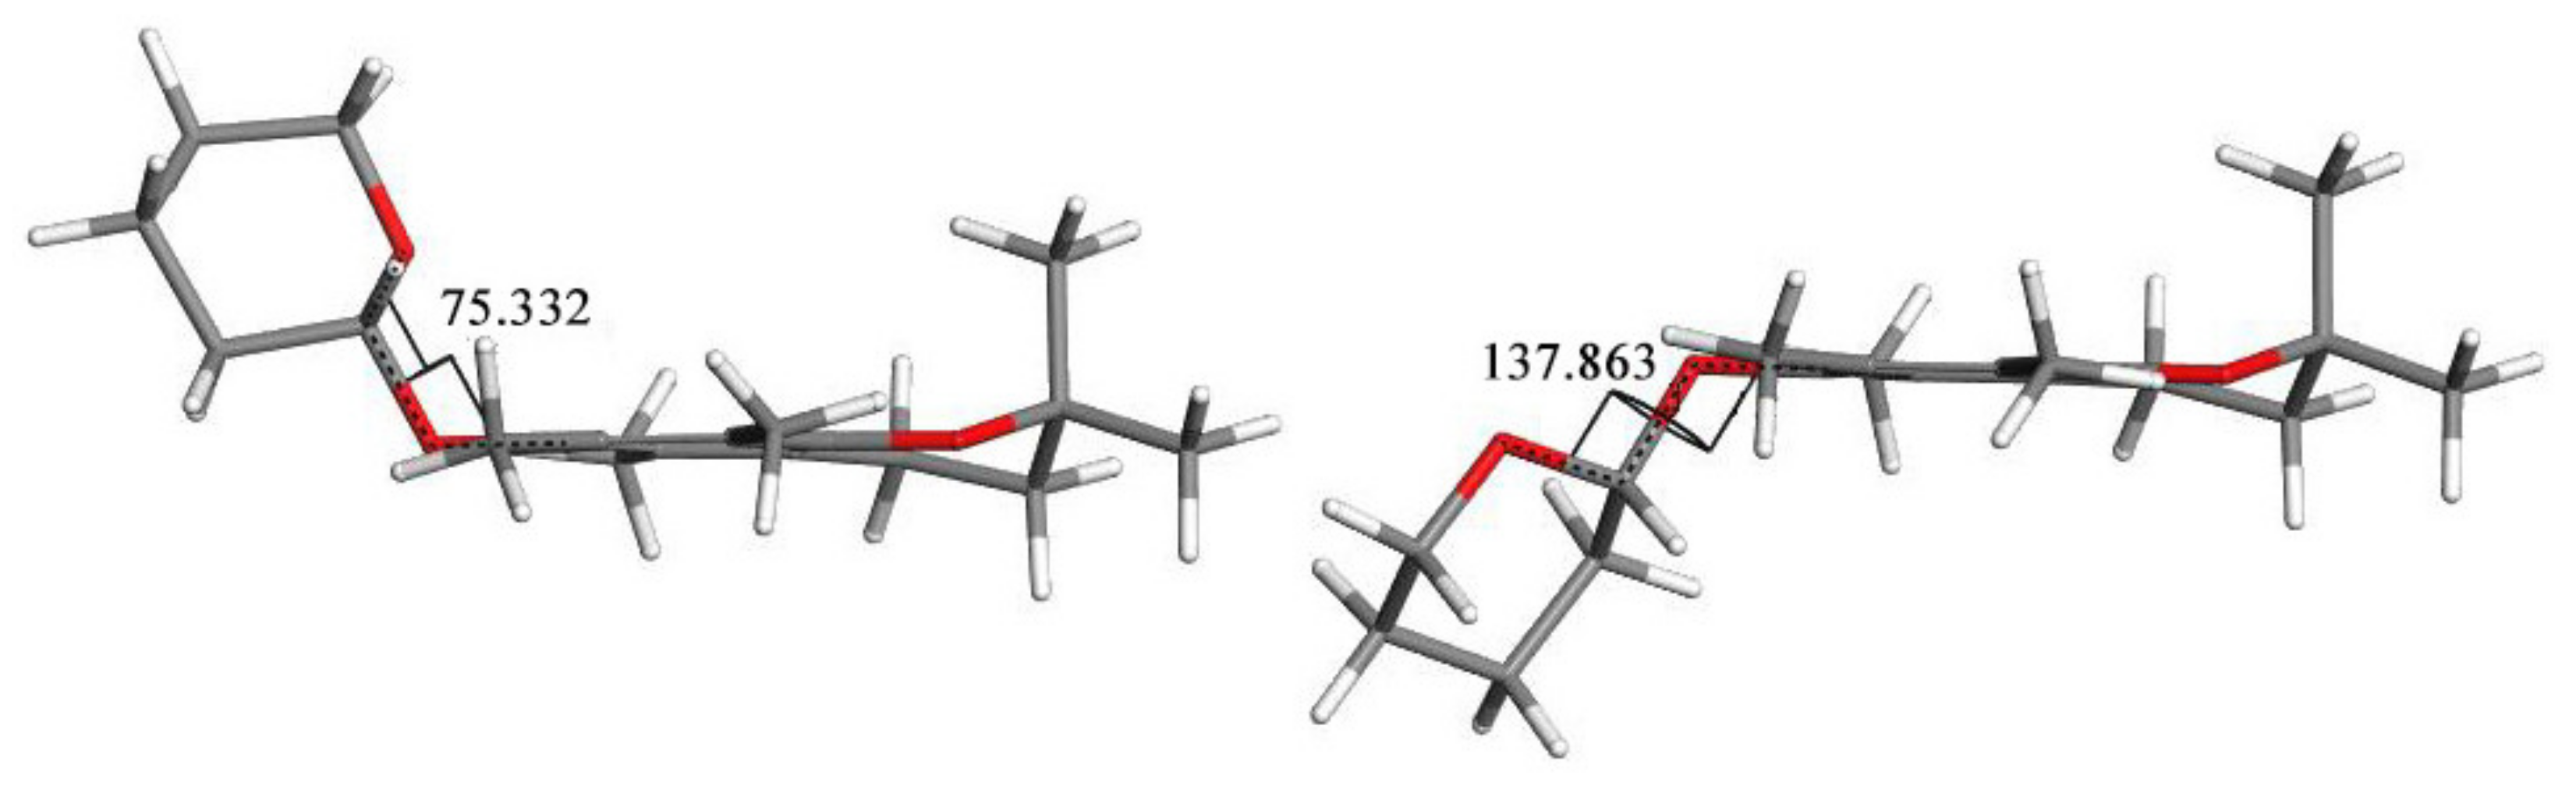
3.6. Conformers Calculations
4. Conclusions
- -
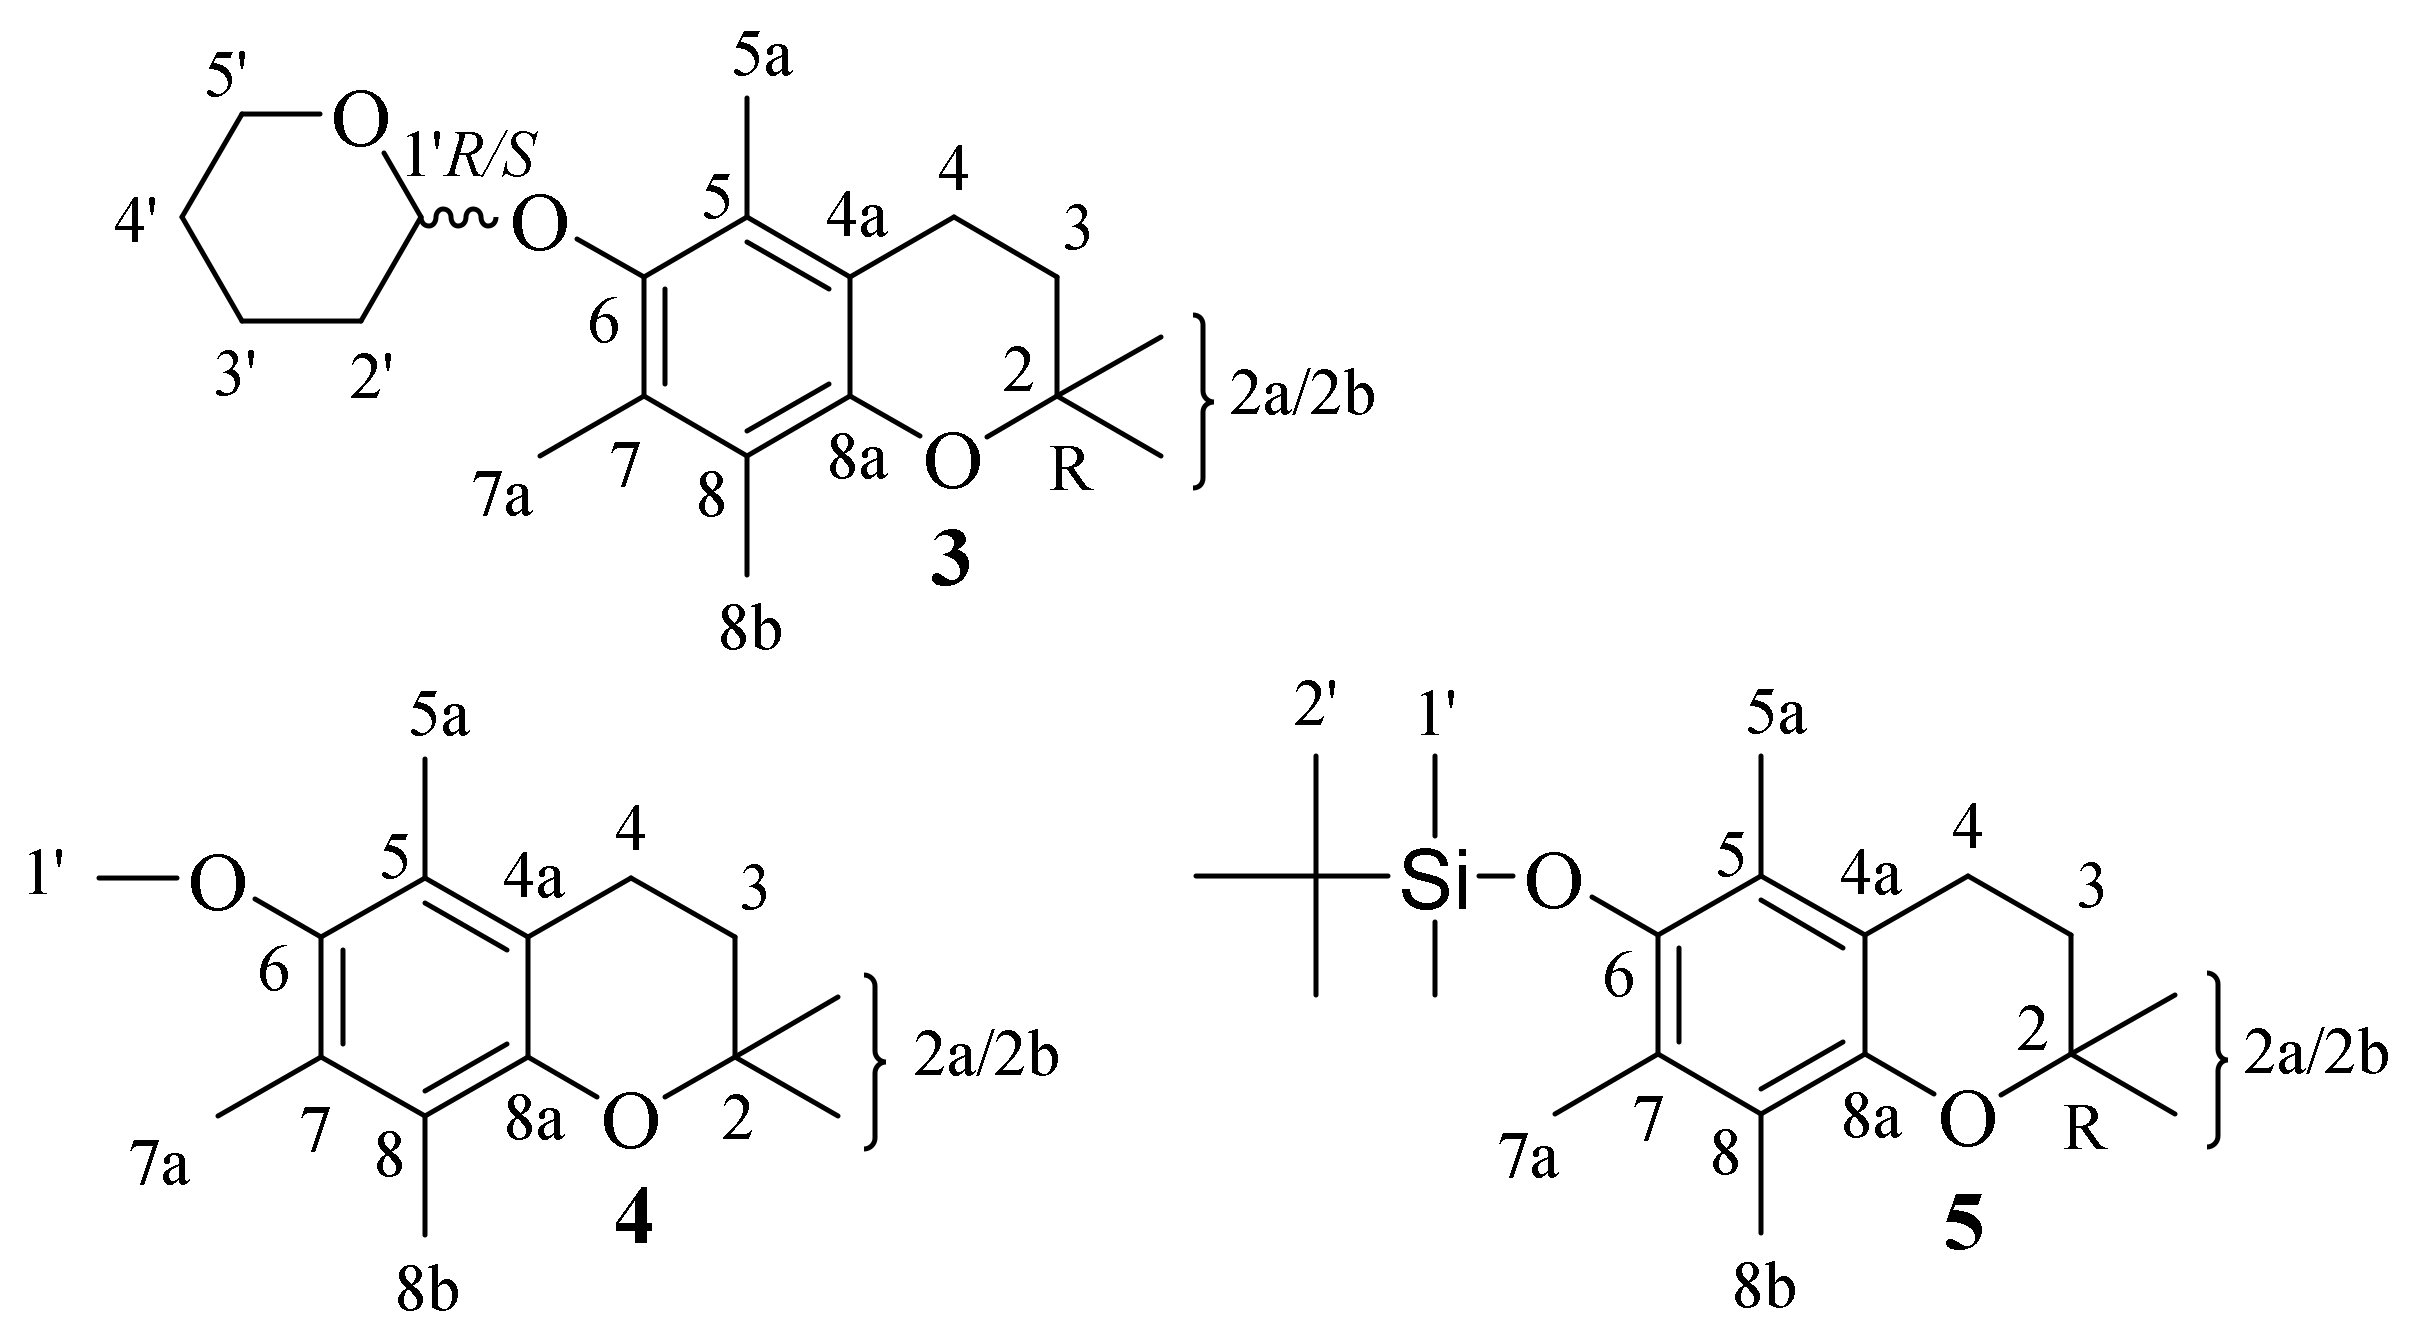
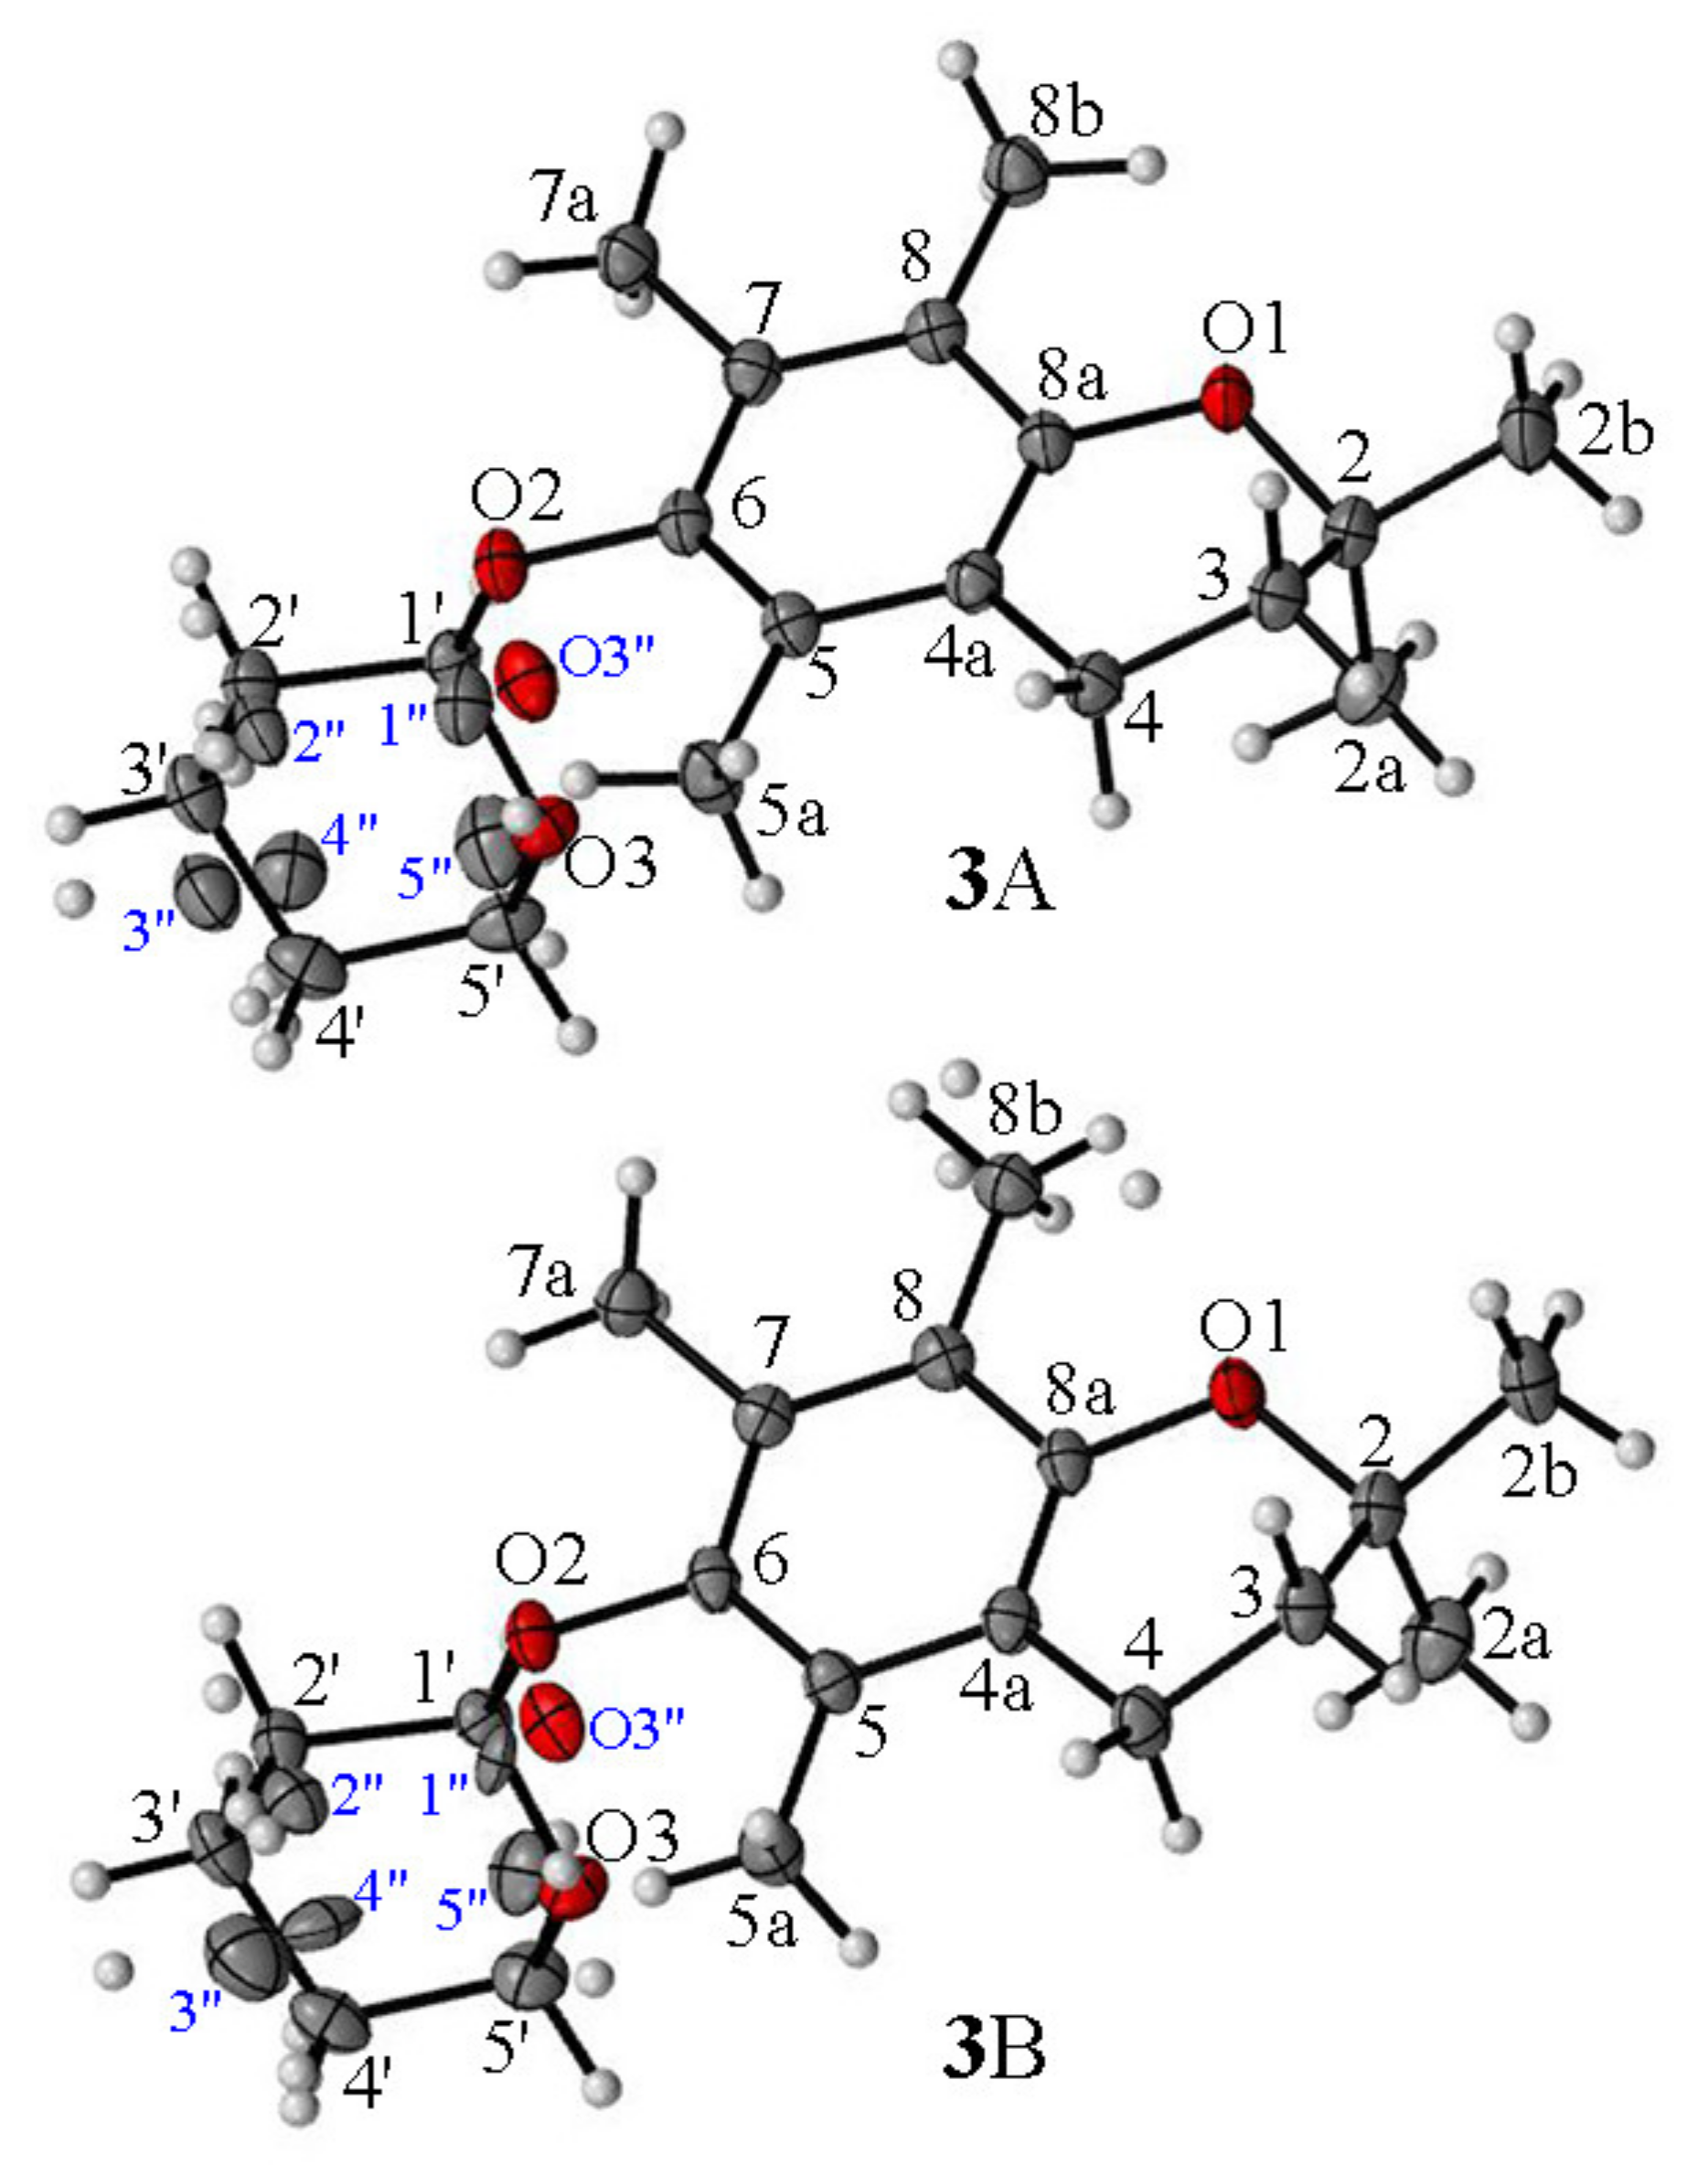
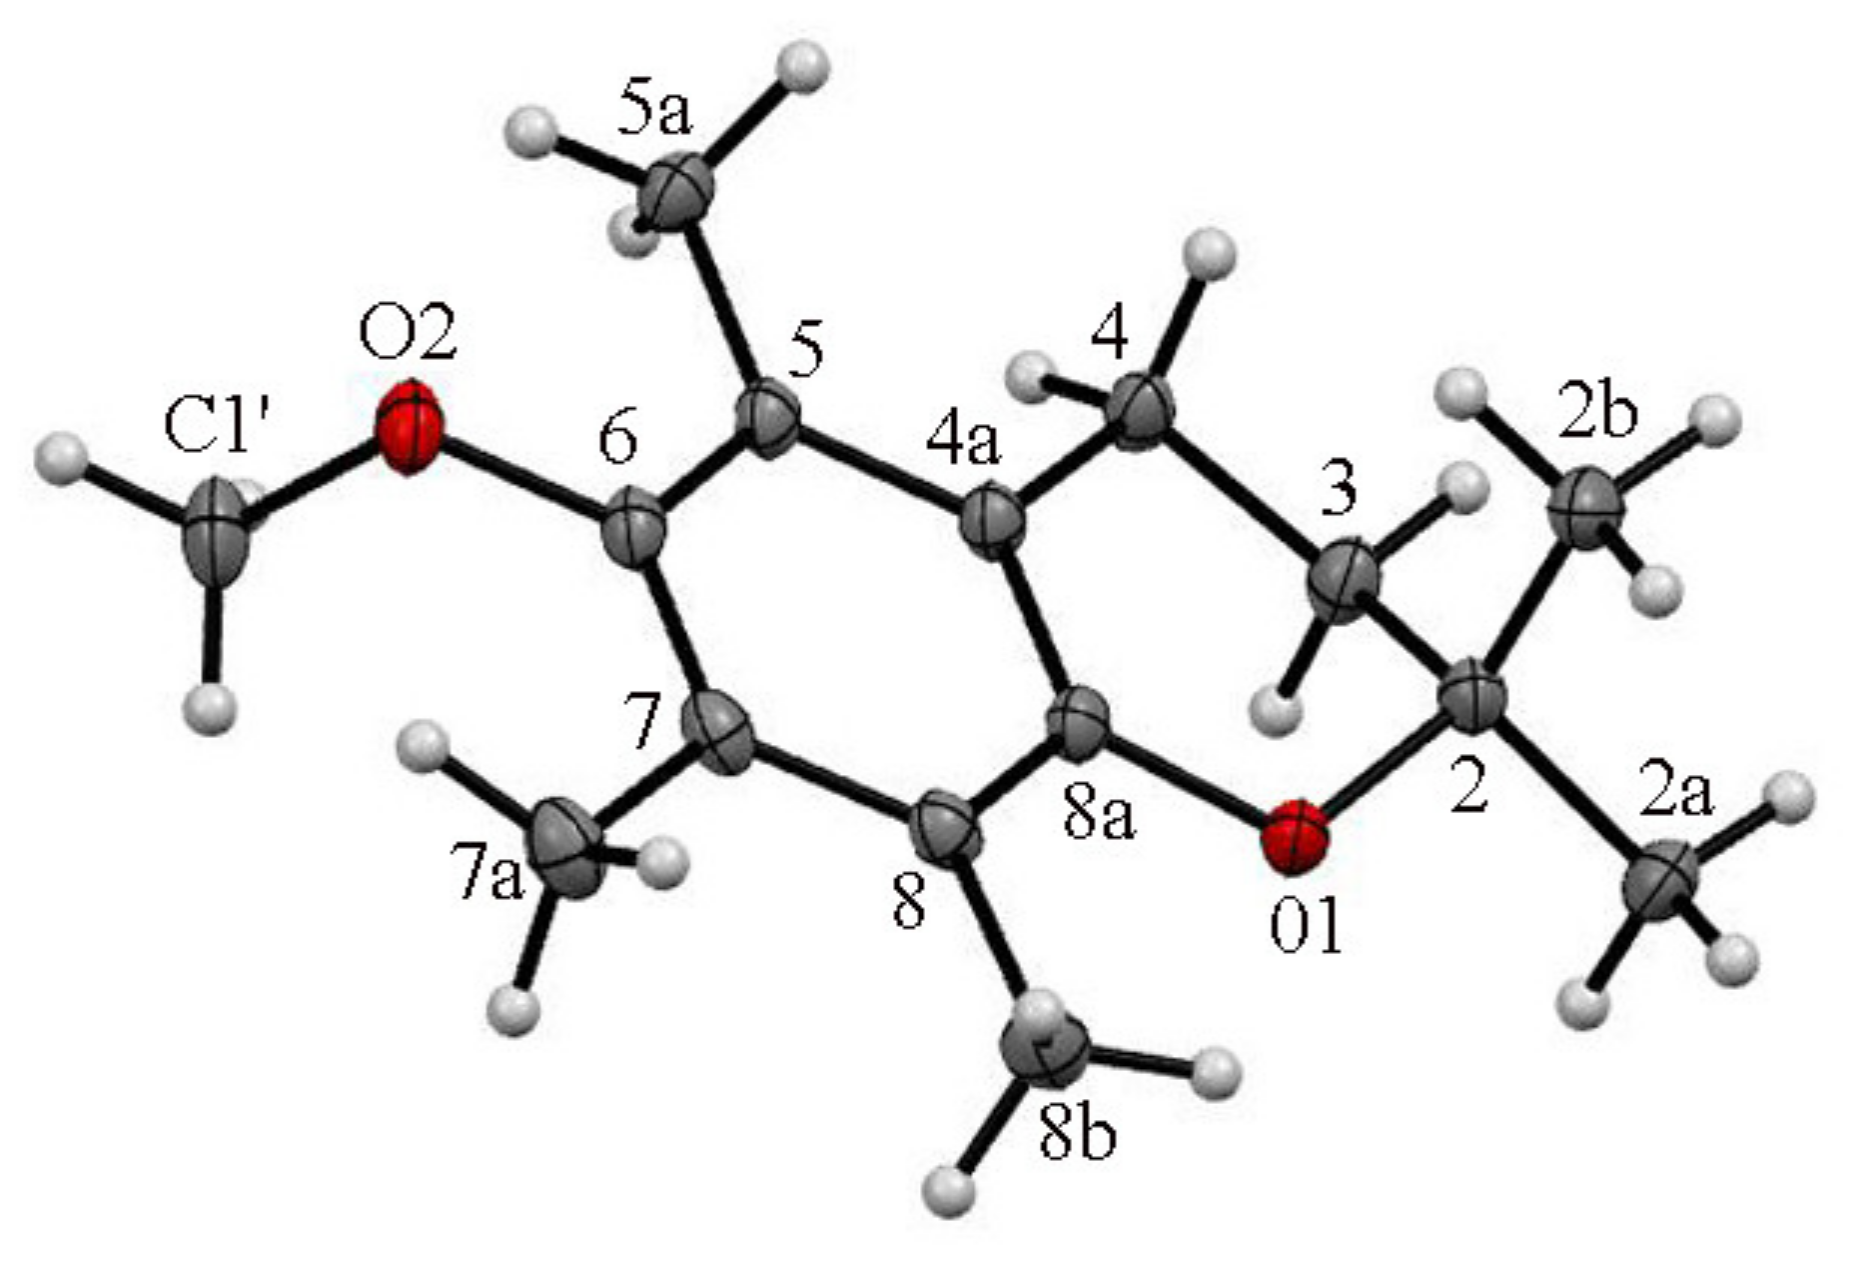
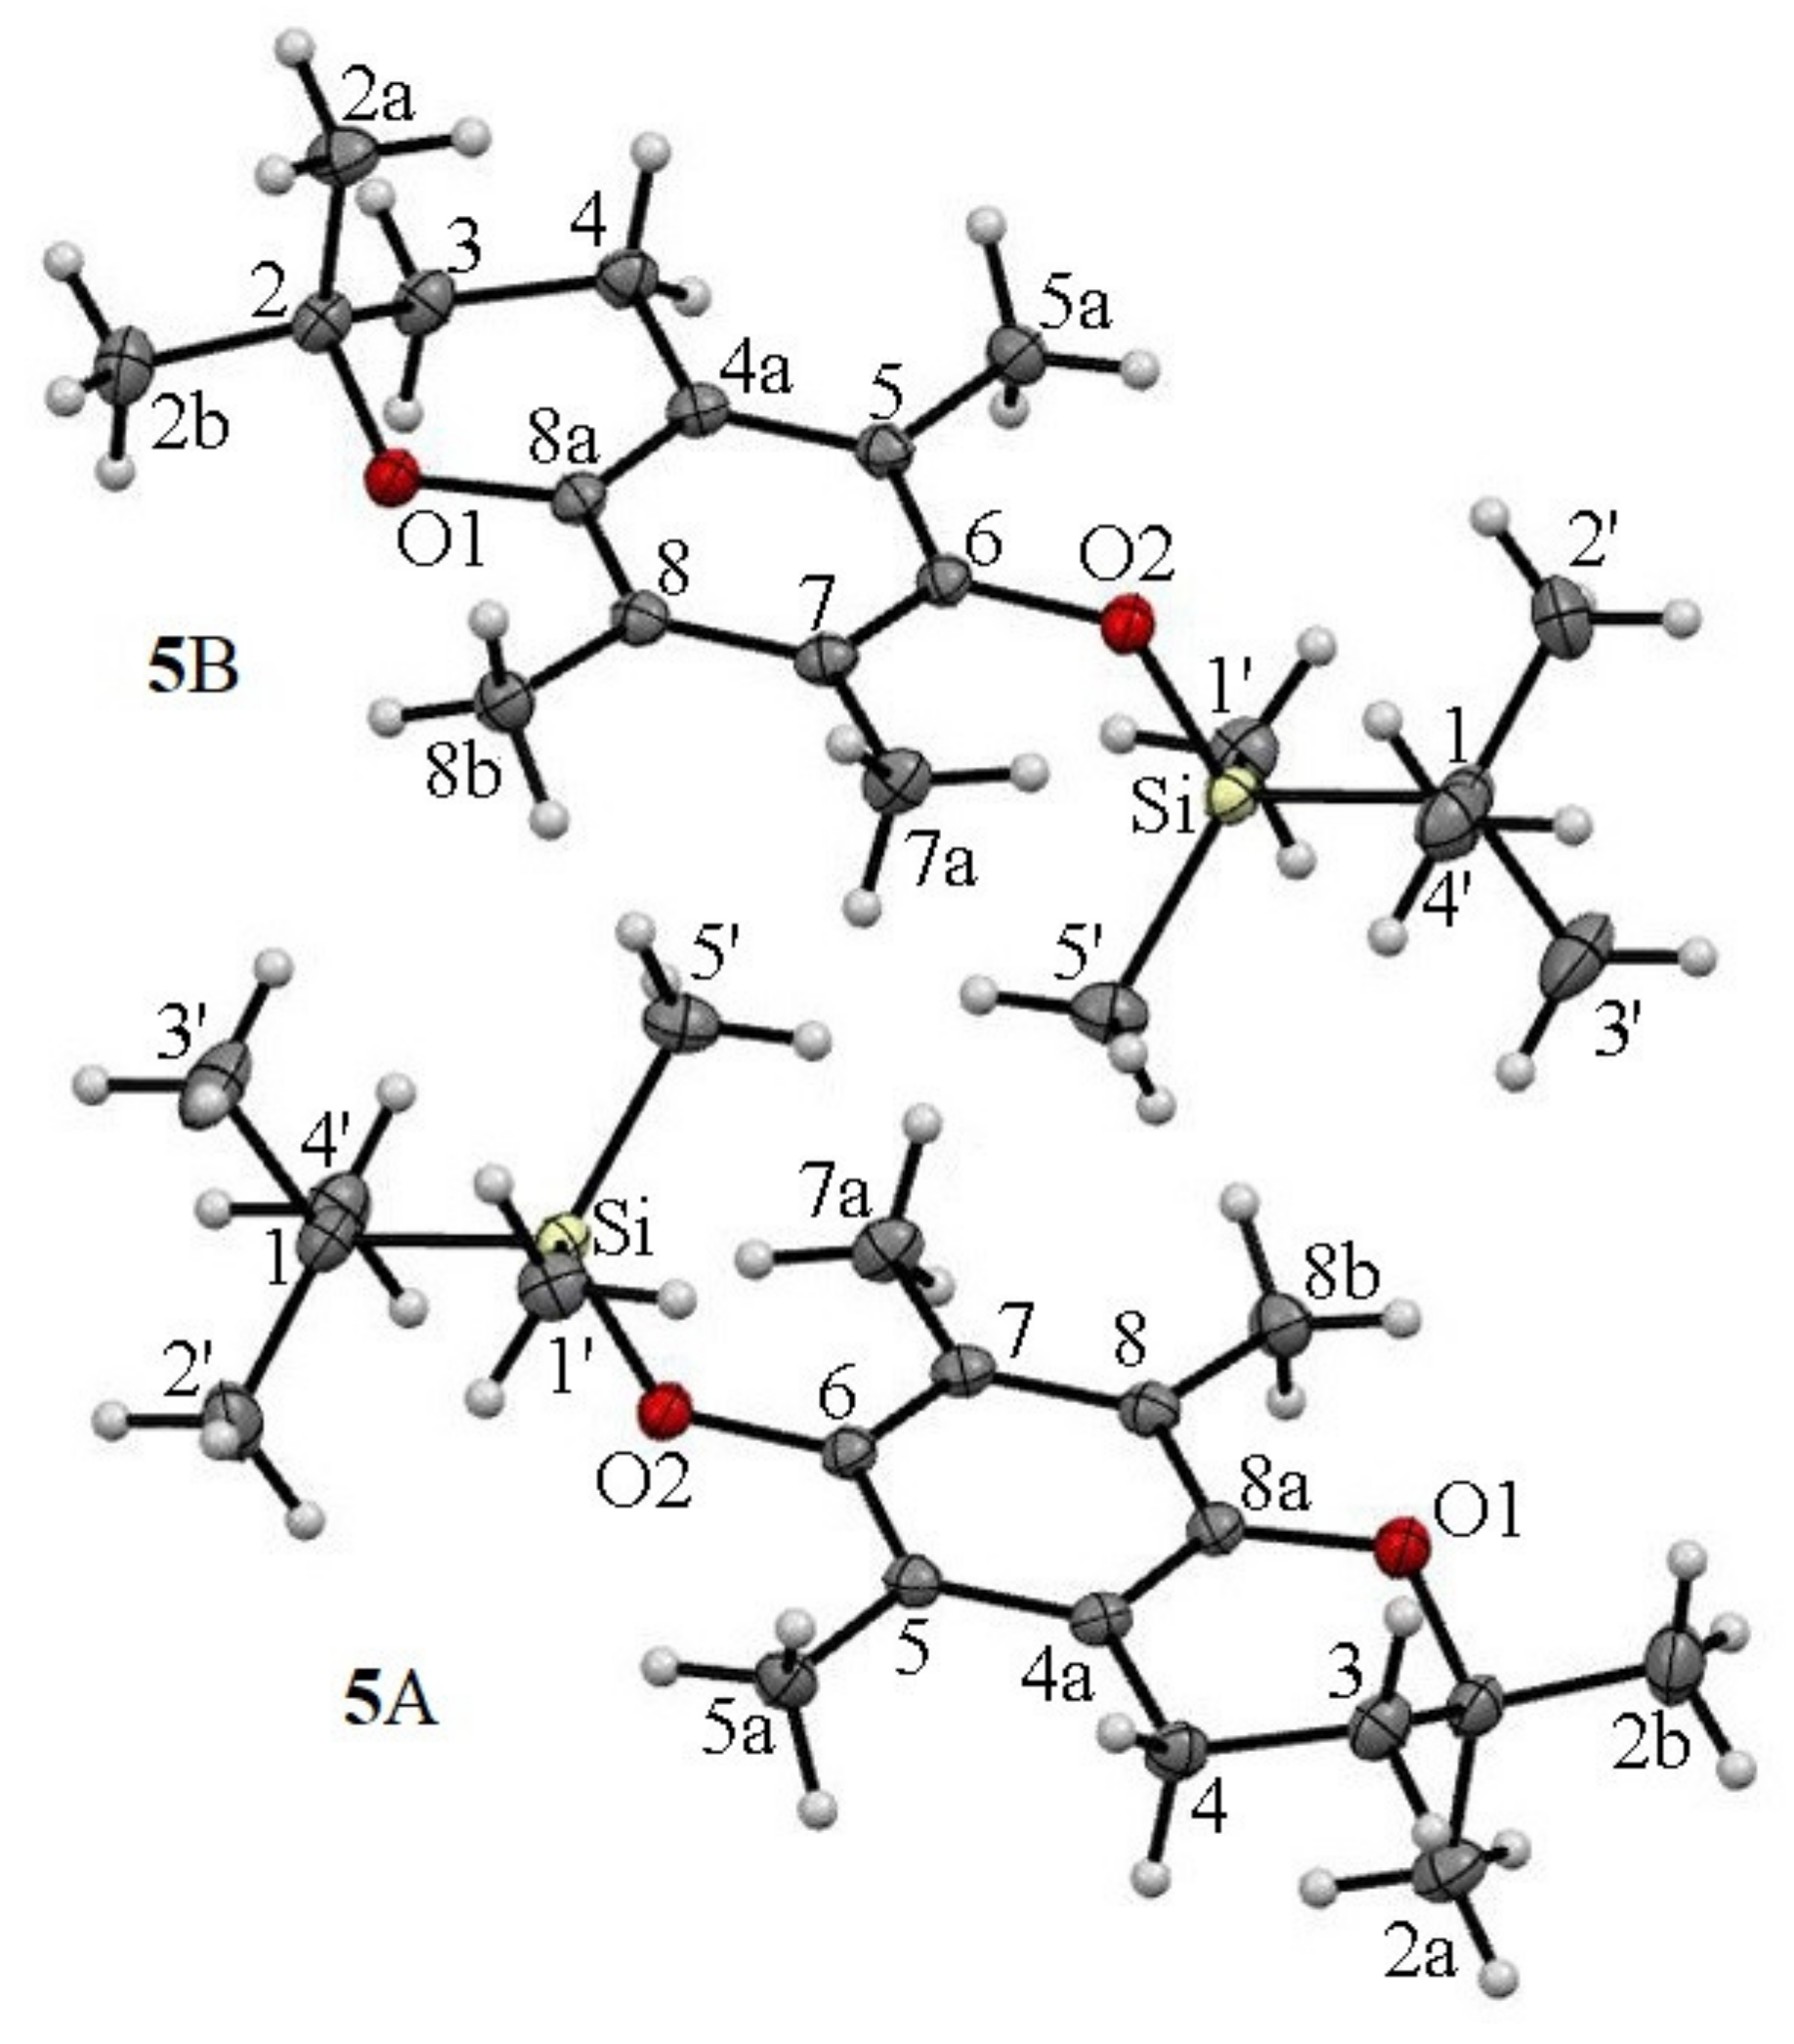
- For the first time, 2,2,5,7,8-pentamethylchroman-6-oles: methyl (4), TBDMS (5) and THP (3) ether XRD structures were described;
- -
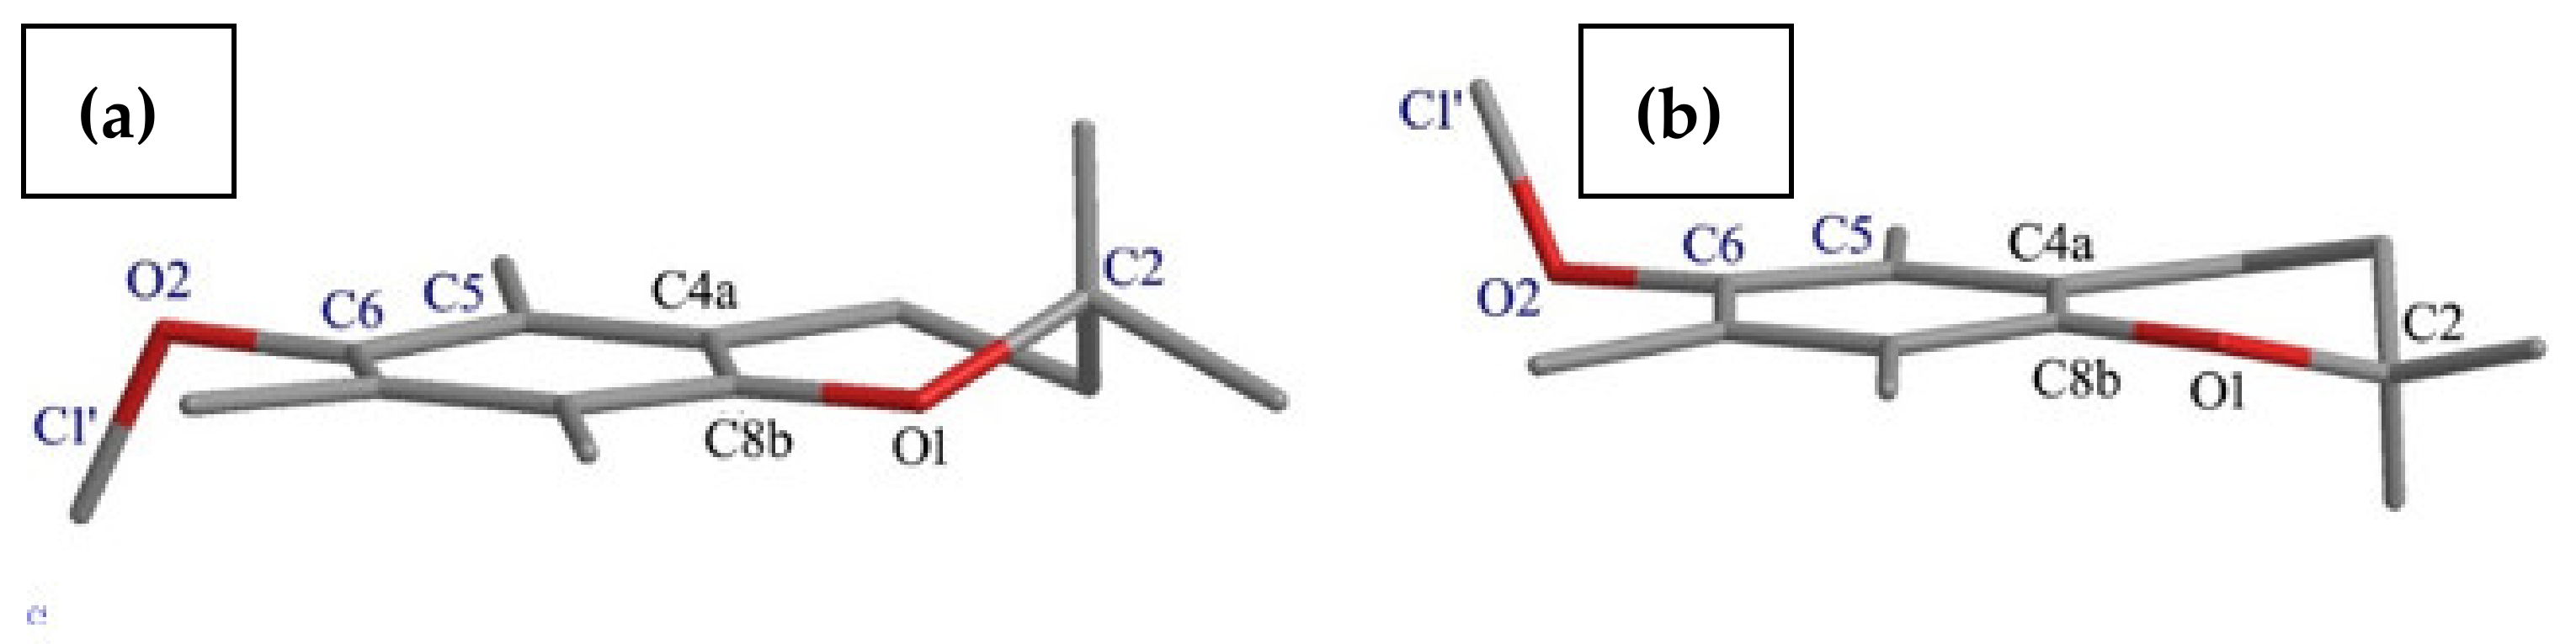
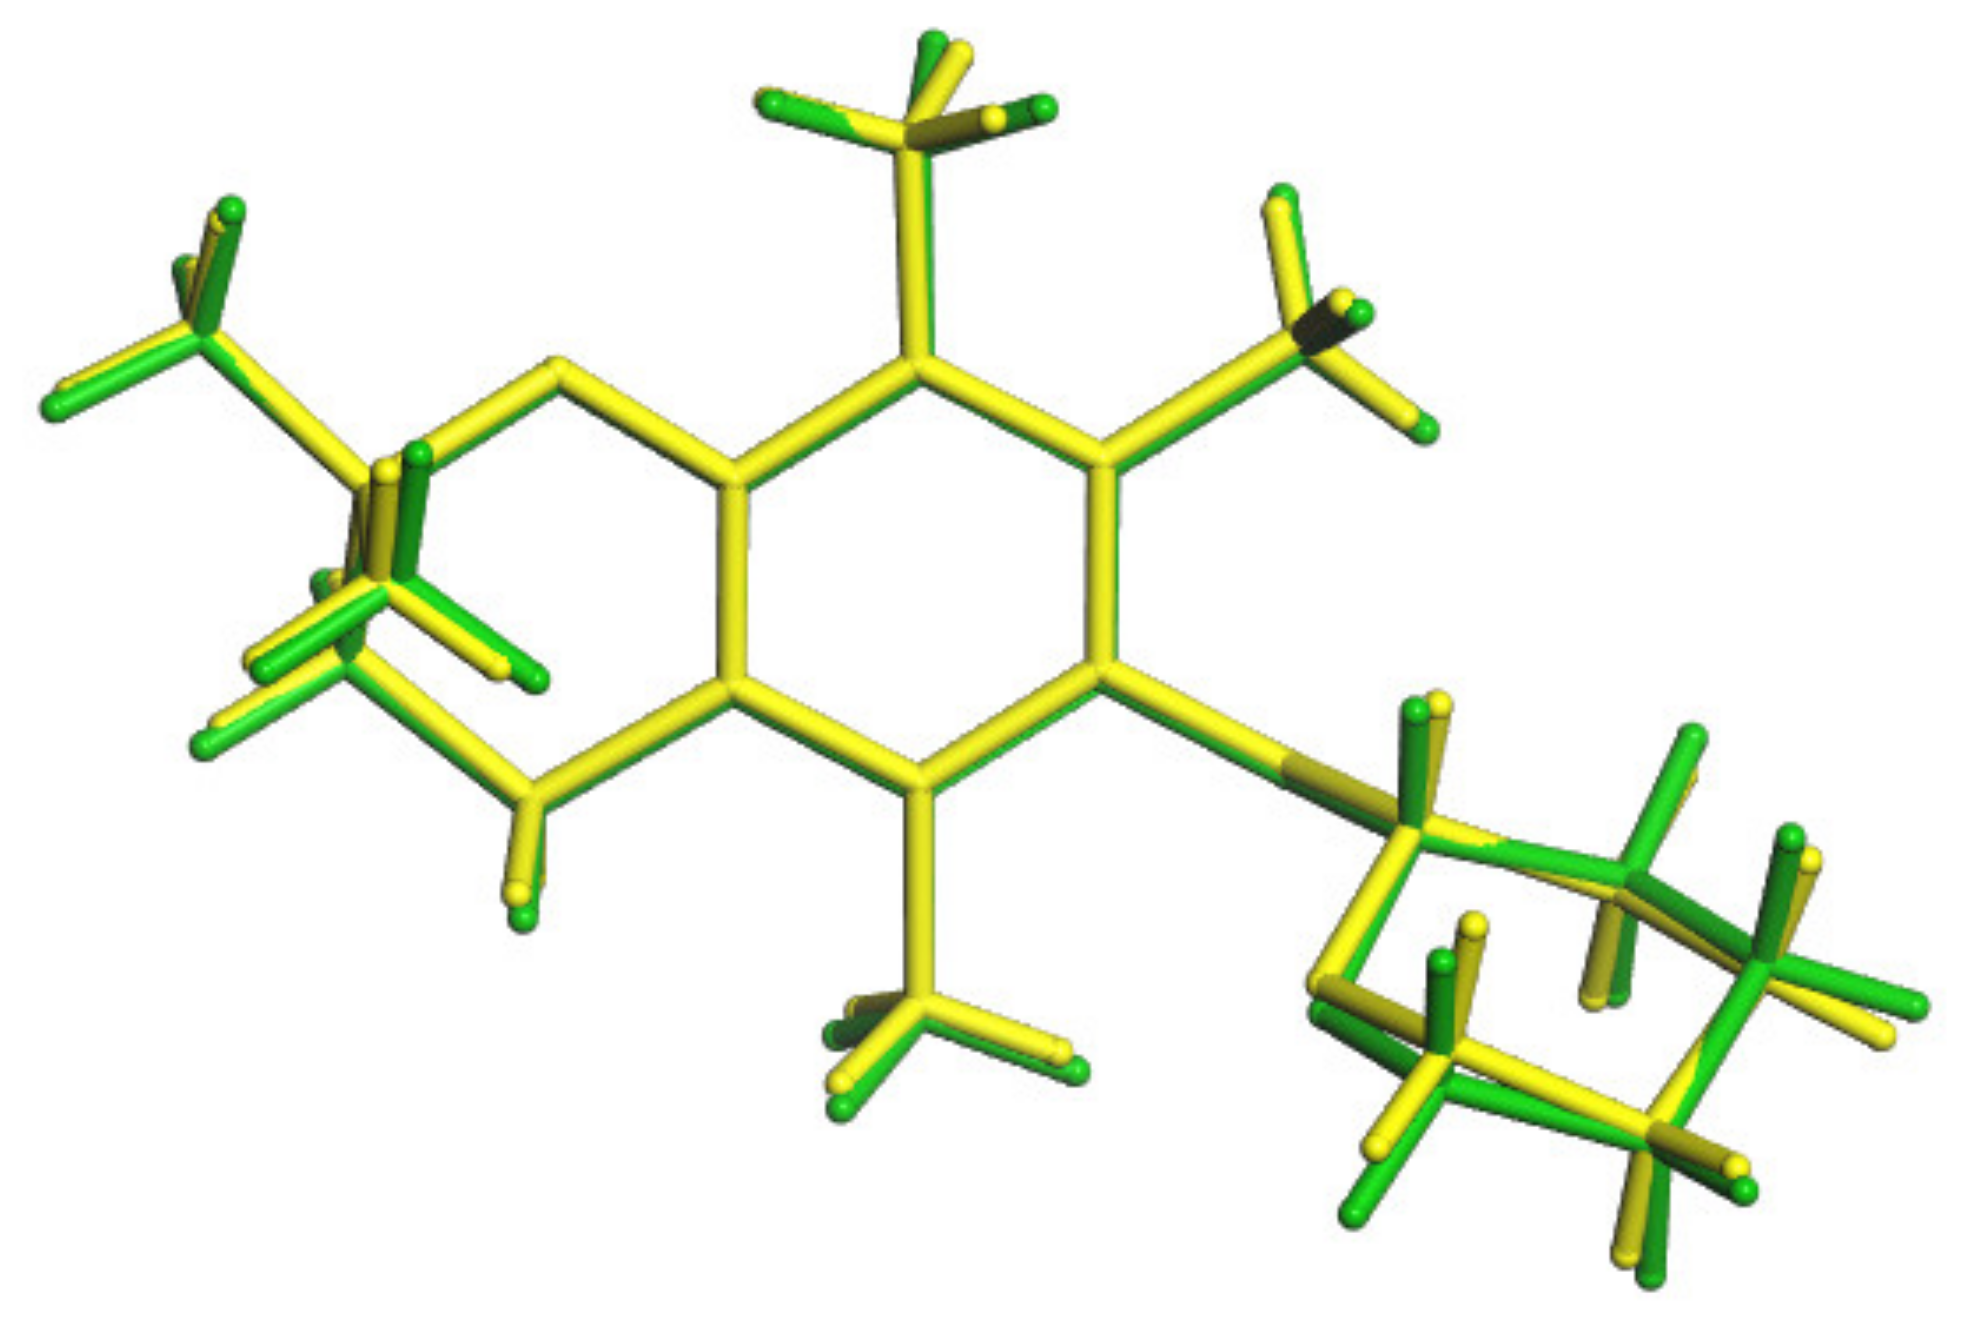
- The effects of the introduction of methyl, TBDMS and THP residue at the C6 position in 2,2,5,7,8-pentamethylchroman-6-ol were investigated. The deformation in the symmetry of the aromatic ring and its deviation from planarity compared to the substituent phenol were analyzed. A shortening of the C8a-O1 bond (c.a. 0.3 Å) with the simultaneous lengthening of the C6-C7, C8-C8a, C8a-C4a and C4a-C5 bonds in all analyzed ethers 3–5 were observed, as well as a significant deviation from the plane in the aromatic ring (up to 5–6o from planarity);
- -
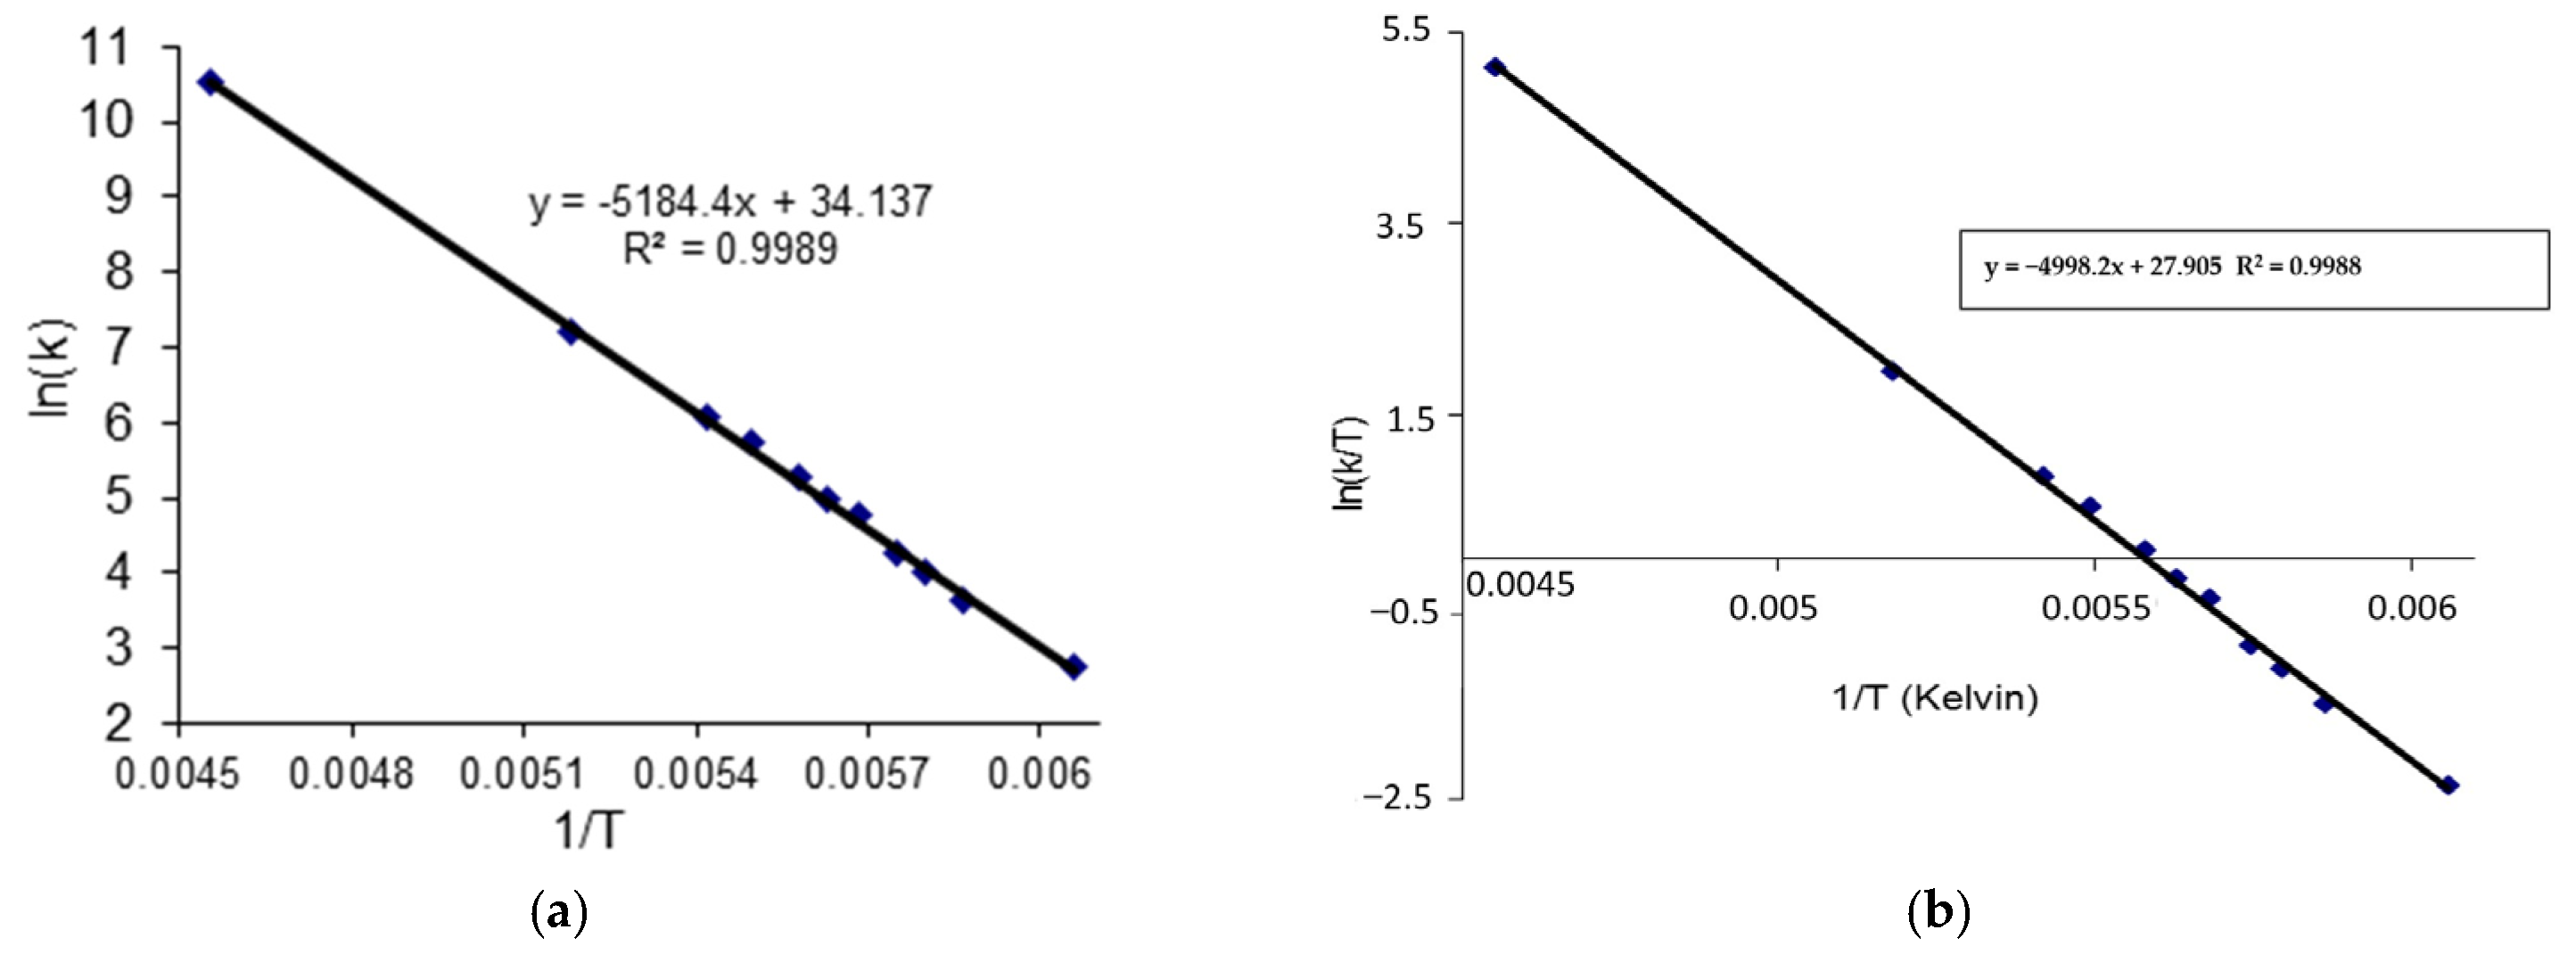
- In the case of THP ether (3), based on the signals C7 and C5 full shape line analysis (13C DNMR), the temperature of coalescence was estimated (at 183K ± 5°). Using WinDNMR software and the Arrhenius and Eyring equations, the kinetic parameters for ether 3 were calculated. The calculated ΔG# barrier rotation value (35.10 kJ mol−1 ± 0.59) was half of that previously determined for α-tocopherol or chroman-6-ol esters (c.a 59–63 kJ mol−1);
- -
- The GIPAW DFT NMR calculations facilitated the unambiguous assignment of the signals in the 13C CP MAS spectra of (3);
- -
- DFT calculations helped to explain the splitting of some signals in the variable temperature 13C NMR spectra of (3) by optimization and NMR property calculations of the structures were found during the conformational search.
Supplementary Materials
Author Contributions
Funding
Institutional Review Board Statement
Informed Consent Statement
Data Availability Statement
Conflicts of Interest
Sample Availability
Abbreviations
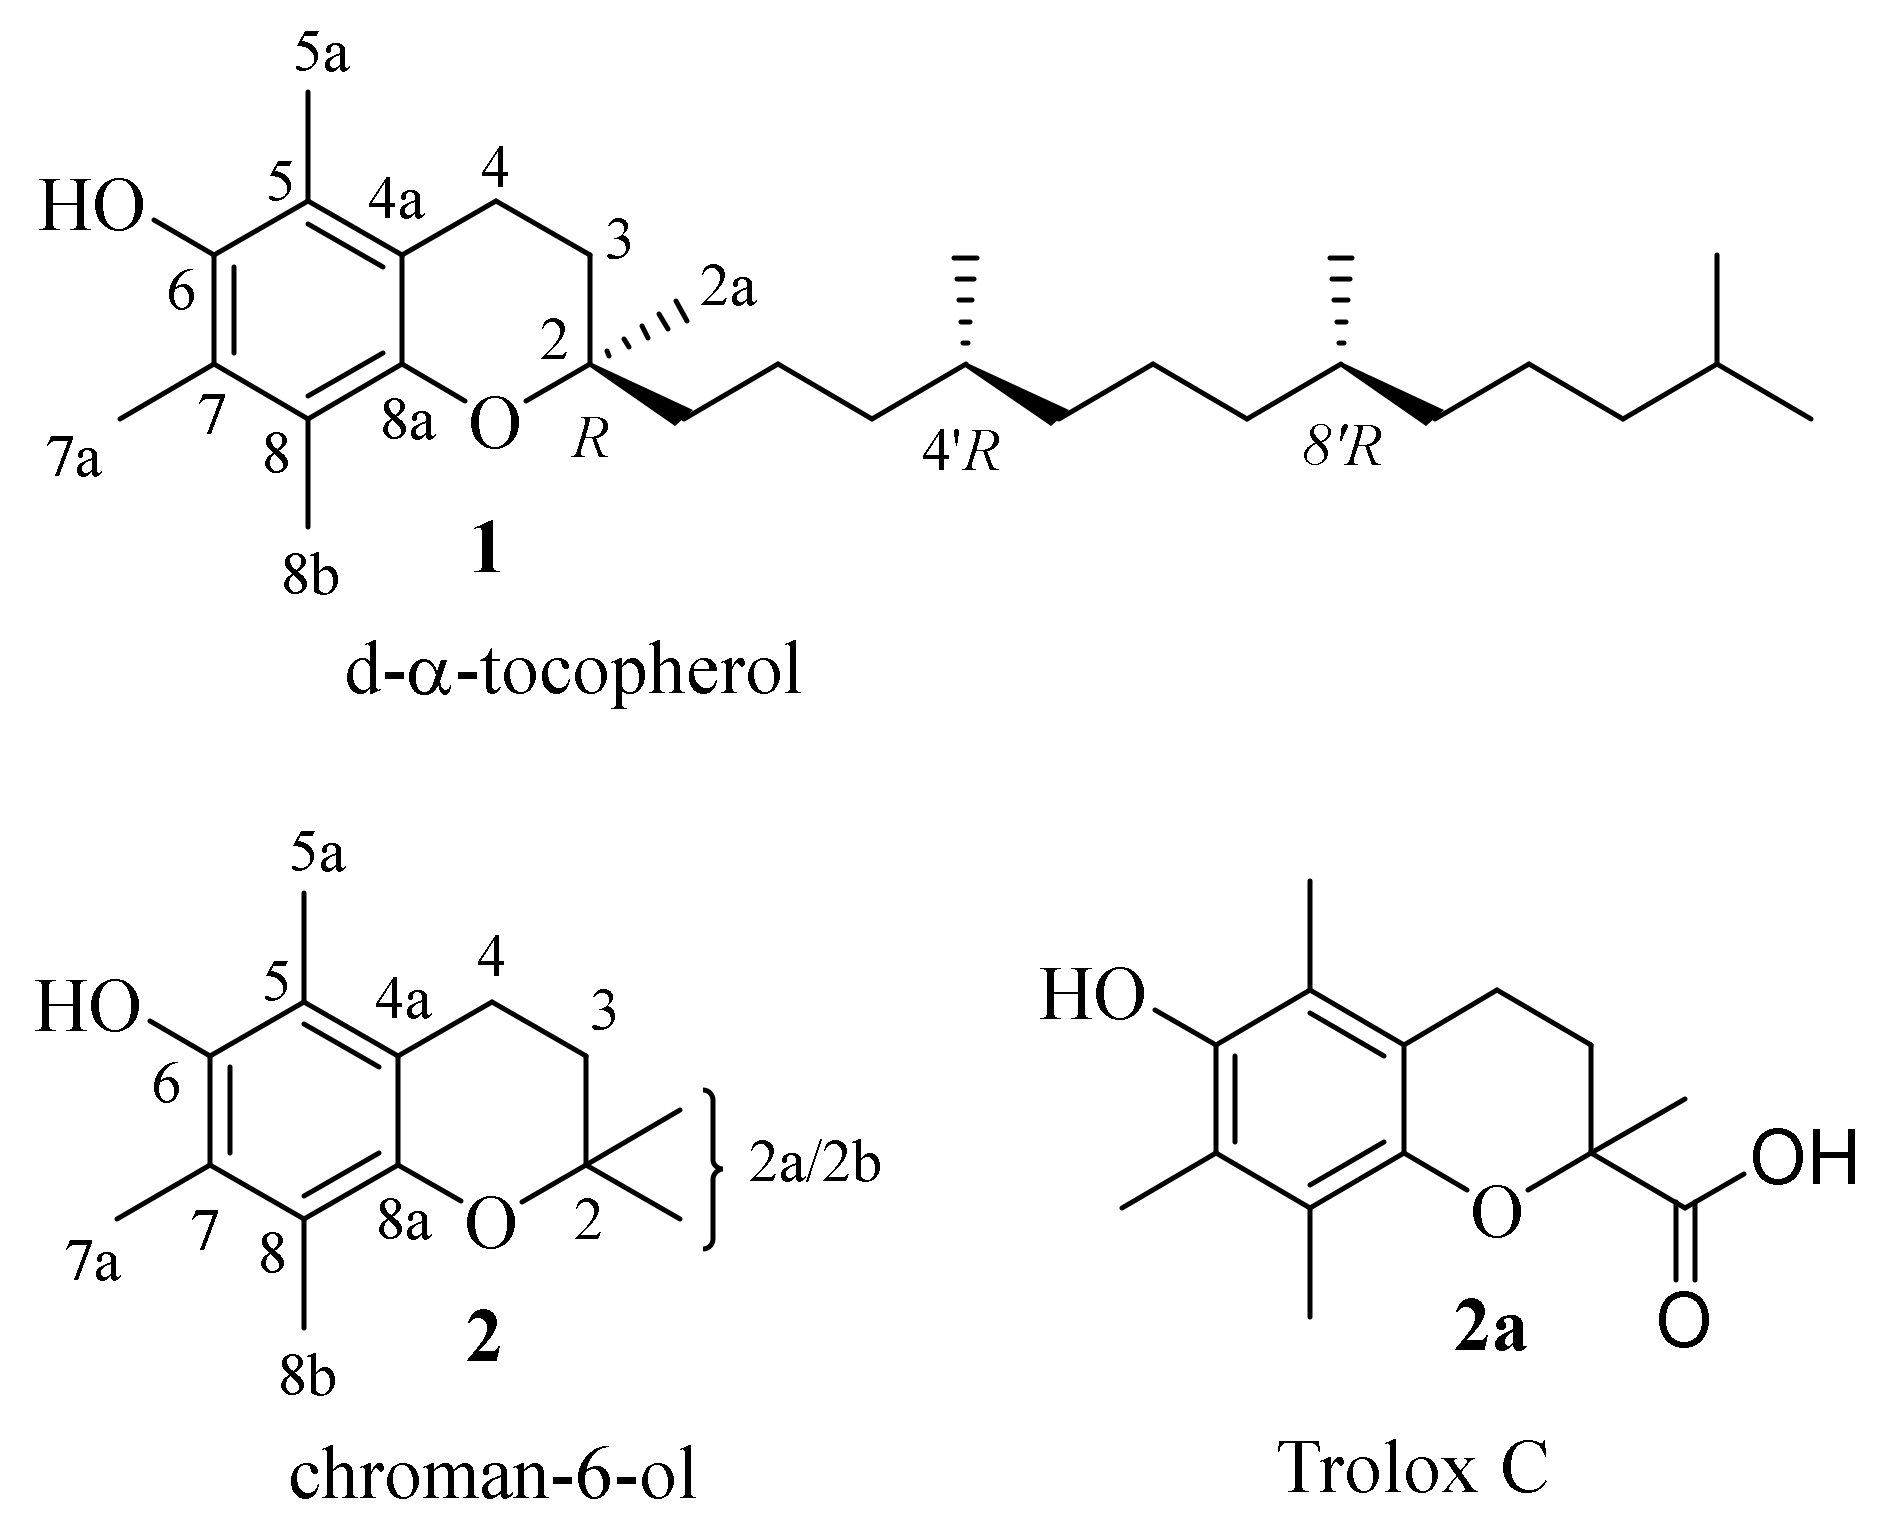
| 1 | d-α-tocopherol |
| 2 | chroman-6-ol |
| 2a | Trolox C |
| 3 | 2,2,5,7,8-pentamethyl-6-((tetrahydro-2H-pyran-2-yl)oxy) chroman |
| 4 | 6-methoxy-2,2,5,7,8-pentamethylchromane |
| 5 | tert-butyldimethyl((2,2,5,7,8-pentamethylchroman-6-yl)oxy)silane |
| CCDC | Cambridge Crystallographic Data Centre |
| CP | cross polarization |
| DD | dipolar diphase |
| DNMR | dynamic nuclear magnetic resonance |
| DFT | density functional theory |
| DQF-COSY | double quantum filter correlation spectroscopy |
| Ea | energy of activation |
| ECD | electronic circular dichroism |
| ΔG# | free enthalpy of activation |
| GGA | generalized gradient approximation |
| GIPAW | Gauge Including Projector Augmented Wave |
| ΔH# | enthalpy of activation |
| HMBC | heteronuclear multiple bond correlation |
| HSQC | heteronuclear single quantum coherence |
| MAS | magic angle spinning |
| MPLC | medium pressure liquid chromatography |
| NMR | nuclear magnetic resonance |
| PBE | Perdew–Burke–Ernzerhof exchange-correlation functional |
| PCM | polarizable continuum model (implicit solvation scheme) |
| ΔS# | entropy of activation |
| SCXRD | single crystal X-ray diffraction |
| TBDMS | tert-butyldimethylsilyl |
| Tc | coalescence temperature |
| THP | tetrahydropyran |
| TMS | tetramethylsilane |
| TS | transition state between the a and h conformations of 3 |
References
- Wałejko, P.; Dobrzycki, Ł.; Ratkiewicz, A.; Socha, P.; Witkowski, S.; Cyrański, M.K. An X-ray and natural bond orbital (NBO) structural study of α-tocopheryl and 2,2,5,7,8-pentamethylchroman-6-yl succinates. J. Saudi Chem. Soc. 2019, 23, 365–377. [Google Scholar] [CrossRef]
- Nielsen, P.B.; Müllertz, A.; Norling, T.; Kristensen, H.G. The effect of α-tocopherol on the in vitro solubilisation of lipophilic drugs. Int. J. Pharm. 2001, 222, 217–224. [Google Scholar] [CrossRef]
- Burton, G.W.; Le Page, Y.; Gabe, E.J.; Ingold, K.U. Antioxidant activity of vitamin E and related phenols. Importance of stereoelectronic factors. J. Am. Chem. Soc. 1980, 102, 7791–7792. [Google Scholar] [CrossRef]
- Burton, G.W.; Doba, T.; Gabe, E.; Hughes, L.; Lee, F.L.; Prasad, L.; Ingold, K.U. Autoxidation of biological molecules. maximizing the antioxidant activity of phenols. J. Am. Chem. Soc. 1985, 107, 7053–7065. [Google Scholar] [CrossRef]
- Mukai, K.; Ohbayashi, S.; Nagaoka, S.; Ozawa, T.; Azuma, N. X-ray crystallographic studies of vitamin E derivatives. relationship between antioxidant activity and molecular structure. Bull. Chem. Soc. Jpn. 1993, 66, 3808–3810. [Google Scholar] [CrossRef]
- Lee, S.B.; Willis, A.C.; Webster, R.D. Synthesis of the phenoxonium cation of an α-tocopherol model compound crystallized with non-nucleophilic [B(C6F5)4]- and (CB11H6Br6)-anions. J. Am. Chem. Soc. 2006, 128, 9332–9333. [Google Scholar] [CrossRef] [PubMed]
- Wałejko, P.; Paradowska, K.; Szeleszczuk, Ł.; Wojtulewski, S.; Baj, A. Racemic crystals of trolox derivatives compared to their chiral counterparts: Structural studies using solid-state NMR, DFT calculations and X-ray diffraction. J. Mol. Struct. 2018, 1156, 290–300. [Google Scholar] [CrossRef]
- Witkowski, S.; Paradowska, K.; Wawer, I. 13C CP/MAS NMR studies of vitamin E model compounds. Magn. Reson. Chem. 2004, 42, 863–869. [Google Scholar] [CrossRef]
- Stępień, D.K.; Cyrański, M.K.; Dobrzycki, Ł.; Wałejko, P.; Baj, A.; Witkowski, S.; Paradowska, K.; Wawer, I. The effect of rotating substituent in 2,2,5,7,8-pentamethylchroman derivatives. X-Ray, 13C CP MAS analysis and DFT analysis. J. Mol. Struct. 2014, 1076, 512–517. [Google Scholar] [CrossRef]
- Witkowski, S.; Anulewicz-Ostrowska, R.; Krygowski, T.M. CCDC 152556: Experimental crystal structure determination. 2001. [Google Scholar] [CrossRef]
- Perly, B.; Smith, I.C.P.; Hughes, L.; Burton, G.W.; Ingold, K.U. Estimation of the location of natural α-tocopherol in lipid bilayers by 13C NMR spectroscopy. Biochim. Biophys. Acta BBA-Biomembr. 1985, 819, 131–135. [Google Scholar] [CrossRef]
- Maciejewska, D.; Dziok, D. Theoretical studies of conformational changes in the 2,2,5,7,8-pentamethylchroman-6-ol derivatives by PM3 semi-empirical method. J. Mol. Struct. THEOCHEM 2002, 588, 217–222. [Google Scholar] [CrossRef]
- Górecki, M.; Suszczyńska, A.; Woźnica, M.; Baj, A.; Wolniak, M.; Cyrański, M.K.; Witkowski, S.; Frelek, J. Chromane helicity rule–scope and challenges based on an ECD study of various trolox derivatives. Org. Biomol. Chem. 2014, 12, 2235. [Google Scholar] [CrossRef]
- Witkowski, S.; Maciejewska, D.; Wawer, I. 13C NMR studies of conformational dynamics in 2,2,5,7,8-pentamethylchroman-6-ol derivatives in solution and the solid state. J. Chem. Soc. Perkin Trans. 2 2000, 7, 1471–1476. [Google Scholar] [CrossRef]
- Witkowski, S.; Walejko, P. Studies in the acid catalysed glycosylation of α-tocopherol. Z. Nat. B 2002, 57, 571–578. [Google Scholar] [CrossRef]
- Witkowski, S.; Walejko, P.; Wawer, I. 13C CP MAS NMR study of 6-O-(β-d-Glucopyranosyl)-and 6-O-(β-d-mannopyranosyl)-d-α-tocopherols. Solid State Nucl. Magn. Reson. 1998, 10, 123–128. [Google Scholar] [CrossRef]
- Witkowski, S.; Wawer, I. 13C NMR studies of conformational dynamics in α-tocopherol esters in solution and solid state. J. Chem. Soc. Perkin Trans. 2 2002, 3, 433–436. [Google Scholar] [CrossRef]
- Joint Commission on Biochemical JCBN. Nomenclature-nomenclature of tocopherols and related compounds recommendations 1981. Arch. Biochem. Biophys. 1982, 218, 347–348. [Google Scholar] [CrossRef]
- Nomenclature of Tocopherols and Related Compounds. Eur. J. Biochem. 1982, 123, 473–475. [CrossRef]
- Ekiel, I.H.; Hughes, L.; Burton, G.W.; Jovall, P.A.; Ingold, K.U.; Smith, I.C.P. Structure and dynamics of α-tocopherol in model membranes and in solution: A broad-line and high-resolution NMR study. Biochemistry 1988, 27, 1432–1440. [Google Scholar] [CrossRef]
- Matsuo, M.; Urano, S. 13C NMR spectra of tocopherols and 2,2-dimethylchromanols. Tetrahedron 1976, 32, 229–231. [Google Scholar] [CrossRef]
- Urano, S.; Matsuo, M. A radical scavenging reaction of α-tocopherol with methyl radical. Lipids 1976, 11, 380–383. [Google Scholar] [CrossRef]
- Urano, S.; Hattori, Y.; Yamanoi, S.; Matsuo, M. 13C nuclear magnetic resonance studies on α-tocopherol and its derivatives. Chem. Pharm. Bull. 1980, 28, 1992–1998. [Google Scholar] [CrossRef] [Green Version]
- Friebolin, H. Basic One- and Two-Dimensional NMR Spectroscopy, 5th ed.; Wiley-VCH: Weinheim, Germany, 2010; ISBN 978-3-527-32782-9. [Google Scholar]
- Zimmer, K.D.; Shoemaker, R.; Ruminski, R.R. Synthesis and characterization of a fluxional Re(I) carbonyl complex fac-[Re(CO)3(Dpop′)Cl] with the nominally tri-dentate ligand dipyrido(2,3-a:3′,2′-j)phenazine (Dpop′). Inorg. Chim. Acta 2006, 359, 1478–1484. [Google Scholar] [CrossRef]
- Skorupska, E.A.; Nazarski, R.B.; Ciechańska, M.; Jóźwiak, A.; Kłys, A. Dynamic 1H NMR spectroscopic study of hindered internal rotation in selected N,N-dialkyl isonicotinamides: An experimental and DFT analysis. Tetrahedron 2013, 69, 8147–8154. [Google Scholar] [CrossRef]
- Dynamic NMR Spectra for Windows; JCE Software 1995, New Release NMR Spectrum Calculations Version 7.1.14. 27 September 2009. Available online: https://www.chem.wisc.edu/areas/reich/plt/windnmr.htm] (accessed on 1 June 2022).
- Smith, L.I.; Ungnade, H.E.; Hoehn, H.H.; Wawzonek, S. the chemistry of vitamin E. VI the addition of dienes to phenols and hydroquinones. J. Org. Chem. 1939, 4, 311–317. [Google Scholar] [CrossRef]
- Yang, J.; Liu, G.Y.; Lu, D.L.; Dai, F.; Qian, Y.P.; Jin, X.L.; Zhou, B. Hybrid-increased radical-scavenging activity of resveratrol derivatives by incorporating a chroman moiety of vitamin E. Chem.–Eur. J. 2010, 16, 12808–12813. [Google Scholar] [CrossRef]
- Chang, C.C.; Lee, J.J.; Chiang, C.W.; Jayakumar, T.; Hsiao, G.; Hsieh, C.-Y.; Sheu, J.R. Inhibitory effect of PMC, a potent hydrophilic α-tocopherol derivative, on vascular smooth muscle cell proliferation: The pivotal role of PKC-α translocation. Pharm. Biol. 2010, 48, 938–946. [Google Scholar] [CrossRef]
- Birringer, M.; Siems, K.; Maxones, A.; Frank, J.; Lorkowski, S. Natural 6-hydroxy-chromanols and -chromenols: Structural diversity, biosynthetic pathways and health implications. RSC Adv. 2018, 8, 4803–4841. [Google Scholar] [CrossRef] [Green Version]
- Al-Khayat, I.; Dean, F.M.; France, S.N.; Matkin, D.A.; Orabi, M.O.A.; Robinson, M.L.; Turner, R.W.; Varma, R.S. Acid-induced broadening of 1H nmr signals in the 6-hydroxychroman and 5-hydroxydihydrobenzofuran series. J. Chem. Soc. Perkin 1 1985, 0, 1301–1309. [Google Scholar] [CrossRef]
- Rigaku Oxford Diffraction. CrysAlisPro Software System, version 1.171.38.46; Rigaku Corporation: Oxford, UK, 2017. [Google Scholar]
- Dolomanov, O.V.; Bourhis, L.J.; Gildea, R.J.; Howard, J.A.K.; Puschmann, H. OLEX2: A complete structure solution, refinement and analysis program. J. Appl. Crystallogr. 2009, 42, 339–341. [Google Scholar] [CrossRef]
- Sheldrick, G.M. A short history of SHELX. Acta Crystallogr. A 2008, 64, 112–122. [Google Scholar] [CrossRef] [PubMed] [Green Version]
- Frisch, M.J.; Trucks, G.W.; Schlegel, H.B.; Scuseria, G.E.; Robb, M.A.; Cheeseman, J.R.; Scalmani, G.; Barone, V.; Petersson, G.A.; Nakatsuji, H.; et al. Gaussian 16 Revision C.01; Gaussian, Inc.: Wallingford, CT, USA, 2016. [Google Scholar]
- Barone, V.; Cossi, M.; Tomasi, J. A new definition of cavities for the computation of solvation free energies by the polarizable continuum model. J. Chem. Phys. 1997, 107, 3210–3221. [Google Scholar] [CrossRef]
- Clark, S.J.; Segall, M.D.; Pickard, C.J.; Hasnip, P.J.; Probert, M.I.J.; Refson, K.; Payne, M.C. First principles methods using CASTEP. Z. Krist.-Cryst. Mater. 2005, 220, 567–570. [Google Scholar] [CrossRef] [Green Version]
- Perdew, J.P.; Burke, K.; Ernzerhof, M. Generalized gradient approximation made simple. Phys. Rev. Lett. 1996, 77, 3865–3868. [Google Scholar] [CrossRef] [PubMed] [Green Version]
- Grimme, S. Semiempirical GGA-type density functional constructed with a long-range dispersion correction. J. Comput. Chem. 2006, 27, 1787–1799. [Google Scholar] [CrossRef]
- Pfrommer, B.G.; Côté, M.; Louie, S.G.; Cohen, M.L. Relaxation of crystals with the quasi-newton method. J. Comput. Phys. 1997, 131, 233–240. [Google Scholar] [CrossRef] [Green Version]
- Pickard, C.J.; Mauri, F. All-electron magnetic response with pseudopotentials: NMR chemical shifts. Phys. Rev. B 2001, 63, 245101. [Google Scholar] [CrossRef] [Green Version]


| Identification Code | 3(R/S) | 4 | 5 |
|---|---|---|---|
| Empirical formula | C19H28O3 | C15H22O2 | C20H34O2Si |
| Formula weight | 304.41 | 234.32 | 334.56 |
| Crystal size/mm3 | 0.284 × 0.242 × 0.115 | 0.468 × 0.269 × 0.068 | 0.395 × 0.16 × 0.041 |
| Crystal system | monoclinic | monoclinic | monoclinic |
| Space group | I2/a | P21/n | P21/c |
| a/Å | 26.978 (6) | 12.960 (5) | 21.564 (9) |
| b/Å | 10.423 (2) | 5.626 (7) | 8.172 (5) |
| c/Å | 39.524 (2) | 18.066 (9) | 22.833 (4) |
| α/° | 90 | 90 | 90 |
| β/° | 142.58 (8) | 95.09 (3) | 95.33 (3) |
| γ/° | 90 | 90 | 90 |
| Volume/Å3 | 6752.3 (13) | 1312.3 (3) | 4006.6 (8) |
| Z | 16 | 4 | 8 |
| ρcalcg/cm3 | 1.198 | 1.186 | 1.109 |
| μ/mm−1 | 0.625 | 0.601 | 1.078 |
| 2Θ range for data collection/° | 6.662 to 152.732 | 8.066 to 152.906 | 7.778 to 149.008 |
| Reflections collected | 28329 | 25650 | 42438 |
| Independent reflections | 7073 [Rint = 0.0238, Rsigma = 0.0175] | 2745 [Rint = 0.0527, Rsigma = 0.0222] | 8196 [Rint = 0.0293, Rsigma = 0.0197] |
| Data/parameters/restraints | 7073/535/48 | 2745/160/0 | 8196/435/0 |
| Goodness-of-fit on F2 | 1.103 | 1.055 | 1.038 |
| Final R indexes [I > =2σ (I)] | R1 = 0.0473, wR2 = 0.1220 | R1 = 0.0642, wR2 = 0.1775 | R1 = 0.0487, wR2 = 0.1391 |
| Final R indexes [all data] | R1 = 0.0495, wR2 = 0.1238 | R1 = 0.0697, wR2 = 0.1877 | R1 = 0.0535, wR2 = 0.1474 |
| Largest diff. peak/hole /eÅ−3 | 0.26/−0.23 | 0.30/−0.42 | 1.42/−0.36 |
| Atom Number | Exp. | GIPAW | Δ(Exp.-GIPAW) |
|---|---|---|---|
| Molecule A | |||
| 2 | 73.4 | 77.66 | −4.26 |
| 2a | 25.6 | 23.56 | 2.04 |
| 2b | 29.8 | 27.17 | 2.63 |
| 3 | 31.1 | 28.12 | 2.98 |
| 4 | 21.9 | 20.41 | 1.49 |
| 4a | 118.3 | 120.05 | −1.75 |
| 5 | 129.7 | 132.14 | −2.44 |
| 5a | 14.4 | 12.95 | 1.45 |
| 6 | 146.4 | 149.71 | −3.31 |
| 7 | 126.4 | 129.35 | −2.95 |
| 7a | 14.4 | 13.01 | 1.39 |
| 8 | 121.4 | 123.11 | −1.71 |
| 8a | 148.4 | 150.95 | −2.55 |
| 8b | 11.8 | 9.58 | 2.22 |
| 1′ | 103.7 | 108.71 | −5.01 |
| 2′ | 32.3 | 29.52 | 2.78 |
| 3′ | 24.1 | 22.64 | 1.46 |
| 4′ | 24.1 | 23.46 | 0.64 |
| 5′ | 67.1 | 67.24 | −0.14 |
| Molecule B | |||
| 2 | 73.4 | 77.74 | −4.34 |
| 2a | 25.6 | 23.96 | 1.64 |
| 2b | 31.1 | 28.98 | 2.12 |
| 3 | 32.3 | 29.71 | 2.59 |
| 4 | 21.9 | 20.75 | 1.15 |
| 4a | 118.3 | 119.79 | −1.49 |
| 5 | 129.7 | 133.2 | −3.5 |
| 5a | 12.8 | 11.53 | 1.27 |
| 6 | 146.4 | 149.46 | −3.06 |
| 7 | 126.4 | 129.77 | −3.37 |
| 7a | 14.4 | 13 | 1.4 |
| 8 | 121.4 | 123.12 | −1.72 |
| 8a | 148.4 | 151.28 | −2.88 |
| 8b | 11.8 | 8.71 | 3.09 |
| 1′ | 103.7 | 108.34 | −4.64 |
| 2′ | 32.3 | 30.75 | 1.55 |
| 3′ | 24.1 | 23.45 | 0.65 |
| 4′ | 21.9 | 21.95 | −0.05 |
| 5′ | 70 | 69.53 | 0.47 |
| Conformation Symbol | a | h | a−h | |
|---|---|---|---|---|
| Energy [kJ/mol] | −2,513,941.28 | −2,513,915.03 | −26.25 | |
| Atom Number | Exp. | GIAO | ||
| 2 | 72.6 | 73.65 | 73.95 | −0.3 |
| 2a | 26.9 | 25.85 | 25.83 | 0.02 |
| 2b | 26.8 | 27.43 | 27.47 | −0.04 |
| 3 | 32.9 | 30.8 | 30.8 | 0 |
| 4 | 21.1 | 19.66 | 19.83 | −0.17 |
| 4a | 117 | 118.48 | 117.25 | 1.23 |
| 5 | 126.4 | 127.05 | 124.82 | 2.23 |
| 5a | 11.9 | 9.52 | 9.15 | 0.37 |
| 6 | 147.3 | 148.38 | 149.06 | −0.68 |
| 7 | 128.2 | 129.42 | 130.89 | −1.47 |
| 7a | 13.8 | 13.35 | 12.87 | 0.48 |
| 8 | 122.6 | 124.46 | 125.5 | −1.04 |
| 8b | 12.9 | 12.45 | 12.1 | 0.35 |
| 8a | 148 | 149.75 | 149.47 | 0.28 |
| 1′ | 103.7 | 104.95 | 103.53 | 1.42 |
| 2′ | 31.3 | 30.67 | 31.06 | −0.39 |
| 3′ | 21.2 | 21.5 | 21.3 | 0.2 |
| 4′ | 25.2 | 24.11 | 23.88 | 0.23 |
| 5′ | 65.1 | 65.45 | 65.87 | −0.42 |
| Atom | Max ∆ν * [Hz] | Tc [K] | ΔG# ** [kJ mol−1] | kexch [Hz] |
|---|---|---|---|---|
| C7 | 153 | 183 | 34.77 | 339.7 |
| C5 | 161 | 35.12 | 357.4 | |
| C8 | 75 | 181 | 35.87 | 166.5 |
| C4a | 74.5 | 35.88 | 165.4 | |
| C7a | 24 | 166 | 34.35 | 53.3 |
| C5a | 20 | 34.60 | 44.4 |
| ΔG1# [kJ mol−1] | ΔG2# [kJ mol−1] | Ea [kJ mol−1] | ΔH1#[kJ mol−1] | ΔS# [kJ mol−1 K] |
|---|---|---|---|---|
| 35.10 (0.59) a | 35.30 (1.76) b | 43.10 c | 41.58 c/41.47d | 34.30 c/34.46 d |
| Conformation Symbol | a | h | TS | ΔE# (h-a) | Ea (TS-a) |
|---|---|---|---|---|---|
| Energy [kJ/mol] | −2,513,941.28 | −2,513,915.03 | −2,513,910.39 | 26.25 | 30.89 |
Publisher’s Note: MDPI stays neutral with regard to jurisdictional claims in published maps and institutional affiliations. |
© 2022 by the authors. Licensee MDPI, Basel, Switzerland. This article is an open access article distributed under the terms and conditions of the Creative Commons Attribution (CC BY) license (https://creativecommons.org/licenses/by/4.0/).
Share and Cite
Wałejko, P.; Szeleszczuk, Ł.; Pisklak, D.M.; Wojtulewski, S. 13C CP MAS NMR and DFT Studies of 6-Chromanyl Ethereal Derivatives . Molecules 2022, 27, 4630. https://doi.org/10.3390/molecules27144630
Wałejko P, Szeleszczuk Ł, Pisklak DM, Wojtulewski S. 13C CP MAS NMR and DFT Studies of 6-Chromanyl Ethereal Derivatives . Molecules. 2022; 27(14):4630. https://doi.org/10.3390/molecules27144630
Chicago/Turabian StyleWałejko, Piotr, Łukasz Szeleszczuk, Dariusz Maciej Pisklak, and Sławomir Wojtulewski. 2022. "13C CP MAS NMR and DFT Studies of 6-Chromanyl Ethereal Derivatives " Molecules 27, no. 14: 4630. https://doi.org/10.3390/molecules27144630
APA StyleWałejko, P., Szeleszczuk, Ł., Pisklak, D. M., & Wojtulewski, S. (2022). 13C CP MAS NMR and DFT Studies of 6-Chromanyl Ethereal Derivatives . Molecules, 27(14), 4630. https://doi.org/10.3390/molecules27144630