
Volatile Variation of Theobroma cacao Malvaceae L. Beans Cultivated in Taiwan Affected by Processing via Fermentation and Roasting

 and
and
Abstract
:1. Introduction
2. Results and Discussion
2.1. Proximate Analysis
2.2. Variation of Fatty Acid Pattern
2.3. Variation of Triacylglyceride Pattern
2.4. Variation of Organic Acid Pattern
2.5. Variation of Soluble Sugar Pattern
2.6. Variation of Amino Acid Pattern
2.7. Variation of Total Phenolics and Flavonoids
2.8. Variation of Antioxidative Capability
2.9. Volatile Compounds
3. Materials and Methods
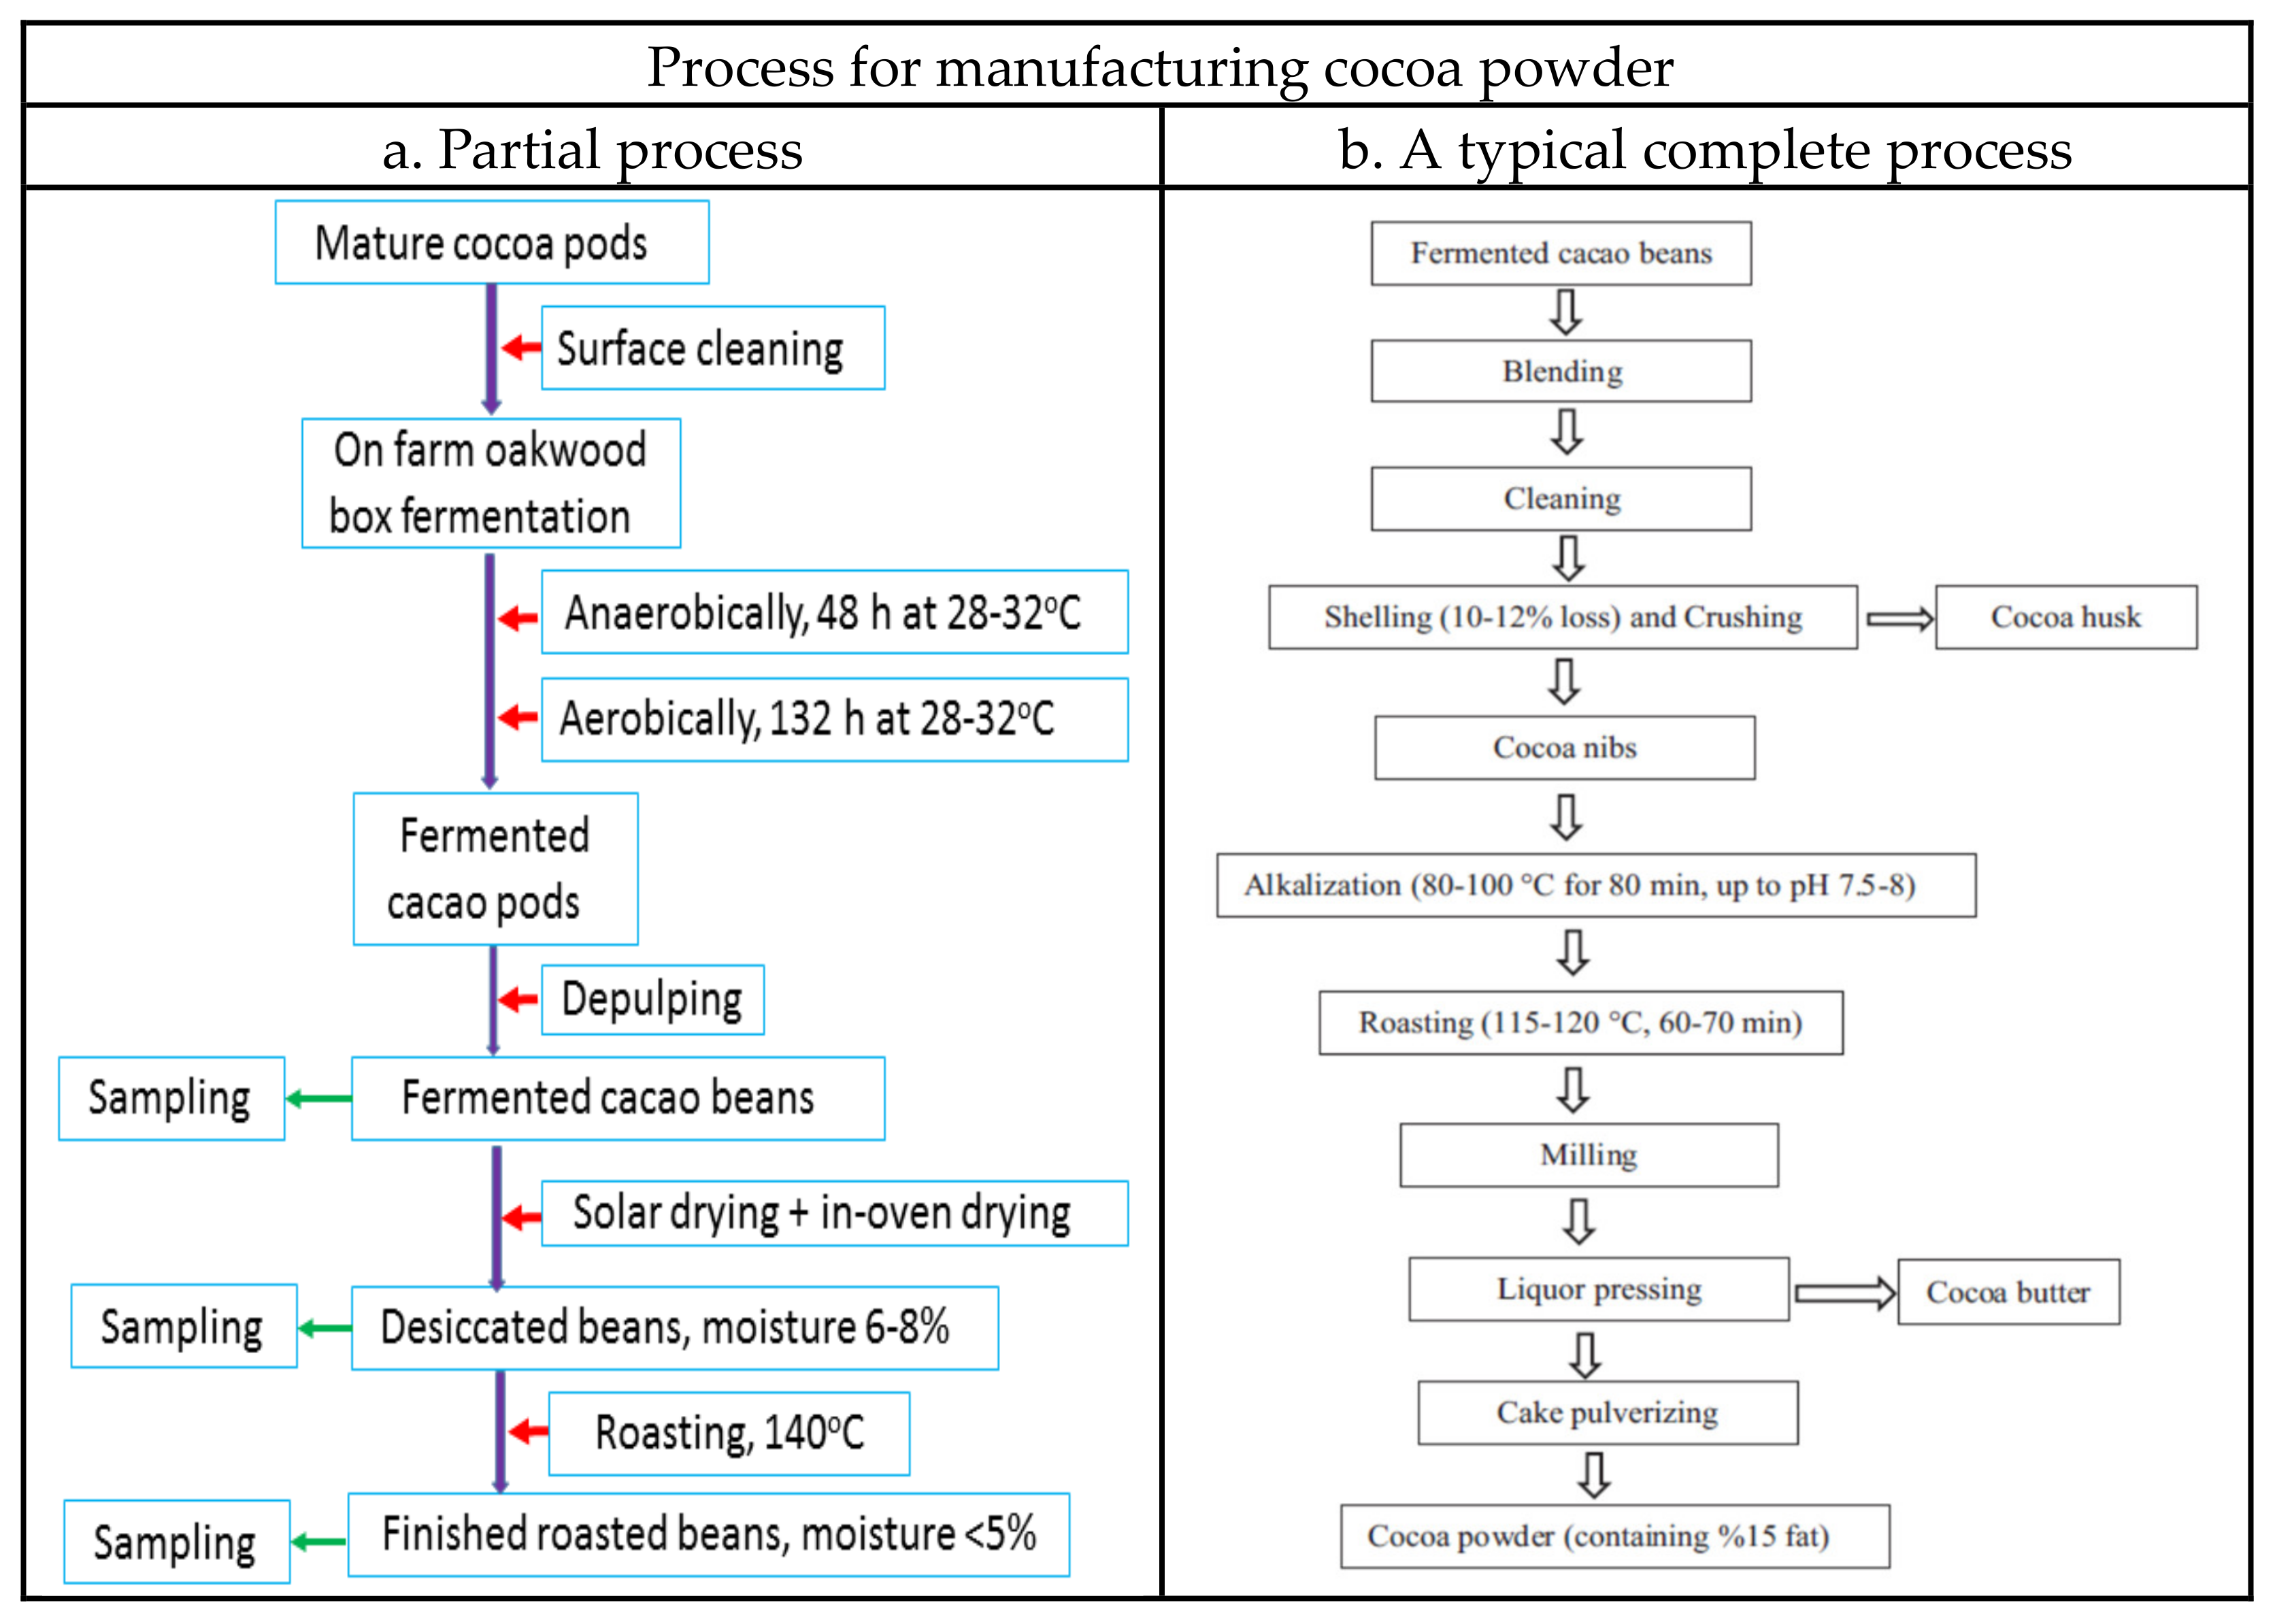
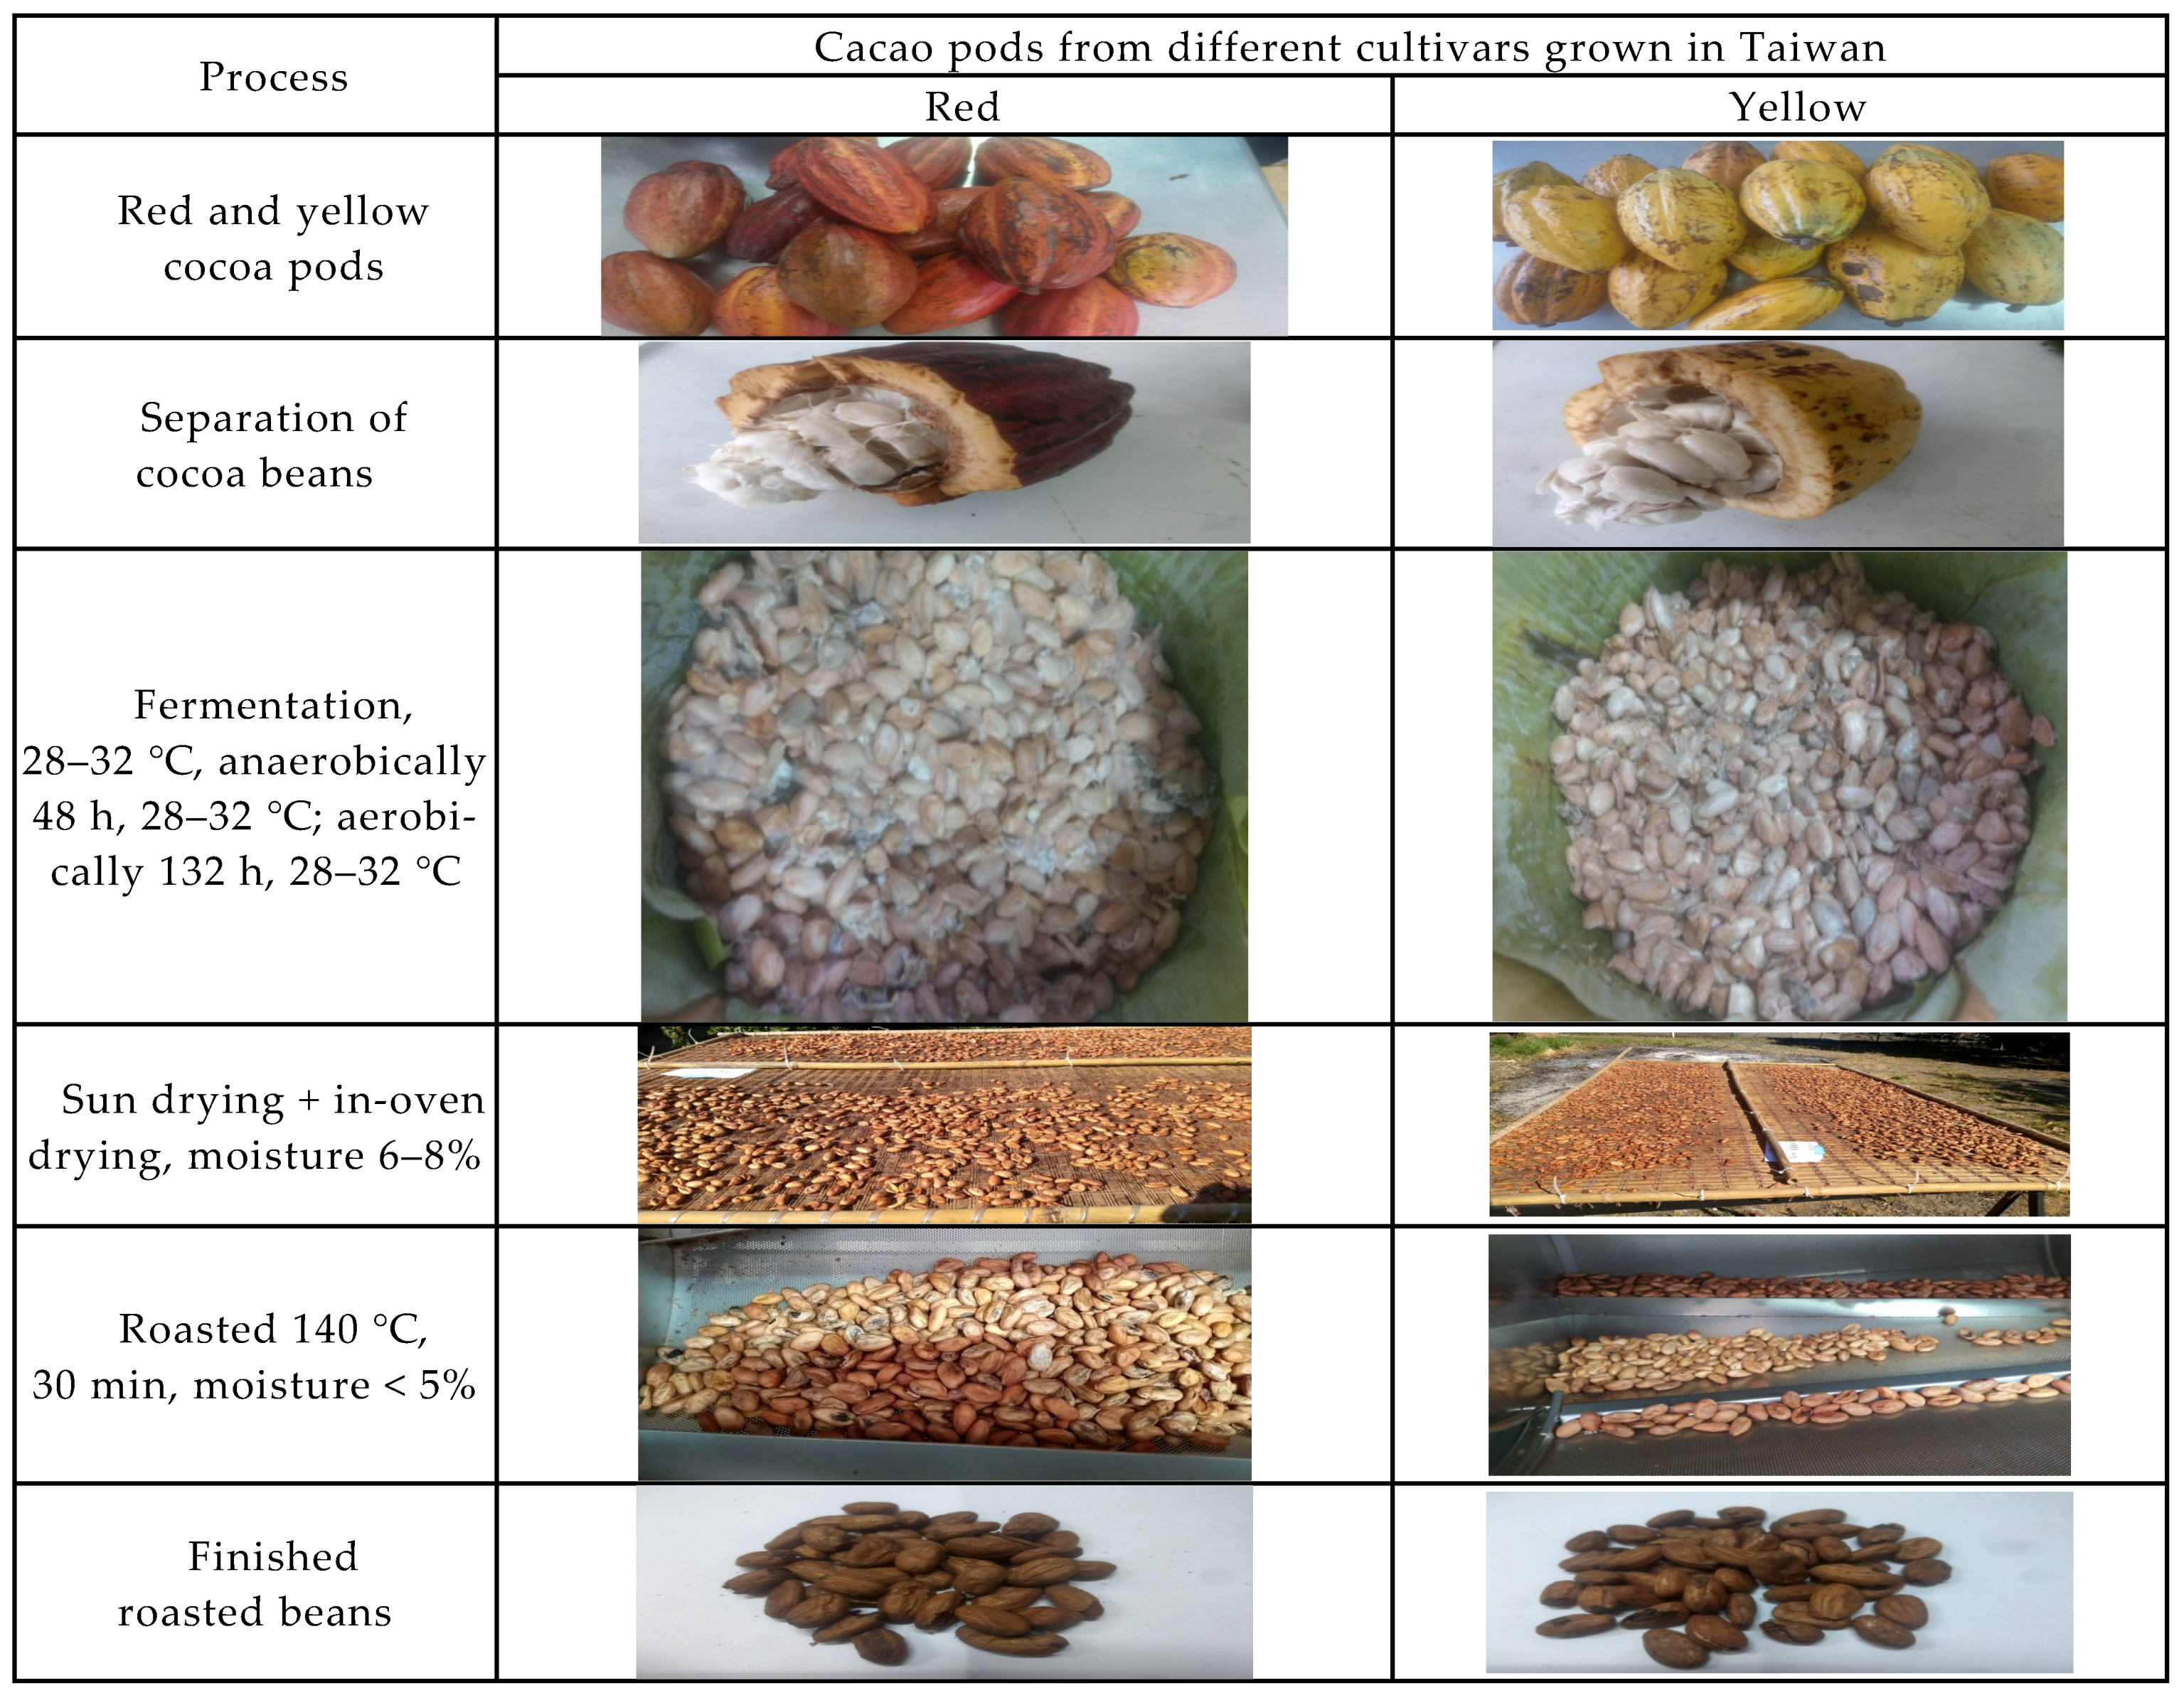
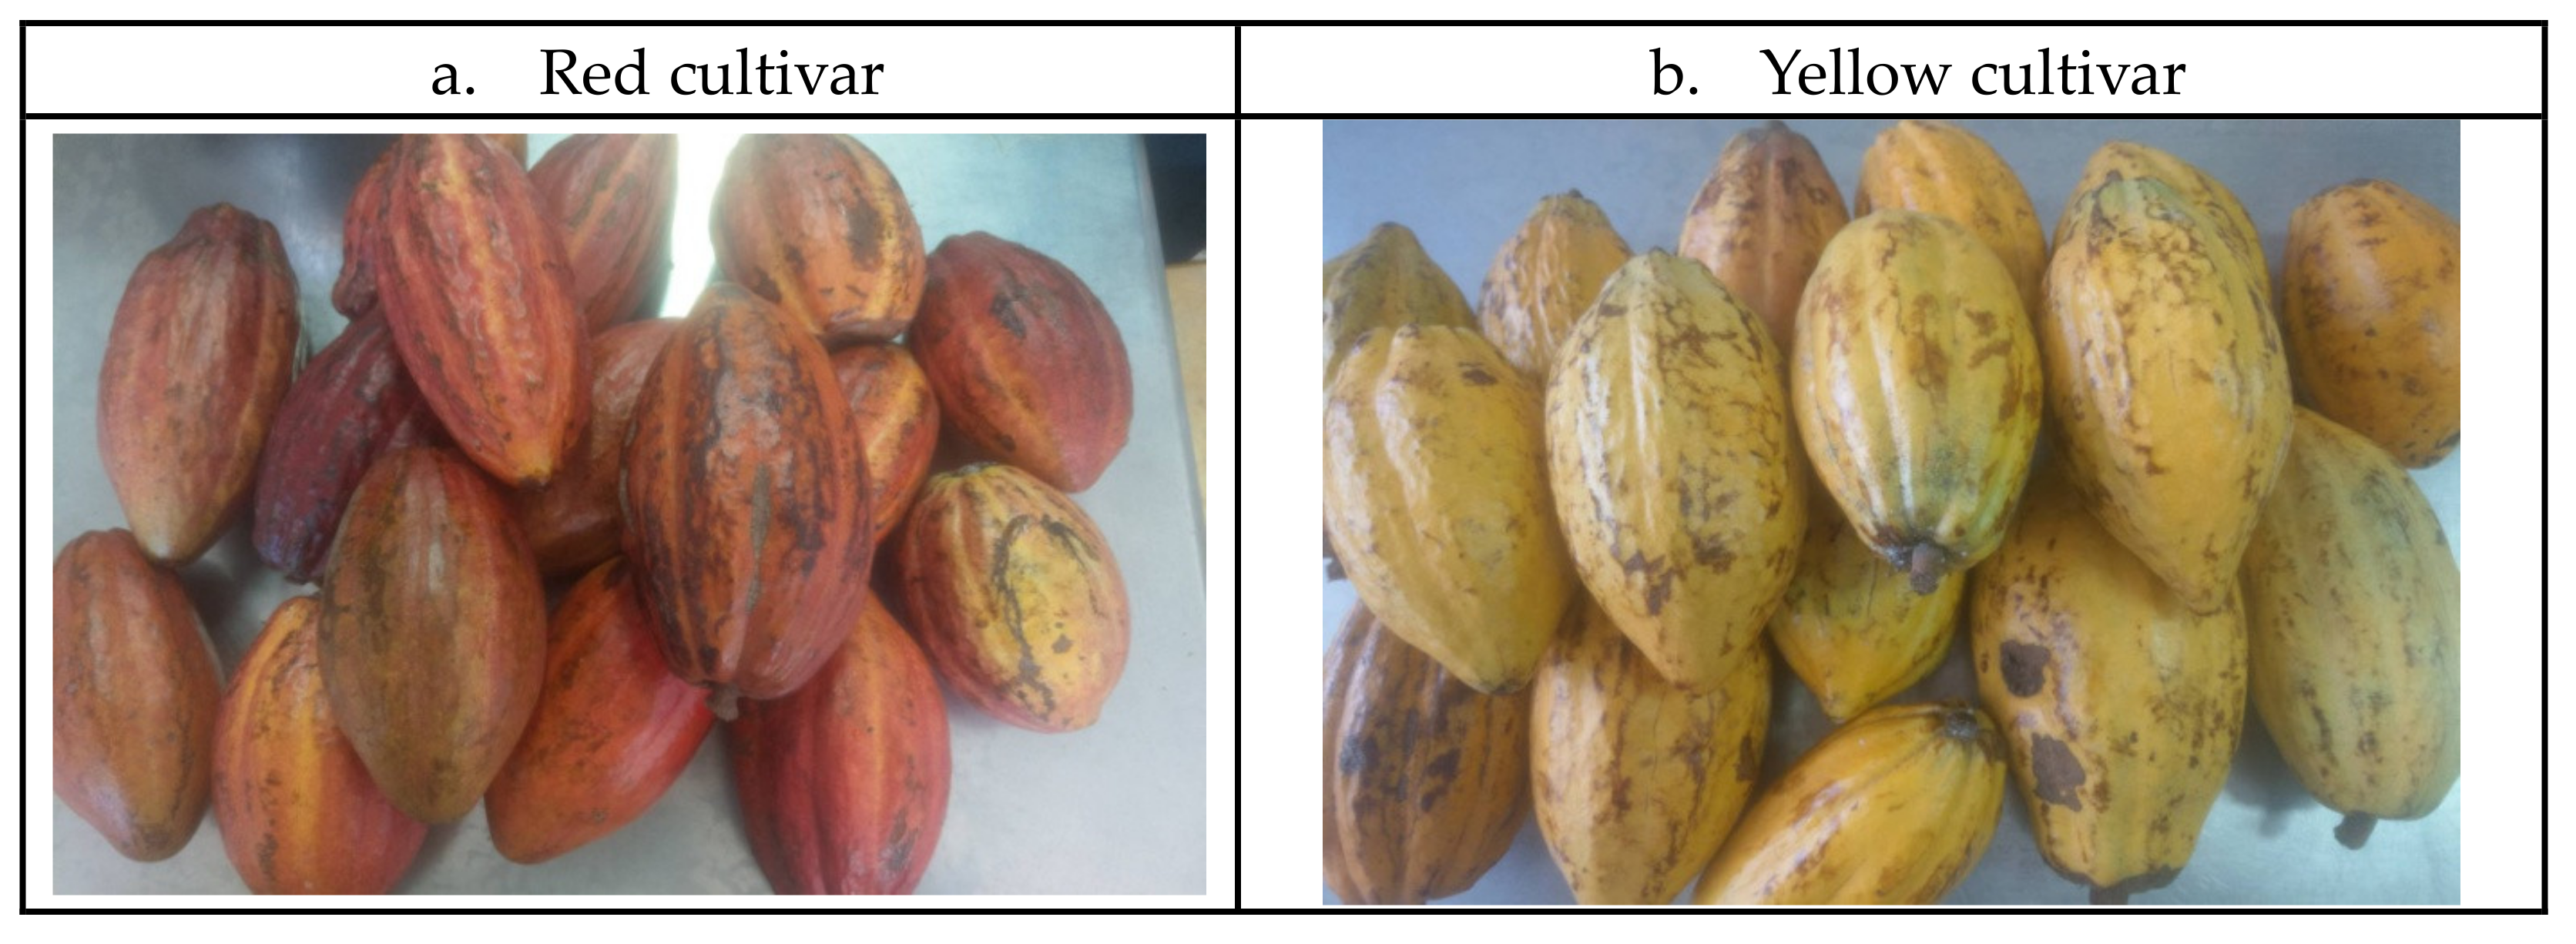
3.1. Source of Cocoa Pods and Processing
3.2. Proximate Analysis
3.3. Determination of Fatty Acid Patterns
3.4. Determination of Triacylglycerol Pattern
3.5. Analysis for the Umami Taste Compounds
3.5.1. Determination of the Organic Acids
3.5.2. Determination of the Soluble Sugars
3.5.3. Determination of Free Amino Acids
3.6. Determination of Total Phenolics
3.7. Determination of Total Flavonoids
3.8. Determination of Antioxidative Capability
3.8.1. Preparation of Extracts
3.8.2. Determination of the Scavenging Capability for the DPPH Free Radicals
3.8.3. Determination of the Scavenging Capability for the ABTS+ Free Radicals
3.9. Determination of the Volatile Compounds
3.10. Determination of the Retention Index (RI)
3.11. Statistical Analysis
4. Conclusions
Author Contributions
Funding
Institutional Review Board Statement
Informed Consent Statement
Data Availability Statement
Conflicts of Interest
Sample Availability
References
- Mohamadi Alasti, F.; Asefi, N.; Maleki, R.; Sadegh Seiiedlou, S. Investigating the flavor compounds in the cocoa powder production process. Food Sci. Nutr. 2019, 7, 3892–3901. [Google Scholar] [CrossRef] [PubMed] [Green Version]
- Cuatrecasas, J. Cacao and its allied: A taxonomic of the genus Theobroma. Syst. Plant Stud. 1964, 35, 379–614. [Google Scholar]
- Wood, G.A.R.; Lass, R.A. Cocoa Fourth Edition (Tropical Agricultural Series); Wiley-Blackwell Science Ltd.: Oxford, UK, 2001; 620p. [Google Scholar]
- De Vuyst, L.; Weckx, S. The cocoa bean fermentation process: From ecosystem analysis to starter culture development. J. Appl. Microbiol. 2016, 121, 5–17. [Google Scholar] [CrossRef] [PubMed]
- McShea, A.; Ramiro-Puig, E.; Munro, S.B.; Casadesus, G.; Castell, M.; Smith, M.A. Clinical benefit and preservation of flavonols in dark chocolate manufacturing. Nutr. Rev. 2008, 66, 630–641. [Google Scholar] [CrossRef]
- Aculey, P.C.; Snitkjaer, P.; Owusu, M.; Bassompiere, M.; Takrama, J.; Nørgaard, L.; Petersen, M.A.; Nielsen, D.S. Ghanaian cocoa bean fermentation characterized by spectroscopic and chromatographic methods and chemometrics. J. Food. Sci. 2010, 75, S300–S307. [Google Scholar] [CrossRef]
- Nair Prabhakaran, K.P. Cocoa (Theobroma cacao L.). In The Agronomy and Economy of Important Tree Crops of the Developing World; Nair Prabhakaran, K.P., Ed.; Elsevier: Heidelberg, Germany; New York, NY, USA; London, UK, 2010; pp. 131–180. [Google Scholar]
- Scapagnini, G.; Davinelli, S.; Renzo, L.D.; De Lorenzo, A.D.; Olarte, H.; Micali, G.; Cicero, A.F.; Gonzalez, S. Cocoa bioactive compounds: Significance and potential for the maintenance of skin health. Nutrients 2014, 6, 3202–3213. [Google Scholar] [CrossRef] [Green Version]
- Turcotte, A.-M.; Scott, P.M.; Tague, B. Analysis of cocoa products for ochratoxin A and aflatoxins. Mycotoxin. Res. 2013, 29, 193–201. [Google Scholar] [CrossRef] [Green Version]
- ICCO. International Cocoa Organization. The cocoa market situation. Economic Committee. In EC/4/2; International Cocoa Organization: Wembley, UK, 2014; pp. 1–18. [Google Scholar]
- Frauendorfer, F.; Schieberle, P. Identification of the key aroma compounds in cocoa powder based on molecular sensory correlations. J. Agric. Food Chem. 2006, 54, 5521–5529. [Google Scholar] [CrossRef]
- Frauendorfer, F.; Schieberle, P. Changes in key aroma compounds of Criollo cocoa beans during roasting. J. Agric. Food Chem. 2008, 56, 10244–10251. [Google Scholar] [CrossRef]
- Rodriguez-Campos, J.; Escalona-Buendía, H.B.; Contreras-Ramos, S.M.; Orozco-Avila, I.; Jaramillo-Flores, E.; Lugo-Cervantes, E. Effect of fermentation time and drying temperature on volatile compounds in cocoa. Food Chem. 2012, 132, 277–288. [Google Scholar] [CrossRef]
- De Oliveira, T.B.; Rogero, M.M.; Genovese, M.I. Polyphenolic-rich extracts from cocoa (Theobroma cacao L.) and cupuassu (Theobroma grandiflorum Willd. Ex Spreng. K. Shum) liquors: A comparison of metabolic effects in high-fat fed rats. Pharma Nutr. 2015, 3, 20–28. [Google Scholar] [CrossRef]
- Patras, M.A.; Milev, B.P.; Vrancken, G.; Kuhnert, N. Identification of novel cocoa flavonoids from raw fermented cocoa beans by HPLC-MSn. Food Res. Int. 2014, 63, 353–359. [Google Scholar] [CrossRef]
- Ioannone, F.; Di Mattia, C.D.; De Gregorio, M.; Sergi, M.; Serafini, M.; Sacchetti, G. Flavanols, proanthocyanidins and antioxidant activity changes during cocoa (Theobroma cacao L.) roasting as affected by temperature and time of processing. Food Chem. 2015, 174, 256–262. [Google Scholar] [CrossRef] [PubMed]
- Sarriá, B.; Martínez-López, S.; Sierra-Cinos, J.L.; Garcia-Diz, L.; Goya, L.; Mateos, R.; Bravo, L. Effects of bioactive constituents in functional cocoa products on cardiovascular health in humans. Food Chem. 2015, 174, 214–218. [Google Scholar] [CrossRef] [PubMed]
- Kongor, J.E.; Hinneh, M.; de Walle, D.V.; Afoakwa, E.O. Factors influencing quality variation in cocoa (Theobroma cacao) bean flavour profile—A review. Food Res. Int. 2016, 82, 44–52. [Google Scholar] [CrossRef]
- Oracz, J.; Żyżelewicz, D. Antioxidants in cocoa. Antioxidants 2020, 9, 1230. [Google Scholar] [CrossRef] [PubMed]
- Barišić, V.; Kopjar, M.; Jozinović, A.; Flanjak, I.; Ačkar, Đ.; Miličević, B.; Šubarić, D.; Stela Jokić, S.; Babić, J. The Chemistry behind chocolate production. Molecules 2019, 24, 3163. [Google Scholar] [CrossRef] [Green Version]
- Toro-Uribe, S.; Ibañez, E.; Decker, E.; Villamizar-Jaimes, A.; López-Giraldo, L. Food-safe process for high recovery of flavonoids from cocoa beans: Antioxidant and HPLC-DAD-ESI-MS/MS analysis. Antioxidants 2020, 9, 364. [Google Scholar] [CrossRef]
- Bertazzo, A.; Agnolin, F.; Comai, S.; Zancato, M.; Costa, C.V.; Seraglia, R.; Traldi, P. The protein profile of Theobroma cacao L. seeds as obtained by matrix-assisted laser desorption/ionization mass spectrometry. Rapid Commun. Mass Spectrom. 2011, 25, 2035–2042. [Google Scholar] [CrossRef]
- Kruszewski, B.; Obiedziński, M.W. Multivariate analysis of essential elements in raw cocoa and processed chocolate mass materials from three different manufacturers. LWT 2018, 98, 113–123. [Google Scholar] [CrossRef]
- Schroth, G.; Läderach, P.; Martinez-Valle, A.I.; Bunn, C.; Jassogne, L. Vulnerability to climate change of cocoa inWest Africa: Patterns, opportunities and limits to adaptation. Sci. Total Environ. 2016, 556, 231–241. [Google Scholar] [CrossRef] [PubMed] [Green Version]
- Carr, J.G.; Davies, P.A.; Dougan, J. (Eds.) Cocoa Fermentation in Ghana and Malaysia II; University of Bristol Research Station: London, UK, 1979. [Google Scholar]
- Fowler, M.S.; Leheup, P.; Cordier, J.-L. Cocoa, Coffee and Tea. In Microbiology of Fermented Foods; Woods, W.J.B., Ed.; Blackie Academic and Professionals: London, UK, 1998; Volume 1, pp. 128–147. [Google Scholar]
- Kealey, K.S.; Snyder, R.M.; Romanczyk, L.J.; Geyer, H.M.; Myers, M.E.; Withcare, E.J.; Hammerstone, J.F.; Schmitz, H.H. Cocoa components, Edible Products Having Enhanced Polyphenol Content, Methods of Making Same and Medical Uses. U.S. Patent Cooperation Treaty (PCT) WO 98/09533, 11 June 2001. [Google Scholar]
- Awua, P.K. (Ed.) Cocoa Processing and Chocolate Manufacture in Ghana; David Jamieson and Associates Press Inc.: Essex, UK, 2002. [Google Scholar]
- Zhang, L.; Ueno, S.; Sato, K.; Adlof, R.O.; List, G.R. Thermal and structural properties of binary mixtures of 1,3-distearoyl-2-oleoyl-glycerol (SOS) and 1,2-dioleoyl-3-stearoyl-sn-glycerol (sn-OOS). J. Therm. Anal. Calorim. 2009, 98, 105–111. [Google Scholar] [CrossRef]
- Krysiak, W. Influence of roasting conditions on coloration of roasted cocoa beans. J. Food Eng. 2006, 77, 449–453. [Google Scholar] [CrossRef]
- Kattenberg, H.; Kemming, A. The flavor of cocoa in relation to the origin and processing of the cocoa beans. In Food Flavors, Ingredients and Composition; Charalambous, G., Ed.; Elsevier Science: Amsterdam, The Netherlands, 1993; pp. 1–22. [Google Scholar]
- Clapperton, J.F. A review of research to identify the origins of cocoa flavour characteristics. Cocoa Growers’ Bull. 1994, 48, 7–16. [Google Scholar]
- Luna, F.; Crouzillat, D.; Cirou, L.; Bucheli, P. Chemical composition and flavor of Ecuadorian cocoa liquor. J. Agric. Food Chem. 2002, 50, 3527–3532. [Google Scholar] [CrossRef] [PubMed]
- Gil, M.; Llano, S.; Jaramillo, Y.; Quijano, J.; Londono-Londono, J. Matrix effect on quantification of sugars and mannitol developed during the postharvest of cocoa: An alternative method for traceability of aroma precursors by liquid chromatography with an evaporative detector. J. Food Sci. Technol. 2020, 57, 210–221. [Google Scholar] [CrossRef]
- Reineccius, G.A.; Andersen, D.A.; Kavanagh, T.E.; Keeney, P.G. Identification and quantification of the free sugars in cocoa beans. J. Agric. Food Chem. 1972, 20, 199–202. [Google Scholar] [CrossRef]
- Hashim, P.; Selamat, J.; Syed, M.; Kharidah, S.; Ali, A. Changes in free amino acid, peptide-N, sugar and pyrazine concentration during cocoa fermentation. J. Sci. Food Agric. 1998, 78, 535–542. [Google Scholar] [CrossRef]
- Rohsius, C.; Matissek, R.; Lieberei, R. Free amino acid amounts in raw cocoas from different origins. Eur. Food Res. Technol. 2006, 222, 432–438. [Google Scholar] [CrossRef]
- Kirchhoff, P.-M.; Biehl, B.; Ziegeler-Berghausen, H.; Hammoor, M.; Lieberei, R. Kinetics of the formation of free amino acids in cocoa seeds during fermentation. Food Chem. 1989, 34, 161–179. [Google Scholar] [CrossRef]
- Baigrie, B.D. Cocoa flavour. In Understanding Natural Flavors; Piggott, J.R., Paterson, A., Eds.; Springer: Boston, MA, USA, 1994. [Google Scholar] [CrossRef]
- Spinnler, H.-E. Flavours from amino acids. In Food Flavors: Chemical, Sensory and Technological Properties; CRC Press: Boca Raton, FL, USA, 2011; Chapter 6. [Google Scholar] [CrossRef]
- Maloney, G.S.; Kochevenko, A.; Tieman, D.M.; Tohge, T.; Krieger, U.; Zamir, D.; Taylor, M.G.; Fernie, A.R.; Klee, H.J. Characterization of the Branched-Chain Amino Acid Aminotransferase Enzyme Family in Tomato. Plant Physiol. 2010, 153, 925–936. [Google Scholar] [CrossRef] [PubMed] [Green Version]
- Tressl, R.; Grünewald, K.G.; Helak, B. Formation of flavor compounds from proline and hydroxyproline with glucose and maltose and their importance to food flavor. In Proceedings of the Flavour ‘81: 3rd Weurman Symposium Proceedings of the International Conference, Munich, Germany, 28–30 April 1981; pp. 397–416. [Google Scholar] [CrossRef]
- Parker, J.K. Chapter 8. Thermal generation or aroma. In Flavour Development, Analysis and Perception in Food and Beverages; Parker, J.K., Ed.; University of Reading: Reading, UK, 2015; pp. 151–185. [Google Scholar] [CrossRef]
- Wei, C.K.; Ni, Z.J.; Thakur, K.; Liao, A.M.; Huang, J.H.; Wei, Z.J. Color and flavor of flaxseed protein hydrolysates Maillard reaction products: Effect of cysteine, initial p, and thermal treatment. Int. J. Food Prop. 2019, 22, 84–99. [Google Scholar] [CrossRef] [Green Version]
- Saltini, R.; Akkerman, R.; Frosch, S. Optimizing chocolate production through traceability: A review of the influence of farming practices on cocoa bean quality. Food Control 2013, 29, 167–187. [Google Scholar] [CrossRef] [Green Version]
- Benayad, Z.; Gómez-Cordovés, C.; Es-Safi, N.E. Characterization of flavonoid glycosides from Fenugreek (Trigonella foenumgraecum) crude seeds by HPLC–DAD–ESI/MS analysis. Int. J. Mol. Sci. 2014, 15, 20668–20685. [Google Scholar] [CrossRef] [PubMed] [Green Version]
- Urbańska, B.; Kowalska, J. Comparison of the total polyphenol content and antioxidant activity of chocolate obtained from roasted and unroasted cocoa beans from different regions of the World. Antioxidants 2019, 8, 283. [Google Scholar] [CrossRef] [PubMed] [Green Version]
- Di Mattia, C.D.; Sacchetti, G.; Mastrocola, D.; Serafini, M. From cocoa to Chocolate: The impact of processing on in vitro antioxidant activity and the effects of chocolate on antioxidant markers in vivo. Front. Immunol. 2017, 8, 7. [Google Scholar] [CrossRef] [Green Version]
- Krysiak, W.; Adamski, R.; Żyżelewicz, D. Factors affecting the color of roasted cocoa bean. J. Food Qual. 2013, 36, 21–31. [Google Scholar] [CrossRef] [Green Version]
- Gutiérrez, T.J. State-of-the-Art Chocolate Manufacture: A Review. Compr. Rev. Food Sci. Food Saf. 2017, 16, 1313–1344. [Google Scholar] [CrossRef] [Green Version]
- Beckett, S.T.; Fowler, M.S.; Ziegler, G.R. (Eds.) Beckett’s Industrial Chocolate Manufacture and Use, 5th ed.; Wiley Blackwell: West Sussex, UK, 2017. [Google Scholar]
- Afoakwa, E.O.; Paterson, A.; Fowler, M.; Ryan, A. Flavor formation and character in cocoa and chocolate: A critical review. Crit. Rev. Food Sci. Nutr. 2008, 48, 840–857. [Google Scholar] [CrossRef]
- Rottiers, H.; Sosa, D.A.T.; De Winne, A.; Ruales, J.; De Clippeleer, J.; De Leersnyder, I.; De Wever, J.; Everaert, H.; Messens, K.; Dewettinck, K. Dynamics of volatile compounds and flavor precursors during spontaneous fermentation of fine flavor Trinitario cocoa beans. Eur. Food Res. Technol. 2019, 245, 1917–1937. [Google Scholar] [CrossRef]
- Ramli, N.; Hassan, O.; Said, M.; Samsudin, W.; Idris, N.A. Influence of roasting conditions on volatile flavour of roasted Malaysian cacao beans. J. Food Process Preserv. 2006, 30, 280–298. [Google Scholar] [CrossRef]
- Bonvechi, J.S. Investigation of aromatic compounds in roasted cocoa powder. Eur. Food Res. Technol. 2005, 221, 19–29. [Google Scholar] [CrossRef]
- Rodriguez-Campos, J.; Escalona-Buendía, H.B.; Orozco-Avila, I.; Lugo-Cervantes, E.; Jaramillo-Flores, M.E. Dynamics of volatile and non-volatile compounds in cocoa (Theobroma cacao L.) during fermentation and drying processes using principal components analysis. Food Res. Int. 2011, 44, 250–258. [Google Scholar] [CrossRef]
- Biehl, B.; Ziegleder, G. Cocoa: Chemistry of Processing. In Encyclopedia of Food Sciences and Nutrition, 2nd ed.; Caballero, B., Trugo, L., Finglas, P.M., Eds.; Academic Press: New York, NY, USA, 2003; pp. 1436–1448. [Google Scholar]
- Jinap, S.; Wan Rosli, W.I.; Russly, A.R.; Nurdin, L.M. Effect of roasting time and temperature on volatile components profile during nib roasting of cacao beans (Theobroma cacao). J. Sci. Food Agric. 1998, 77, 441–448. [Google Scholar] [CrossRef]
- Aprotosoaie, A.C.; Luca, S.V.; Miron, A. Flavour chemistry of cocoa and cocoa products-an overview. Compr. Rev. Food Sci. Food Saf. 2016, 15, 73–91. [Google Scholar] [CrossRef]
- Ziegleder, G. Chapter 8 Flavour development in cocoa and chocolate. In Industrial Chocolate Manufacture and Use, 4th ed.; Beckett, S.T., Ed.; Wiley-Blackwell Publishing Ltd.: Oxford, UK, 2009; pp. 169–191. [Google Scholar]
- Clapperton, J.; Lockwood, R.; Romanczyk, L.; Hammerstone, J.F. Contribution of genotype to cocoa (Theobroma cacao L.) flavour. Trop. Agric. 1994, 71, 303–308. [Google Scholar]
- Afoakwa, E.O. (Ed.) Cocoa Production and Processing Technology; eBook-PDF; CRC Press Taylor & Francis Group: Boca Raton, FL, USA, 2014; ISBN 13-978-1-4665-9824-9. [Google Scholar]
- AOAC. Official Methods of Analysis, 15th ed.; Association of Official Analytical Chemists: Washington, DC, USA, 1990. [Google Scholar]
- Musadji, N.Y.; Geffroy-Rodier, C. Simple Derivatization-Gas Chromatography-Mass Spectrometry for Fatty Acids Profiling in Soil Dissolved Organic Matter. Molecules 2020, 25, 5278. [Google Scholar] [CrossRef]
- AOCS. Official and Tentative Methods of the American Oil Chemists, Society Methods, 6th ed.; AOCS: Champaign, IL, USA, 2009. [Google Scholar]
- Ajlouni, S.O.; Beelman, R.B.; Thompson, D.B.; Mau, J.L. Change in soluble sugar in various tissues of cultivated mushrooms, Agaricus bisporus during postharvest storage. In Developments in Food Science; Elsevier: Amsterdam, The Netherlands, 1995; Volume 37, pp. 1865–1880. [Google Scholar]
- Mau, J.L.; Chyau, C.C.; Li, J.Y.; Tseng, Y.H. Flavor compounds in straw mushrooms Volvariella volvacea harvested at different stages of maturity. J. Agric. Food Chem. 1997, 45, 4726–4729. [Google Scholar] [CrossRef]
- Baba, S.A.; Malik, S.A. Determination of total phenolic and flavonoid content, antimicrobial and antioxidant activity of a root extract of Arisaema jacquemontii Blume. J. Taibah Univ. Sci. 2015, 9, 449–454. [Google Scholar] [CrossRef] [Green Version]
- Lalhminghlui, K.; Jagetia, G.C. Evaluation of the free-radical scavenging and antioxidant activities of Chilauni, Schima wallichii Korth in vitro. Future Sci. OA 2018, 4, FSO272. [Google Scholar] [CrossRef] [Green Version]
- Tabibi, A.; Jafari, M.T. High efficient solid-phase microextraction based on a covalent organic framework for determination of trifluralin and chlorpyrifos in water and food samples by GC-CD-IMS. Food Chem. 2022, 373, 131527. [Google Scholar] [CrossRef] [PubMed]


| Group | Content (%) | ||||
|---|---|---|---|---|---|
| Moisture | Crude Ash | Crude Protein | Crude Fat | Carbohydrate | |
| fRC | 9.31 ± 0.16 b | 3.24 ± 0.00 d | 11.51 ± 0.60 b | 41.70 ± 0.50 d | 34.24 |
| dRC | 5.60 ± 0.07 c | 3.51 ± 0.01 b | 13.20 ± 0.01 a | 43.86 ± 0.19 bc | 33.83 |
| rRC | 1.00 ± 0.03 f | 3.69 ± 0.01 a | 13.43 ± 0.01 a | 50.03 ± 0.64 a | 31.85 |
| fYC | 9.59 ± 0.02 a | 3.04 ± 0.00 e | 13.91 ± 0.32 a | 40.52 ± 0.44 e | 32.94 |
| dYC | 5.11 ± 0.03 d | 3.38 ± 0.06 c | 13.66 ± 0.06 a | 43.13 ± 0.32 c | 34.72 |
| rYC | 1.26 ± 0.18 e | 3.69 ± 0.07 a | 13.33 ± 0.35 a | 44.49 ± 0.71 b | 37.23 |
| Group | Content (%) | |||
|---|---|---|---|---|
| Palmitic Acid (16:0) | Stearic Acid (18:0) | Oleic Acid (18:1) | Arachidic Acid (20:0) | |
| fRC | 0.75 ± 0.01 c | 1.06 ± 0.04 c | 0.60 ± 0.03 c | 0.12 ± 0.03 ab |
| dRC | 0.83 ± 0.03 b | 1.16 ± 0.03 b | 0.76 ± 0.04 b | 0.13 ± 0.03 b |
| rRC | 0.75 ± 0.01 c | 0.93 ± 0.01 d | 0.72 ± 0.03 b | n.d. |
| fYC | 0.57 ± 0.04 d | 0.70 ± 0.03 e | 0.57 ± 0.01 c | 0.08 ± 0.03 ab |
| dYC | 0.96 ± 0.03 a | 1.28 ± 0.03 a | 0.93 ± 0.04 a | 0.15 ± 0.04 a |
| rYC | 0.25 ± 0.04 e | 0.34 ± 0.06 f | 0.24 ± 0.03 d | 0.05 ± 0.01 b |
| Group | Content (%) | |||||
|---|---|---|---|---|---|---|
| POP | POS | OOO | SOO | SOA | SOS | |
| fRC | 16.91 ± 0.04 c | 53.69 ± 0.02 b | 0.64 ± 0.01 e | 1.30 ± 0.10 d | 0.29 ± 0.04 ab | 26.99 ± 0.04 d |
| dRC | 16.34 ± 0.02 d | 53.23 ± 0.08 c | 0.77 ± 0.03 d | 1.57 ± 0.06 c | 0.31 ± 0.07 a | 27.50 ± 0.07 b |
| rRC | 19.27 ± 0.02 a | 55.43 ± 0.13 a | 0.83 ± 0.03 c | 1.18 ± 0.06 e | 0.14 ± 0.06 d | 22.81 ± 0.05 f |
| fYC | 16.96 ± 0.02 b | 53.08 ± 0.07 d | 0.87 ± 0.02 b | 1.71 ± 0.03 b | 0.27 ± 0.05 bc | 26.80 ± 0.12 e |
| dYC | 15.59 ± 0.03 f | 52.95 ± 0.08 f | 0.88 ± 0.04 b | 1.70 ± 0.02 b | 0.24 ± 0.09 c | 28.27 ± 0.09 a |
| rYC | 16.18 ± 0.02 e | 53.01 ± 0.09 e | 1.09 ± 0.05 a | 1.94 ± 0.04 a | 0.26 ± 0.09 bc | 27.21 ± 0.06 c |
| Group | Content (mg/100 g) | ||||
|---|---|---|---|---|---|
| Citric Acid | Tartaric Acid | Succinic Acid | Acetic Acid | Malic Acid | |
| fRC | n.d. | 50.59 ± 0.25 c | n.d. | 0.30 ± 0.04 f | 1.73 ± 0.06 f |
| dRC | 177.63 ± 0.18 b | 25.45 ± 0.03 c | 18.32 ± 0.05 c | 86.43 ± 0.20 b | 74.32 ± 0.15 d |
| rRC | 39.58 ± 0.12 c | 7.12 ± 0.05 d | 19.61 ± 0.10 b | 33.99 ± 0.16 e | 89.59 ± 0.08 b |
| fYC | 37.28 ± 0.08 d | 80.31 ± 0.14 b | 7.43 ± 0.06 d | 57.26 ± 0.07 d | 79.26 ± 0.14 c |
| dYC | 34.78 ± 0.09 e | 80.62 ± 0.12 b | 7.39 ± 0.27 d | 79.04 ± 0.08 c | 15.35 ± 0.12 e |
| rYC | 335.56 ± 0.19 a | 99.29 ± 0.08 a | 36.42 ± 0.10 a | 720.48 ± 0.08 a | 129.32 ± 0.05 a |
| Group | Sugar, (g/100 g) | |
|---|---|---|
| Fructose | Glucose | |
| fRC | 1.480 | 0.735 |
| dRC | n.d. | 0.404 |
| rRC | n.d. | n.d. |
| fYC | 1.483 | n.d. |
| dYC | n.d. | n.d. |
| rYC | n.d. | n.d. |
| Amino Acid (mg/100 g) | Group | |||||
|---|---|---|---|---|---|---|
| fRC | dRC | rRC | fYC | dYC | rYC | |
| Aspartic acid | 35.25 ± 0.03 a | 33.86 ± 0.02 b | 17.76 ± 0.06 f | 27.38 ± 0.07 d | 29.34 ± 0.04 c | 21.88 ± 0.09 e |
| Glutamic acid | 61.76 ± 0.02 d | 65.60 ± 0.06 c | 10.94 ± 0.05 f | 79.39 ± 0.07 a | 77.58 ± 0.08 b | 15.90 ± 0.04 e |
| Asparagine | 65.07 ± 0.02 d | 80.78 ± 0.06 a | 17.71 ± 0.05 f | 70.49 ± 0.07 c | 75.20 ± 0.08 b | 25.67 ± 0.04 e |
| Serine | 41.42 ± 0.04 a | 40.52 ± 0.05 b | 16.31 ± 0.03 f | 33.82 ± 0.05 c | 28.17 ± 0.04 d | 18.41 ± 0.05 e |
| Glutamine | 24.90 ± 0.04 a | 22.60 ± 0.05 b | n.d. | 17.31 ± 0.10 d | 17.95 ± 0.04 c | n.d. |
| Histidine | 7.96 ± 0.08 c | 8.26 ± 0.03 a | n.d. | 4.90 ± 0.05 d | n.d. | 8.13 ± 0.05 b |
| Glycine | 29.78 ± 0.05 a | 28.09 ± 0.02 b | 20.29 ± 0.02 d | 22.78 ± 0.03 c | 19.07 ± 0.03 e | 14.41 ± 0.02 f |
| Threonine | 31.31 ± 0.03 a | 27.16 ± 0.04 b | 11.32 ± 0.04 e | 22.91 ± 0.04 c | 16.26 ± 0.03 d | 9.43 ± 0.03 f |
| Arginine | 67.93 ± 0.04 a | 64.62 ± 0.04 b | 18.16 ± 0.13 e | 56.90 ± 0.04 c | 42.75 ± 0.03 d | 11.30 ± 0.03 f |
| Alanine | 61.17 ± 0.05 a | 60.66 ± 0.02 b | 22.09 ± 0.06 f | 60.42 ± 0.02 c | 49.41 ± 0.04 d | 23.56 ± 0.02 e |
| Tryosine | 50.28 ± 0.04 a | 47.59 ± 0.04 b | 16.77 ± 0.05 e | 38.69 ± 0.04 c | 31.47 ± 0.03 d | 15.85 ± 0.02 f |
| Cystine | 14.88 ± 0.04 a | 7.18 ± 0.02 b | n.d. | n.d. | n.d. | n.d. |
| Valine | 51.90 ± 0.04 b | 52.92 ± 0.02 a | 18.22 ± 0.04 f | 42.79 ± 0.02 c | 37.37 ± 0.04 d | 19.40 ± 0.03 e |
| Methionine | 23.62 ± 0.02 a | 19.29 ± 0.03 b | 14.18 ± 0.06 c | 11.09 ± 0.02 d | n.d. | n.d. |
| Tryptophan | 114.13 ± 0.04 b | 133.88 ± 0.01 a | 19..28 ± 0.04 e | 53.61 ± 0.03 d | 56.16 ± 0.03 c | 16.78 ± 0.03 f |
| Phenylalanine | 91.93 ± 0.02 b | 93.18 ± 0.03 a | 17.21 ± 0.05 e | 73.41 ± 0.01 c | 55.89 ± 0.04 d | 15.42 ± 0.03 f |
| Isoleucine | 44.39 ± 0.02 b | 44.90 ± 0.03 a | 9.50 ± 0.04 f | 33.88 ± 0.03 c | 29.50 ± 0.02 d | 14.21 ± 0.05 e |
| Leucine | 82.39 ± 0.02 a | 81.81 ± 0.02 b | 2.47 ± 0.05 e | 66.22 ± 0.03 c | 46.31 ± 0.02 d | n.d. |
| Lysine | 109.11 ± 0.05 a | 77.82 ± 0.04 b | 19.02 ± 0.02 e | 70.88 ± 0.03 c | 55.68 ± 0.02 d | 17.46 ± 0.04 f |
| Proline | 95.07 ± 0.02 a | n.d. | n.d. | n.d. | n.d. | n.d. |
| Total | 1104.25 ± 0.71 a | 990.72 ± 0.63 b | 231.95 ± 0.79 f | 786.87 ± 0.75 c | 668.11 ± 0.61 d | 247.81 ± 0.57 e |
| Group | TP, (Gallic Acid Eq. μg/g) | TF, (Quercetin Eq. μg/g) | ||
|---|---|---|---|---|
| Water | EtOH | Water | EtOH | |
| fRC | B8.94 ± 0.09 a | A16.35 ± 0.04 c | B2.60 ± 0.02 a | A14.46 ± 0.06 a |
| dRC | B4.74 ± 0.02 c | A12.65 ± 0.08 d | B2.35 ± 0.04 b | A9.14 ± 0.06 b |
| rRC | B4.66 ± 0.11 c | A8.65 ± 0.06 f | B 2.04 ± 0.08 c | A9.00 ± 0.02 c |
| fYC | B6.52 ± 0.06 b | A20.15 ± 0.11 a | B2.63 ± 0.02 a | A8.84 ± 0.08 d |
| dYC | B3.85 ± 0.05 d | A18.61 ± 0.23 b | B1.86 ± 0.02 d | A8.63 ± 0.02 e |
| rYC | B2.54 ± 0.11 e | A10.85 ± 0.07 e | B1.85 ± 0.02 d | A5.90 ± 0.04 f |
| Group | DPPH (Trolox mg/100 g) | ABTS (Trolox mg/100 g) | ||
|---|---|---|---|---|
| Water | EtOH | Water | EtOH | |
| fRC | B1.95 ± 0.03 cd | A2.27 ± 0.18 a | B35.22 ± 0.04 a | A37.89 ± 0.06 a |
| dRC | B1.92 ± 0.08 d | A2.16 ± 0.06 c | B35.21 ± 0.12 a | A36.59 ± 0.04 b |
| rRC | B1.82 ± 0.03 e | A2.03 ± 0.12 f | B34.01 ± 0.04 e | A36.19 ± 0.04 c |
| fYC | B2.04 ± 0.04 a | A2.22 ± 0.08 b | B34.93 ± 0.04 b | A36.16 ± 0.08 c |
| dYC | B2.00 ± 0.09 b | A2.08 ± 0.05 d | B34.70 ± 0.04 c | A35.44 ± 0.04 d |
| rYC | B1.95 ± 0.06 c | A2.06 ± 0.05 e | B34.50 ± 0.08 d | A35.39 ± 0.04 d |
| Compounds | RI | Formula | M.W. | CAS NO. |
|---|---|---|---|---|
| Alcohols | ||||
| Isobutanol | 1014 | C4H10O | 74 | 78-83-1 |
| 2-Pentanol | 1045 | C5H12O | 88 | 6032-29-7 |
| Isoamyl alcohol | 1124 | C5H12O | 88 | 123-51-3 |
| 3-Methyl-3-Buten-1-ol | 1158 | C5H10O | 86 | 763-32-6 |
| 2-Heptanol | 1239 | C10H20O2 | 172 | 25415-62-7 |
| 3-Ethyl-2-pentanol | 1254 | C7H16O | 116 | 609-27-8 |
| 3-Ethoxy-1-propanol | 1275 | C5H12O2 | 104 | 111-35-3 |
| 2-Butoxyethanol | 1301 | C6H14O2 | 118 | 111-76-2 |
| 2-Octanol | 1333 | C8H18O | 130 | 123-96-6 |
| 2-Ethylhexanol | 1394 | C8H18O | 130 | 104-76-7 |
| [S-(R*,R*)]-2,3-Butanediol | 1415 | C7H6O | 106 | 100-52-7 |
| 2-Nonanol | 1429 | C9H20O | 144 | 628-99-9 |
| Linalool | 1448 | C10H18O | 154 | 78-70-6 |
| 2-Octanol | 1458 | C8H18O | 130 | 123-96-6 |
| Fenchyl alcohol | 1482 | C10H18O | 154 | 1632-73-1 |
| 2-(2-Ethoxyethoxy)ethanol | 1494 | C6H14O3 | 134 | 111-90-0 |
| Furfuryl alcohol | 1516 | C5H6O2 | 98 | 98-00-0 |
| Methionol | 1579 | C4H10OS | 104 | 505-10-2 |
| α-Terpineol | 1587 | C10H18O | 154 | 98-55-5 |
| Epoxylinalol | 1641 | C10H18O2 | 170 | 14049-11-7 |
| Butyl carbitol | 1668 | C8H18O3 | 162 | 112-34-5 |
| 1-Phenethyl alcohol | 1672 | C8H10O | 122 | 1517-69-7 |
| Benzyl alcohol | 1723 | C7H8O | 108 | 100-51-6 |
| 2-Phenylethyl Alcohol | 1759 | C8H10O | 122 | 98-85-1 |
| 1-Phenoxy-2-propanol | 1876 | C9H12O2 | 152 | 770-35-4 |
| Aldehydes | ||||
| 2-Methyl propanal | 842 | C4H8O | 72 | 78-84-2 |
| 3-Methyl butanal | 880 | C5H10O | 86 | 590-86-3 |
| trans-5-Methyl-2-isopropyl-2-hexen-1-al | 1288 | C10H18O | 154 | 0000-00-0 |
| Furfural | 1341 | C5H4O2 | 96 | 98-01-1 |
| Benzaldehydehyde | 1405 | C11H22O2 | 186 | 2461-15-6 |
| Benzaldehyde | 1405 | C7H6O | 106 | 100-52-7 |
| Benzeneacetaldehyde | 1510 | C8H8O | 120 | 122-78-1 |
| 2-Phenyl-2-butenal | 1785 | C10H10O | 146 | 4411-89-6 |
| 5-Methyl-2-phenyl-2-hexenal | 1925 | C13H16O | 188 | 21834-92-4 |
| Ketones | ||||
| 1-Methoxy-2-propanone | 885 | C4H8O2 | 88 | 5878-19-3 |
| 2-Pentanone | 913 | C5H10O | 86 | 107-87-9 |
| 2-Heptanone | 1112 | C7H14O | 114 | 110-43-0 |
| 2-Methyltetrahydro 3-furanone | 1168 | C5H8O2 | 100 | 3188-00-9 |
| Acetoin | 1182 | C12H14O2 | 190 | 63678-00-2 |
| 3-Hepten-2-one | 1219 | C8H16O2 | 144 | 25368-54-1 |
| 2-Nonanone | 1311 | C9H18O | 142 | 821-55-6 |
| Acetoxyacetone | 1345 | C5H8O3 | 116 | 592-20-1 |
| Butyrolactone | 1487 | C4H6O2 | 86 | 96-48-0 |
| Acetophenone | 1524 | C8H8O | 120 | 98-86-2 |
| Pantolactone | 1849 | C6H10O3 | 130 | 599-04-2 |
| 5-Acetyldihydro-2(3H)-furanone | 1875 | C6H8O3 | 128 | 29393-32-6 |
| 3,5-Dihydroxy-6- methyl-2,3-dihydro-4H-pyran-4-one | 2052 | C6H8O4 | 144 | 28564-83-2 |
| Acids | ||||
| Acetic acid | 1324 | C2H4O2 | 60 | 64-19-7 |
| Isobutyric acid | 1441 | C4H8O2 | 88 | 79-31-2 |
| Isovaleric acid | 1487 | C5H10O2 | 102 | 503-74-2 |
| Valeric acid | 1534 | C5H10O2 | 102 | 109-52-4 |
| Esters | ||||
| Ethyl acetate | 866 | C4H8O2 | 88 | 141-78-6 |
| Isobutyl acetate | 955 | C7H14O2 | 130 | 1561-11-1 |
| Isoamyl acetate | 1057 | C7H14O2 | 130 | 123-92-2 |
| Dimethyl sulfuroate | 1098 | C2H6O3S | 110 | 616-42-2 |
| Ethyl hexanoate | 1166 | C8H16O2 | 144 | 123-66-0 |
| 1-Methylhexyl acetate | 1196 | C9H18O2 | 158 | 5921-82-4 |
| Isoamyl butyrate | 1201 | C9H18O2 | 158 | 60415-61-4 |
| n-Amyl isovalerate | 1234 | C7H12O | 112 | 1119-44-4 |
| Isobutyl hexanoate | 1285 | C10H20O2 | 172 | 105-79-3 |
| Ethyl octanoate | 1361 | C10H20O2 | 172 | 106-32-1 |
| Isopentyl hexanoate | 1387 | C11H22O2 | 186 | 2198-61-0 |
| Ethyl benzoate | 1549 | C9H10O2 | 150 | 093-89-0 |
| Methyl phenylacetate | 1627 | C9H10O2 | 150 | 101-41-7 |
| β-Phenethylformate | 1652 | C9H10O2 | 150 | 104-62-1 |
| 4-Ethylphenyl acetate | 1659 | C10H12O2 | 164 | 3245-23-6 |
| 2-Phenylethylacetate | 1686 | C10H12O2 | 164 | 103-45-7 |
| Isobutyl benzoate | 1725 | C11H14O2 | 178 | 120-50-3 |
| Terpenes | ||||
| β-Myrcene | 1105 | C10H16 | 136 | 123-35-3 |
| dℓ-Limonene | 1145 | C10H16 | 136 | 138-86-3 |
| Styrene | 1174 | C8H8 | 104 | 100-42-5 |
| Alloocimene | 1298 | C10H16 | 136 | 0000-00-0 |
| cis-Linalool oxide | 1355 | C10H18O2 | 170 | 5989-33-3 |
| trans-Linalool oxide | 1380 | C10H18O2 | 170 | 34995-77-2 |
| Naphthalene | 1614 | C10H8 | 128 | 91-20-3 |
| 2-Ethenyl-naphthalene | 1845 | C12H10 | 154 | 827-54-3 |
| Pyrazines | ||||
| Methylpyrazine | 1176 | C5H6N2 | 94 | 109-08-0 |
| 2,5-Dimethylpyrazine | 1236 | C6H8N2 | 108 | 123-32-0 |
| 2,6-Dimethylpyrazine | 1241 | C6H8N2 | 108 | 108-50-9 |
| Ethylpyrazine | 1244 | C6H8N2 | 108 | 13925-00-3 |
| 2,3-Dimethylpyrazine | 1257 | C6H8N2 | 108 | 5910-89-4 |
| 2-Ethyl-6-methyl-pyrazine | 1295 | C7H10N2 | 122 | 13925-03-6 |
| 2-Methyl-5-ethylpyrazine | 1301 | C7H10N2 | 122 | 13360-64-0 |
| Trimethylpyrazine | 1315 | C7H10N2 | 122 | 14667-55-1 |
| 2,6-Diethyl-pyrazine | 1347 | C8H12N2 | 136 | 13067-27-1 |
| 2-Ethyl-3,5-dimethyl pyrazine | 1359 | C8H12N2 | 136 | 13925-07-0 |
| 2-Ethyl-3,6-dimethylpyrazine | 1359 | C8H12N2 | 136 | 013360-65-1 |
| 2,5-Diethylpyrazine | 1370 | C8H12N2 | 136 | 13238-84-1 |
| 2,5-Diethylpyrazine | 1373 | C8H12N2 | 136 | 13067-27-1 |
| 5-Ethyl-2,3-dimethylpyrazine | 1374 | C8H12N2 | 136 | 15707-34-3 |
| Tetramethylpyrazine | 1386 | C8H12N2 | 170 | 1124-11-4 |
| 3,5-Diethyl-2-methyl-pyrazine | 1407 | C9H14N2 | 150 | 18138-05-1 |
| 2,3,5-Ttrimethyl-6-ethylpyrazine | 1426 | C9H14N2 | 150 | 17398-16-2 |
| Others | ||||
| 2,3-Dihydrofuran | 1183 | C4H6O | 70 | 1191-99-7 |
| 2,5Diethyltetrahydrofuran | 1285 | C8H16O | 128 | 41239-48-9 |
| 2-Acetylfuran | 1384 | C6H6O2 | 110 | 1192-62-7 |
| Propyl nitrite | 1453 | C3H7NO2 | 89 | 543-67-9 |
| 2-Acetylpyrrole | 1800 | C6H7NO | 109 | 1072-83-9 |
| Benzothiazole | 1801 | C7H5NS | 135 | 95-16-9 |
| Phenol | 1827 | C6H6O | 94 | 108-95-2 |
| Compounds | Composition (μg/g) | |||||
|---|---|---|---|---|---|---|
| fRC | dRC | rRC | fYC | dYC | rYC | |
| Alcohols | ||||||
| Isobutanol | 43.80 | 8.35 | 3.92 | 10.71 | 28.53 | 28.30 |
| 2-Pentanol | 24.22 | 4.30 | 3.53 | 1.77 | 4.36 | 5.33 |
| Isoamyl alcohol | 214.73 | 36.05 | 16.22 | 59.80 | 135.94 | 130.92 |
| 3-Methyl-3-Buten-1-ol | - | - | - | - | - | 1.09 |
| 2-Heptanol | 109.52 | 13.28 | 25.31 | 1.57 | 2.60 | - |
| 3-Ethyl-2-pentanol | - | - | 1.73 | - | - | - |
| 3-Ethoxy-1-propanol | - | - | - | 0.18 | 0.75 | 0.99 |
| 2-Butoxyethanol | - | - | - | 0.34 | - | - |
| 2-Octanol | 9.24 | 1.37 | 2.16 | 0.31 | 0.58 | 1.29 |
| 2-Ethylhexanol | 2.17 | 0.24 | 0.49 | 0.42 | 0.44 | 0.51 |
| [S-(R*,R*)]-2,3- Butanediol | 15.80 | 3.75 | 3.79 | 2.07 | 5.89 | 4.56 |
| 2-Nonanol | 46.39 | 7.28 | 15.17 | 0.15 | 0.72 | 0.43 |
| Linalool | 20.90 | 3.28 | 14.31 | 2.25 | 7.00 | 10.10 |
| 2-Octanol | - | - | 1.56 | - | - | - |
| Fenchyl alcohol | 1.56 | 0.22 | 0.75 | 0.22 | 0.27 | 0.50 |
| 2-(2-Ethoxyethoxy) ethanol | - | - | - | 0.27 | 0.21 | 0.38 |
| Furfuryl alcohol | - | - | 6.21 | - | - | 5.12 |
| Methionol | - | - | - | 0.19 | - | 2.09 |
| α-Terpineol | 6.91 | 1.30 | 3.39 | 1.17 | 2.04 | 3.11 |
| Epoxylinalol | - | 0.17 | 0.19 | - | - | 0.33 |
| Butyl carbitol | - | - | - | 0.20 | - | - |
| 1-Phenethyl alcohol | 2.01 | 0.30 | 0.44 | 0.16 | 0.29 | 0.41 |
| Benzyl alcohol | 1.91 | 0.31 | 0.28 | 0.30 | 0.39 | 0.55 |
| 2-Phenylethyl Alcohol | 344.95 | 56.81 | 53.89 | 54.47 | 124.94 | 171.54 |
| 1-Phenoxy-2- propanol | - | - | - | 1.18 | 0.25 | 0.38 |
| subtotal | 844.11 | 137.01 | 153.34 | 137.73 | 315.2 | 367.93 |
| Aldehydes | ||||||
| 2-Methylpropanal | 9.56 | 1.12 | 12.66 | 2.52 | 4.57 | 18.50 |
| 3-Methylbutanal | 103.97 | 24.29 | 89.15 | - | - | - |
| trans-5-Methyl-2-isopropyl-2-hexen-1-al | 1.29 | - | 1.83 | - | - | - |
| Furfural | 5.58 | 0.94 | 13.92 | 0.47 | 0.74 | 5.89 |
| Benzaldehydehyde | 23.96 | 4.04 | 3.71 | - | - | - |
| Benzaldehyde | - | - | - | 3.11 | 7.81 | 10.47 |
| Benzeneacetaldehyde | 50.39 | 6.52 | 5.00 | 3.58 | 5.08 | 7.25 |
| 2-Phenyl-2-butenal | - | - | 1.50 | 0.10 | 0.33 | 2.15 |
| 5-Methyl-2-phenyl-2-hexenal | - | - | 0.56 | - | - | - |
| subtotal | 194.75 | 36.91 | 128.33 | 9.78 | 18.53 | 44.26 |
| Ketones | ||||||
| 1-Methoxy-2- propanone | - | - | - | 37.57 | 99.59 | 194.84 |
| 2-Pentanone | 42.00 | 11.12 | 5.42 | 7.23 | 21.10 | 14.16 |
| 2-Heptanone | 79.36 | 11.23 | 9.92 | 1.53 | 2.62 | 1.33 |
| Acetoin | 23.73 | 3.89 | - | 2.24 | 8.15 | 5.87 |
| 2-Methyltetrahydro 3-furanone | - | - | 1.19 | - | - | - |
| 3-Hepten-2-one | 2.95 | 0.46 | 1.23 | - | - | - |
| 2-Nonanone | 40.64 | 8.30 | 22.00 | 0.53 | 1.29 | 0.95 |
| Acetoxyacetone | - | - | 1.10 | - | - | - |
| Butyrolactone | - | - | - | 0.28 | 0.68 | 3.39 |
| Acetophenone | 7.03 | 1.15 | 0.98 | 0.57 | 1.09 | 1.47 |
| Pantolactone | 1.84 | 0.21 | 1.11 | 0.16 | 0.23 | 0.29 |
| 5-Acetyldihydro-2(3H)-furanone | - | - | 0.56 | - | - | - |
| 3,5-Dihydroxy-6- methyl-2,3-dihydro-4H-pyran-4-one | - | - | 0.49 | - | - | - |
| subtotal | 197.55 | 36.36 | 44.00 | 50.11 | 134.75 | 222.30 |
| Acids | ||||||
| Acetic acid | 29.68 | 4.56 | 12.99 | 0.89 | 3.75 | 7.92 |
| Isobutyric acid | 56.45 | 9.75 | 15.17 | - | - | - |
| Isovaleric acid | 3.55 | 0.50 | 3.96 | - | - | - |
| Valeric acid | - | 28.88 | 41.98 | 0.60 | 1.91 | 3.70 |
| subtotal | 89.68 | 43.69 | 74.1 | 1.49 | 5.66 | 11.62 |
| Esters | ||||||
| Ethyl acetate | - | - | - | 5.48 | 16.24 | 51.18 |
| Isobutyl acetate | 3.94 | 1.74 | - | 3.66 | 8.80 | 11.25 |
| Isoamyl acetate | 101.26 | 15.69 | 9.27 | 24.65 | 47.76 | 65.80 |
| Dimethyl sulfuroate | 4.87 | 0.66 | 1.53 | 0.47 | 0.65 | 1.73 |
| Ethy hexanoate | 8.15 | 1.33 | 1.22 | 1.38 | 3.76 | 6.65 |
| 1-Methylhexyl acetate | 9.14 | 1.15 | 3.53 | - | 0.41 | - |
| Isoamyl butyrate | - | 0.21 | - | 0.42 | 0.75 | 1.68 |
| n-Amyl isovalerate | 3.80 | 0.53 | 0.39 | - | 0.29 | - |
| Isobutyl hexanoate | - | - | - | 0.36 | 0.74 | 0.95 |
| Ethyl octanoate | - | 0.86 | 1.31 | 1.47 | 2.60 | 5.34 |
| Isopentyl hexanoate | - | - | - | 0.29 | 0.79 | 2.29 |
| Ethyl benzoate | - | - | 1.56 | 0.43 | 1.03 | 1.51 |
| Methyl phenylacetate | - | - | 0.35 | - | - | - |
| β-Phenethyl formate | - | - | - | -- | - | 0.44 |
| 4-Ethylphenyl acetate | 1.24 | 0.24 | 0.62 | 0.27 | 0.49 | 0.84 |
| 2-Phenylethyl acetate | 22.11 | 3.57 | 5.37 | 3.69 | 8.30 | 14.62 |
| Isobutyl benzoate | 1.25 | 0.29 | 045 | 0.19 | 0.22 | 0.36 |
| subtotal | 155.76 | 26.27 | 70.15 | 42.76 | 92.83 | 164.64 |
| Terpenes | ||||||
| β-Myrcene | 2.84 | 0.36 | - | 0.32 | 0.96 | 3.85 |
| dℓ-Limonene | - | - | - | 0.50 | - | - |
| Styrene | 8.84 | 0.93 | - | 1.33 | 2.56 | - |
| Alloocimene | - | - | - | - | 0.26 | - |
| cis-Linalool oxide | 2.33 | 0.37 | 0.81 | 0.27 | 0.55 | 0.89 |
| trans-Linalool oxide | 5.45 | 0.78 | 0.97 | 0.48 | 1.22 | 1.76 |
| Naphthalene | - | - | - | 0.17 | 0.19 | - |
| 1-Ethenyl- naphthalene | - | - | - | 0.09 | - | 0.78 |
| subtotal | 19.46 | 2.44 | 1.78 | 3.16 | 8.90 | 7.28 |
| Pyrazines | ||||||
| Methyl-pyrazine | - | - | 9.75 | - | - | 17.07 |
| 2,5-Dimethyl- pyrazine | - | - | - | - | - | 14.64 |
| 2,6-Dimethyl- pyrazine | - | - | - | - | - | 6.40 |
| Ethylpyrazine | - | - | 2.73 | - | - | 3.95 |
| 2,3-Dimethylpyrazine | - | - | 0.42 | - | - | 2.77 |
| 2-Ethyl-6-methyl- pyrazine | - | - | 2.71 | - | - | 5.21 |
| 2-Methyl-5- ethylpyrazine | - | - | 3.25 | - | - | 4.73 |
| Trimethyl pyrazine | 6.90 | 0.40 | 6.16 | 0.40 | - | 11.89 |
| 2,6-Diethyl-pyrazine | - | - | 1.21 | - | - | 0.76 |
| 2-Ethyl-3,5-dimethyl pyrazine | - | - | 6.36 | - | - | - |
| 2-Ethyl-3,6-dimethyl- pyrazine | - | - | - | - | - | 11.50 |
| 2,5-Diethylpyrazine | - | - | - | - | - | 0.39 |
| 2,5-Diethylpyrazine | - | - | - | - | - | 3.23 |
| 5-Ethyl-2,3-dimethyl-pyrazine | - | - | 1.80 | - | - | - |
| Tetramethyl pyrazine | 30.15 | 1.65 | 3.87 | - | - | - |
| 3,5-Diethyl-2-methyl- pyrazine | - | - | 1.12 | - | - | - |
| 2,3,5-Ttrimethyl-6- ethylpyrazine | - | - | 1.33 | - | - | 3.10 |
| subtotal | 37.05 | 2.05 | 40.71 | 0.4 | 0 | 85.64 |
| Others | ||||||
| 2,3-Dihydrofuran | - | - | 2.98 | - | - | - |
| 2,5Diethyltetrahydro-furan | 1.29 | 0.25 | 0.17 | - | - | - |
| 2-Acetylfuran | 0.75 | 0.75 | 3.25 | - | - | 2.09 |
| Propyl nitrite | 4.84 | 0.93 | 2.25 | - | - | - |
| 2-Acetylpyrrole | - | - | 2.08 | - | - | - |
| Benzothiazole | - | - | - | - | - | 1.71 |
| Phenol | - | - | - | 0.25 | - | 0.26 |
| subtotal | 6.88 | 1.93 | 10.73 | 0.25 | 0.00 | 4.06 |
Publisher’s Note: MDPI stays neutral with regard to jurisdictional claims in published maps and institutional affiliations. |
© 2022 by the authors. Licensee MDPI, Basel, Switzerland. This article is an open access article distributed under the terms and conditions of the Creative Commons Attribution (CC BY) license (https://creativecommons.org/licenses/by/4.0/).
Share and Cite
Lin, L.-Y.; Chen, K.-F.; Changchien, L.-L.; Chen, K.-C.; Peng, R.Y. Volatile Variation of Theobroma cacao Malvaceae L. Beans Cultivated in Taiwan Affected by Processing via Fermentation and Roasting. Molecules 2022, 27, 3058. https://doi.org/10.3390/molecules27103058
Lin L-Y, Chen K-F, Changchien L-L, Chen K-C, Peng RY. Volatile Variation of Theobroma cacao Malvaceae L. Beans Cultivated in Taiwan Affected by Processing via Fermentation and Roasting. Molecules. 2022; 27(10):3058. https://doi.org/10.3390/molecules27103058
Chicago/Turabian StyleLin, Li-Yun, Kwei-Fan Chen, Lin-Ling Changchien, Kuan-Chou Chen, and Robert Y. Peng. 2022. "Volatile Variation of Theobroma cacao Malvaceae L. Beans Cultivated in Taiwan Affected by Processing via Fermentation and Roasting" Molecules 27, no. 10: 3058. https://doi.org/10.3390/molecules27103058
APA StyleLin, L.-Y., Chen, K.-F., Changchien, L.-L., Chen, K.-C., & Peng, R. Y. (2022). Volatile Variation of Theobroma cacao Malvaceae L. Beans Cultivated in Taiwan Affected by Processing via Fermentation and Roasting. Molecules, 27(10), 3058. https://doi.org/10.3390/molecules27103058