
Anticancer Effects of Propionic Acid Inducing Cell Death in Cervical Cancer Cells

 ,
,  ,
,  , , ,
, , ,  and
and 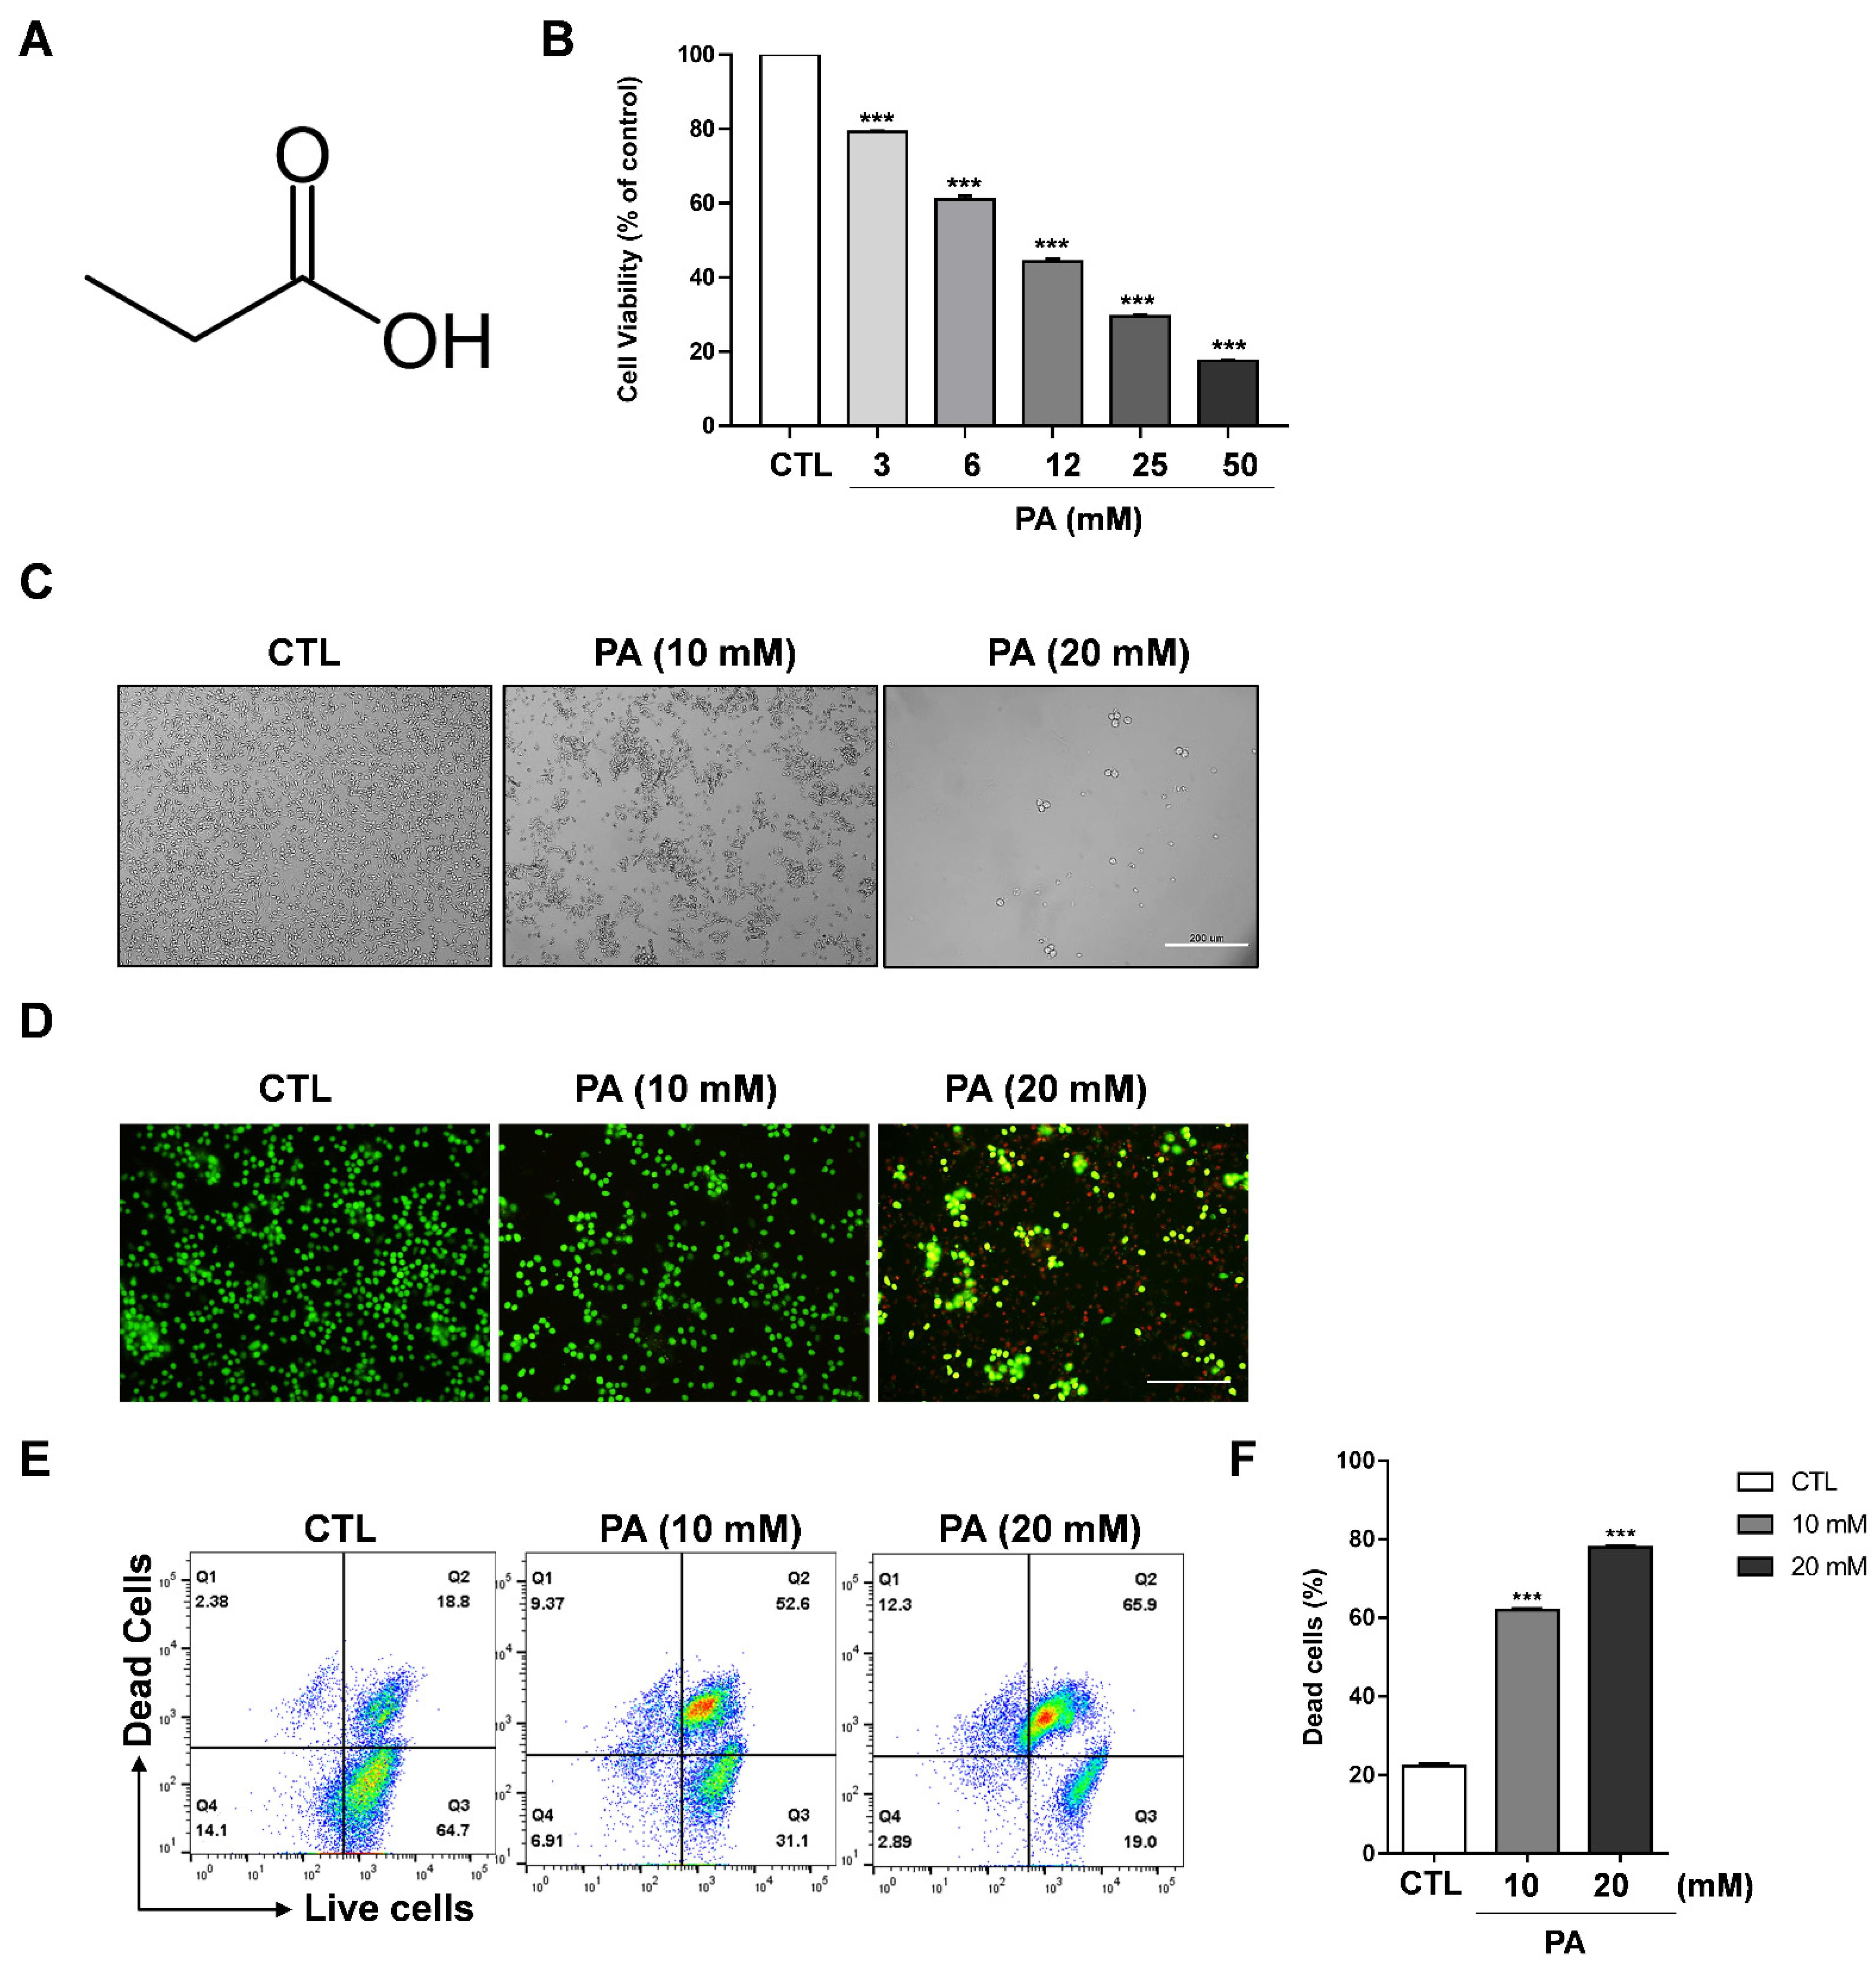
Abstract
:1. Introduction
2. Results and Discussion
2.1. Cytotoxic Effect of PA in HeLa Cells
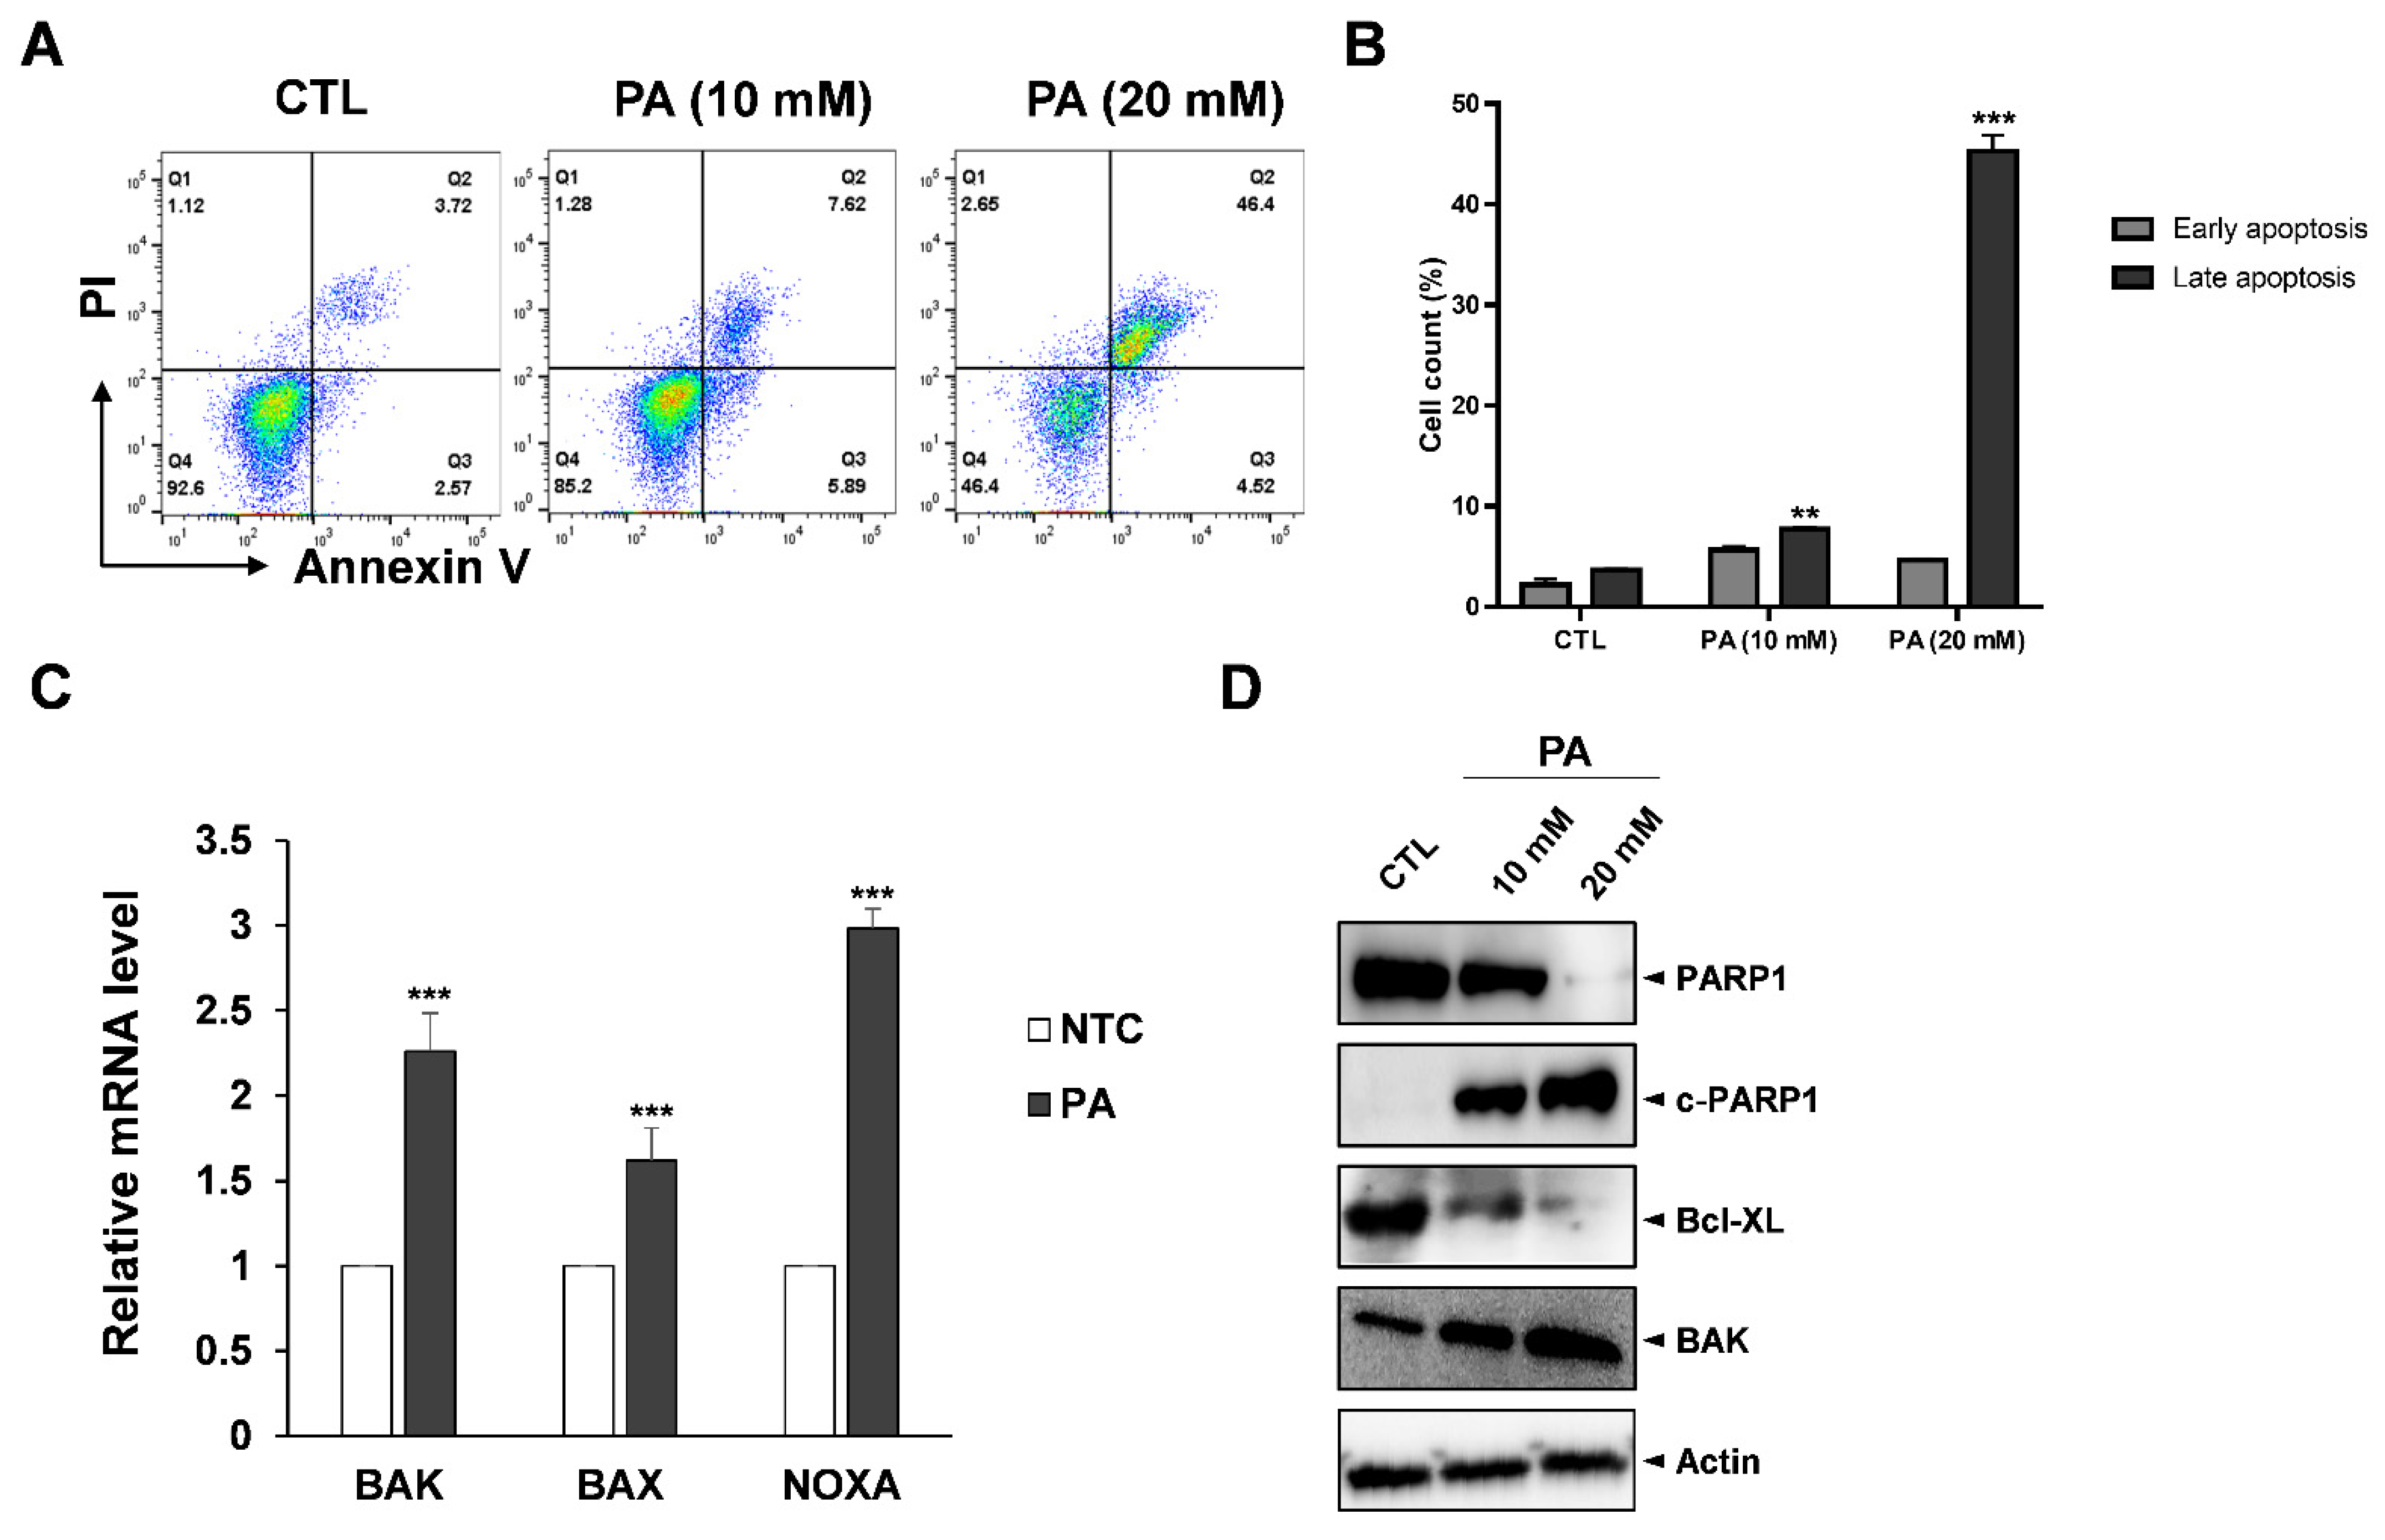
2.2. PA-Induced Apoptosis in HeLa Cells
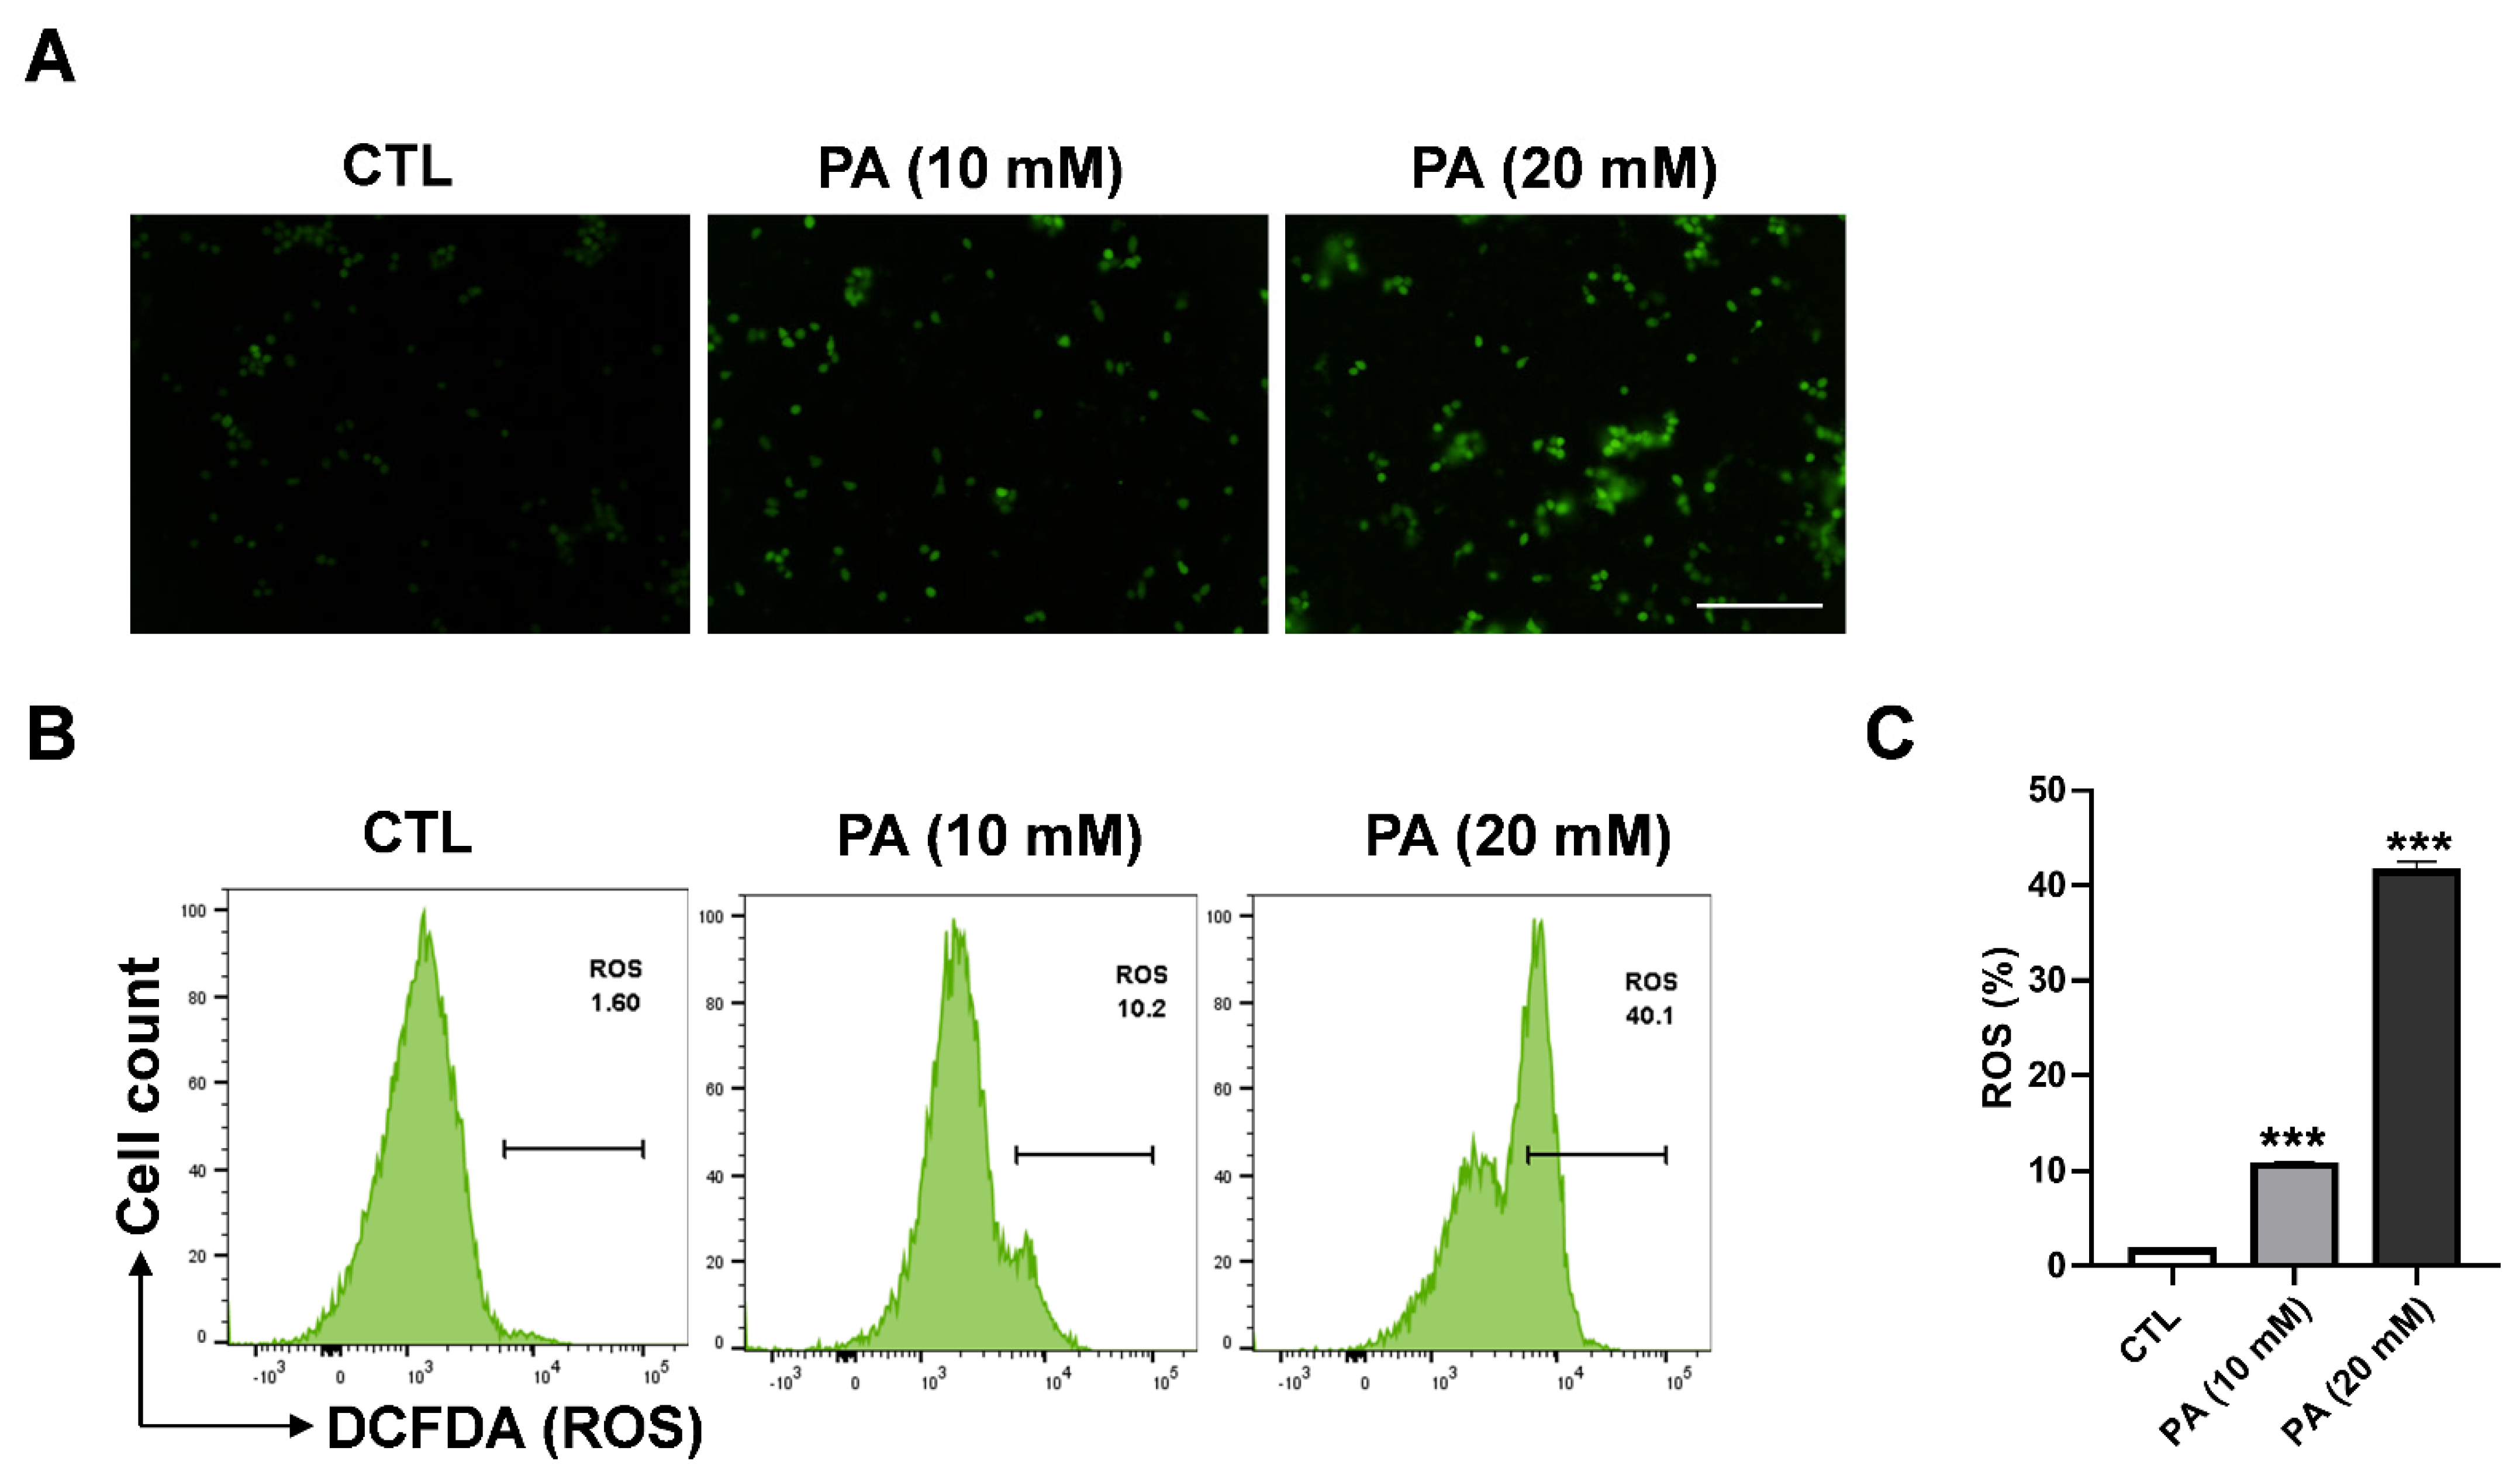
2.3. Intracellular ROS Generation in HeLa Cells Triggered by PA
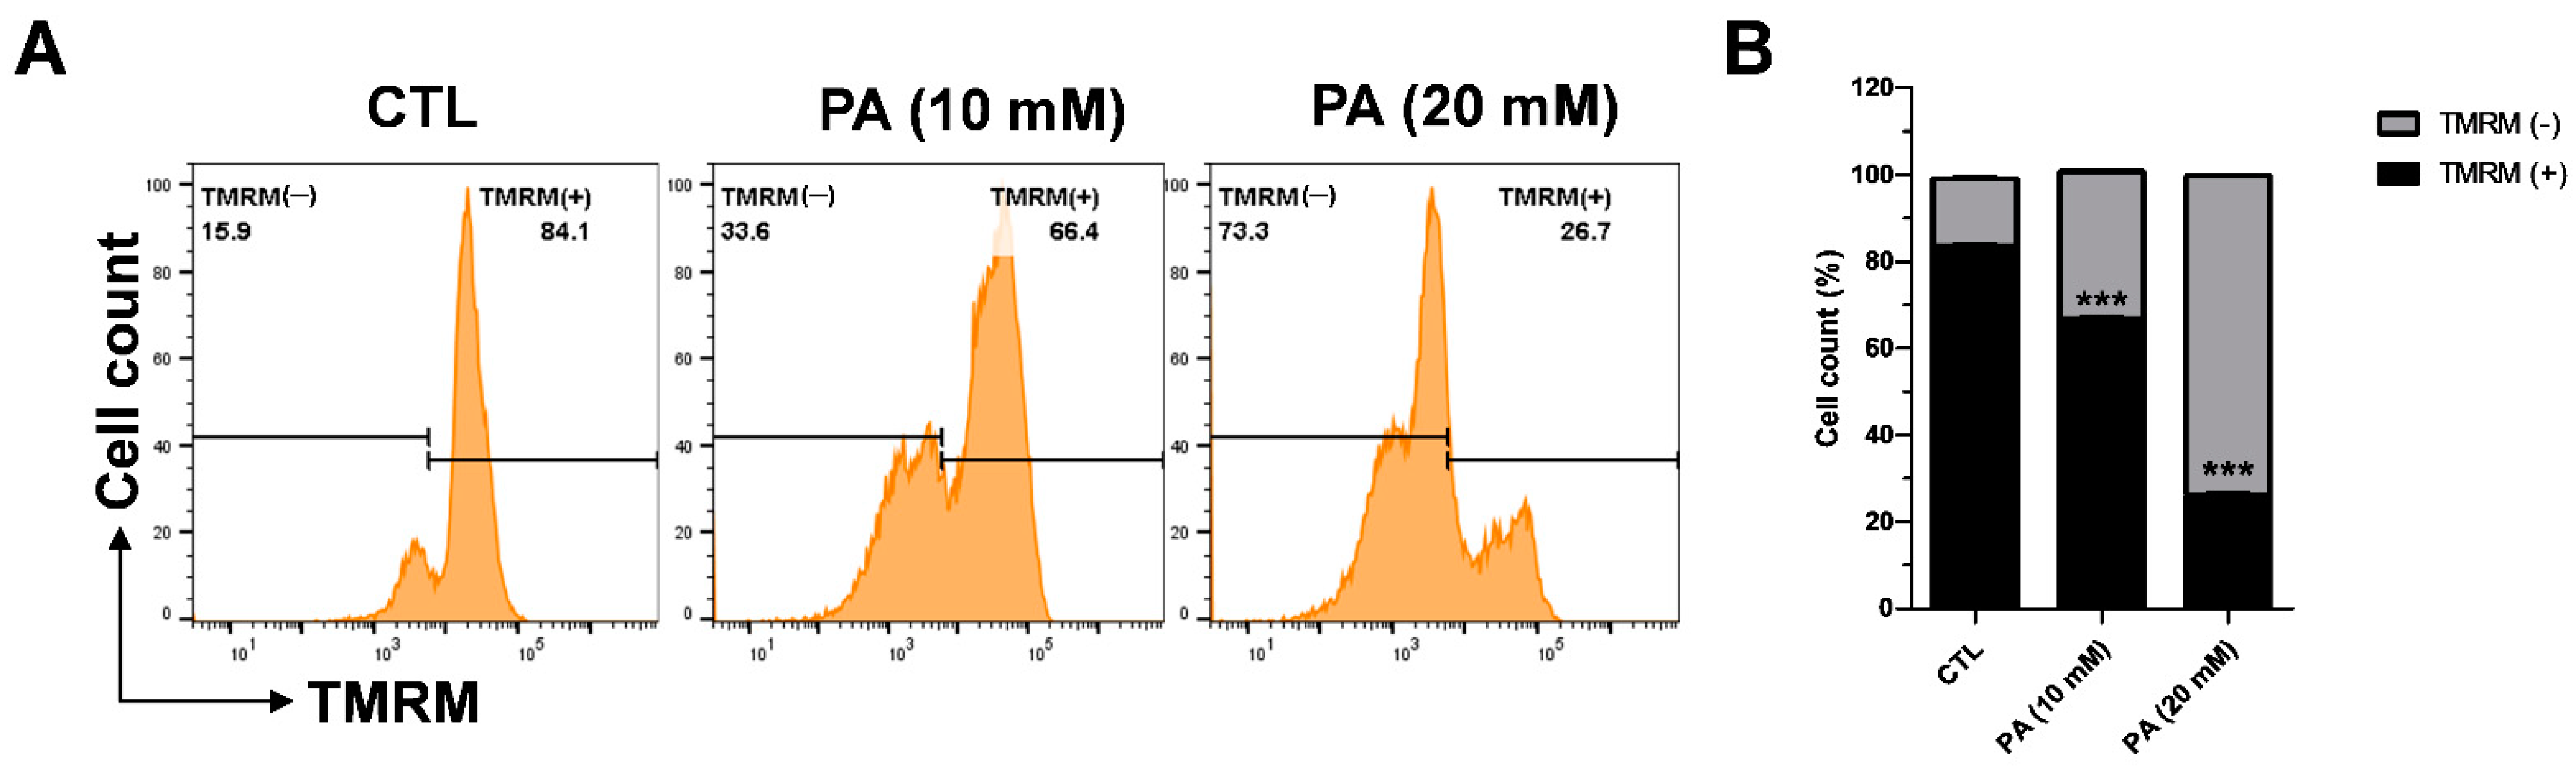
2.4. PA-Induced Mitochondrial Membrane Dysfunction
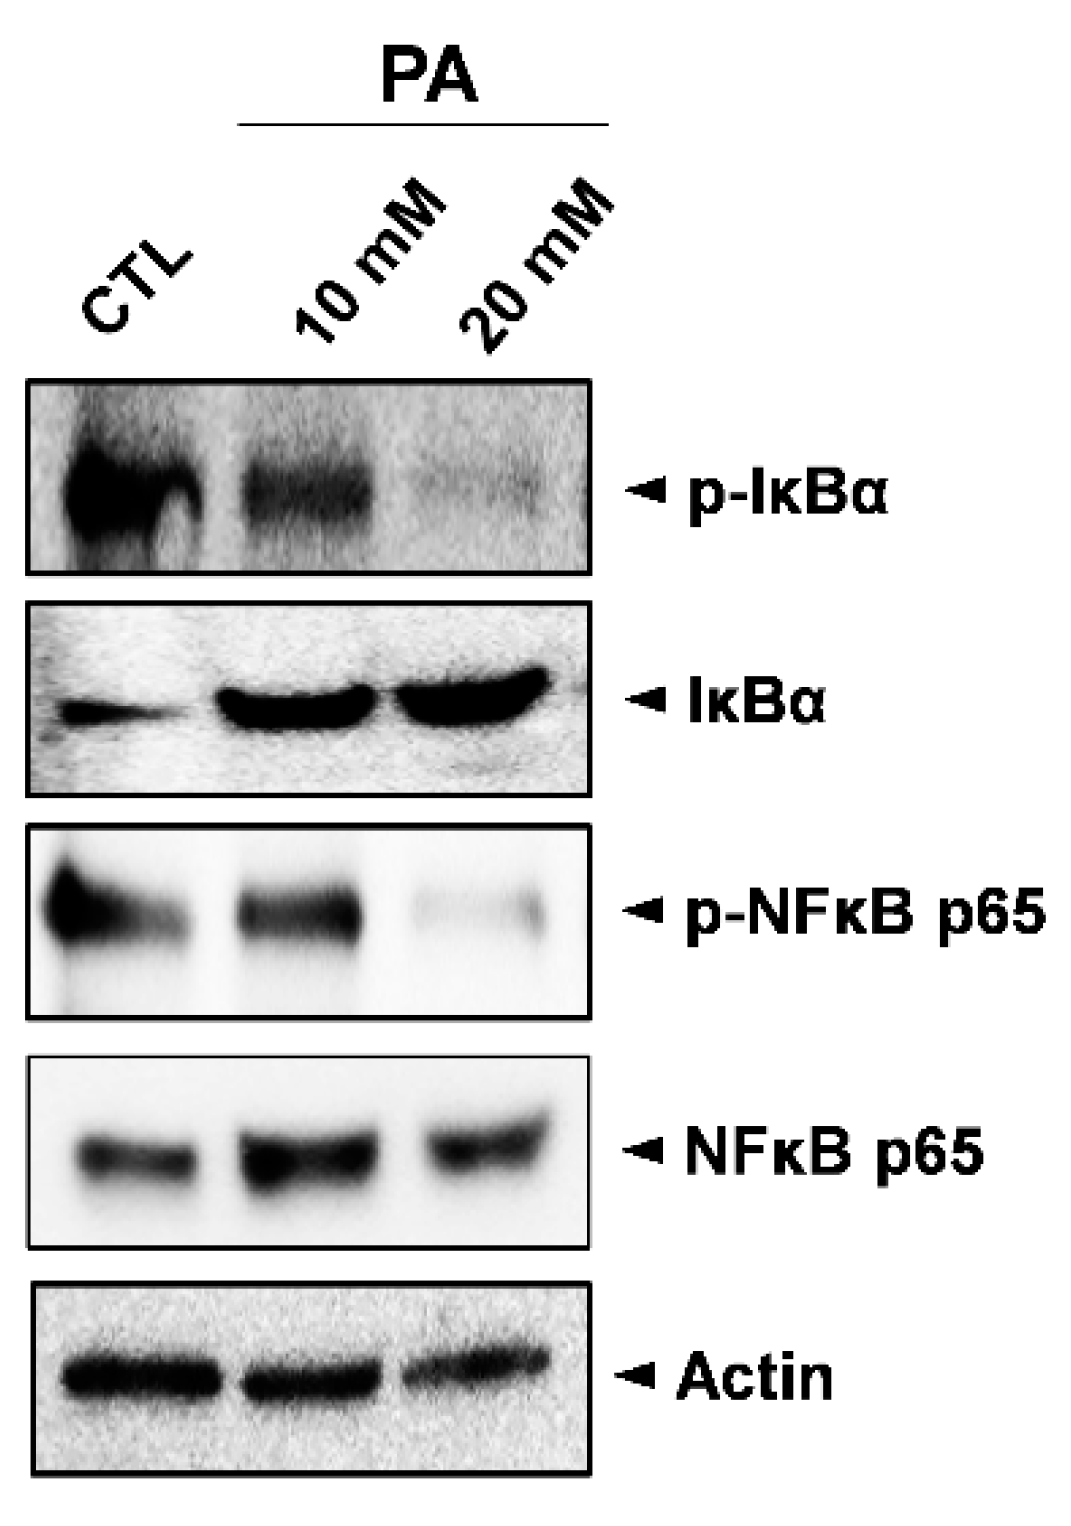
2.5. Inhibition Analysis of NF-κB
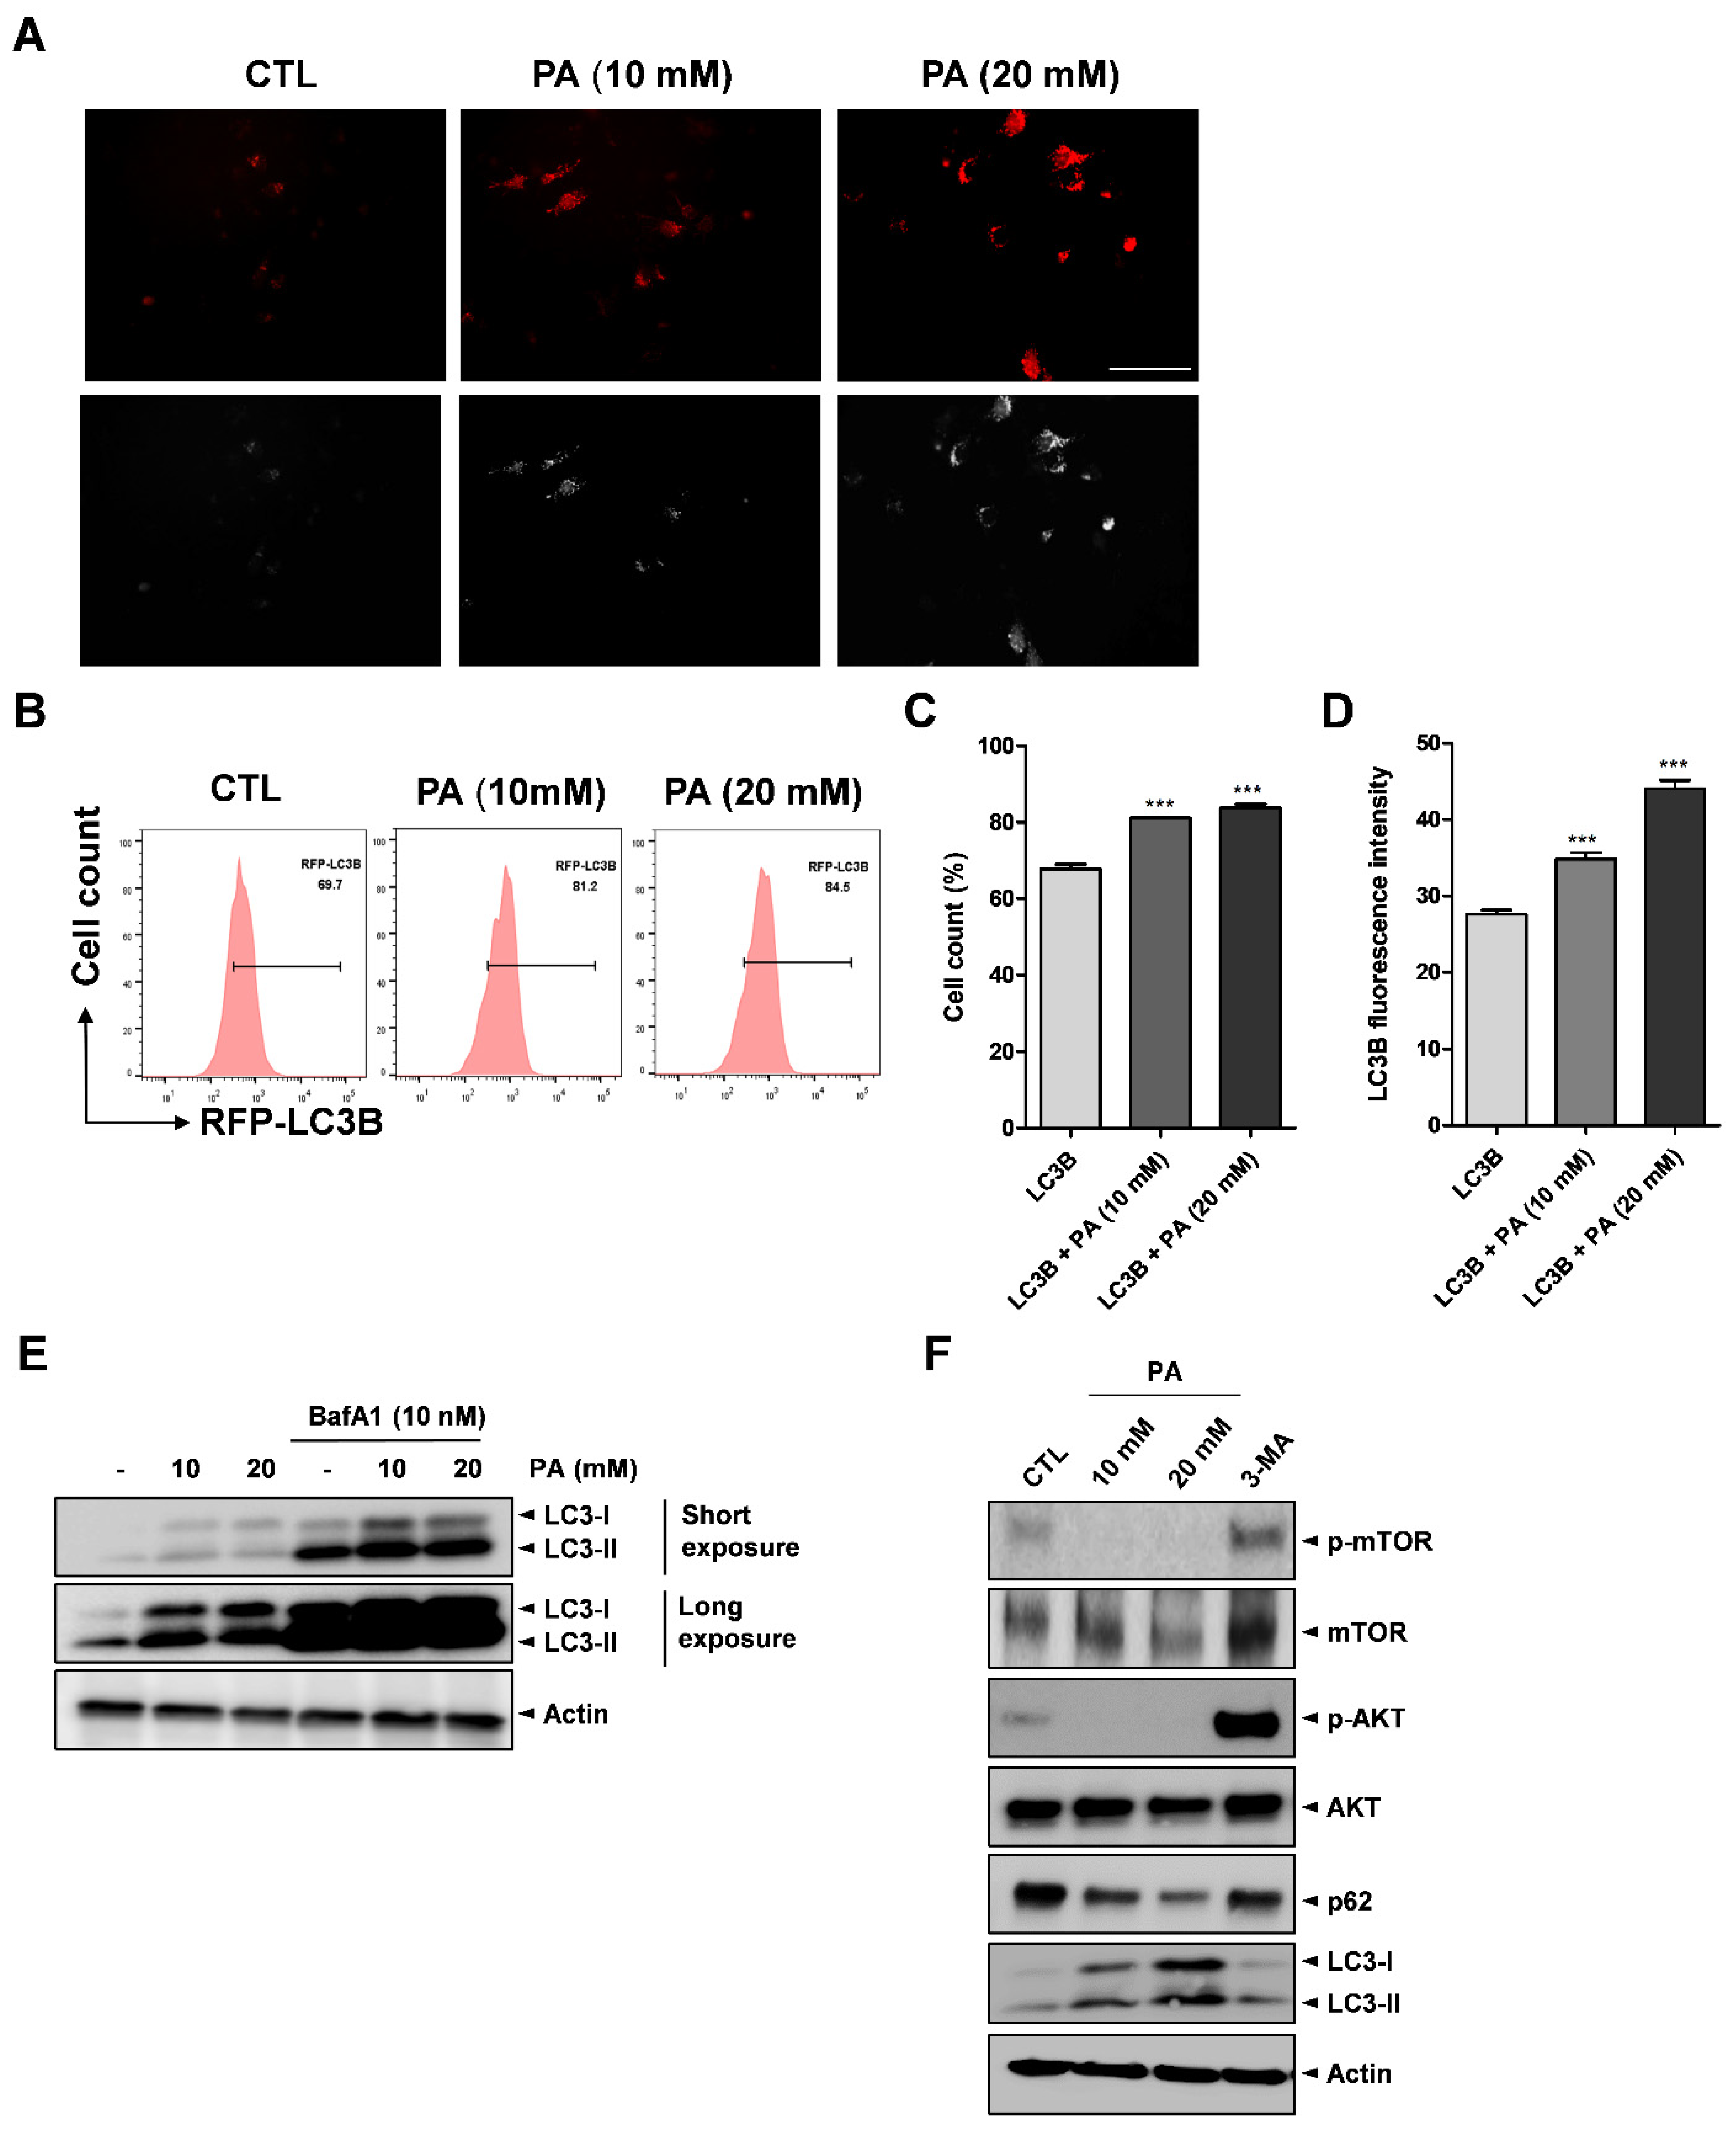
2.6. Activation of Autophagy by PA
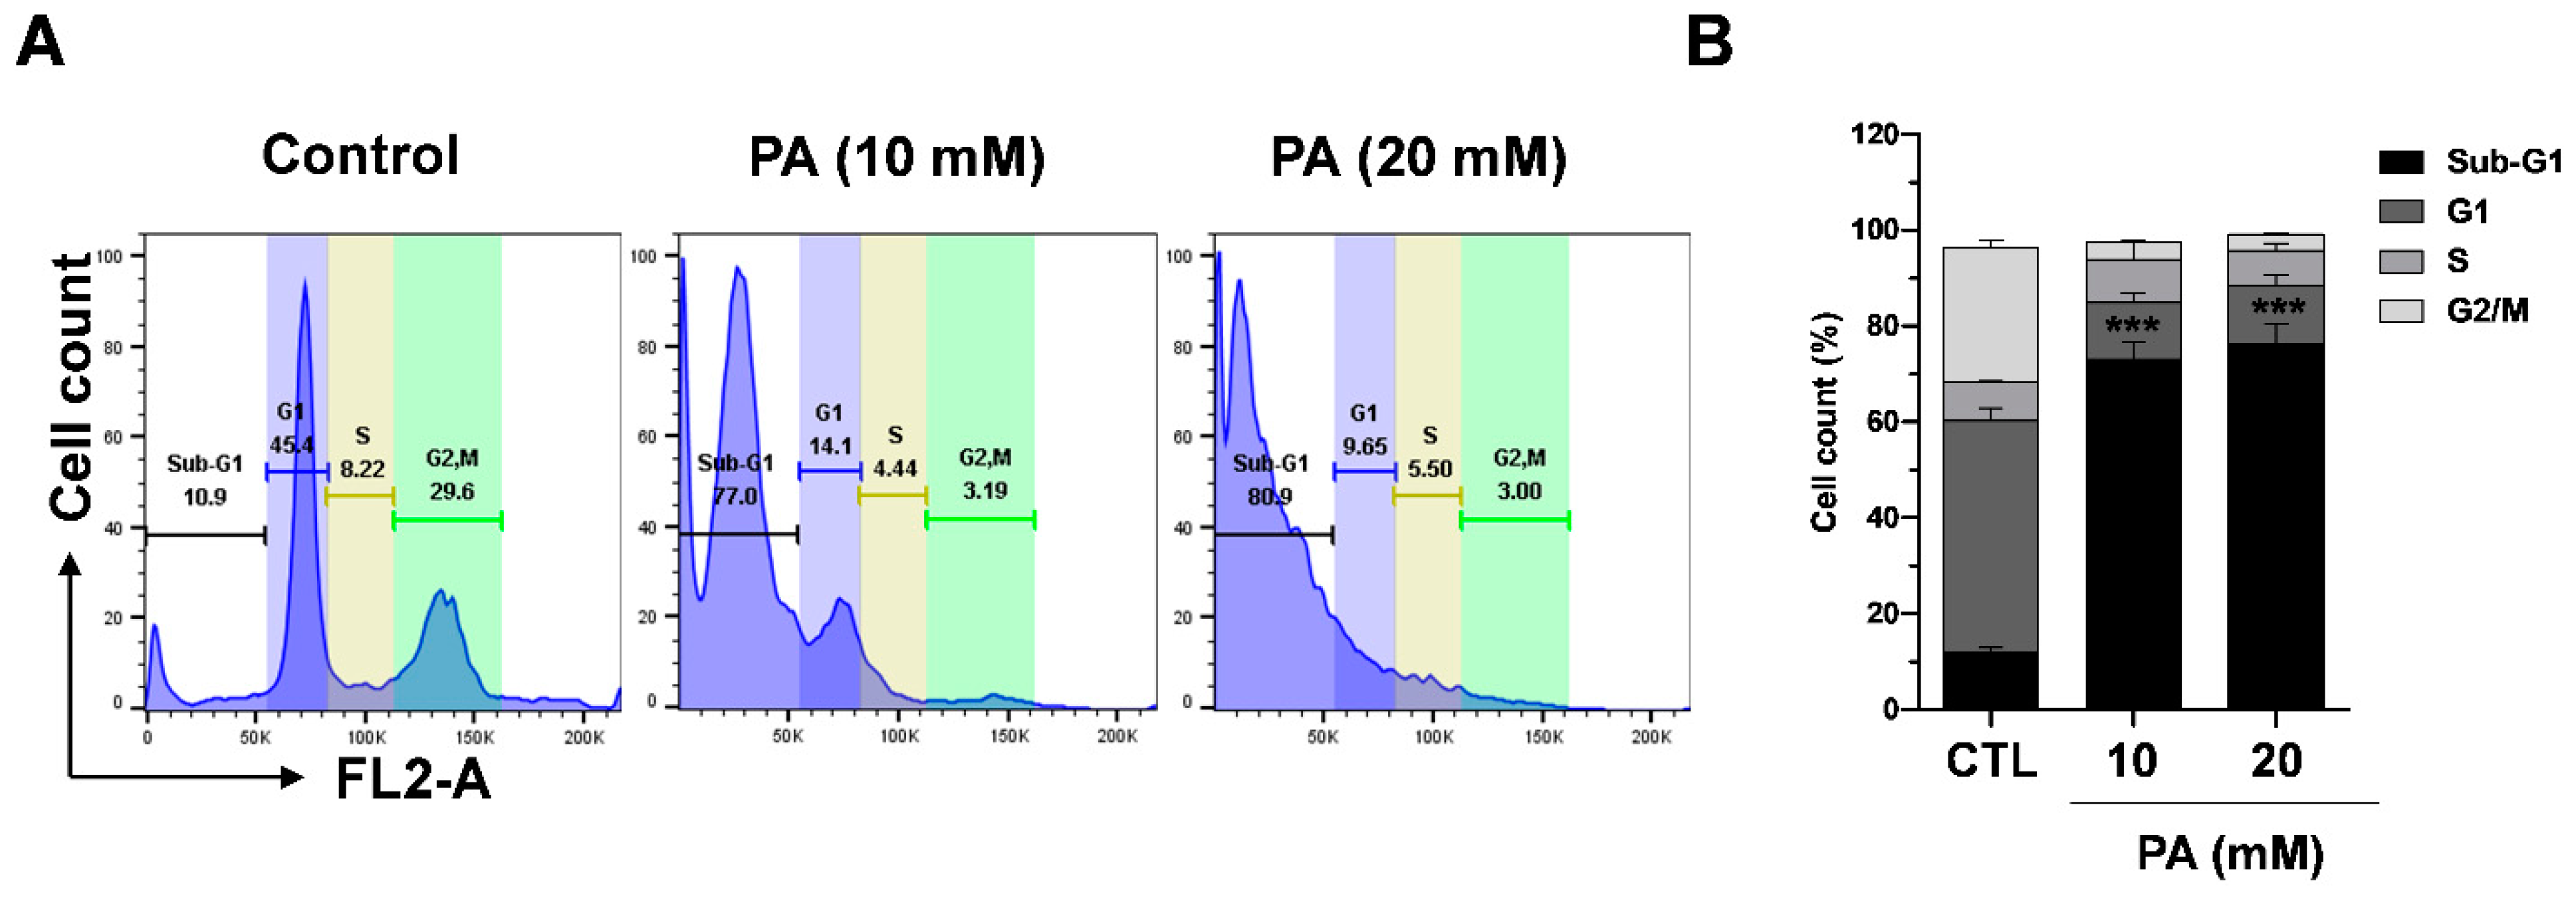
2.7. PA-Induced Cell Cycle Distribution in HeLa Cells
3. Materials and Methods
3.1. Cell Culture
3.2. Cell Viability Assay
3.3. Microscopy
3.4. Mitochondrial Membrane Potential (Δψm) Assay
3.5. Measurement of Reactive Oxygen Species (ROS)
3.6. Apoptosis Analysis
3.7. Western Blot Analysis
3.8. RT-qPCR
3.9. Transfection
3.10. Live-Dead Assay
3.11. Cell Cycle Analysis
3.12. Statistical Analysis
4. Conclusions
Supplementary Materials
Author Contributions
Funding
Institutional Review Board Statement
Informed Consent Statement
Data Availability Statement
Acknowledgments
Conflicts of Interest
Sample Availability
References
- Torre, L.A.; Islami, F.; Siegel, R.L.; Ward, E.M.; Jemal, A. Global cancer in women: Burden and trends. Cancer Epidemiol. Biomark. Prev. 2017, 26, 444–457. [Google Scholar] [CrossRef] [PubMed] [Green Version]
- Siegel, R.L.; Miller, K.D.; Jemal, A. Cancer statistics, 2020. CA Cancer J. Clin. 2020, 70, 7–30. [Google Scholar] [CrossRef] [PubMed]
- Schiffman, M.; Doorbar, J.; Wentzensen, N.; De Sanjosé, S.; Fakhry, C.; Monk, B.J.; Stanley, M.A.; Franceschi, S. Carcinogenic human papillomavirus infection. Nat. Rev. Dis. Prim. 2016, 2, 1–20. [Google Scholar] [CrossRef] [PubMed]
- Moody, C.A.; Laimins, L.A. Human papillomavirus oncoproteins: Pathways to transformation. Nat. Rev. Cancer 2010, 10, 550–560. [Google Scholar] [CrossRef]
- Olusola, P.; Banerjee, H.N.; Philley, J.V.; Dasgupta, S. Human Papilloma Virus-Associated Cervical Cancer and Health Disparities. Cells 2019, 8, 622. [Google Scholar] [CrossRef] [Green Version]
- Kechagia, M.; Basoulis, D.; Konstantopoulou, S.; Dimitriadi, D.; Gyftopoulou, K.; Skarmoutsou, N.; Fakiri, E.M. Health Benefits of Probiotics: A Review. ISRN Nutr. 2013, 2013, 1–7. [Google Scholar] [CrossRef] [PubMed] [Green Version]
- Sanders, M.E.; Merenstein, D.J.; Reid, G.; Gibson, G.R.; Rastall, R.A. Probiotics and prebiotics in intestinal health and disease: From biology to the clinic. Nat. Rev. Gastroenterol. Hepatol. 2019, 16, 605–616. [Google Scholar] [CrossRef]
- Vivarelli, S.; Salemi, R.; Candido, S.; Falzone, L.; Santagati, M.; Stefani, S.; Torino, F.; Banna, G.L.; Tonini, G.; Libra, M. Gut microbiota and cancer: From pathogenesis to therapy. Cancers 2019, 11, 38. [Google Scholar] [CrossRef] [Green Version]
- Lee, J.-E.; Lee, J.; Kim, J.H.; Cho, N.; Lee, S.H.; Park, S.B.; Koh, B.; Kang, D.; Kim, S.; Yoo, H.M. Characterization of the Anti-Cancer Activity of the Probiotic Bacterium Lactobacillus fermentum Using 2D vs. 3D Culture in Colorectal Cancer Cells. Biomolecules 2019, 9, 557. [Google Scholar]
- Ding, C.; Tang, W.; Fan, X.; Wu, G. Intestinal microbiota: A novel perspective in colorectal cancer biotherapeutics. Onco Targets Ther. 2018, 11–4797. [Google Scholar] [CrossRef] [Green Version]
- Rajoka, M.S.R.; Zhao, H.; Lu, Y.; Lian, Z.; Li, N.; Hussain, N.; Shao, D.; Jin, M.; Li, Q.; Shi, J. Anticancer potential against cervix cancer (HeLa) cell line of probiotic: Lactobacillus casei and Lactobacillus paracasei strains isolated from human breast milk. Food Funct. 2018, 9, 2705–2715. [Google Scholar] [CrossRef]
- Górska, A.; Przystupski, D.; Niemczura, M.J.; Kulbacka, J. Probiotic Bacteria: A Promising Tool in Cancer Prevention and Therapy. Curr. Microbiol. 2019, 76, 939–949. [Google Scholar] [CrossRef] [Green Version]
- Curty, G.; de Carvalho, P.S.; Soares, M.A. The role of the cervicovaginal microbiome on the genesis and as a biomarker of premalignant cervical intraepithelial neoplasia and invasive cervical cancer. Int. J. Mol. Sci. 2020, 21, 222. [Google Scholar] [CrossRef] [Green Version]
- Chase, D.; Goulder, A.; Zenhausern, F.; Monk, B.; Herbst-Kralovetz, M. The vaginal and gastrointestinal microbiomes in gynecologic cancers: A review of applications in etiology, symptoms and treatment. Gynecol. Oncol. 2015, 138, 190–200. [Google Scholar] [CrossRef] [PubMed]
- Audirac-Chalifour, A.; Torres-Poveda, K.; Bahena-Román, M.; Téllez-Sosa, J.; Martínez-Barnetche, J.; Cortina-Ceballos, B.; López-Estrada, G.; Delgado-Romero, K.; Burguete-García, A.I.; Cantú, D.; et al. Cervical Microbiome and Cytokine Profile at Various Stages of Cervical Cancer: A Pilot Study. PLoS ONE 2016, 11, e0153274. [Google Scholar] [CrossRef]
- Tachedjian, G.; Aldunate, M.; Bradshaw, C.S.; Cone, R.A. The role of lactic acid production by probiotic Lactobacillus species in vaginal health. Res. Microbiol. 2017, 168, 782–792. [Google Scholar] [CrossRef] [PubMed]
- Martin, D.H. The microbiota of the vagina and its influence on women’s health and disease. Am. J. Med. Sci. 2012, 343, 2–9. [Google Scholar] [CrossRef] [Green Version]
- Pourmollaei, S.; Barzegari, A.; Farshbaf-Khalili, A.; Nouri, M.; Fattahi, A.; Shahnazi, M.; Dittrich, R. Anticancer effect of bacteria on cervical cancer: Molecular aspects and therapeutic implications. Life Sci. 2020, 246, 117413. [Google Scholar] [CrossRef] [PubMed]
- Aldunate, M.; Srbinovski, D.; Hearps, A.C.; Latham, C.F.; Ramsland, P.A.; Gugasyan, R.; Cone, R.A.; Tachedjian, G. Antimicrobial and immune modulatory effects of lactic acid and short chain fatty acids produced by vaginal microbiota associated with eubiosis and bacterial vaginosis. Front. Physiol. 2015, 6, 1–23. [Google Scholar] [CrossRef]
- Feng, W.; Ao, H.; Peng, C. Gut microbiota, short-chain fatty acids, and herbal medicines. Front. Pharmacol. 2018, 9, 1–12. [Google Scholar] [CrossRef] [PubMed]
- Delgado-Diaz, D.J.; Tyssen, D.; Hayward, J.A.; Gugasyan, R.; Hearps, A.C.; Tachedjian, G. Distinct Immune Responses Elicited From Cervicovaginal Epithelial Cells by Lactic Acid and Short Chain Fatty Acids Associated With Optimal and Non-optimal Vaginal Microbiota. Front. Cell. Infect. Microbiol. 2020, 9, 1–13. [Google Scholar] [CrossRef] [Green Version]
- Matsuya-Ogawa, M.; Shibata, T.; Itoh, H.; Murakami, H.; Yaguchi, C.; Sugihara, K.; Kanayama, N. Oncoprotective Effects of Short-Chain Fatty Acids on Uterine Cervical Neoplasia. Nutr. Cancer 2019, 71, 312–319. [Google Scholar] [CrossRef]
- Michaud, M.; Martins, I.; Sukkurwala, A.Q.; Adjemian, S.; Ma, Y.; Pellegatti, P.; Shen, S.; Kepp, O.; Scoazec, M.; Mignot, G.; et al. Autophagy-dependent anticancer immune responses induced by chemotherapeutic agents in mice. Science 2011, 334, 1573–1577. [Google Scholar] [CrossRef]
- Condello, M.; Pellegrini, E.; Caraglia, M.; Meschini, S. Targeting autophagy to overcome human diseases. Int. J. Mol. Sci. 2019, 20, 725. [Google Scholar] [CrossRef] [Green Version]
- Mizushima, N. Autophagy: Process and function. Genes Dev. 2007, 21, 2861–2873. [Google Scholar] [CrossRef] [Green Version]
- Clarke, P.G.H. Developmental cell death: Morphological diversity and multiple mechanisms. Anat. Embryol. 1990, 181, 195–213. [Google Scholar] [CrossRef]
- Kondo, Y.; Kanzawa, T.; Sawaya, R.; Kondo, S. The role of autophagy in cancer development and response to therapy. Nat. Rev. Cancer 2005, 5, 726–734. [Google Scholar] [CrossRef] [PubMed]
- Bursch, W.; Ellinger, A.; Kienzl, H.; Török, L.; Pandey, S.; Sikorska, M.; Walker, R.; Hermann, R.S. Active cell death induced by the anti-estrogens tamoxifen and ICI 164 384 in human mammary carcinoma cells (MCF-7) in culture: The role of autophagy. Carcinogenesis 1996, 17, 1595–1607. [Google Scholar] [CrossRef] [Green Version]
- Ellington, A.A.; Berhow, M.; Singletary, K.W. Induction of macroautophagy in human colon cancer cells by soybean B-group triterpenoid saponins. Carcinogenesis 2005, 26, 159–167. [Google Scholar] [CrossRef] [PubMed] [Green Version]
- Tang, Y.; Chen, Y.; Jiang, H.; Nie, D. Short-chain fatty acids induced autophagy serves as an adaptive strategy for retarding mitochondria-mediated apoptotic cell death. Cell Death Differ. 2011, 18, 602–618. [Google Scholar] [CrossRef] [PubMed]
- Rubinsztein, D.C.; Gestwicki, J.E.; Murphy, L.O.; Klionsky, D.J. Potential therapeutic applications of autophagy. Nat. Rev. Drug Discov. 2007, 6, 304–312. [Google Scholar] [CrossRef] [PubMed]
- Ghavami, S.; Eshragi, M.; Ande, S.R.; Chazin, W.J.; Klonisch, T.; Halayko, A.J.; McNeill, K.D.; Hashemi, M.; Kerkhoff, C.; Los, M. S100A8/A9 induces autophagy and apoptosis via ROS-mediated cross-talk between mitochondria and lysosomes that involves BNIP3. Cell Res. 2010, 20, 314–331. [Google Scholar] [CrossRef] [PubMed] [Green Version]
- Liu, J.; Guo, W.; Li, J.; Li, X.; Geng, J.; Chen, Q.; Gao, J. Tumor-targeting novel manganese complex induces ROS-mediated apoptotic and autophagic cancer cell death. Int. J. Mol. Med. 2015, 35, 607–616. [Google Scholar] [CrossRef] [Green Version]
- Logue, S.E.; Elgendy, M.; Martin, S.J. Expression, purification and use of recombinant annexin V for the detection of apoptotic cells. Nat. Protoc. 2009, 4, 1383–1395. [Google Scholar] [CrossRef]
- Takara, K.; Sakaeda, T.; Yagami, T.; Kobayashi, H.; Ohmoto, N.; Horinouchi, M.; Nishiguchi, K.; Okumura, K. Cytotoxic effects of 27 anticancer drugs in HeLa and MDR1-overexpressing derivative cell lines. Biol. Pharm. Bull. 2002, 25, 771–778. [Google Scholar] [CrossRef] [Green Version]
- Peng, J.; Zhao, J.; Zhao, Y.; Wu, P.; Gou, L.; Fu, S.; Chen, P.; Lu, Y.; Yang, L. HeLa Cell-Derived Paclitaxel-Loaded Microparticles Efficiently Inhibit the Growth of Cervical Carcinoma. Int. J. Nanomed. 2020, 15, 6409–6420. [Google Scholar] [CrossRef]
- Westphal, D.; Dewson, G.; Czabotar, P.E.; Kluck, R.M. Molecular biology of Bax and Bak activation and action. Biochim. Biophys. Acta Mol. Cell Res. 2011, 1813, 521–531. [Google Scholar] [CrossRef] [Green Version]
- Dai, H.; Ding, H.; Meng, X.W.; Lee, S.H.; Schneider, P.A.; Kaufmann, S.H. Contribution of Bcl-2 phosphorylation to bak binding and drug resistance. Cancer Res. 2013, 73, 6998–7008. [Google Scholar] [CrossRef] [PubMed] [Green Version]
- Redza-Dutordoir, M.; Averill-Bates, D.A. Activation of apoptosis signalling pathways by reactive oxygen species. Biochim. Biophys. Acta Mol. Cell Res. 2016, 1863, 2977–2992. [Google Scholar] [CrossRef]
- Morgan, M.J.; Liu, Z.G. Crosstalk of reactive oxygen species and NF-κB signaling. Cell Res. 2011, 21, 103–115. [Google Scholar] [CrossRef] [Green Version]
- Bubici, C.; Papa, S.; Dean, K.; Franzoso, G. Mutual cross-talk between reactive oxygen species and nuclear factor-kappa B: Molecular basis and biological significance. Oncogene 2006, 25, 6731–6748. [Google Scholar] [CrossRef] [Green Version]
- Hayden, M.S.; Ghosh, S. NF-κB, the first quarter-century: Remarkable progress and outstanding questions. Genes Dev. 2012, 26, 203–234. [Google Scholar] [CrossRef] [Green Version]
- Perkins, N.D. Integrating cell-signalling pathways with NF-κB and IKK function. Nat. Rev. Mol. Cell Biol. 2007, 8, 49–62. [Google Scholar] [CrossRef]
- Karin, M. NF-kappaB as a critical link between inflammation and cancer. Cold Spring Harb. Perspect. Biol. 2009, 1, a000141. [Google Scholar] [CrossRef] [PubMed]
- McFarland, B.C.; Gray, G.K.; Nozell, S.E.; Hong, S.W.; Benveniste, E.N. Activation of the NF-κB pathway by the STAT3 inhibitor JSI-124 in human glioblastoma cells. Mol. Cancer Res. 2013, 11, 494–505. [Google Scholar] [CrossRef] [PubMed] [Green Version]
- Zhang, J.; Yi, M.; Zha, L.; Chen, S.; Li, Z.; Li, C.; Gong, M.; Deng, H.; Chu, X.; Chen, J.; et al. Sodium Butyrate Induces Endoplasmic Reticulum Stress and Autophagy in Colorectal Cells: Implications for Apoptosis. PLoS ONE 2016, 11, e0147218. [Google Scholar] [CrossRef]
- Iannucci, L.F.; Sun, J.; Singh, B.K.; Zhou, J.; Kaddai, V.A.; Lanni, A.; Yen, P.M.; Sinha, R.A. Short chain fatty acids induce UCP2-mediated autophagy in hepatic cells. Biochem. Biophys. Res. Commun. 2016, 480, 461–467. [Google Scholar] [CrossRef]
- Chavez-Dominguez, R.; Perez-Medina, M.; Lopez-Gonzalez, J.S.; Galicia-Velasco, M.; Aguilar-Cazares, D. The Double-Edge Sword of Autophagy in Cancer: From Tumor Suppression to Pro-tumor Activity. Front. Oncol. 2020, 10, 578418. [Google Scholar] [CrossRef] [PubMed]
- Meghil, M.M.; Tawfik, O.K.; Elashiry, M.; Rajendran, M.; Arce, R.M.; Fulton, D.J.; Schoenlein, P.V.; Cutler, C.W. Disruption of Immune Homeostasis in Human Dendritic Cells via Regulation of Autophagy and Apoptosis by Porphyromonas gingivalis. Front. Immunol. 2019, 10, 1–14. [Google Scholar] [CrossRef]
- Mizushima, N.; Yoshimori, T. How to interpret LC3 immunoblotting. Autophagy 2007, 3, 542–545. [Google Scholar] [CrossRef] [PubMed]
- Zhang, J. Teaching the basics of autophagy and mitophagy to redox biologists—Mechanisms and experimental approaches. Redox Biol. 2015, 4, 242. [Google Scholar] [CrossRef] [PubMed] [Green Version]
- Yoshii, S.R.; Mizushima, N. Monitoring and Measuring Autophagy. Int. J. Mol. Sci. 2017, 18, 1865. [Google Scholar] [CrossRef] [PubMed]
- Liu, R.; Chen, Y.; Liu, G.; Li, C.; Song, Y.; Cao, Z.; Li, W.; Hu, J.; Lu, C.; Liu, Y. PI3K/AKT pathway as a key link modulates the multidrug resistance of cancers. Cell Death Dis. 2020, 11, 1–12. [Google Scholar] [CrossRef] [PubMed]
- Xu, F.; Na, L.; Li, Y.; Chen, L. Roles of the PI3K/AKT/mTOR signalling pathways in neurodegenerative diseases and tumours. Cell Biosci. 2020, 10, 1–12. [Google Scholar] [CrossRef] [Green Version]
- Thuy, N.T.T.; Lee, J.-E.; Yoo, H.M.; Cho, N. Antiproliferative Pterocarpans and Coumestans from Lespedeza bicolor. J. Nat. Prod. 2019, 82, 3025–3032. [Google Scholar] [CrossRef] [PubMed]
- Xia, Z.; Zhang, H.; Xu, D.; Lao, Y.; Fu, W.; Tan, H.; Cao, P.; Yang, L.; Xu, H. Xanthones from the Leaves of Garcinia cowa Induce Cell Cycle Arrest, Apoptosis, and Autophagy in Cancer Cells. Molecules 2015, 20, 11387–11399. [Google Scholar] [CrossRef] [PubMed] [Green Version]
- Feng, J.; Mansouripour, A.; Xi, Z.; Zhang, L.; Xu, G.; Zhou, H.; Xu, H. Nujiangexanthone A Inhibits Cervical Cancer Cell Proliferation by Promoting Mitophagy. Molecules 2021, 26, 2858. [Google Scholar] [CrossRef] [PubMed]


Publisher’s Note: MDPI stays neutral with regard to jurisdictional claims in published maps and institutional affiliations. |
© 2021 by the authors. Licensee MDPI, Basel, Switzerland. This article is an open access article distributed under the terms and conditions of the Creative Commons Attribution (CC BY) license (https://creativecommons.org/licenses/by/4.0/).
Share and Cite
Pham, C.H.; Lee, J.-E.; Yu, J.; Lee, S.H.; Yu, K.-R.; Hong, J.; Cho, N.; Kim, S.; Kang, D.; Lee, S.; et al. Anticancer Effects of Propionic Acid Inducing Cell Death in Cervical Cancer Cells. Molecules 2021, 26, 4951. https://doi.org/10.3390/molecules26164951
Pham CH, Lee J-E, Yu J, Lee SH, Yu K-R, Hong J, Cho N, Kim S, Kang D, Lee S, et al. Anticancer Effects of Propionic Acid Inducing Cell Death in Cervical Cancer Cells. Molecules. 2021; 26(16):4951. https://doi.org/10.3390/molecules26164951
Chicago/Turabian StylePham, Chau Ha, Joo-Eun Lee, Jinha Yu, Sung Hoon Lee, Kyung-Rok Yu, Jaewoo Hong, Namki Cho, Seil Kim, Dukjin Kang, Soojin Lee, and et al. 2021. "Anticancer Effects of Propionic Acid Inducing Cell Death in Cervical Cancer Cells" Molecules 26, no. 16: 4951. https://doi.org/10.3390/molecules26164951
APA StylePham, C. H., Lee, J.-E., Yu, J., Lee, S. H., Yu, K.-R., Hong, J., Cho, N., Kim, S., Kang, D., Lee, S., & Yoo, H. M. (2021). Anticancer Effects of Propionic Acid Inducing Cell Death in Cervical Cancer Cells. Molecules, 26(16), 4951. https://doi.org/10.3390/molecules26164951