Abstract
Phenolic structures are of great interest due to their antioxidant properties and various postulated benefits on human health. However, the quantification of these structures in fruits and vegetables, as well as in vivo or in vitro experiments, is demanding, as relevant concentrations are often low, causing problems in exactly weighing the respective amounts. Nevertheless, the determination of used concentrations is often a prerequisite for accurate results. A possibility to quantify polyphenol is the use of UV/vis spectroscopy. Therefore, the absorption coefficients of selected phenolic structures were determined in three different solvents relevant for polyphenol research (water/methanol (50/50, v/v), water, and phosphate buffer at pH 7.5). To confirm the values based on weight and to avoid errors due to impurities, hygroscopic effects, and inadequate balance care, the mass concentrations were additionally determined by quantitative NMR (q-NMR). The coefficients presented in this article can help to quickly and easily determine accurate concentrations in a laboratory routine without wasting the often-precious standard compounds.
1. Introduction
For polyphenols and water-soluble secondary plant substances, many positive health effects have been proposed [1]. Besides identifying and quantifying phenolic structures in food [2,3,4,5], current research attempts to prove the postulated effects on human health have been performed by the use of in vivo and in vitro experiments [6,7,8,9]. Some previous investigations have focused on the holistic evaluation of the effects of polyphenolic extracts but not on the individual substances and their properties [10,11]. Our aim was to provide reliable data as a basis for further in-depth research into the quantification of individual phenolic structures and clarification of their interaction mechanisms. Quantification in biological samples and experiments into the effects and the biochemical mechanisms require stock solutions and dilutions with defined and precisely determined concentrations.
Particularly for physiologically relevant concentrations, the exact weighing is problematic. Isolated compounds might contain impurities of substances, which are not detectable by routinely applied methods such as HPLC-DAD-MS. In addition, commercially available phenolic standard compounds, with the exception of simple hydroxyl cinnamic acids, are cost-intensive and exhibit a limited shelf life in solution. Moreover, more hydrophobic phenolic structures can be dissolved in aqueous media (electrolyte solutions or buffers) only to a limited extent. Micro-balances fit to weigh sub-milligram amounts of substances are cost-intensive and require a strictly controlled environment. In addition, systematic errors can occur if they are not adequately maintained, serviced, and calibrated. Apart from general individual weighing errors, the lyophilized phenolic powders are often hygroscopic, which leads to corresponding weighing inaccuracies.
As polyphenols are aromatic substances, it is possible to determine their absorption at 280 nm by means of UV spectroscopy. According to the Bouguer–Lambert–Beer law, a substance’s light absorption is proportional to its concentration in a given solvent; however, this is limited to a substance- and solvent-specific maximum concentration. Particularly, phenolic compounds tend to form supramolecular structures at higher concentrations in aqueous solutions [12], which limit the linear proportionality [13]. With the expansion of the conjugated π–electron system, the maximum absorption shifts from 280 nm to higher wavelengths (bathochromic effect). Furthermore, the wavelength might shift when different solvents are used, due to pH-dependent equilibria. Therefore, we determined absorption coefficients for some phenolic structures (Figure 1) in three different solvents: water, aqueous methanol (50/50 v/v), and aqueous phosphate buffer at pH 7.5 at λmax, the individual wavelength of maximum absorption, and at 280 nm for comparison.
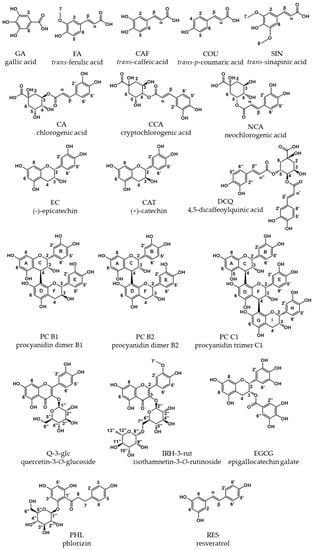
Figure 1.
Overview of phenolic compounds investigated.
As the determination of absorption coefficients requires a reliable and confirmed concentration determination, we compared the data based on weight with concentrations determined by quantitative NMR (q-NMR). In recent years, q-NMR has been proven as a fast, reliable, sample saving and nondestructible absolute method to determine concentrations [14,15,16,17]. The quantifications performed by q-NMR are based on specific proton signals of the different substances.
2. Results
The following tables combine the results we found. Table 1 lists the extinction coefficients determined at the substances’ individual wavelengths of maximum absorption (λmax). In Table 2 the extinction coefficients measured at the common wavelength λ = 280 nm are given. Table 3 shows the extinction coefficients determined in strongly acidic aqueous solution, both at λmax and at λ = 280 nm.

Table 1.
Absorption coefficients at λmax (individual) for different phenolic compounds in methanol/water, water, and phosphate buffer pH 7.5 using concentrations determined by balance and q-NMR.
Table 2.
Absorption coefficients at 280 nm for different phenolic compounds in methanol/water, water, and phosphate buffer pH 7.5 using concentrations determined by balance and q-NMR.
Table 3.
Absorption coefficients for different anthocyanins in potassium chloride buffer at pH 1 at 520 nm and λmax using concentrations determined by balance.
3. Discussion
The absorption coefficients in methanol/water for COU, CAF, FER, and SIN are comparable with the values found by Rubach with 18,800, 15,800, 13,300, and 16,700 L·mol−1·cm−1, at λmax, respectively [18]. The structures of hydroxycinnamic acids are pH-dependent. In water, the pH values are concentration-dependent and range from 4.9 to 5.2 (Table A1). In buffer, the carboxylic group tends to dissociate, which explains the hypsochromic shifts in λmax and the decrease in absorption in phosphate buffer due to an increased formation of the negatively charged structures (Figure 2). The pKa values, calculated by ChemAxon and listed in the HMDB data bank [19], are in a similar range with 4.00, 3.64, 3.77, and 3.61 for COU, CAF, FER, and SIN, respectively, and explain the increased bathochromic shifts. The values for the absorption coefficient calculated with a concentration based on balance or q-NMR are in a good agreement.
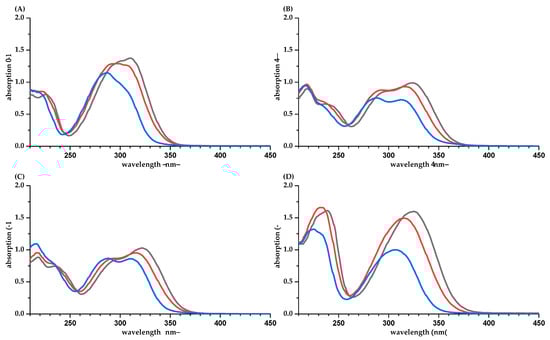
Figure 2.
UV spectra of hydroxycinnamic acids in water/methanol (50/50, v/v, black), water (red), and phosphate buffer pH 7.5 (blue). (A), coumaric acid; (B), caffeic acid; (C), ferulic acid; (D), sinapinic acid. Concentrations are different for the four hydroxycinnamic acids but similar among the solvents.
The absorption coefficients for chlorogenic acid derivatives are independent of the ester position and the solvent (Table 1 and Table 2, Figure 4A). Surprisingly, esterified with quinic acid, the absorption coefficient is roughly 25% higher compared to free CAF. The significantly lower absorption at 280 nm underlines the importance to quantify these phenolic compounds separately at their individual absorption maxima or summarized at 320 nm. Our values determined in water and methanol/water are in good agreement with a former study by Rubach. Here, 19,500, 18,000, and 18,400 L·mol−1 cm−1 were found for chlorogenic (3′), neochlorogenic (4′), and cryptochlorogenic (5′) acid [18]. The UV spectra of chlorogenic acids are not significantly influenced by the solution’s pH values (Figure 4A). In water, the pH values of the isomers are significantly different, with 5.0 (CA), 4.6 (CCA), and 5.6 (NCA) (Table A1). However, the carboxylic group of the quinic acid with a pKa of 3.3 [19] is widely distanced from the aromatic system, which is responsible for the absorption in the UV range. DCQ contains two independent CAF units and, therefore, the absorption should be doubled. However, the data are closer to the sum of the absorption of a chlorogenic acid and CAF.
Our values for CAT and EC are in agreement with the literature. A value of ε = 3988 L·mol−1·cm−1 has been reported for CAT and EC in methanol at 280 nm [20]. The absorption coefficients for the two dimers (PC B1 and B2) are in a similar range and are roughly doubled compared to the monomers. The trimer PC C1 follows the same trend comparing the data obtained by balance. In pure water and, in particular, in phosphate buffer, the absorption is reduced. In water, the pH value of all flavanols investigated is about pH 6 (Appendix A Table A1) and we interpret this more as an effect of the solvent’s dielectric constant, than an effect of the pKa (pKa CAT/EC = 9) [19]. The q-NMR data of the procyanidins are suspicious. Due to the formation of rotamers, quantification of the procyanidins by NMR is hampered. Fortunately, in methanol/water, the sum of the signals for the six protons of the B- and E-ring and the two diastereomeric protons at position F 4 are suitable to quantify the dimers, ignoring the different ratios of the two rotamers [21,22] (Supplementary Material). For the trimer PC C1, the number of rotamers is even higher (up to 4) [22,23], significantly influencing signal intensity and, therefore, integration.
The UV spectra of the flavonoids IRH-3-rut and Q-3-glc show two maxima around 260 nm (B-ring) and around 360 nm (A and C-ring) (Figure 3). Gitelson et al. reported an absorption coefficient for quercetin-rutinoside of 25,400 L·mol−1·cm−1 at 358 nm in 80% aqueous methanol [24]. This is higher than the value of 21,515 ± 964 L·mol−1·cm−1 found in this study for Q-3-glc (based on q-NMR, Table 1). The absorption coefficient calculated with the mass concentration γ based on weight is markedly reduced. Due to the unknown purity of Q-3-glc and problems with precipitations, we rather trust the value based on NMR. The pH of the aqueous solution is 6.6 and 6.0 for IRH-3-rut and Q-3-glc, respectively. Both compounds have pKa values of 6.4 [19], and an increased formation of the deprotonated structure is obvious, comparing the spectra in water and buffer at pH 7.5. The most acidic position is the hydroxyl group at position 7 (A-ring). However, due to mesomeric effects, the negative charge is transferred to position 4′ in the B-ring and a bathochromic shift of λmax is observed for both maxima.
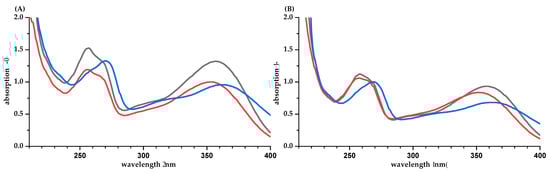
Figure 3.
UV-spectra of IRH-3-rut (A) and Q-3-glc (B) in water/methanol (50/50, v/v, black), water (red), and phosphate buffer pH 7 (blue). Concentrations are different for the two flavonoids but similar between the solvents.
For EGCG (pKa 7.99) [19], the UV absorption spectra in water (pH value is 6.0) and phosphate buffer are different (Figure 4B). However, the impact on the absorption coefficient is marginal. For PHL, a strong bathochromic shift and an increased absorption are observed in phosphate buffer (Figure 4C). This is due to the increased formation of the deprotonated, anionic PHL species (pKa 7.87 [19], pH in water is 6.0).
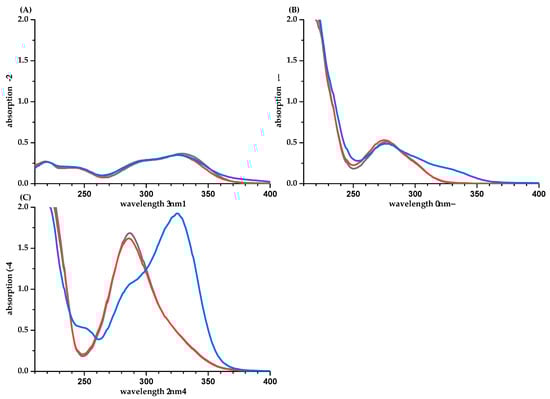
Figure 4.
UV spectra of CA (A), EGCG (B), and PHL (C) in water/methanol (50/50, v/v, blue), water (orange), and phosphate buffer pH 7.5 (gray).
For anthocyanins, a wide variety of absorption coefficients are available in the literature, and some of them have been summarized by Giusti and Wrolstad [25]. However, the data vary in the wavelength of absorption and the solvent used. In particular, the pH value plays an important role for anthocyanins due to the pH-dependent equilibration between the red flavylium cation and the colorless hemicetal. Therefore, pH values were checked for all anthocyanidin NMR dilutions to be pH ≤ 1.1. Nevertheless, our values for the absorption coefficients differ significantly between the calculations based on the balance and q-NMR (16–40% higher in the calculation based on q-NMR, Table 3, Supplementary Material Table S1). Despite difficulties in weighing the hygroscopic anthocyanidins, we assumed a systematic underestimation by q-NMR. Data from the literature, in particular, the value of 26,900 L·mol−1·cm−1 for CYD-3-glc [25], support this. Therefore, we diluted two acidic (0.1% DCl) aqueous stock solutions of DPD-3-glc (1 g/mL, 1.6 g/mL) with potassium chloride buffer pH 1 and methanol-d4 and determined the solutions’ mass concentrations by q-NMR. A significant concentration difference (~20%) was observed between samples in buffer at pH 1 and acidic methanol-d4/D2O (50/50, v/v) (Supplementary Material Table S2, Figure S1). Excluding the protons at position 6 and 8 (A-Ring), the mass concentration determined in methanol-d4/D2O was similar to the mass concentration calculated by weight. Reduced integrals for protons at these positions have also been reported for other flavonoids [21].
The partial NMR excitation due to insufficient relaxation delay was checked by comparing spectra recorded with shorter vs. longer recycle delays and was found to be irrelevant. Due to a sample pH below 1.1, the formation of significant amounts of hemicetals can also be excluded. It is conspicuous that the NMR resonances are broader in spectra obtained from buffered samples than in spectra from aqueous methanolic samples, this could be caused by self-association of the anthocyanidins in aqueous media. Such supramolecular aggregates are known to lead to reduced quantification due to the aggregates’ slower tumbling rate (stochastic rotational and diffusion motion in the solution). The longer correlation times of such aggregates lead to faster T2 (spin-spin) relaxation and can induce signal broadening [26].
The focus of the investigation was aqueous solvents because in vitro experiments are usually performed in buffer. However, some polyphenols have limited solubility in water; therefore, HPLC-DAD standard stock solutions are often prepared in aqueous alcohol, and quantification with q-NMR also requires relatively high concentrations. Therefore, aqueous methanol was also included in the study. Despite limited solubility, stacking and hydratisation in aqueous solvents might be problematic for quantification. If the molecules form more than simple van der Waals interactions with the solvent, as with hydrogen bonds or (de-)protonation equilibria, NMR signal intensities may be influenced due to the carry-over of water presaturation into the molecule (NOE).
Supramolecular stacking has an impact on the absorption spectra and the absorption coefficient and on the NMR resonances, too. However, for the UV/vis spectra, this effect is negligible due to high dilutions (1:50–1:400, 1:10,000 for CA to measure absorptions in the range of 0.1–1.4); for NMR, we observed (as expected) signal broadening and lowered intensities, and these effects were inversely proportional to the sample temperature during measurement. However, due to the limited amounts of substances and due to their tendency to degrade, we did not systematically acquire spectra at T(sample) > RT.
4. Materials and Methods
4.1. Materials, Solvents, and Reagents
(-)-Epicatechin (EC) (95.1% purity HPLC), 3-O-caffeoquinic acid (chlorogenic acid, CA) (99% titration with NaOH), 5-O-caffeoquinic acid (neochlorogenic acid, NCA) (99.5% HPLC), phlorizin dihydrate (PHL) (99% purity), trans-sinapinic acid (SIN) (99.1% HPLC, 100.1% titration), and trans-ferulic acid (FER) (99.8% purity HPLC; 99.8% titration) were stored at room temperature. 4-O-caffeoylquinic acid (cryptochlorogenic acid, CCA) (99.6% HPLC) and epigallocatechin gallate (EGCG) (99% HPLC) were stored at 4 °C and quercitin-3-O-glucoside (Q-3-glc) (91.4% HPLC), as well as resveratrol (RES) (100% HPLC) at −20 °C. These phenolic structures were obtained from Sigma Aldrich (Darmstadt, Germany).
(+)-Catechin (CAT) (99.5% HPLC-PDA) and 4,5-O-dicaffeoylquinic acid (DQA) (99.2% HPLC-PDA) were purchased from Phytolab GmbH & Co. KG (Germany) and stored at 4 °C. The procyanidins (PC) B1 (97.39%), B2 (96.72%), and C1 (97.41%), as well as trans-caffeic acid (CAF) (99.90% HPLC UV), trans-p-cumaric acid (COU) (99.76% HPLC-UV), and isorhamnetin-3-O-rutinoside (IRH-3-rut) (99.06% HPLC-UV), were also purchased from Phytolab and stored at −80 °C (PCs) and room temperature, respectively.
The anthocyanin-3-O-glucosides cyanidin-3-O-glucoside (CYD-3-glc) (99.66% HPLC), delphinidin-3-O-glucoside (DPD-3-glc) (98.11% HPLC), malvidin-3-O-glucoside (MLV-3-glc) (99.10% HPLC), pelargonidin-3-O-glucoside (PLG-3-glc) (98.95% HPLC), peonidin-3-O-glucoside (PEO-3-glc) (98.79% HPLC), and petunidin-3- O-glucoside (PET-3-glc) (98.27% HPLC) were obtained as chlorides from Phytolab GmbH & Co. KG (Germany) and stored at −80 °C.
Na2HPO4 and NaH2PO4∙H2O were obtained from Roth (Karlsruhe, Germany) to prepare 100 mM of phosphate buffer at pH 7.5. Sodium hydroxide and hydrochloric acid (Grüssing, Germany) were used to adjust the pH value. For NMR experiments, D2O and methanol-d4 were purchased from Eurisotop (Saarbrücken, Germany), and the methanol used to dilute the samples for UV spectroscopy was acquired from Fisher Scientific (Loughborough, UK). All reagents and solvents were of analytical grade and ultrapure water (ELGA PurLab flex, Veolia Waters, Celle, Germany) was used throughout.
4.2. Preparation of the Stock Solutions
Polyphenols were weighed using an AT 20 (Mettler Toledo; Gießen, Germany) balance. Anthocyanin stock solutions were prepared in ultrapure water containing 0.1% HCl, and all other phenolic structures were dissolved in 0.5 mL of methanol-d4 and subsequently mixed with 0.5 mL of D2O. All solvents were degassed and samples were stored at −20 °C. The compounds and mass concentrations (γ) determined by the balance and NMR are listed in Table 4.
Table 4.
Mass concentration γ of the phenolic solutions based on the weights and determined with q-NMR at two different solutions.
4.3. Quantification Based on 1H-NMR
Absolute quantification of the polyphenols was performed in solution by quantitative nuclear magnetic resonance spectroscopy (qNMR) at the Chemical and Veterinary Investigation Office Karlsruhe (Chemisches Veterinär- und Untersuchungsamt, Karlsruhe, Germany). The measurement was carried out in methanol-d4/D2O (50/50, v/v) for the initial concentration and an appropriate dilution to check for concentration-dependent impacts. Initially, anthocyanins were quantified at two different concentrations (1.2–2.3 mM, diluted 1:4 and 1:6) in 0.2 M potassium chloride buffer adjusted to pH = 1 with 0.2 M of HCl and D2O. The pH value of the samples ranged between 1.05 and 1.10 after 1 h of equilibration. To investigate the systematic difference between the balance and qNMR, stock solutions of delphinidin-3-glucoside (D2O, 0.1% DCl) were diluted in potassium chloride buffer pH 1 and acidic methanol-d4/D2O (50/50, v/v, pH 1).
In general, the volume of 600 µL of the stock solutions was transferred into a 5 mm NMR tube and NMR spectra were recorded on a 400 MHz Bruker Avance (Bruker Biospin, Germany) equipped with a BBI 400S1 H-BB-D-05 Z probe and an automatic sample changer (Sample Xpress). Proton spectra were acquired using the pulse program noesygppr1d_d7 (1D NMR spectra) with presaturation of the water signal and an additional (fully passive) d7 delay limiting the presaturation irradiation to the d1 delay immediately before the excitation pulse. See Figure 5 as an example, for more spectra, see the Supplemental Material, Figure S2. To obtain an optimal and comparable excitation for all samples, the 90° pulse was calibrated for each sample using Bruker’s PULSECAL routine. With a time domain (TD) of 128 k, 128 scans with 4 dummy scans were acquired, using a spectral width (SW) of 20.56 ppm (8223 Hz), an acquisition time (AQ) of 7.97 s, and a receiver gain (RG) of 32. Delay 1 (D1) and delay 7 (D7) were set to 4.00 and 60.0 s, respectively. The sample temperature was set at 300 K (±0.1 K). All spectra were automatically phased and baseline-corrected. NMR spectra were analyzed using TopSpin version 4.06 (Bruker Biospin, Germany) and compound concentrations were determined using the PULCON principle (pulse length-based concentration determination) according to [14,39,40]. 1H-NMR spectra of Quantification Reference solutions (QuantRef, = external standards), containing known, purity-corrected concentrations of the certified reference substances lactic acid and citric acid (aqueous QR for anthocyanins) or diethyl phthalate and 1,2,4,5-tetrachloro-3-nitrobenzene (organic QR for nonanthocyanin phenolic structures) were used to calculate the ERETIC factor according to Equation (1).
where:
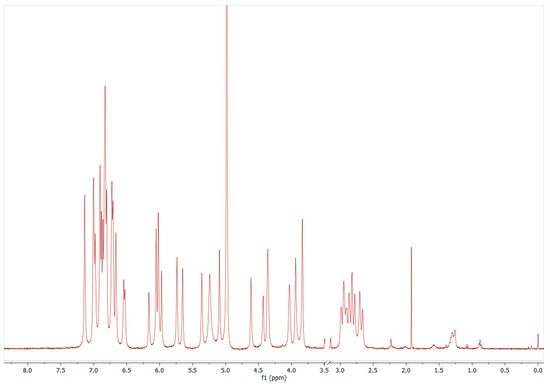
Figure 5.
1H-NMR example spectrum of procyanidin-B2 (1868 mg/L) in methanol-d4/D2O (50/50, v/v). The signals in the range of 6.5–7.15 ppm (the six protons of Ring B and E) and 2.6–3.0 ppm (the two diastereomeric protons F4) were used for summary quantification (Figure 1, 1H-NMR spectra with signal assignments for all PP are provided in the Supplemental Material Figure S2, including references).
IRef = absolute integral of the reference signal;
SWRef = spectral width;
MRef = molar mass;
SIRef = number of data points of the processed reference spectrum;
γRef,corr = mass concentration of reference substance, adjusted for purity;
NH,Ref = number of protons per reference molecule giving this resonance.
The following factor was used to quantify the anthocyanins according to Equation (2).
where:
γAn = analyte mass concentration;
IAn = absolute integral of analyte in sample;
SWAn = spectral width;
MAn = molar weight of analyte;
SIAn = no. of data points of the processed analyte spectrum;
fERETIC = mean value ERETIC factor from QuantRef;
NH,An = number of protons per analyte molecule giving this resonance;
fdil = dilution factor from analyte stock solution to measurement sample;
PAn = excitation pulse length used for the analyte sample (in µs);
PRef = excitation pulse length used for the QuantRef solution (in µs);
NSRef = number of recorded scans for the reference spectrum;
NSAn = number of recorded scans for the analyte spectrum.
Determination of the mass concentration γ was performed in duplicate and calculated as an average for the protons specified in Table 4. Signals for integration were selected having a low multiplicity and showing complete relaxation during the delay between the scans. The proton spectra are provided in the Supplementary Material.
4.4. Determination of the Absorption Coefficient
The absorptions were determined in duplicate by UV/Vis spectroscopy (Spectrostar Nano, BMG, Labtech, Ortenberg, Germany, UV-Cuvette semi micro-cuvette d = 1 cm, Helma Analytics, Muehlheim, Germany) after equilibration for, at minimum, three different dilutions. The absorption coefficients ε (in L·mol−1·cm−1) were calculated according to Equation (3) for each concentration and then expressed as mean ± standard deviation.
Abs = absorption at λmax or 280 nm;
Man = molar weight of the anthocyanin;
γan = average mass concentration of the anthocyanin determined by q-NMR;
l = path length (1 cm);
fdil = dilution factor;
1000 = conversion factor.
5. Conclusions
This article provides absorption coefficients for some phenolic structures in solvents generally used in experiments. The data also help to work with precise concentrations at low amounts during experiments and to save time and money. Commonly, it is recommended to use the absorption coefficients at λmax; however, due to equipment limitations, it might sometimes be required to use the coefficient obtained at 280 nm.
Supplementary Materials
Table S1: Absorption coefficients of anthocyanidin-3-glucosides calculated by mass concentration γ determined by balance and q-NMR in aqueous buffer at pH 1. Figure S1: Proton spectra recorded with a 400 MHz spectrometer and used for quantification, including signal assignment based on the literature of delphinidin-3-O-glucoside in buffer. Table S2: Mass concentration γ determined by q-NMR in acidic methanol/water (50/50, v/v) and potassium chloride buffer pH 1. Figure S2: Proton spectra recorded with a 400 MHz spectrometer and used for quantification, including signal assignment based on the literature and own 2D NMR spectra.
Author Contributions
Conceptualization, M.B.; methodology, M.B. and J.A.H.K.; investigation, J.A.H.K., A.S., J.T. and M.B.; resources, M.B.; data curation, J.A.H.K. and M.B.; writing—original draft preparation, J.A.H.K. and M.B.; writing—review and editing, A.S. and J.T.; visualization, J.A.H.K. and M.B.; supervision, M.B.; project administration, M.B.; funding acquisition, M.B. All authors have read and agreed to the published version of the manuscript.
Funding
This research was funded by the German Research Foundation (DFG), grant number 3811/1-1, by the Ministry of Science, Research and the Arts Baden-Württemberg (M.B., M. v. Wrangell program), the Dr. Leni Schöninger Foundation, and funds of the chemical industry, Germany (FCI).
Institutional Review Board Statement
Not applicable.
Informed Consent Statement
Not applicable.
Data Availability Statement
Not applicable.
Acknowledgments
Birgit Claasen is acknowledged for 2D-NMR spectra, particularly temperature-dependent spectra for PC 1, PC2, and C1, and valuable assistance in data interpretation and the analytical department of organic chemistry providing the micro-balance.
Conflicts of Interest
All authors declare that there is no conflict of interest.
Sample Availability
Not available.
Appendix A
Table A1.
pH values for aqueous solution of the phenolic compounds in the specified concentration range.
Table A1.
pH values for aqueous solution of the phenolic compounds in the specified concentration range.
| PP | c/µM | pH | ||||
|---|---|---|---|---|---|---|
| GA | 35 | − | 139 | 4.62 | ± | 0.21 |
| COU | 18 | − | 71 | 4.92 | ± | 0.24 |
| CAF | 15 | − | 60 | 4.96 | ± | 0.18 |
| FER | 16 | − | 64 | 4.92 | ± | 0.22 |
| SIN | 23 | − | 93 | 5.16 | ± | 0.20 |
| CA | 8 | − | 38 | 5.00 | ± | 0.36 |
| CCA | 21 | − | 84 | 4.62 | ± | 0.30 |
| NCA | 17 | − | 86 | 5.64 | ± | 0.08 |
| DCQ | 6 | − | 30 | 5.26 | ± | 0.16 |
| CAT | 26 | − | 103 | 5.94 | ± | 0.17 |
| ECAT | 81 | − | 323 | 6.10 | ± | 0.11 |
| PC B1 | 27 | − | 220 | 6.07 | ± | 0.34 |
| PC B2 | 25 | − | 197 | 6.13 | ± | 0.08 |
| PC C2 | 26 | − | 102 | 5.97 | ± | 0.26 |
| EGCG | 6 | − | 50 | 6.02 | ± | 0.01 |
| IRH-3-rut | 16 | − | 64 | 6.62 | ± | 0.07 |
| Q-3-glc | 14 | − | 55 | 6.02 | ± | 0.22 |
| RES | 9 | − | 37 | 6.33 | ± | 0.44 |
| PHL | 27 | − | 107 | 6.01 | ± | 0.03 |
References
- Pandey, K.B.; Rizvi, S.I. Plant polyphenols as dietary antioxidants in human health and disease. Oxid. Med. Cell. Longev. 2009, 2, 270–278. [Google Scholar] [CrossRef] [Green Version]
- Wojdyło, A.; Oszmiański, J.; Laskowski, P. Polyphenolic compounds and antioxidant activity of new and old apple varieties. J. Agric. Food Chem. 2008, 56, 6520–6530. [Google Scholar] [CrossRef]
- Lin, L.-Z.; Harnly, J.; Zhang, R.-W.; Fan, X.-E.; Chen, H.-J. Quantitation of the hydroxycinnamic acid derivatives and the glycosides of flavonols and flavones by UV absorbance after identification by LC-MS. J. Agric. Food Chem. 2012, 60, 544–553. [Google Scholar] [CrossRef]
- Scalbert, A.; Williamson, G. Dietary intake and bioavailability of polyphenols. J. Nutr. 2000, 130, 2073S–2085S. [Google Scholar] [CrossRef]
- Jakobek, L.; García-Villalba, R.; Tomás-Barberán, F.A. Polyphenolic characterisation of old local apple varieties from Southeastern European region. J. Food Compost. Anal. 2013, 31, 199–211. [Google Scholar] [CrossRef]
- Kaeswurm, J.A.H.; Claasen, B.; Fischer, M.-P.; Buchweitz, M. Interaction of Structurally Diverse Phenolic Compounds with Porcine Pancreatic α-Amylase. J. Agric. Food Chem. 2019, 67, 11108–11118. [Google Scholar] [CrossRef]
- Buchweitz, M.; Kroon, P.A.; Rich, G.T.; Wilde, P.J. Quercetin solubilisation in bile salts: A comparison with sodium dodecyl sulphate. Food Chem. 2016, 211, 356–364. [Google Scholar] [CrossRef] [PubMed] [Green Version]
- Williamson, G. The role of polyphenols in modern nutrition. Nutr. Bull. 2017, 42, 226–235. [Google Scholar] [CrossRef] [PubMed]
- Chong, M.F.-F.; Macdonald, R.; Lovegrove, J.A. Fruit polyphenols and CVD risk: A review of human intervention studies. Br. J. Nutr. 2010, 104, S28–S39. [Google Scholar] [CrossRef] [Green Version]
- Abate, G.; Zhang, L.; Pucci, M.; Morbini, G.; Mac Sweeney, E.; Maccarinelli, G.; Ribaudo, G.; Gianoncelli, A.; Uberti, D.; Memo, M.; et al. Phytochemical Analysis and Anti-Inflammatory Activity of Different Ethanolic Phyto-Extracts of Artemisia annua L. Biomolecules 2021, 11, 975. [Google Scholar] [CrossRef]
- Mastinu, A.; Bonini, S.A.; Premoli, M.; Maccarinelli, G.; Mac Sweeney, E.; Zhang, L.; Lucini, L.; Memo, M. Protective Effects of Gynostemma pentaphyllum (var. Ginpent) against Lipopolysaccharide-Induced Inflammation and Motor Alteration in Mice. Molecules 2021, 26, 570. [Google Scholar] [CrossRef]
- Fernandes, A.; Brás, N.F.; Mateus, N.; de Freitas, V. A study of anthocyanin self-association by NMR spectroscopy. New J. Chem. 2015, 39, 2602–2611. [Google Scholar] [CrossRef]
- Trouillas, P.; Sancho-García, J.C.; de Freitas, V.; Gierschner, J.; Otyepka, M.; Dangles, O. Stabilizing and Modulating Color by Copigmentation: Insights from Theory and Experiment. Chem. Rev. 2016, 116, 4937–4982. [Google Scholar] [CrossRef] [Green Version]
- Teipel, J.C.; Hausler, T.; Sommerfeld, K.; Scharinger, A.; Walch, S.G.; Lachenmeier, D.W.; Kuballa, T. Application of 1H Nuclear Magnetic Resonance Spectroscopy as Spirit Drinks Screener for Quality and Authenticity Control. Foods 2020, 9, 1355. [Google Scholar] [CrossRef] [PubMed]
- Malz, F.; Jancke, H. Validation of quantitative NMR. J. Pharm. Biomed. Anal. 2005, 38, 813–823. [Google Scholar] [CrossRef]
- Bharti, S.K.; Roy, R. Quantitative 1H NMR spectroscopy. Trends Anal. Chem. 2012, 35, 5–26. [Google Scholar] [CrossRef]
- Hatzakis, E. Nuclear Magnetic Resonance (NMR) Spectroscopy in Food Science: A Comprehensive Review. Compr. Rev. Food Sci. Food Saf. 2019, 18, 189–220. [Google Scholar] [CrossRef] [Green Version]
- Rubach, K. Beitrag zur Analytik der Hydroxyzimtsäureester des Kaffees. Ph.D. Dissertation, Technische Universität Berlin, Berlin, Germany, 1969. [Google Scholar]
- Wishart, D.S.; Tzur, D.; Knox, C.; Eisner, R.; Guo, A.C.; Young, N.; Cheng, D.; Jewell, K.; Arndt, D.; Sawhney, S.; et al. HMDB: The Human Metabolome Database. Nucleic Acids Res. 2007, 35, D521–D526. [Google Scholar] [CrossRef]
- Kennedy, J.A.; Jones, G.P. Analysis of proanthocyanidin cleavage products following acid-catalysis in the presence of excess phloroglucinol. J. Agric. Food Chem. 2001, 49, 1740–1746. [Google Scholar] [CrossRef]
- Tarascou, I.; Barathieu, K.; Simon, C.; Ducasse, M.-A.; André, Y.; Fouquet, E.; Dufourc, E.J.; de Freitas, V.; Laguerre, M.; Pianet, I. A 3D structural and conformational study of procyanidin dimers in water and hydro-alcoholic media as viewed by NMR and molecular modeling. Magn. Reson. Chem. 2006, 44, 868–880. [Google Scholar] [CrossRef] [PubMed]
- Shoji, T.; Mutsuga, M.; Nakamura, T.; Kanda, T.; Akiyama, H.; Goda, Y. Isolation and structural elucidation of some procyanidins from apple by low-temperature nuclear magnetic resonance. J. Agric. Food Chem. 2003, 51, 3806–3813. [Google Scholar] [CrossRef]
- Esatbeyoglu, T.; Jaschok-Kentner, B.; Wray, V.; Winterhalter, P. Structure elucidation of procyanidin oligomers by low-temperature 1H NMR spectroscopy. J. Agric. Food Chem. 2011, 59, 62–69. [Google Scholar] [CrossRef] [PubMed]
- Gitelson, A.; Chivkunova, O.; Zhigalova, T.; Solovchenko, A. In situ optical properties of foliar flavonoids: Implication for non-destructive estimation of flavonoid content. J. Plant Physiol. 2017, 218, 258–264. [Google Scholar] [CrossRef]
- Giusti, M.; Wrolstad, R.E. Characterization and Measurement of Anthocyanins by UV-Visible Spectroscopy. Curr. Protoc. Food Anal. Chem. 2001. [Google Scholar] [CrossRef]
- Keeler, J. Understanding NMR Spectroscopy, 2nd ed.; Wiley: Chichester, UK, 2010; ISBN 978-0-470-74608-0. [Google Scholar]
- Yuan, Y.; Song, Y.; Jing, W.; Wang, Y.; Yang, X.; Liu, D. Simultaneous determination of caffeine, gallic acid, theanine, (−)-epigallocatechin and (−)-epigallocatechin-3-gallate in green tea using quantitative 1 H-NMR spectroscopy. Anal. Methods 2014, 6, 907–914. [Google Scholar] [CrossRef]
- Forino, M.; Tartaglione, L.; Dell’Aversano, C.; Ciminiello, P. NMR-based identification of the phenolic profile of fruits of Lycium barbarum (goji berries). Isolation and structural determination of a novel N-feruloyl tyramine dimer as the most abundant antioxidant polyphenol of goji berries. Food Chem. 2016, 194, 1254–1259. [Google Scholar] [CrossRef] [PubMed]
- Anselmi, C.; Centini, M.; Maggiore, M.; Gaggelli, N.; Andreassi, M.; Buonocore, A.; Beretta, G.; Facino, R.M. Non-covalent inclusion of ferulic acid with alpha-cyclodextrin improves photo-stability and delivery: NMR and modeling studies. J. Pharm. Biomed. Anal. 2008, 46, 645–652. [Google Scholar] [CrossRef] [PubMed]
- Cai, R.; Arntfield, S.D.; Charlton, J.L. Structural changes of sinapic acid and sinapine bisulfate during autoclaving with respect to the development of colored substances. J. Am. Oil Chem. Soc. 1999, 76, 433–441. [Google Scholar] [CrossRef]
- Pauli, G.F.; Kuczkowiak, U.; Nahrstedt, A. Solvent effects in the structure dereplication of caffeoyl quinic acids. Magn. Reson. Chem. 1999, 37, 827–836. [Google Scholar] [CrossRef]
- Nakatani, N.; Kayano, S.; Kikuzaki, H.; Sumino, K.; Katagiri, K.; Mitani, T. Identification, quantitative determination, and antioxidative activities of chlorogenic acid isomers in prune (Prunus domestica L.). J. Agric. Food Chem. 2000, 48, 5512–5516. [Google Scholar] [CrossRef]
- Wu, C.; Chen, F.; Wang, X.; Wu, Y.; Dong, M.; He, G.; Galyean, R.D.; He, L.; Huang, G. Identification of antioxidant phenolic compounds in feverfew (Tanacetum parthenium) by HPLC-ESI-MS/MS and NMR. Phytochem. Anal. 2007, 18, 401–410. [Google Scholar] [CrossRef] [PubMed]
- Da Silva, H.C.; Da Silva, A.N.R.; Da Rocha, T.L.S.; Hernandes, I.S.; Dos Santos, H.F.; de Almeida, W.B. Structure of the flavonoid catechin in solution: NMR and quantum chemical investigations. New J. Chem. 2020, 44, 17391–17404. [Google Scholar] [CrossRef]
- Cao, X.; Wei, Y.; Ito, Y. Preparative Isolation of Isorhamnetin from Stigma Maydis using High Speed Countercurrent Chromatography. J. Liq. Chromatogr. Relat. Technol. 2009, 32, 273–280. [Google Scholar] [CrossRef] [PubMed] [Green Version]
- Panda, S.; Kar, A. Antidiabetic and antioxidative effects of Annona squamosa leaves are possibly mediated through quercetin-3-O-glucoside. Biofactors 2007, 31, 201–210. [Google Scholar] [CrossRef]
- Mattivi, F.; Reniero, F.; Korhammer, S. Isolation, Characterization, and Evolution in Red Wine Vinification of Resveratrol Monomers. J. Agric. Food Chem. 1995, 43, 1820–1823. [Google Scholar] [CrossRef]
- Lommen, A.; Godejohann, M.; Venema, D.P.; Hollman, P.C.; Spraul, M. Application of directly coupled HPLC-NMR-MS to the identification and confirmation of quercetin glycosides and phloretin glycosides in apple peel. Anal. Chem. 2000, 72, 1793–1797. [Google Scholar] [CrossRef]
- Wider, G.; Dreier, L. Measuring protein concentrations by NMR spectroscopy. J. Am. Chem. Soc. 2006, 128, 2571–2576. [Google Scholar] [CrossRef] [PubMed]
- Monakhova, Y.B.; Kohl-Himmelseher, M.; Kuballa, T.; Lachenmeier, D.W. Determination of the purity of pharmaceutical reference materials by 1H NMR using the standardless PULCON methodology. J. Pharm. Biomed. Anal. 2014, 100, 381–386. [Google Scholar] [CrossRef]
Publisher’s Note: MDPI stays neutral with regard to jurisdictional claims in published maps and institutional affiliations. |
© 2021 by the authors. Licensee MDPI, Basel, Switzerland. This article is an open access article distributed under the terms and conditions of the Creative Commons Attribution (CC BY) license (https://creativecommons.org/licenses/by/4.0/).