Article

Structural and Functional Characterization of NadR from Lactococcus lactis

Groningen Biomolecular Science and Biotechnology Institute, University of Groningen, Nijenborgh 4, 9747 AG Groningen, The Netherlands
*
Authors to whom correspondence should be addressed.
These authors contributed equally to this work.
Molecules 2020, 25(8), 1940; https://doi.org/10.3390/molecules25081940
Submission received: 7 April 2020 / Revised: 19 April 2020 / Accepted: 21 April 2020 / Published: 22 April 2020

Abstract

:
NadR is a bifunctional enzyme that converts nicotinamide riboside (NR) into nicotinamide mononucleotide (NMN), which is then converted into nicotinamide adenine dinucleotide (NAD). Although a crystal structure of the enzyme from the Gram-negative bacterium Haemophilus influenzae is known, structural understanding of its catalytic mechanism remains unclear. Here, we purified the NadR enzyme from Lactococcus lactis and established an assay to determine the combined activity of this bifunctional enzyme. The conversion of NR into NAD showed hyperbolic dependence on the NR concentration, but sigmoidal dependence on the ATP concentration. The apparent cooperativity for ATP may be explained because both reactions catalyzed by the bifunctional enzyme (phosphorylation of NR and adenylation of NMN) require ATP. The conversion of NMN into NAD followed simple Michaelis-Menten kinetics for NMN, but again with the sigmoidal dependence on the ATP concentration. In this case, the apparent cooperativity is unexpected since only a single ATP is used in the NMN adenylyltransferase catalyzed reaction. To determine the possible structural determinants of such cooperativity, we solved the crystal structure of NadR from L. lactis (NadRLl). Co-crystallization with NAD, NR, NMN, ATP, and AMP-PNP revealed a ‘sink’ for adenine nucleotides in a location between two domains. This sink could be a regulatory site, or it may facilitate the channeling of substrates between the two domains.

1. Introduction

Nicotinamide riboside (NR, a form of Vitamin B3) is one of the common precursors for biosynthesis of nicotinamide adenine dinucleotide (NAD) [1,2]. In some prokaryotes, NR is taken up by PnuC membrane transporters via a facilitated-diffusion transport mechanism [3,4,5,6,7,8]. Recently a high-resolution crystal structure of PnuC from Neisseria mucosa with a bound NR molecule was reported [9,10]. The substrate specificity of the PnuC protein for NR has been confirmed for homologs from Escherichia coli, Haemophilus influenzae, Haemophilus parainfluenzae, Salmonella typhimurium, and Neisseria mucosa [5,6,10,11,12]. In some organisms, such as Clostridium thermocellum and Nostoc punctiforme, the pnuC gene clusters with nadR [1,2]. NadR converts NR into nicotinamide mononucleotide (NMN) and subsequently into NAD [13]. NadR was initially thought to have a transport function too, which was later found to be incorrect [14]. Instead, the conversion of NR into NMN and subsequently into NAD [14] by NadR leads to metabolic substrate trapping of NR in the cytoplasm as phosphorylation prevents the efflux via PnuC. NadR is present in many Gram-positive and Gram-negative bacteria [15], and in some organisms, the protein also senses the internal NAD pool in order to repress essential genes for NAD biosynthesis and to regulate transport via PnuC in response to cellular NAD levels [16,17,18,19]. In Enterobacteria, the gene encoding PnuC is located in an operon with the gene for the NAD biosynthesis protein NadA (quinolinate synthase), and the expression of this gene cluster is regulated by NadR. In this case the bifunctional NadR enzyme acts additionally as a transcription factor due to the presence of an N-terminal DNA binding motif [15].
A structure of NadR from Haemophilus influenzae (NadRHi) has been determined and revealed that the protein consists of two distinct domains separated by a short flexible linker, probably necessary for the movement of domains to perform both enzymatic steps [20,21,22]. Each domain has a specific catalytic activity: the N-terminal domain possesses an NMN adenylyltransferase (EC 2.7.7.1) activity (NMNAT domain), and the C-terminal domain is a ribosylnicotinamide kinase (EC 2.7.1.22) (RNK domain) (Supplementary Figure S1). Structurally the NMNAT domain is similar to archaeal NMNAT, whereas the RNK domain is similar to yeast thymidylate kinase [22]. For the NadR gene of E. coli, it has been shown experimentally that the NMNAT domain is indeed responsible for the transfer of the AMP moiety from ATP to NMN [23]. A crystal structure of the E. coli NMNAT domain of NadR with NAD bound has been reported [24]. NadR from S. typhimurium has been shown to be a NAD dependent repressor for several genes [nadB, nadA-pnuC, and pncB] involved in de novo biosynthesis of NAD and niacin salvage [16,25,26,27,28,29]. Additionally, there are some suggestions that NadR interacts with the PnuC membrane protein during transport of NR molecule [30]; however, so far, there is no experimental evidence for such direct interaction.
The NadR enzyme from the Gram-negative bacterium H. influenzae is biochemically and structurally well characterized. Here, we report the first structural and biochemical characterization of a NadR protein from a Gram-positive bacterium (Lactococcus lactis), and compare it with the Gram-negative ortholog.

2. Results

2.1. Multiple Sequence Alignment of NadR

To compare the NadRLl protein sequence with the homologous proteins from different organisms, we did a multiple sequence alignment [31]. In contrast to many homologs, NadRLl lacks the N-terminal DNA binding domain (Figure 1, corresponding to amino acid residues 1 to 59 in the H. influenza sequence, also known as HTH domain responsible for DNA binding). NadR protein sequences are more conserved among Gram-negative bacteria (54.7% sequence identity between NadREc (NadR protein from E. coli) and NadRSt (NadR protein from S.typhimurium)) compared to NadR proteins from Gram-positive bacteria (26.4% sequence identity between NadRLl and NadRBs (NadR protein Bacillus sp.). The sequence identity between NadREc and NadRLl is about 23.5%.

2.2. Substrate Specificity of NadR

We performed isothermal titration calorimetry (ITC) measurements to study substrate binding to NadRLl. We tested the binding of NR, NMN, NAD, ATP, and AMP-PNP (adenylyl-imidodiphosphate, an extremely slowly-hydrolyzable ATP analog). The measured binding affinities for Mg2+-complexed ATP and AMP-PNP are 63 µM and 13 µM, respectively (Table 1). Surprisingly, no binding for the nicotinamide nucleotide substrates in the presence and absence of ATP and AMP-PNP was detected. One possible explanation is that these substrates were bound very tightly to the protein during protein production in E. coli, and stayed attached during the protein purification steps. To circumvent this potential problem, we tried different unfolding-refolding protocols (including the use of urea and guanidium chloride up to a four molar concentration) of the purified protein in the absence of any substrate. However, upon treatment with denaturants, the protein stability decreased, and the protein could not be refolded (inferred from subsequent size exclusion chromatography). We also tried to perform mass-spectrometry on the purified protein in solution and on NadRLl protein crystals to determine whether there were tightly bound nucleotides; however, the results were inconclusive (although in the protein crystals we detected some traces of NR and NMN).

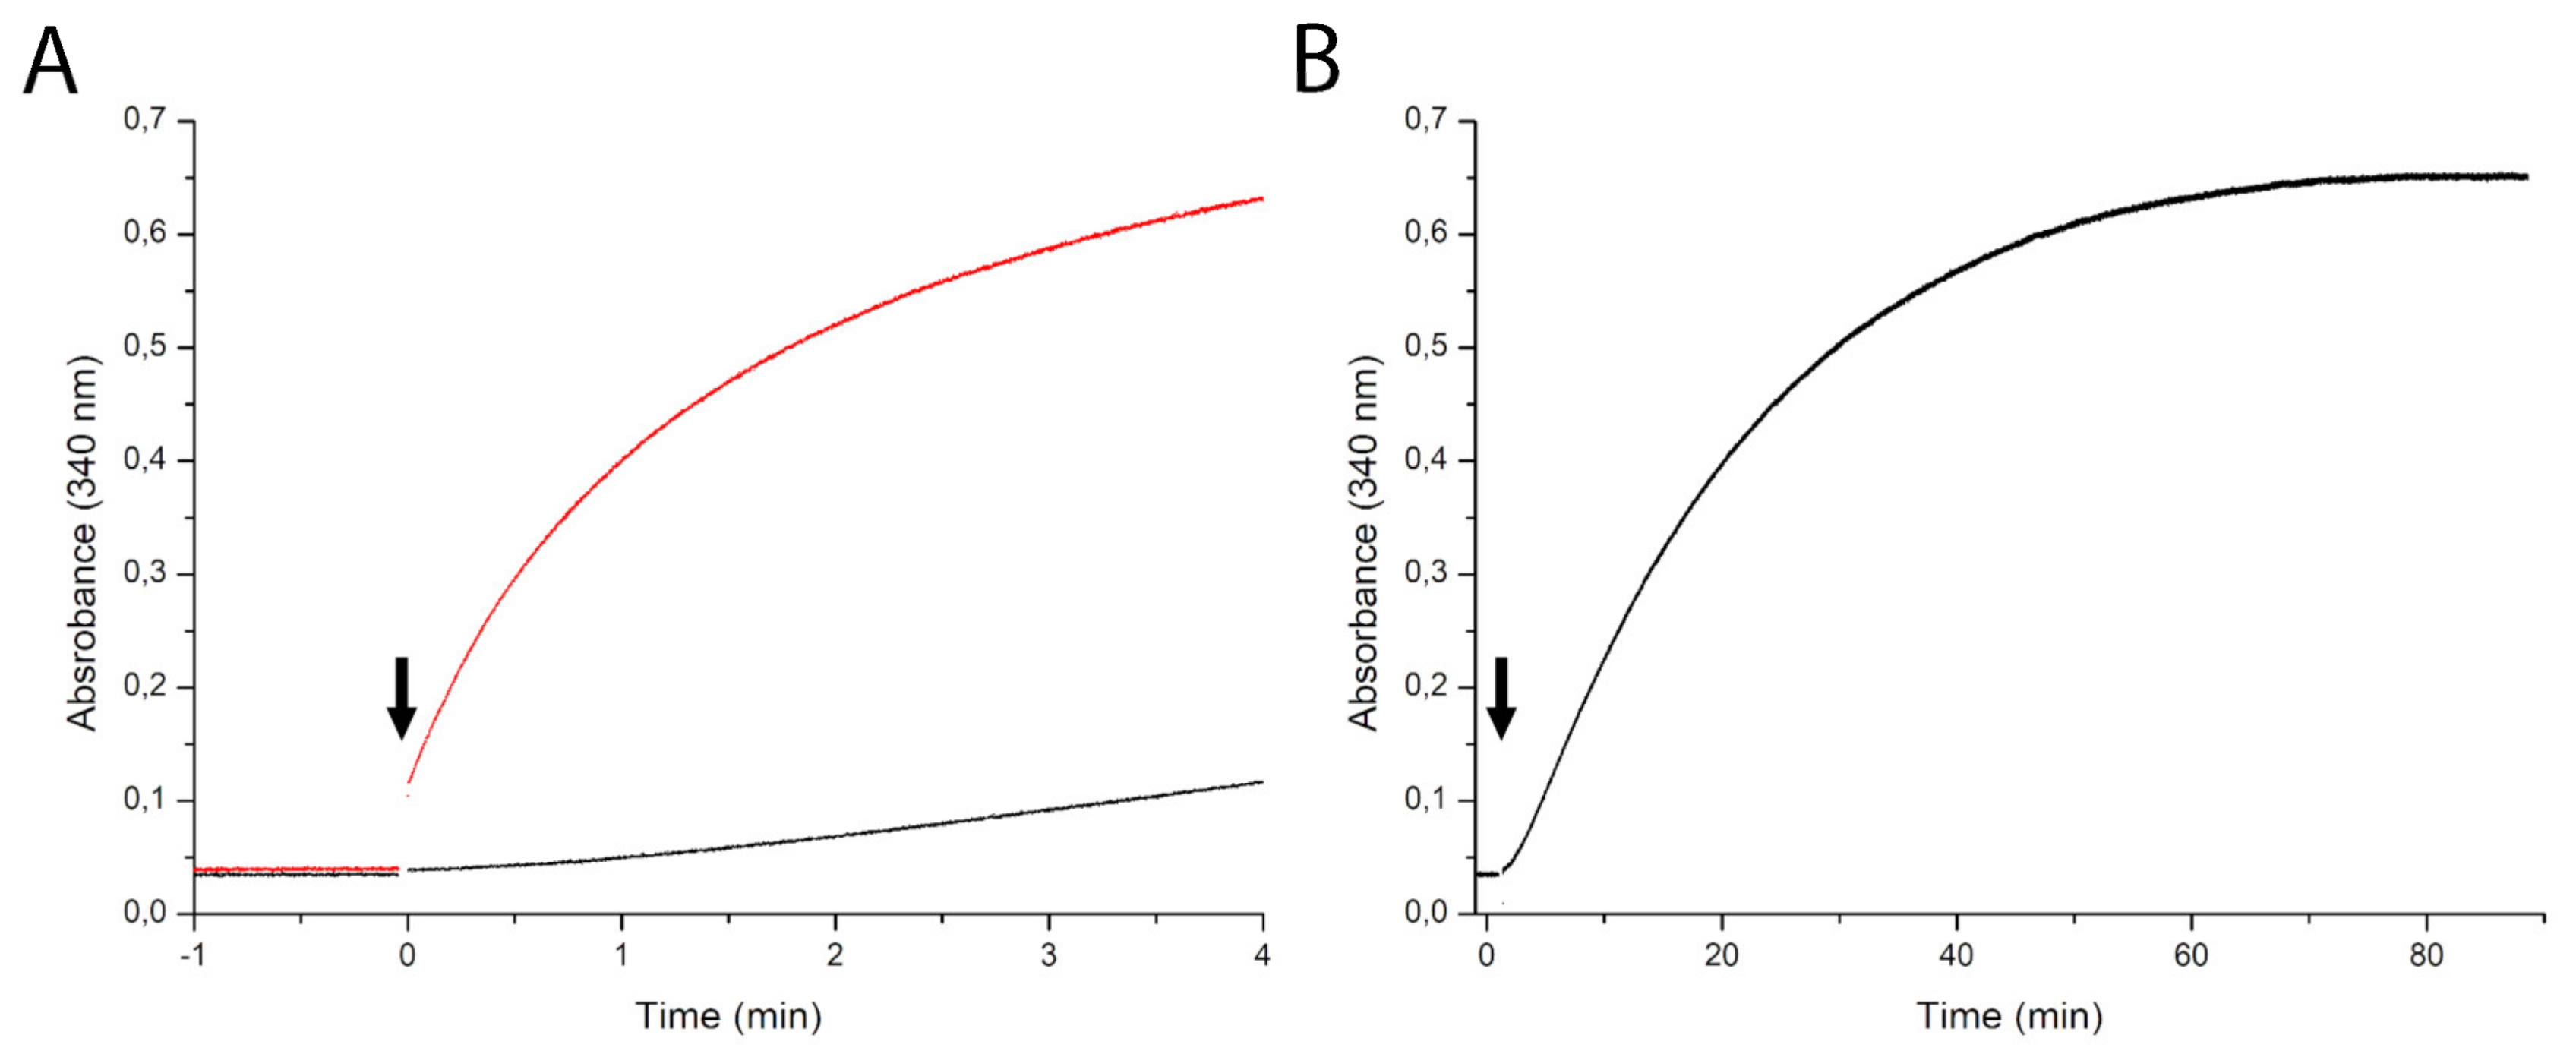
2.3. Steady State Kinetics

To investigate the kinetics of the NadRLl-catalyzed reaction, we used a lactate dehydrogenase (LDH) coupled assay. LDH was used to reduce the product NAD of the NadRLl-catalyzed reaction to NADH, the concentration of which can be measured by the absorption at 340 nm. In these measurements, we ensured that the LDH-catalyzed reaction was not rate-limiting. The NadRLl activity was determined in the presence of different concentrations of NR, NMN, and Mg2+-complexed ATP. The Michaelis-Menten equation combined with a substrate inhibition model, or the Hill model [32] was fitted to the data.
In measurements at constant ATP concentration (10 mM) the conversion of NR to NAD showed hyperbolic dependence on the NR concentration, but substrate inhibition was observed at high NR concentration. Analysis of the data using the Michaelis-Menten equation combined with a substrate inhibition model yielded Km = 0.6 ± 0.1 mM, Ki = 31.4 ± 8.1 mM and Vmax = 0.4 ± 0.1 µmol·min−1·mg−1 (Figure 2A and Table 2). The same experiment was performed with a fixed NR concentration of 1 mM, while varying the concentration of Mg-ATP. The Hill equation was fitted to the data, yielding Km = 5.2 ± 0.9 mM for ATP and Vmax of 0.4 ± 0.1 µmol·min−1·mg−1 with a Hill coefficient of 2.3 ± 0.5 (Figure 2B and Table 3). The value of the Hill coefficient implies that more than one molecule of ATP is cooperatively involved in NR conversion by NadRLl protein. The apparent cooperativity could be caused by the two-step catalysis, in which ATP is used for conversion of both NR to NMN, and NMN to NAD. To test this possibility, we also performed kinetic measurements using NMN as the substrate, and thus only following the second step, the conversion of NMN to NAD. At constant ATP concentration (10 mM) and varying concentration of NMN (up to 5 mM), the conversion of NMN to NAD followed Michaelis-Menten kinetics with substrate inhibition, with Km = 0.5 ± 0.1 mM, Ki = 25.4 ± 10.8 mM and Vmax of 1.5 ± 0.1 µmol·min−1·mg−1 for NMN (Figure 3A and Table 2). Previously a lower Km value for NMN conversion by the NadRHi protein was reported (0.14 mM) [21]. The discrepancy could be because the concentration of NMN used previously was varied only up to 1 mM with 0.2 mM of ATP present during that experiment. It could be that in these experimental conditions, the amount of ATP was limiting, but since no Km or Vmax values for ATP were reported, it is not possible to conclusively attribute the discrepancy to the ATP concentration. The differences could also simply reflect the unequal activity of NadR proteins from different organisms. The same experiment was performed using a fixed NMN concentration of 1 mM while varying the concentration of Mg-ATP up to 10 mM. The Hill equation was fitted to the data-yielding Km of 5.2 ± 0.6 mM, for ATP with Vmax of 1.2 ± 0.1 µmol·min−1·mg−1 and Hill coefficient of 2.2 ± 0.3 (Figure 3B and Table 3). Again, the Hill coefficient is an indication that more than one molecule of ATP is utilized during NMN conversion, which is surprising because only a single ATP molecule is used in the reaction from NMN to NAD.

2.4. Dependence of the Kinetics of NAD Production on the NadRll Concentration

To investigate further the reactions catalyzed by NadRLl, we measured kinetics with 1 mM NR as a substrate using two different concentrations of protein (0.1 mg·mL−1 and 1.0 mg·mL−1). An increase in absorbance at 340 nm from NADH production was measured during the time course of the reaction. With the lower protein concentration (0.1 mg·mL−1) we observed lag phase, which can be explained because the NadR protein first converts NR to NMN as an intermediate product, which accumulates to some extent; subsequently, the conversion of NMN to NAD takes place that results in an increase in absorbance. With the ten-fold higher protein concentration (1.0 mg·mL−1), we observed that reaction goes faster (Figure 4A), and there is no visible build-up phase meaning that the rate of NMN production is not limiting the second step. When the reaction with 0.1 mg·mL−1 protein was allowed to run longer (more than 1 h), gradually, the amount of product reached almost the same level (Figure 4B). During this experiment, the LDH activity was not rate-limiting (data not shown).

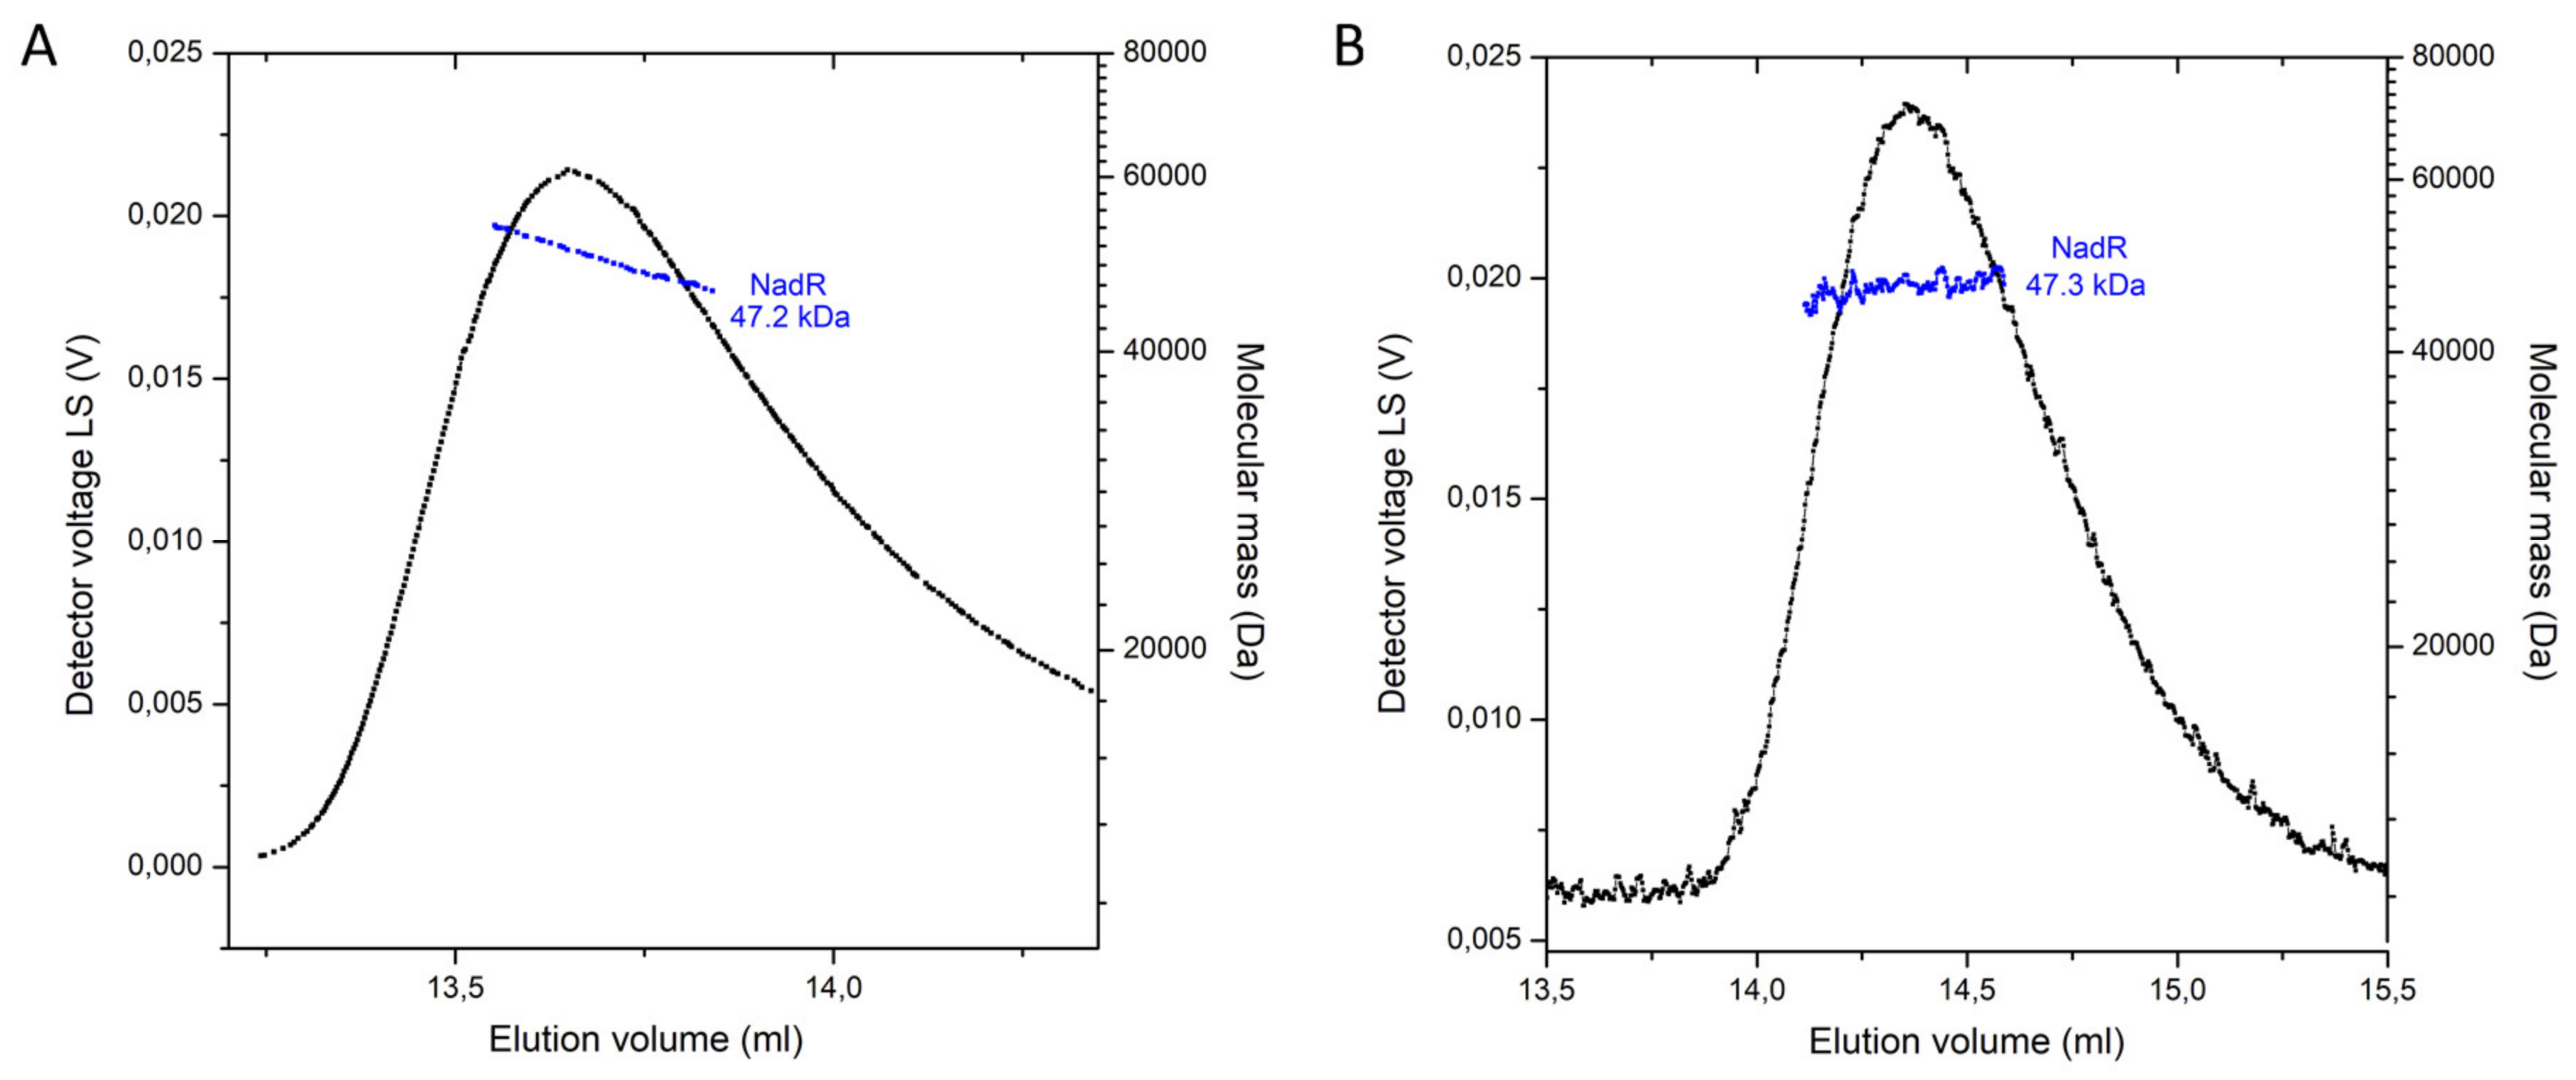
2.5. Oligomeric State of NadR

Singh et al. [22], speculated that NadRHi may presumably work as a tetramer based on the crystal packing they observed in the structure of NadRHi. This idea was corroborated by analytical ultracentrifugation experiments; however, the results showed some heterogeneity in the mass of complex [22]. A tetrameric arrangement creates a closed barrel with the cavity at the center and with the active sites of both domains (per monomer) facing away from the cavity [22]. To check the oligomeric state of NadRLl, we used Multiangle laser light scattering coupled to Size-exclusion chromatography (SEC-MALLS), as this technique has been successfully used to determine oligomeric states of proteins [33,34]. SEC-MALLS showed that NadRLl with and without substrates is a monomeric protein with an average mass of 47.3 kDa in solution (Figure 5A,B). Notably, the presence of the substrate affected the elution volumes. A possible explanation can be that protein without substrate is conformationally more flexible, while binding to substrate makes it more globular, which yields a delayed elution volume.

2.6. Crystal Structures of NadR

NadRLl crystallized in the P6422 space group with two molecules in the asymmetric unit. The structure was solved using the structure of NadRHi (PDB code: 1LW7) as an input for the molecular replacement. After several rounds of refinement intertwined with manual model building, the final NadRLl model was obtained (see Table 4 for the detailed statistics on data collection and refinement). Each molecule of NadRLl is comprised of two domains—an N-terminal NMNAT domain (residues 8–177) folded in a Rossmann-like fold and a C-terminal RNK domain (residues 178–379) (Figure 6). In the previously reported NadRHi crystal structure, NAD was bound to the NMNAT domain; however, we did not observe NAD molecules bound to the NMNAT domain of NadRLl. The clamshell-like binding site was rather squeezed, and the nicotinamide recognition loop was open (Figure 6B). The ATP-binding site of the NMNAT domain was also distorted (Figure 6C), and we observed a bound sulfate ion at the position where the β- or γ-phosphate of ATP is expected to be located. The RNK domain also had no substrate bound, with the positions of essentially conserved side chains of Walker A (residues 187–195) and Walker B (residues 254–260) motifs (canonical motifs for ATP-binding) of NadRLl and NadRHi superimposing well (Figure 6C, also see Figure 1 for the sequence alignment). The lid region (residues 304–318) had fallen back into the binding site (Figure 6C), thus, there is not enough space for binding of ATP or NR.
Interestingly, we observed strong positive electron density in the region between the two domains whenever we added substrates for co-crystallization. In one of the collected datasets, we observed a mixture of NAD and AMP-PNP bound at this location in the electron density (Figure 6D and Supplementary Figure S2). Additionally, we obtained structures in the presence of NMN and NR, which both have bound substrates in a similar area. This novel ‘binding site’ is very different from the canonical binding sites in NMNAT and RNK domains and is formed by side chains of K65, Y69, R177, H178, Y240, S244, N248, and R293 (Figure 6D).

3. Discussion

NadR proteins can be involved in different functions: NAD biosynthesis and transcriptional regulation. While NadR proteins from Haemophilus sp. and most Gram-negative bacteria contain a DNA binding domain at the N terminus, such a domain is absent in the NadRLl protein, indicating that NadRLl is not involved in transcriptional regulation. Here we provide a biochemical study of NadRLl along with crystal structures. We found sigmoidal dependence of the rate of NAD formation on the concentration of ATP, both for the conversion of NR to NAD and for the conversion of NMN to NAD. Whereas the sigmoidal behavior could be explained for the reaction in which NR is converted into NAD, because two molecules of ATP are used, the sigmoidal behavior is unexpected for the conversion of NMN. There is possibly a regulatory site where ATP binds. The positive electron density between the two domains observed in the crystal structure could be such a site.
We solved crystal structures of NadRLl in the presence of various substrates. The only available crystal structure of NadRHi contains bound NAD in both the domains. Here we observed electron density for an NAD or other nucleotide molecule at a different site, located between the two domains, whereas the predicted active sites were unoccupied. Although we cannot completely rule out that the new binding site is an artifact of crystallization, another explanation is that this site is a transfer hub between two domains. After the RNK domain has performed phosphorylation of nicotinamide riboside to produce NMN, the latter molecule has to be transported to the NMNAT domain, where the consequent conversion into NAD takes place. Such a depot site might be of use to temporarily keep an intermediate substrate to prevent its diffusion away from the protein. The site may also have a function for allosteric regulation, which could explain the sigmoidal dependence of the conversion of NMN to NAD on the ATP concentration.

4. Materials and Methods

4.1. Cloning

The gene encoding NadRLl was cloned in the p2BAD vector [35] using the restriction sites Sac1 and Kas1 with the sequence coding for an N-terminal twin strep tag (WSHPQFEK-(GGGS)2-GGS-SA-WSHPQFEK) downstream of the second promotor. The plasmid was transformed into competent cells of the E. coli strain MC1061.

4.2. Protein Expression and Purification

Protein overexpression was done in the E. coli MC1061 strain transformed with the expression plasmid. Cells were cultivated in five-liter flasks containing 2 L luria bertani (LB) medium with the composition of 10 g NaCl, 10 g Tryptone, and 5 g yeast extract per liter. The E. coli cells with p2BAD plasmid were grown at 37 °C, 200 rpm to an OD600 of 0.6. Once the OD reached 0.6, induction was done with 0.04% arabinose. After induction, cells were grown further for another 3 h at 37 °C. After 3 h of induction, cells were collected by centrifugation (20 min, 7,446 g, 4 °C), washed in wash buffer (50 mM Tris/HCl, pH 7.5) and resuspended in the buffer A (50 mM Tris/HCl, pH 7.5, 150 mM NaCl, and 10% glycerol). Cells were lysed by high-pressure disruption (Constant Cell Disruption System Ltd., Northamptonshire UK, one passage at 25 kPsi for E. coli cells at 5 °C). After cell lysis, 1 mM MgSO4, 0.2 mM PMSF, and 50–100 mg·mL−1 DNase were added. Cell debris was removed by low-speed centrifugation (20 min, 12,074 g, 4 °C). To remove crude membranes and other impurities, the supernatant was centrifuged for 45 min, 193727 g, 4 °C. The clear supernatant was used for further protein purification.
The clear supernatant was passed through a streptavidin resin column (total volume 1 mL), which was pre-equilibrated with buffer B (50 mM Tris/HCl, pH 8.0 and 1 mM EDTA). The flow-through was collected for SDS gel electrophoresis. Once supernatant was passed, the column material was washed with 20 CV of wash buffer C (50 mM Tris/HCl pH 8.0, 200 mM NaCl, 1 mM EDTA). NadR was eluted in three fractions (E1, E2 and E3) of 350, 750 and 600 µL respectively with elution buffer D (50 mM Tris/HCl pH 8.0, 150 mM NaCl, 1 mM EDTA and 1 mM des-thiobiotine). Elution fraction E2 contained the highest amount of protein as measured by absorbance at 280 nm using a nanodrop machine. This fraction was further purified by size-exclusion chromatography with column Superdex 200, 10/300 gel filtration column (GE Healthcare), equilibrated with buffer E (50 mM Tris/HCl pH 8.0, 150 mM NaCl).
After size-exclusion chromatography, the fractions containing the NadR protein were combined and used directly for ITC and kinetics measurements. For crystallization, the protein was concentrated with a vivaspin 500 concentrator with a molecular weight cutoff of 30 kDa (Sartorius stedim), to a final concentration of 17 mg·mL−1.

4.3. Isothermal Calorimetric Titration (ITC) Measurements for Substrate Specificity

ITC measurements were conducted with an ITC200 calorimeter (MicroCal, Malvern, UK) at 25 °C. The substrates nicotinamide riboside (Niagen TM, Chromadex, Los Angeles, CA, USA), NMN (Sigma Aldrich, St. Louis, MO, USA), NAD (Sigma Aldrich, St. Louis, MO, USA) and nicotinamide were dissolved in the buffer that was used for protein purification. The substrate concentration used for ITC measurements varied from 1 mM to 5 mM as a final concentration. The ligand solutions were added into the temperature-equilibrated ITC cell filled with ~300 μL of protein with a concentration of 10–50 µM. The final obtained data were analyzed with ORIGIN-based software (MicroCal).

4.4. Lactate Dehydrogenase (LDH) Coupled NADH Measurements Assay

NadRLl kinetics was assayed using lactate dehydrogenase (LDH) coupled NADH measurements using an Agilent spectrophotometer (Cary 100 UV-Vis) with a quartz cuvette. The measurements were done by varying the concentration of NR, in the reaction buffer F (100 mM Tris/HCl pH 7.5) containing 10 mM Mg-ATP, 150 mM lactic acid, 10 µL (10 mg·mL−1, 550 units/mg) of LDH and NadRLl protein with a concentration of 1.0 mg·mL−1, with a final volume of 200 µL. The same reaction was also performed, by varying the concentration of Mg-ATP (up to 10 mM) while keeping NR concentration constant at 1 mM in the presence of 150 mM lactic acid, 10 µL (10 mg·mL−1, 550 units/mg) of LDH and 1.0 mg·mL−1 of NadRLl protein in the buffer F with the final volume of 200 µL. For NMN measurements, we varied the concentration up to 5 mM, and we used 10 mM Mg-ATP, 150 mM lactic acid, 10 µL (10 mg·mL−1, 550 units/mg) of LDH, and 1.0 mg·mL−1 NadRLl protein in the buffer F with the same reaction volume of 200 µL. The reaction was further studied with the fixed amount of NMN (1 mM) and varying Mg-ATP concentrations, as described for NR. The reaction was started by the addition of NadR protein to all other pre-mixed components (incubated at 25 °C for 1 min), and NADH absorbance was measured at a wavelength of 340 nm. As controls, each component was removed one by one (with the appropriate volume compensation by addition of buffer) during the kinetics measurements.
The specific enzyme activity was calculated by using the formula, as shown below
A s p = δ × V r x n × 1000 6220 × V e n z   × c
where: A s p is initial specific activity (µmol·min−1·mg−1); δ is the initial slope of increase in absorbance (min−1); V r x n is total reaction volume (µL); V e n z is added diluted enzyme volume (µL); c is protein stock concentration (mg·mL−1).
V m a x and K m values were determined using either classical or modified (when the substrate inhibition was observed) Michaelis-Menten equations
V 0 = V m a x × S K m + S o r   V 0 = V m a x × S K m + S + S 2 K i
where: V 0 is initial specific activity measured in initial step of reaction (µmol·min−1·mg−1); V m a x is maximal possible specific rate of reaction (µmol·min−1·mg−1); S is substrate concentration (mM); K m is michaelis-Menten constant (mM); K i is substrate inhibition concentration (mM).
The hill fitting parameters were calculated using the following equation
V 0 = V m a x × S n K m n + S n
where n is the hill coefficient.
Origin Pro v8.0724 Software (OriginLab Corporation) was used for the non-linear fitting of data according to this equation.

4.5. Crystallization

The initial crystallization trials were done with the commercial screens such as MCSG (Microlytic, Burlington, MA, USA) and Membrane Gold (Molecular Dimensions, Sheffield, UK) using the mosquito crystallization robot (TPP LabTech, Melbourne, UK). Initial crystals were obtained at 4 °C, but the diffraction was limited to 7–10 Å resolution. After the first round of optimization, we improved the diffraction up to 5 Å resolution. Further optimizations were set up as vapor-diffusion sitting drops (1:1 ratio, 0.1 µL) at 16 °C with the protein concentration of 17 mg·mL−1. Diamond-shaped crystals were obtained within 3–5 days. These crystals diffracted to around 3 Å resolution. As the final optimization, the additive screen (Hampton Research) was used to obtain the crystals with the diffraction limit of 2–3 Å resolution. The crystallization conditions were as follows: 1 M (NH4)2SO4, 100 mM Na Citrate pH 6.5, 10 mM MgCl2 and 10% glucose or 1 M (NH4)2SO4, 100 mM Hepes pH 7.0 and 10% CaCl2. Co-crystallization with NR, NMN, NAD, Mg-ATP, and with Mg-AMP-PNP was performed. In the NR-bound state, the co-crystallization condition was 1 M (NH4)2SO4, 100 mM Na Citrate pH 6.5, 5 mM NR, 10 mM MgCl2, and 10% glucose. In NMN bound co-crystallization condition, all the components mentioned above remained the same except NR was replaced by the addition of 5 mM NMN. The NAD bound co-crystallization condition also remained the same with an addition of 5 mM NAD along with 5 mM Mg-AMP-PNP. All the crystals were flash-frozen in liquid nitrogen for further X-ray diffraction analysis.

4.6. Static Light Scattering and Refractive Index Measurements

The determination of the oligomeric state of purified NadRLl was performed as described [33,34]. Briefly, the Superdex 200 column used for the SEC-MALLS analysis was equilibrated with SEC buffers (50 mM Tris/HCl, pH 8.0, 150 mM NaCl or 50 mM Tris/HCl, pH 8.0, 150 mM NaCl, 5 mM ATP, 1 mM NMN, filtered through 0.1 μm pore size VVLP filters (Millipore)), and subsequently the buffer was recirculated through the system for 16 h at 0.5 mL/min. Purging of the refractometer was switched off when the baselines were stable, and the detector reading was set to zero. 200 µL of protein solutions (0.5 mg·mL−1) with and without substrates accordingly were injected, and the data from the three detectors were imported by the ASTRA software package (Wyatt Technologies, Santa Barbara, CA, USA). The experiments were done at room temperature, but the differential refractometer was precisely set at 30 °C.

4.7. Data Collection, Structure Determination, and Refinement

The diffraction data were collected at 100 K at the PX beamline at SLS (Villigen, Switzerland) and at the beamline ID29 (ESRF, Grenoble, France). Collected data were processed with XDS package [36]. Molecular replacement was performed with Phaser [37] using NadR from H. influenzae (PDB code 1LW7) as a starting model. Refinement was performed in Phenix [38] with the manual corrections in Coot [39]. The composite omit maps were calculated using simulated annealing protocol implemented in Phenix [38]. The final models were deposited in PDB databank under 6GYE for NadR with NR, 6GYF for NadR with NMN, and 6GZO for NadR with NAD/AMP-PNP.

Supplementary Materials

The following are available online, Figure S1: Schematic representation of NadR catalytic reaction, Figure S2: The composite omit electron density for (A) NR (contoured at 1σ) (B) NMN (contoured at 1.5σ) and (C) mixture of NAD and AMP-PNP (contoured at 1σ).

Author Contributions

Conceptualization: M.J., D.J.S. with contribution from all authors; methodology and experiments: A.S., R.S., and M.J.; validation: A.S., R.S. and A.G.; formal analysis: A.S., R.S., A.G. and D.J.S.; manuscript writing: R.S., A.S., A.G. and D.J.S. All authors have read and agreed to the published version of the manuscript.

Funding

The access to the synchrotron facilities was supported by iNEXT, grant number 653706, funded by the Horizon 2020 program of the European Union.

Conflicts of Interest

The authors declare no conflict of interest. The funders had no role in the design of the study; in the collection, analyses, or interpretation of data; in the writing of the manuscript, or in the decision to publish the results.

References

  1. Jaehme, M.; Slotboom, D.J. Structure, function, evolution, and application of bacterial Pnu-type vitamin transporters. Biol. Chem. 2015, 396, 955–966. [Google Scholar] [CrossRef]
  2. Jaehme, M.; Slotboom, D.J. Diversity of membrane transport proteins for vitamins in bacteria and archaea. Biochim. Biophys. Acta (BBA)-Gene. Subj. 2015, 1850, 565–576. [Google Scholar] [CrossRef]
  3. Bacher, A.; Eberhardt, S.; Fischer, M.; Kis, K.; Richter, G. Biosynthesis of vitamin b2 (riboflavin). Annu. Rev. Nutr. 2000, 20, 153–167. [Google Scholar] [CrossRef] [Green Version]
  4. Marsili, E.; Baron, D.B.; Shikhare, I.D.; Coursolle, D.; Gralnick, J.A.; Bond, D.R. Shewanella secretes flavins that mediate extracellular electron transfer. Proc. Natl. Acad. Sci. USA 2008, 105, 3968–3973. [Google Scholar] [CrossRef] [Green Version]
  5. Kemmer, G.; Reilly, T.J.; Schmidt-Brauns, J.; Zlotnik, G.W.; Green, B.A.; Fiske, M.J.; Herbert, M.; Kraiss, A.; Schlor, S.; Smith, A.; et al. NadN and e (P4) are essential for utilization of NAD and nicotinamide mononucleotide but not nicotinamide riboside in Haemophilus influenzae. J. Bacteriol. 2001, 183, 3974–3981. [Google Scholar] [CrossRef] [Green Version]
  6. Grose, J.H.; Bergthorsson, U.; Xu, Y.; Sterneckert, J.; Khodaverdian, B.; Roth, J.R. Assimilation of nicotinamide mononucleotide requires periplasmic AphA phosphatase in Salmonella enterica. J. Bacteriol. 2005, 187, 4521–4530. [Google Scholar] [CrossRef] [Green Version]
  7. Rodionov, D.A.; Li, X.; Rodionova, I.A.; Yang, C.; Sorci, L.; Dervyn, E.; Martynowski, D.; Zhang, H.; Gelfand, M.S.; Osterman, A.L. Transcriptional regulation of NAD metabolism in bacteria: Genomic reconstruction of NiaR (YrxA) regulon. Nucleic Acids Res. 2008, 36, 2032–2046. [Google Scholar] [CrossRef]
  8. Jaehme, M.; Singh, R.; Garaeva, A.A.; Duurkens, R.H.; Slotboom, D.-J. PnuT uses a facilitated diffusion mechanism for thiamine uptake. J. Gene. Physiol. 2018, 150, 41–50. [Google Scholar] [CrossRef] [PubMed] [Green Version]
  9. Jaehme, M.; Guskov, A.; Slotboom, D.J. Crystal structure of the vitamin B3 transporter PnuC, a full-length SWEET homolog. Nat. Struct. Mol. Biol. 2014, 21, 1013–1015. [Google Scholar] [CrossRef] [PubMed]
  10. Slotboom, D.J. Structural and mechanistic insights into prokaryotic energy-coupling factor transporters. Nat. Rev. Microbiol. 2014, 12, 79–87. [Google Scholar] [CrossRef] [PubMed] [Green Version]
  11. Sauer, E.; Merdanovic, M.; Mortimer, A.P.; Bringmann, G.; Reidl, J. PnuC and the utilization of the nicotinamide riboside analog 3-aminopyridine in Haemophilus influenzae. Antimicrob. Agents Chemother 2004, 48, 4532–4541. [Google Scholar] [CrossRef] [PubMed] [Green Version]
  12. Cynamon, M.H.; Sorg, T.B.; Patapow, A. Utilization and Metabolism of NAD by Haemophilus parainfluenzae. Microbiology 1988, 134, 2789–2799. [Google Scholar] [CrossRef] [PubMed] [Green Version]
  13. Merdanovic, M.; Sauer, E.; Reidl, J. Coupling of NAD+ biosynthesis and nicotinamide ribosyl transport: Characterization of NadR ribonucleotide kinase mutants of Haemophilus influenzae. J. Bacteriol. 2005, 187, 4410–4420. [Google Scholar] [CrossRef] [PubMed] [Green Version]
  14. Grose, J.H.; Bergthorsson, U.; Roth, J.R. Regulation of NAD synthesis by the trifunctional NadR protein of Salmonella enterica. J. Bacteriol. 2005, 187, 2774–2782. [Google Scholar] [CrossRef] [Green Version]
  15. Gerasimova, A.V.; Gelfand, M.S. Evolution of the NadR regulon in Enterobacteriaceae. J. Bioinform. Comput. Biol. 2005, 3, 1007–1019. [Google Scholar] [CrossRef] [PubMed] [Green Version]
  16. Spector, M.P.; Hill, J.M.; Holley, E.A.; Foster, J.W. Genetic characterization of pyridine nucleotide uptake mutants of Salmonella typhimurium. J. Gen. Microbiol. 1985, 131, 1313–1322. [Google Scholar] [CrossRef] [PubMed] [Green Version]
  17. Tirgari, S.; Spector, M.P.; Foster, J.W. Genetics of NAD metabolism in Salmonella typhimurium and cloning of the nadA and pnuC loci. J. Bacteriol. 1986, 167, 1086–1088. [Google Scholar] [CrossRef] [Green Version]
  18. Zhu, N.; Roth, J.R. The nadI region of Salmonella typhimurium encodes a bifunctional regulatory protein. J. Bacteriol. 1991, 173, 1302–1310. [Google Scholar] [CrossRef] [PubMed] [Green Version]
  19. Vogl, C.; Grill, S.; Schilling, O.; Stulke, J.; Mack, M.; Stolz, J. Characterization of riboflavin (vitamin B2) transport proteins from Bacillus subtilis and Corynebacterium glutamicum. J. Bacteriol. 2007, 189, 7367–7375. [Google Scholar] [CrossRef] [PubMed] [Green Version]
  20. Mitchell, P.; Moyle, J. Group-translocation: A consequence of enzyme-catalysed group-transfer. Nature 1958, 182, 372–373. [Google Scholar] [CrossRef]
  21. Kurnasov, O.V.; Polanuyer, B.M.; Ananta, S.; Sloutsky, R.; Tam, A.; Gerdes, S.Y.; Osterman, A.L. Ribosylnicotinamide kinase domain of NadR protein: Identification and implications in NAD biosynthesis. J. Bacteriol. 2002, 184, 6906–6917. [Google Scholar] [CrossRef] [Green Version]
  22. Singh, S.K.; Kurnasov, O.V.; Chen, B.; Robinson, H.; Grishin, N.V.; Osterman, A.L.; Zhang, H. Crystal structure of Haemophilus influenzae NadR protein. A bifunctional enzyme endowed with NMN adenyltransferase and ribosylnicotinimide kinase activities. J. Biol. Chem. 2002, 277, 33291–33299. [Google Scholar] [CrossRef] [Green Version]
  23. Raffaelli, N.; Lorenzi, T.; Mariani, P.L.; Emanuelli, M.; Amici, A.; Ruggieri, S.; Magni, G. The Escherichia coli NadR regulator is endowed with nicotinamide mononucleotide adenylyltransferase activity. J. Bacteriol. 1999, 181, 5509–5511. [Google Scholar] [CrossRef] [Green Version]
  24. Zhang, H.; Zhou, T.; Kurnasov, O.; Cheek, S.; Grishin, N.V.; Osterman, A. Crystal structures of E. coli nicotinate mononucleotide adenylyltransferase and its complex with deamido-NAD. Structure (Lond. Engl. 1993) 2002, 10, 69–79. [Google Scholar] [CrossRef] [Green Version]
  25. Penfound, T.; Foster, J.W. NAD-dependent DNA-binding activity of the bifunctional NadR regulator of Salmonella typhimurium. J. Bacteriol. 1999, 181, 648–655. [Google Scholar] [CrossRef] [Green Version]
  26. Foster, J.W.; Penfound, T. The bifunctional NadR regulator of Salmonella typhimurium: Location of regions involved with DNA binding, nucleotide transport and intramolecular communication. FEMS Microbiol. Lett. 1993, 112, 179–183. [Google Scholar] [CrossRef] [PubMed]
  27. Cookson, B.T.; Olivera, B.M.; Roth, J.R. Genetic characterization and regulation of the nadB locus of Salmonella typhimurium. J. Bacteriol. 1987, 169, 4285–4293. [Google Scholar] [CrossRef] [PubMed] [Green Version]
  28. Zhu, N.; Olivera, B.M.; Roth, J.R. Genetic characterization of the pnuC gene, which encodes a component of the nicotinamide mononucleotide transport system in Salmonella typhimurium. J. Bacteriol. 1989, 171, 4402–4409. [Google Scholar] [CrossRef] [PubMed] [Green Version]
  29. Foster, J.W.; Holley-Guthrie, E.A.; Warren, F. Regulation of NAD metabolism in Salmonella typhimurium: Genetic analysis and cloning of the nadR repressor locus. Mol. Gen. Genet. (MGG) 1987, 208, 279–287. [Google Scholar] [CrossRef] [PubMed]
  30. Zhu, N.; Olivera, B.M.; Roth, J.R. Activity of the nicotinamide mononucleotide transport system is regulated in Salmonella typhimurium. J. Bacteriol. 1991, 173, 1311–1320. [Google Scholar] [CrossRef] [Green Version]
  31. Robert, X.; Gouet, O. Deciphering key features in protein structures with the new ENDscript server. Nucleic Acid Res. 2014, 42, W320–W324. [Google Scholar] [CrossRef] [PubMed] [Green Version]
  32. Hill, A.V. The possible effects of the aggregation of the molecules of haemoglobin on its dissociation curves. J. Physiol (London) 1910, 40, 4–7. [Google Scholar]
  33. Slotboom, D.J.; Duurkens, R.H.; Olieman, K.; Erkens, G.B. Static light scattering to characterize membrane proteins in detergent solution. Methods 2008, 46, 73–82. [Google Scholar] [CrossRef] [PubMed] [Green Version]
  34. Beek, J.ter; Duurkens, R.H.; Erkens, G.B.; Slotboom, D.J. Quaternary structure and functional unit of energy coupling factor (ECF)-type transporters. J. Biol. Chem. 2011, 286, 5471–5475. [Google Scholar] [CrossRef] [Green Version]
  35. Birkner, J.P.; Poolman, B.; Koçer, A. Hydrophobic gating of mechanosensitive channel of large conductance evidenced by single-subunit resolution. Proc. Natl. Acad. Sci. USA 2012, 109, 12944–12949. [Google Scholar] [CrossRef] [Green Version]
  36. Kabsch, W. XDS. Acta Crystallogr. D 2010, 66, 125–132. [Google Scholar] [CrossRef] [Green Version]
  37. McCoy, A.J.; Grosse-Kunstleve, R.W.; Adams, P.D.; Winn, M.D.; Storoni, L.C.; Read, R.J. Phaser crystallographic software. J. Appl. Crystallogr. 2007, 40, 658–674. [Google Scholar] [CrossRef] [Green Version]
  38. Adams, P.D.; Afonine, P.V.; Bunkóczi, G.; Chen, V.B.; Davis, I.W.; Echols, N.; Headd, J.J.; Hung, L.-W.; Kapral, G.J.; Grosse-Kunstleve, R.W.; et al. PHENIX: A comprehensive Python-based system for macromolecular structure solution. Acta Crystallogr. D 2010, 66, 213–221. [Google Scholar] [CrossRef] [Green Version]
  39. Emsley, P.; Lohkamp, B.; Scott, W.G.; Cowtan, K. Features and development of Coot. Acta Crystallogr. D Biol. Crystallogr. 2010, 66, 486–501. [Google Scholar] [CrossRef] [Green Version]
Sample Availability: Samples of the compounds are available from the authors.
Figure 1. Multiple sequence alignment of NadR proteins from selected organisms. The amino acid residues are colored based on conservation, amino acids colored red are similar in more than 50% of the aligned NadR sequences. The amino acid residues in the red columns are conserved in all aligned NadR sequences. Organisms’ names: L. lactis (Lactococcus lactis), M. tuberculosis (Mycobacterium tuberculosis), Bacillus sp. (Bacillus sp.), S. typhimurium (Salmonella typhimurium), E. coli (Escherichia coli), S. flexneri (Shigella flexneri), S. plymutica (Serretia plymutica), Y. frederiksenii (Yersenia frederiksenii), H. influenzae (Haemophilus influenzae), and H. parassuis (Haemophilus parassuis). The bars on top show the locations of the three distinct domains of NadR proteins. The blue bars below the alignment indicate NAD binding residues, the red bars walker A and walker B motifs, and the pink bars are the phosphate-binding sites.
Molecules 25 01940 g001
Figure 2. Apparent Km and Vmax determination of NadR from L. lactis for the substrate nicotinamide riboside at the constant ATP concentration of 10 mM (A) and for ATP at the constant NR concentration of 1 mM (B).
Molecules 25 01940 g002
Figure 3. Apparent Km and Vmax determination for substrates nicotinamide mononucleotide (at a constant ATP concentration of 10 mM) (A) and ATP (at a constant NMN concentration of 1 mM) (B).
Molecules 25 01940 g003
Figure 4. Time course of NADH formation with nicotinamide riboside as a substrate at two different protein concentrations (0.1 mg·mL−1 (black line) and 1.0 mg·mL−1 (red line), arrows indicate the addition of NadR) (A). Extended time scale (90 min) of the experiment with 0.1 mg·mL−1 (black line) (B).
Molecules 25 01940 g004
Figure 5. Oligomeric state of the NadR protein from L. lactis in solution. SEC-MALLS analysis of NadR without substrates (A) and in the presence of 5 mM ATP and 1 mM NMN (B).
Molecules 25 01940 g005
Figure 6. Crystal structure of NadRLl. (A) Overall fold in secondary structure cartoon representation, NMN adenylyltransferase (NMNAT) domain in red and ribosylnicotinamide kinase (RNK) domain in yellow; unresolved loops are shown as dashed lines. (B) Superposition of NadRLl with NadR from H. influenzae (cyan, the substrate from this structure is shown as sticks), the movements of the nicotinamide-recognition loop and one of the helixes forming the binding site are shown with red arrows; rmsd ~ 2.5 Å; (C) ATP-binding site in the RNK domain: the position of the lid loop is indicated within a dashed rectangle; a sulfate ion likely occupies the position of one of ATP phosphates; essentially conserved Lys and Asp residues of Walker A and B motifs are shown as sticks (numbering from NadRLl, with NadRHI numbers in brackets); (D) A possible binding site at the interface between the domains: NAD, AMP-PNP, and the protein residues forming this binding site are shown as sticks. The omit electron densities for these cofactors, as well as NR and NMN, are shown in Supplementary Figure S2.
Molecules 25 01940 g006
Table 1. Substrate binding studied by isothermal titration calorimetry (ITC) with NadR protein from L. lactis.
SubstrateDissociation Constant–KD (µM)
ATP63 ± 1
AMP-PNP13 ± 1
NRNo Binding
NMNNo Binding
NADNo Binding
NicotinamideNo Binding
Nicotinic acidNo Binding
The error represents the upper and lower values from two measurements.
Table 2. Apparent Km, Ki and Vmax values of the NadR-catalyzed reaction for nicotinamide mononucleotide (NMN) and nicotinamide riboside (NR) in presents of constant concentration ATP (10 mM).
Km, mMVmax, µmol·min−1·mg−1Ki, mM
NR0.6 ± 0.10.4 ± 0.131.4 ± 8.1
NMN0.5 ± 0.11.5 ± 0.125.4 ± 10.8
The error is the standard derivations of the three independent measurements.
Table 3. Apparent Km, Vmax and the Hill coefficient values of NadR from L. lactis for ATP in the presence of a constant concentration of NR or NMN (1mM ).
Km, mMVmax, µmol·min−1·mg−1The Hill Coefficient
NR5.2 ± 0.90.4 ± 0.12.3 ± 0.5
NMN5.2 ± 0.61.2 ± 0.12.2 ± 0.3
The error is the standard derivations of the three independent measurements.
Table 4. Data collection and refinement statistics for the NadRLl crystal structures with respective substrates.
NadR NRNadR NMNNadR NAD AMP-PNP
PDB code
Data collection
6GYE6GYF6GZO
Space groupP 64 2 2P 64 2 2P 64 2 2
Unit cell dimensions
a, b, c (Å)165.14, 165.14, 196.55165.09, 165.09, 193.05167.32, 167.32, 192.81
α, β, γ (°)90.0, 90.0, 120.090.0, 90.0, 120.090.0, 90.0, 120.0
Resolution range (Å)47.4–2.30 (2.33–2.30) *47.83–2.70 (2.76–2.70) *45.74–3.00 (3.09–3.00) *
Rmeas (%)16.6 (>100) *13.1 (>100) *9.4 (>100) *
cc1/299.8 (29.4) *99.8 (33.0) *99.8 (72.5) *
I/σI12.5 (0.9) *11 (0.6) *5.6 (1.7) *
Completeness (%)100 (100) *100 (99.9) *100 (99.4) *
Multipilicity13.5 (13.4) *13.4 (13.1) *6.5 (6.4) *
Refinement
Resolution (Å)47.4–2.3047.83–2.7045.74–3.00
No. of reflections704414157732439
Rwork/Rfree0.18/0.210.20/0.240.19/0.24
Number non-hydrogen atoms644661095993
Protein608460425838
Ligands/Ions36/6044/2388/5
Water26600
B-factors (Å2)
Protein70.986.5118.8
Ligand/Ions109.7/115.198.6/101.1135.9/178.3
Water67.1
R.m.s. deviations
Bond lengths (Å)0.0080.0090.009
Bond angles (°)0.9581.0541.275
Molprobity score1.832.082.56
* for the highest resolution shell.

