Abstract
Both the chemical shift and quadrupole coupling tensors for N and Al in the wurtzite structure of aluminum nitride have been determined to high precision by single-crystal NMR spectroscopy. A homoepitaxially grown AlN single crystal with known morphology was used, which allowed for optical alignment of the crystal on the goniometer axis. From the analysis of the rotation patterns of N () and Al (), the quadrupolar coupling constants were determined to kHz, and MHz. The chemical shift parameters obtained from the data fit were ppm and ppm for N, and (after correcting for the second-order quadrupolar shift) ppm and ppm for Al. DFT calculations of the NMR parameters for non-optimized crystal geometries of AlN generally did not match the experimental values, whereas optimized geometries came close for Al with MHz, but not for N with kHz.
1. Introduction
Aluminum nitride, AlN, is industrially used as a substrate for semiconductor devices such as ultraviolet LEDs, and is also the preferred starting material for the synthesis of chemically inert lightweight ceramics with excellent mechanical properties, such as SiAlONs [1,2]. Ceramic materials are often amorphous or consist of crystalline grains which are embedded in a glassy matrix, and hence characterization of such materials as well as detection and identification of impurities is not always straightforward. Nuclear magnetic resonance (NMR) spectroscopy has proven to be a powerful analytical technique to analyze ceramic structures, because of its ability to selectively probe the local surrounding of the observed nuclides [3,4,5]. For characterization of a multi-component system, it is crucial to know the exact NMR-interaction parameters of the detected nuclei in the various components, in order to correctly assign and distinguish the NMR signals arising from them. The ‘gold standard’ for the determination of the NMR-interaction parameters, which in the solid state take the form of second-rank tensors [6], is via NMR spectroscopy of single crystals [7].
Here, we present the determination of the full chemical shift tensor and quadrupole coupling tensor for Al () and N () in hexagonal aluminum nitride by means of single-crystal NMR spectroscopy. This is made possible by the successful preparation of a macroscopic single crystal of AlN (shown in Figure 1a) using a bulk growth process on a native AlN seed [8]. Aluminum nitride commonly occurs in the hexagonal wurtzite structure, depicted in Figure 1b, with space group (No. 186) and two formula units per unit cell [9]. The aluminum as well as the nitrogen atoms are located at Wyckoff position on a three-fold rotation axis parallel to the crystallographic c axis. Aluminum is tetrahedrally coordinated by nitrogen and vice versa, with one slightly elongated Al-N bond directed along the three-fold rotation axis, and the other three bonds found in equivalent positions around this axis, as may be seen in Figure 1c. These symmetry constraints have a direct impact on the structure of the NMR tensors, as will be explained in the following.
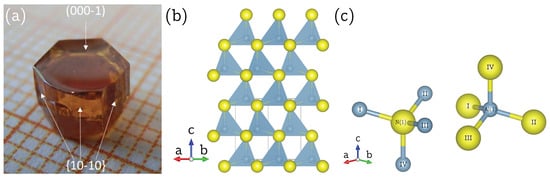
Figure 1.
(a) Single crystal of aluminum nitride, AlN, with the synthesis described in Reference [8]. The crystallographic c axis and the plane are indicated by arrows. (b) Wurtzite structure of AlN, according to Reference [9], viewed down the crystallographic [11-20] direction. The aluminum atoms (blue-grey) and the nitrogen atoms (yellow), both located at Wyckoff position 2b, are tetrahedrally coordinated by each other with one Al-N bond directed parallel to the crystallographic c axis. (c) Individual, tetrahedrally coordinated, aluminum and nitrogen atom in the crystal structure of AlN, in which the three equal, shorter, bonds Al/N—I/II/III with 1.8891(8) Å and the longer bond Al/N—IV with 1.9029(16) Å along the three-fold rotation axis are highlighted. Drawing generated with the VESTA program [10].
2. Single-Crystal N and Al NMR
In the solid state, the NMR response of spin is governed by the chemical shift, and by dipolar (direct) couplings between spins [11]. The dipolar couplings between the nuclear spins in the AlN lattice result in homogeneous line broadening and will not be quantitatively evaluated here. Both N and Al have a spin , and therefore, the quadrupolar coupling between the non-symmetric charge distribution of the nucleus and its electronic surroundings also needs to be considered [12]. For a spin I in an external magnetic field, NMR transitions exist, which are classified according to their magnetic quantum number m. With a particular transition designated by the parameter [13], the resonance frequency of this transition may be described by the following general notation:
For the two transitions of N with , the values for k are . For the five transitions of Al with , the values for k are for the central transition, and for the satellite transitions. In Equation (1), is the Larmor frequency, the contribution of the chemical shift (CS), and and are the effects of the quadrupolar interaction described by perturbation theory to first and second order, respectively. Magnitude and orientation dependency of the quadrupole interaction may be gauged by the quadrupole coupling tensor . Similar to the electrical field gradient (EFG) tensor , to which it is related by , this second-rank tensor is symmetric and traceless, i.e., and . Generally, for NMR spectroscopy of single crystals, it is useful to define three distinct coordinate systems, i.e., the laboratory frame, where the z axis is defined by the orientation of the external magnetic field, the crystal lattice () frame and the principal axis system (). In the wurtzite structure of AlN, nitrogen and aluminum are both situated on a three-fold rotation axis parallel to the crystallographic c axis, and therefore the and the frames for N and Al are identical. In their frame, symmetric tensors take diagonal form. This has the consequence that the tensors cannot change when the two formula units are generated by the symmetry elements of Wyckoff position 2b. Therefore, the two N and Al atoms in the AlN unit cell are practically pairwise magnetically equivalent, even though they do not fulfil the strict equivalence criterion of being connected by either inversion or translation. The tensor for both nuclides is hence uniaxial (with asymmetry ), and solely defined by the quadrupolar coupling constant :
This tensor is conveniently determined from the separations (’splittings’) of the symmetric doublet for N, and of the satellite transitions (ST’s) with for Al, since these are not affected by the chemical shift and the second-order quadrupolar interaction. Thus, the difference of the resonance frequencies (where we have dropped the subscripts used in Equation (1) for brevity) is:
The contribution of the quadrupolar interaction to first order for is given by [12]:
Here, the orientation dependence of on the relative orientation of the tensor to the external magnetic field is expressed by the Euler angle , with being the angle between the eigenvector with the largest eigenvalue, i.e., , and the magnetic field vector.
The contribution of the chemical shift to the resonance frequency is gauged by the chemical shift tensor . Taking into account the same symmetry arguments as for the tensor above, the chemical shift (CS) tensor for N and Al in AlN is given by:
The weighted trace of determines the isotropic chemical shift and, similar to the tensor, the asymmetry parameter for the CS tensor is . Here, we generally order the tensor components according to the convention , and make use of the reduced anisotropy [14].
To determine the CS tensor of quadrupolar nuclei with half-integer spins, such as Al (), it is customary to trace the orientation dependency of the central transition (CT), i.e., the transition [15]. In cases where the CT signal cannot be resolved [16], the variation of the center of the satellite transitions (and for spin , the center of the doublet with in all cases) may be traced instead:
For N in AlN, the quadrupolar interaction to second order is negligible, and the CS tensor may directly be determined from the doublet centers. The CT of Al in AlN is, however, affected by the quadrupolar interaction to second order, and this contribution has to be subtracted from the CT line position before can be determined. This second-order contribution can be written as [17]:
After subtracting from the observed , the change of the CT resonance frequency from the Larmor frequency is solely due to the chemical shift. The line position depends on the relative orientation of the magnetic field vector to the tensor in the crystal frame, which may be compactly expressed by the product [18]:
The determination of the actual quadrupole coupling tensors , and the chemical shift tensors , for N and Al in aluminum nitride, using the above formalism, is described in the following.
3. Results
3.1. Al Quadrupole Coupling Tensor
A single crystal of aluminum nitride with approximate dimensions of mm was used for the single-crystal NMR experiments. Since the crystal was grown by a homoepitaxial growth process [8], it is possible to assign the crystal faces to crystallographic planes, as indicated in Figure 1a. It was therefore possible to fix the crystal into in a specific orientation by gluing it with its (10-10) face onto the goniometer axis, which itself is perpendicular to the external magnetic field . The crystal was then rotated until the [000-1] direction was parallel to . Both orienting procedures involve small misalignments, which can however be quantified by the data analysis, as described below. Representative Al NMR spectra are shown in Figure 2a, with the full rotation pattern over shown in Figure 2b, which was obtained by rotating the crystal counterclockwise in steps of using the goniometer gear. The satellite pairs for , in the following denoted as ST(5/2), and , in the following denoted as ST(3/2), are symmetrically positioned around the central transition. All Al resonance lines are fairly broad, with a full width at half-maximum fwhm kHz, caused by hetero- and homonuclear dipolar interactions between aluminum and nitrogen atoms in the structure [19].
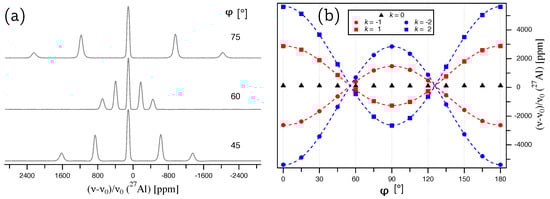
Figure 2.
(a) Al NMR spectra of a single crystal of aluminum nitride, AlN, with the indicated rotation angles referring to the full rotation pattern on the right. (b) Full rotation pattern over for Al at Wyckoff position 2b, acquired by rotating the AlN crystal counterclockwise by around a rotation axis which is perpendicular to the external magnetic field , and situated in the crystallographic plane of AlN. The zero point of the rotation, , deviates by from the ideal position where is parallel to the [000-1] direction (see text for details).
The experimentally determined satellite splittings of the ST(5/2) and ST(3/2) doublets in kHz are plotted over the rotation angle in Figure 3a. The rotation patterns in both Figure 2b and Figure 3a are mirrored at a position very close to , with the mirror defining the rotation angle for which is situated in the crystallographic plane. The deviation of the mirror from quantifies the original misalignment of the [000-1] direction to . From the way the crystal is glued on the goniometer axis, we know that the rotation axis must be in the crystallographic plane. Also, the above considerations of the effects of crystal symmetry on the tensor structure imply that the eigenvector with the largest eigenvalue () must point along the three-fold rotation axis, i.e., along the crystallographic c axis, which we attempted to align along for the starting point of our rotation pattern. For this situation, the angle in Equation (4) can be replaced by , and the magnitude of the satellite splittings (Equation (3)) an be expressed by:
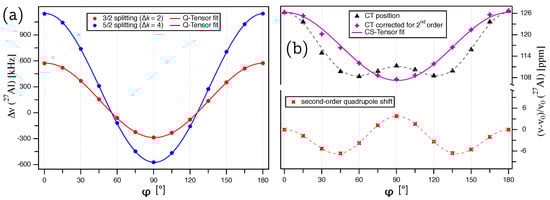
Figure 3.
(a) Plot of the splittings for the ST(3/2) (; red) and ST(5/2) (; blue) doublets for Al in the unit cell of the AlN single crystal. The lines represent the fit of the quadrupole coupling tensor according to Equation (9). (b) Plot of the experimentally determined central transition for Al (; black), the contribution of the quadrupolar interaction according to Equation (7) (red), and the central transition after subtracting the quadrupolar second-order shift from the experimental data points (purple). The solid purple line represents the fit of the chemical shift tensor according to Equation (11).
To determine the quadrupole coupling tensor of Al, the satellite splittings were simultaneously fitted according to Equation (9) with for the ST(3/2) and for the ST(5/2) splittings. The fit converged on a global solution, giving MHz and . The quadrupolar coupling constant determined from our single-crystal NMR experiments is in perfect agreement with the previously reported value of MHz, determined from a static polycrystalline powder sample of AlN [20]. The full tensor, with the eigenvalues and corresponding eigenvectors in the PAS frame (Equation (2)), is summarized in Table 1. The quadrupolar asymmetry parameter , and the orientation of the eigenvectors are a consequence of the crystal symmetry, with aligned exactly along the c axis and , placed in the plane.

Table 1.
Quadrupole coupling tensor (left), and chemical shift tensor (right) of Al in the wurtzite structure of AlN, as determined from single-crystal NMR experiments. The orientation of the corresponding eigenvectors are listed in spherical coordinates () in the hexagonal crystal frame . The errors of the experimental values reflect those delivered by the fitting routine.
3.2. Al Chemical Shift Tensor
To determine the chemical shift tensor of Al, the contribution of the second-order quadrupolar interaction must be subtracted from the central transition () line position. In Figure 3b, the Al CT is plotted over , and the data points clearly show the presence of the quadrupolar-induced shift, which according to Equation (7), contains harmonic terms depending on both and . Using the results obtained from evaluating the splittings ( MHz and ), this second-order quadrupole shift can be calculated for each crystal orientation according to Equation (7) with , see red points in Figure 3b. After subtracting the quadrupole contribution from the experimental points, the remaining variation in CT line position (Figure 3b, purple) is solely caused by the chemical shift tensor, which can be determined from it. Due to the cylindrical symmetry of the tensor and the fact that it does not transform between its and frame (see Equation (5)), the exact orientation of the rotation axis in the crystallographic plane of AlN is indeterminate. For simplicity, the rotation axis can be assumed to be parallel to the b axis, and the orientation of the magnetic field vector in the frame for each rotation angle can be expressed by:
Inserting this (and Equation (5)) into Equation (8), we obtain the expression necessary for fitting the data in Figure 3b:
For this fit, was kept fixed at the value derived from fitting , and the components of the chemical shift tensor of Al determined thereby are ppm and ppm, with the full tensor listed in Table 1. The isotropic chemical shift of ppm is in good agreement with a previously reported value [4], which was determined from a polycrystalline sample of AlN under magic-angle spinning (MAS), and after correcting for the second-order quadrupole shift (from the reported line position of ppm at a 600 MHz spectrometer [4], the correction of ppm needs to be subtracted), comes out to ppm. The chemical shift asymmetry parameter and the orientation of the chemical shift eigenvectors follow the same symmetry restrictions as for the quadrupole coupling tensor described above.
3.3. N Quadrupole Coupling Tensor
For the determination of the quadrupole coupling tensor and the chemical shift tensor of N in aluminum nitride, the same AlN crystal (Figure 1a) and goniometer axis as for Al was used. Since a change of the solenoid coil was necessary to go from the resonance frequency of Al to N, the offset angle is slightly different and needs to be determined from the data fit again. Representative N NMR spectra are depicted in Figure 4a, and at first glance, appear to show much broader lines than the Al spectra. In fact, with fwhm kHz, the resonance lines are only about one third as broad as those of Al, since the gyromagnetic ratio of N is 3.5 times smaller than that of aluminum, which scales down the homonuclear contribution of the dipolar coupling. The impression of broad lines for N is chiefly because the shifts of its resonances caused by the quadrupolar interaction ( ppm) are much smaller than those of Al ( ppm), since these shifts scale with the quadrupolar moment of the nucleus, which is 20.44 mb for N, but 146.6 mb for Al [20]. The broad resonance lines of the N spectra, combined with the relatively poor signal-to-noise ratio (due to the long relaxation time of s [22]) make it difficult to precisely derive the line positions from the spectra. Therefore, all N NMR spectra were deconvoluted, assuming combined Lorentz-Gauss functions (so-called Voigt profiles), to reliably obtain the line positions.
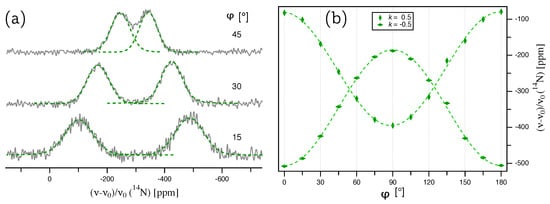
Figure 4.
(a) N NMR spectra of an AlN single crystal, acquired under the same conditions as listed in the caption of Figure 2. The green, dashed lines show the deconvolution of each signal with a Voigt profile, the maxima of which give the line positions plotted on the right. (b) Full rotation pattern for N at Wyckoff position 2b in AlN crystal. The point deviates by from the ideal position where is parallel to the [000-1] direction (see text for details).
The splittings of the thus deconvoluted N doublets are plotted over the rotation angle in Figure 5a. The quadrupole coupling tensor was determined by a fit of these splittings according to Equation (9) with , giving the quadrupolar coupling constant kHz and an offset angle of . The full quadrupole coupling tensor, with the eigenvalues and corresponding eigenvectors in the PAS frame (Equation (2)), is summarized in Table 2. The quadrupolar asymmetry parameter , and the orientation of the eigenvectors are identical to the tensor of Al. So far, only an upper limit of the quadrupolar coupling constant of N in AlN was available in the literature, namely kHz determined from a polycrystalline powder sample [20].
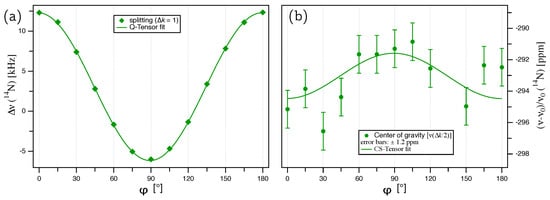
Figure 5.
(a) Plot of the splittings for N from an AlN single crystal. The lines represent the fit of the quadrupole coupling tensor according to Equation (9). (b) Plot of the center for N, with the error bars ( ppm) taken from the Voigt profile fit for each individual signal. The solid green line represents the fit of the chemical shift tensor according to Equation (11).
Table 2.
Quadrupole coupling tensor (left), and chemical shift tensor (right) of N in the wurtzite structure of AlN, as determined from single-crystal NMR experiments. The orientation of the corresponding eigenvectors are listed in spherical coordinates () in the hexagonal crystal frame . The errors of the experimental values reflect those delivered by the fitting routine.
3.4. N Chemical Shift Tensor
The chemical shift tensor of N can be calculated from the evolution of the center of the doublet with over the rotation angle, as plotted in Figure 5b. Fitting the data in Figure 5b according to Equation (11), with the offset angle kept fixed at the value derived from the quadrupole coupling tensor fit ( ppm), gives ppm and ppm, with the full tensor listed in Table 2. The data in Figure 5b exhibit quite some scatter; however, it has to be kept in mind that for tracing the anisotropy of the N chemical shift in aluminum nitride, we are attempting to extract variations of the order of Hz from resonance lines with fwhm kHz. Despite the scatter, about two thirds of all data points belong to the CS tensor fit function within the error margins of ppm. The resulting isotropic chemical shift ppm is in good agreement with the previously reported value of ppm [4], determined from a polycrystalline powder sample under MAS and referenced to an aqueous (NH)SO solution, with a ’NH’ solution resonance shifted ppm relative to the ’NO’ solution used here [23]. Similar to the quadrupole coupling tensor, the asymmetry of the CS tensor with , as well as the eigenvector orientation follow the symmetry restrictions of the crystal lattice.
3.5. N and Al DFT Calculations
It has become customary within the solid-state NMR community to augment experimental results by comparing them to predictions derived from calculations using density functional theory (DFT) methods employing periodic plane waves [24]. To check how the quadrupolar coupling constants for Al and N derived from our precise single-crystal results compare to DFT predictions, we have performed such calculations for aluminum nitride, using the CASTEP code, see Section 4.3 for computational details. Table 3 shows the quadrupolar coupling constants determined by DFT calculations using the coordinates from X-ray diffraction data reported in the inorganic crystal structure database (ICSD) for a selection of different database entries. The variation of these entries concerns mostly the unit cell dimensions (see also below about geometry optimization), which is reflected in the varying unit cell volumes listed in the table. On the left of Table 3, the calculation results are given from directly using the ICSD coordinates, the so-called single-point energy (SPE). We note that for this calculation mode, the DFT algorithm returns values within a wide scatter, mirrored by standard deviations of 37% for Al and 73% for N. Whereas a single structure might accidentally give numbers for that are practically identical to the experiment, as structure ICSD 34475 does here for AlN, a more systematic exploration would demand to take the arithmetic mean of the eight different structures. These mean values, Al MHz and N kHz are very far from the experimentally determined values of MHz and kHz, with the absolute sign of not being available from the experiments.
Table 3.
Quadrupolar coupling constant for Al and N in aluminum nitride, as determined from DFT calculations with the CASTEP code. Calculations were run using the atomic coordinates of the reported crystal structures directly (single-point energy—SPE), and after geometry optimization (GO) of the unit cell.
It is however well documented in the literature that in order to obtain good agreement between DFT and experimental results, a geometry optimization (GO) of the crystal structure is usually necessary [31,32,33]. This was also done for AlN, taking the coordinates of the previously used ICSD database entries as a starting point. It should be noted that for AlN, only the unit cell parameters may be geometry optimized, since both aluminum and nitrogen atoms are situated on a crystallographic special position, Wyckoff position . As may be seen from the entries on the right in Table 3, the values are practically independent from the starting point after energy optimization, with a mean of Al MHz and N kHz. This leads to small standard deviations (0.1% for Al and 17% for N), which seem to imply a high accuracy of the DFT results. However, the small standard deviations of the GO calculations reflect only on a high precision of the computational algorithm. The accuracy of calculation results is defined by comparison to the experiment [34], and is therefore quite low, since both experimental values (especially that of N) are outside the standard deviation of the high-precision values.
4. Materials and Methods
4.1. Aluminum Nitride
The single crystal of aluminum nitride shown in Figure 1a was grown at IKZ, using physical vapor transport of bulk AlN in a TaC crucible with radio frequency induction heating. Further details may be found in Reference [8].
4.2. Solid-State NMR Spectroscopy
Single-crystal NMR spectra were acquired on a BRUKER Avance-III 400 spectrometer at MPI-FKF Stuttgart, at a Larmor frequency of MHz, and MHz, using a goniometer probe with a 6 mm solenoid coil, built by NMR Service GmbH (Erfurt, Germany). The Al spectra were recorded with single-pulse acquisition, four scans and a relaxation delay of 20 s. For the N spectra a spin–echo sequence [35] was employed to minimize baseline roll and the spectra were recorded with 16 scans and a relaxation delay of 300 s. All spectra were referenced to a dilute Al(NO) solution at 0 ppm. The fit of the rotation pattern and deconvolution of the 14N spectra were performed with the program IGOR PRO 7 from WaveMetrics Inc., which delivers excellent non-linear fitting performance.
4.3. DFT Calculations
All calculations were run with the CASTEP density functional theory (DFT) code [36] integrated within the BIOVIA Materials Studio 2017 suite, using the GIPAW algorithm [37]. The computations use the generalized gradient approximation (GCA) and Perdew–Burke–Ernzerhof (PBE) functional [38], with the core-valence interactions described by ultra-soft pseudopotentials [37]. Integrations over the Brillouin zone were done using a Monkhorst–Pack grid [39] of , with a reciprocal spacing of at least 0.025 Å. The convergence of the calculated NMR parameters was tested for both the size of a Monkhorst–Pack k-grid and a basis set cut-off energy, with the cut-off energy being 1500 eV. Also, the possible contribution of pairwise dispersion interactions was checked by using the Tkatchenko–Scheffler method [40] as implemented in CASTEP, but no improvements were observed. The calculation results reported here therefore do not include dispersion interaction.
Geometry optimization (GO) calculations were performed using the Broyden–Fletcher- Goldfarb–Shanno (BFGS) algorithm [41], with the same functional, k-grid spacings and cut-off energies as in the single-point energy (SPE) calculations. Convergence tolerance parameters for geometry optimization were as follows: maximum energy 2.0 × 10 eV/atom, maximum force 0.001 eV/Å, maximum stress 0.01 GPa/atom, and maximum displacement in a step 0.002 Å. Crystallographic data used in the calculations were taken from literature listed in Table 3.
5. Conclusions
In this work, both the chemical shift and quadrupole coupling tensors for Al and N in aluminum nitride have been determined to high precision by single-crystal NMR spectroscopy. To this end, a homoepitaxially grown AlN single crystal with known morphology was used, which allowed the rotation axis to be determined by optical alignment. Because of the high symmetry of wurtzite-type AlN, one full rotation pattern was sufficient to determine the NMR-interaction tensors in the crystal frame. The three-fold rotation axis on which both atom types are located enforces colinearity of the tensor eigenvectors with the crystallographic coordinate system, which simplifies data analysis. A simultaneous fit for the ST(3/2) and ST(5/2) splittings of Al gave the quadrupolar coupling constant MHz, and fitting the N doublet splitting resulted in kHz. To extract the chemical shift tensor for Al, the evolution of the central transition over the crystal rotation was tracked, and the contribution of the second-order quadrupolar shift was subtracted according to the previously determined quadrupolar coupling tensor. A fit over the thus corrected central transition positions resulted in an isotropic chemical shift of ppm and an reduced anisotropy of ppm. Due to the small quadrupolar moment of N, its second-order quadrupolar shift in AlN is negligible, and the chemical shift tensor was directly fitted from the evolution of the N doublet centers over the rotation angle. The resulting isotropic chemical shift is ppm and the reduced anisotropy is ppm.
For comparison, the quadrupolar coupling parameters of N and Al were also calculated using the CASTEP DFT code for a variety of previously reported X-ray structures. For both calculation strategies, i.e., single-point energy (SPE, where the coordinates are directly taken from XRD), and structures which were geometry optimized (GO) by the DFT code, agreement with the experimental values was relatively poor, leaving room for further improvement of these computational methods.
Author Contributions
Conceptualization, O.E.O.Z., C.H., S.I., and T.B.; methodology, O.E.O.Z., I.L.M., S.I., and T.B.; formal analysis, O.E.O.Z. and I.L.M..; investigation, O.E.O.Z., I.L.M., S.I. and T.B.; resources, I.L.M., C.H., S.I. and T.B.; writing—original draft preparation, O.E.O.Z. and T.B.; writing—review and editing, O.E.O.Z., I.L.M., C.H., S.I., and T.B.; visualization, O.E.O.Z., C.H., S.I.; supervision, T.B. All authors have read and agreed to the published version of the manuscript.
Funding
This research received no external funding.
Acknowledgments
O.E.O.Z. and T.B. would like to thank Wolfgang Schnick (University of Munich, LMU) for continuing financial support.
Conflicts of Interest
The authors declare no conflict of interest.
References
- Strite, S.; Morkoç, H. GaN, AlN, and InN: A review. J. Vac. Sci. Technol. B 1992, 10, 1237–1266. [Google Scholar] [CrossRef]
- Jack, K.H. Sialons and related nitrogen ceramics. J. Mater. Sci. 1976, 11, 1135–1158. [Google Scholar] [CrossRef]
- MacKenzie, K.J.D. Applications of solid state NMR spectroscopy to ceramic research. Br. Ceram. Trans. 2000, 99, 231–240. [Google Scholar] [CrossRef]
- Bräuniger, T.; Kempgens, P.; Harris, R.K.; Howes, A.P.; Liddell, K.; Thompson, D.P. A combined 14N/27Al nuclear magnetic resonance and powder X-ray diffraction study of impurity phases in β-sialon ceramics. Solid State Nucl. Magn. Reson. 2003, 23, 62–76. [Google Scholar] [CrossRef]
- Cozzan, C.; Griffith, K.J.; Laurita, G.; Hu, J.G.; Grey, C.P.; Seshradi, R. Structural evolution and atom clustering in β-SiAlON: β-Si6-zAlzOzN8-z. Inorg. Chem. 2017, 56, 2153–2158. [Google Scholar] [CrossRef] [PubMed]
- Man, P.P. Cartesian and Spherical Tensors in NMR Hamiltonians. Concepts Magn. Reson. A 2013, 42, 197–244. [Google Scholar] [CrossRef]
- Xu, Y.; Bryce, D.L. SCFit: Software for single-crystal spin-echo Fourier transform NMR of 39K and 67Zn salts at high field. Solid State Nucl. Magn. Reson. 2019, 102, 53–62. [Google Scholar] [CrossRef]
- Hartmann, C.; Wollweber, J.; Sintonen, S.; Dittmar, A.; Kirste, L.; Kollowa, S.; Irmscher, K.; Bickermann, M. Preparation of deep UV transparent AlN substrates with high structural perfection for optoelectronic devices. CrystEngComm 2016, 18, 3488–3497. [Google Scholar] [CrossRef]
- Schulz, H.; Thiemann, K.H. Crystal structure refinement of AlN and GaN. Solid State Commun. 1977, 23, 815–819. [Google Scholar] [CrossRef]
- Momma, K.; Izumi, F. VESTA 3 for three-dimensional visualization of crystal, volumetric and morphology data. J. Appl. Cryst. 2011, 44, 1272–1276. [Google Scholar] [CrossRef]
- Laws, D.D.; Bitter, H.-M.L.; Jerschow, A. Solid-State NMR Spectroscopic Methods in Chemistry. Angew. Chem. Int. Ed. 2002, 41, 3096–3129. [Google Scholar] [CrossRef]
- Cohen, M.H.; Reif, F. Quadrupole Effects in Nuclear Magnetic Resonance Studies of Solids. Solid State Phys. 1957, 5, 321–438. [Google Scholar]
- Zeman, O.E.O.; Hoch, C.; Hochleitner, R.; Bräuniger, T. NMR interaction tensors of 51V and 207Pb in vanadinite, Pb5(VO4)3Cl, determined from DFT calculations and single-crystal NMR measurements, using only one general rotation axis. Solide State Nucl. Magn. Reson. 2018, 89, 11–20. [Google Scholar] [CrossRef] [PubMed]
- Haeberlen, U. High Resolution NMR in Solids: Selective Averaging. In Advances in Magnetic Resonance; Waugh, J., Ed.; Academic Press: New York, NY, USA, 1976; ISBN 0-12-025561-8. [Google Scholar]
- Vosegaard, T.; Jakobsen, H.J. 27Al Chemical Shielding Anisotropy. J. Magn. Reson. 1997, 128, 135–137. [Google Scholar] [CrossRef]
- Bräuniger, T.; Groh, B.; Moudrakovski, I.L.; Indris, S. Local Electronic Structure in γ-LiAlO2 Studied by Single-Crystal 27Al NMR and DFT Calculations. J. Phys. Chem. A 2016, 120, 7839–7846. [Google Scholar] [CrossRef]
- Samoson, A. Satellite Transition High-Resolution NMR of Quadrupolar Nuclei In Powders. Chem. Phys. Lett. 1985, 119, 29–32. [Google Scholar] [CrossRef]
- Weil, J.A.; Anderson, J.H. Determination of the g Tensor in Paramagnetic Resonance. J. Chem. Phys. 1958, 28, 864–866. [Google Scholar] [CrossRef]
- Silver, A.H.; Kushida, T.; Lambe, J. Nuclear Magnetic Dipole Coupling in Al2O3. Phys. Rev. 1962, 125, 1147–1149. [Google Scholar] [CrossRef]
- Bastow, T.J.; Massiot, D.; Coutures, J.P. 14N NMR in AlN and BN. Solide State Nucl. Magn. Reson. 1998, 10, 241–245. [Google Scholar] [CrossRef]
- Czernek, J.; Brus, J. Describing the anisotropic 133Cs solid state NMR interactions in cesium chromate. Chem. Phys. Lett. 2017, 684, 8–13. [Google Scholar] [CrossRef]
- Pyykkö, P. Year-2008 nuclear quadrupole moments. Mol. Phys. 2008, 106, 1965–1974. [Google Scholar] [CrossRef]
- Healy, M.A.; Morris, A. Reference compounds for 14N nuclear magnetic resonance; the relative chemical shifts of aqueous nitrate ion and nitromethane. Spectrochim. Acta 1974, 31A, 1695–1697. [Google Scholar] [CrossRef]
- Charpentier, T. The PAW/GIPAW approach for computing NMR parameters: A new dimension added to NMR study of solids. Solid State Nucl. Magn. Reson. 2011, 40, 1–20. [Google Scholar] [CrossRef] [PubMed]
- Jeffrey, G.A.; Parry, G.S.; Mozzi, R.L. Study of the wurtzite-type binary compounds. I. Structures of aluminum nitride and beryllium oxide. J. Chem. Phys. 1956, 25, 1024–1031. [Google Scholar] [CrossRef]
- Paszkowicz, W.; Podsiadlo, S.; Minikayev, R. Rietveld-refinement study of aluminium and gallium nitrides. J. Alloy. Compd. 2004, 382, 100–106. [Google Scholar] [CrossRef]
- Kanhe, N.S.; Nawale, A.B.; Gawade, R.L.; Puranik, V.G.; Bhoraskar, S.V.; Das, A.K.; Mathe, V.L. Understanding the growth of micro and nano-crystalline AlN by thermal plasma process. J. Cryst. Growth 2012, 339, 36–45. [Google Scholar] [CrossRef]
- Wang, J.; Zhao, M.; Jin, S.F.; Li, D.D.; Yang, J.W.; Hu, W.J.; Wang, W.J. Debye temperature of wurtzite AlN determined by X-ray powder diffraction. Powder Differ. 2014, 29, 352–355. [Google Scholar] [CrossRef]
- Yin, L.-J.; Zhang, S.-H.; Wang, H.; Jian, X.; Wang, X.; Xu, X.; Liu, M.-Z.; Fang, C.-M. Direct observation of Eu atoms in AlN lattice and the first-principles simulations. J. Am. Ceram. Soc. 2019, 102, 310–319. [Google Scholar] [CrossRef]
- Nakahigashi, K.; Ishibashi, H.; Minamigawa, S. Electron density distribution in AlN from powder X-ray diffraction data by the maximum-entropy method. J. Phys. Chem. Solids 1993, 54, 445–452. [Google Scholar] [CrossRef]
- Body, M.; Silly, G.; Legein, C.; Buzare, J.-Y.; Calvayrac, F.; Blaha, P. 27Al NMR experiments and quadrupolar parameter ab initio calculations: Crystallographic structure refinement of β-Ba3AlF9. Chem. Phys. Lett. 2006, 424, 321–326. [Google Scholar] [CrossRef]
- Cuny, J.; Messaoudi, S.; Alonzo, V.; Furet, E.; Halet, J.-F.; Le Fur, E.; Ashbrook, S.E.; Pickard, C.J.; Gautier, R.; Le Pollès, L. DFT calculations of quadrupolar solid-state NMR properties: Some examples on solid-state inorganic chemistry. J. Magn. Reson. 2008, 29, 2279–2287. [Google Scholar] [CrossRef] [PubMed]
- Chandran, C.V.; Cuny, J.; Gautier, R.; Le Pollès, L.; Pickard, C.J.; Bräuniger, T. Improving sensitivity and resolution of MQMAS spectra: A 45Sc-NMR case study of scandium sulphate pentahydrate. J. Magn. Reson. 2010, 203, 226–235. [Google Scholar] [CrossRef] [PubMed]
- Frank, P. Propagation of Error and the Reliability of Global Air Temperature Projections. Front. Earth Sci. 2019, 7, 223. [Google Scholar] [CrossRef]
- Kunwar, A.C.; Turner, G.L.; Oldfield, E. Solid-state spin-echo Fourier transform NMR of 39K and 67Zn salts at high field. J. Magn. Reson. 1986, 69, 124–127. [Google Scholar] [CrossRef]
- Segall, M.C.; Lindan, P.J.D.; Probert, M.J.; Pickard, C.J.; Hasnip, P.J.; Clark, S.J.; Payne, M.C. First-principles simulations: Ideas, illustrations and the CASTEP code. J. Phys. Condens. Matter 2002, 14, 2717–2744. [Google Scholar] [CrossRef]
- Yates, J.R.; Pickard, C.J.; Mauri, F. Calculation of NMR chemical shifts for extended systems using ultrasoft pseudopotentials. Phys. Rev. B 2007, 76, 024401. [Google Scholar] [CrossRef]
- Perdew, J.P.; Burke, K.; Ernzerhof, M. Generalized gradient approximation made simple. Phys. Rev. Lett. 1996, 77, 3865–3868. [Google Scholar] [CrossRef]
- Monkhorst, H.J.; Pack, J.D. Special points for Brillouin-zone integrations. Phys. Rev. B 1976, 13, 5188–5192. [Google Scholar] [CrossRef]
- Tkatchenko, A.; Scheffler, M. Accurate molecular van der Waals interactions from ground-state electron density and free-atom reference data. Phys. Rev. Lett. 2009, 102, 073005. [Google Scholar] [CrossRef]
- Pfrommer, B.G.; Côté, M.; Louie, S.G.; Cohen, M.L. Relaxation of Crystals with the Quasi-Newton Method. J. Comp. Phys. 1997, 131, 233–240. [Google Scholar] [CrossRef]
Sample Availability: Samples of the compounds are not available from the authors. |
© 2020 by the authors. Licensee MDPI, Basel, Switzerland. This article is an open access article distributed under the terms and conditions of the Creative Commons Attribution (CC BY) license (http://creativecommons.org/licenses/by/4.0/).