
Adsorption Characteristics of Activated Carbon for the Reclamation of Eosin Y and Indigo Carmine Colored Effluents and New Isotherm Model


Abstract
:1. Introduction
2. Results and Discussion
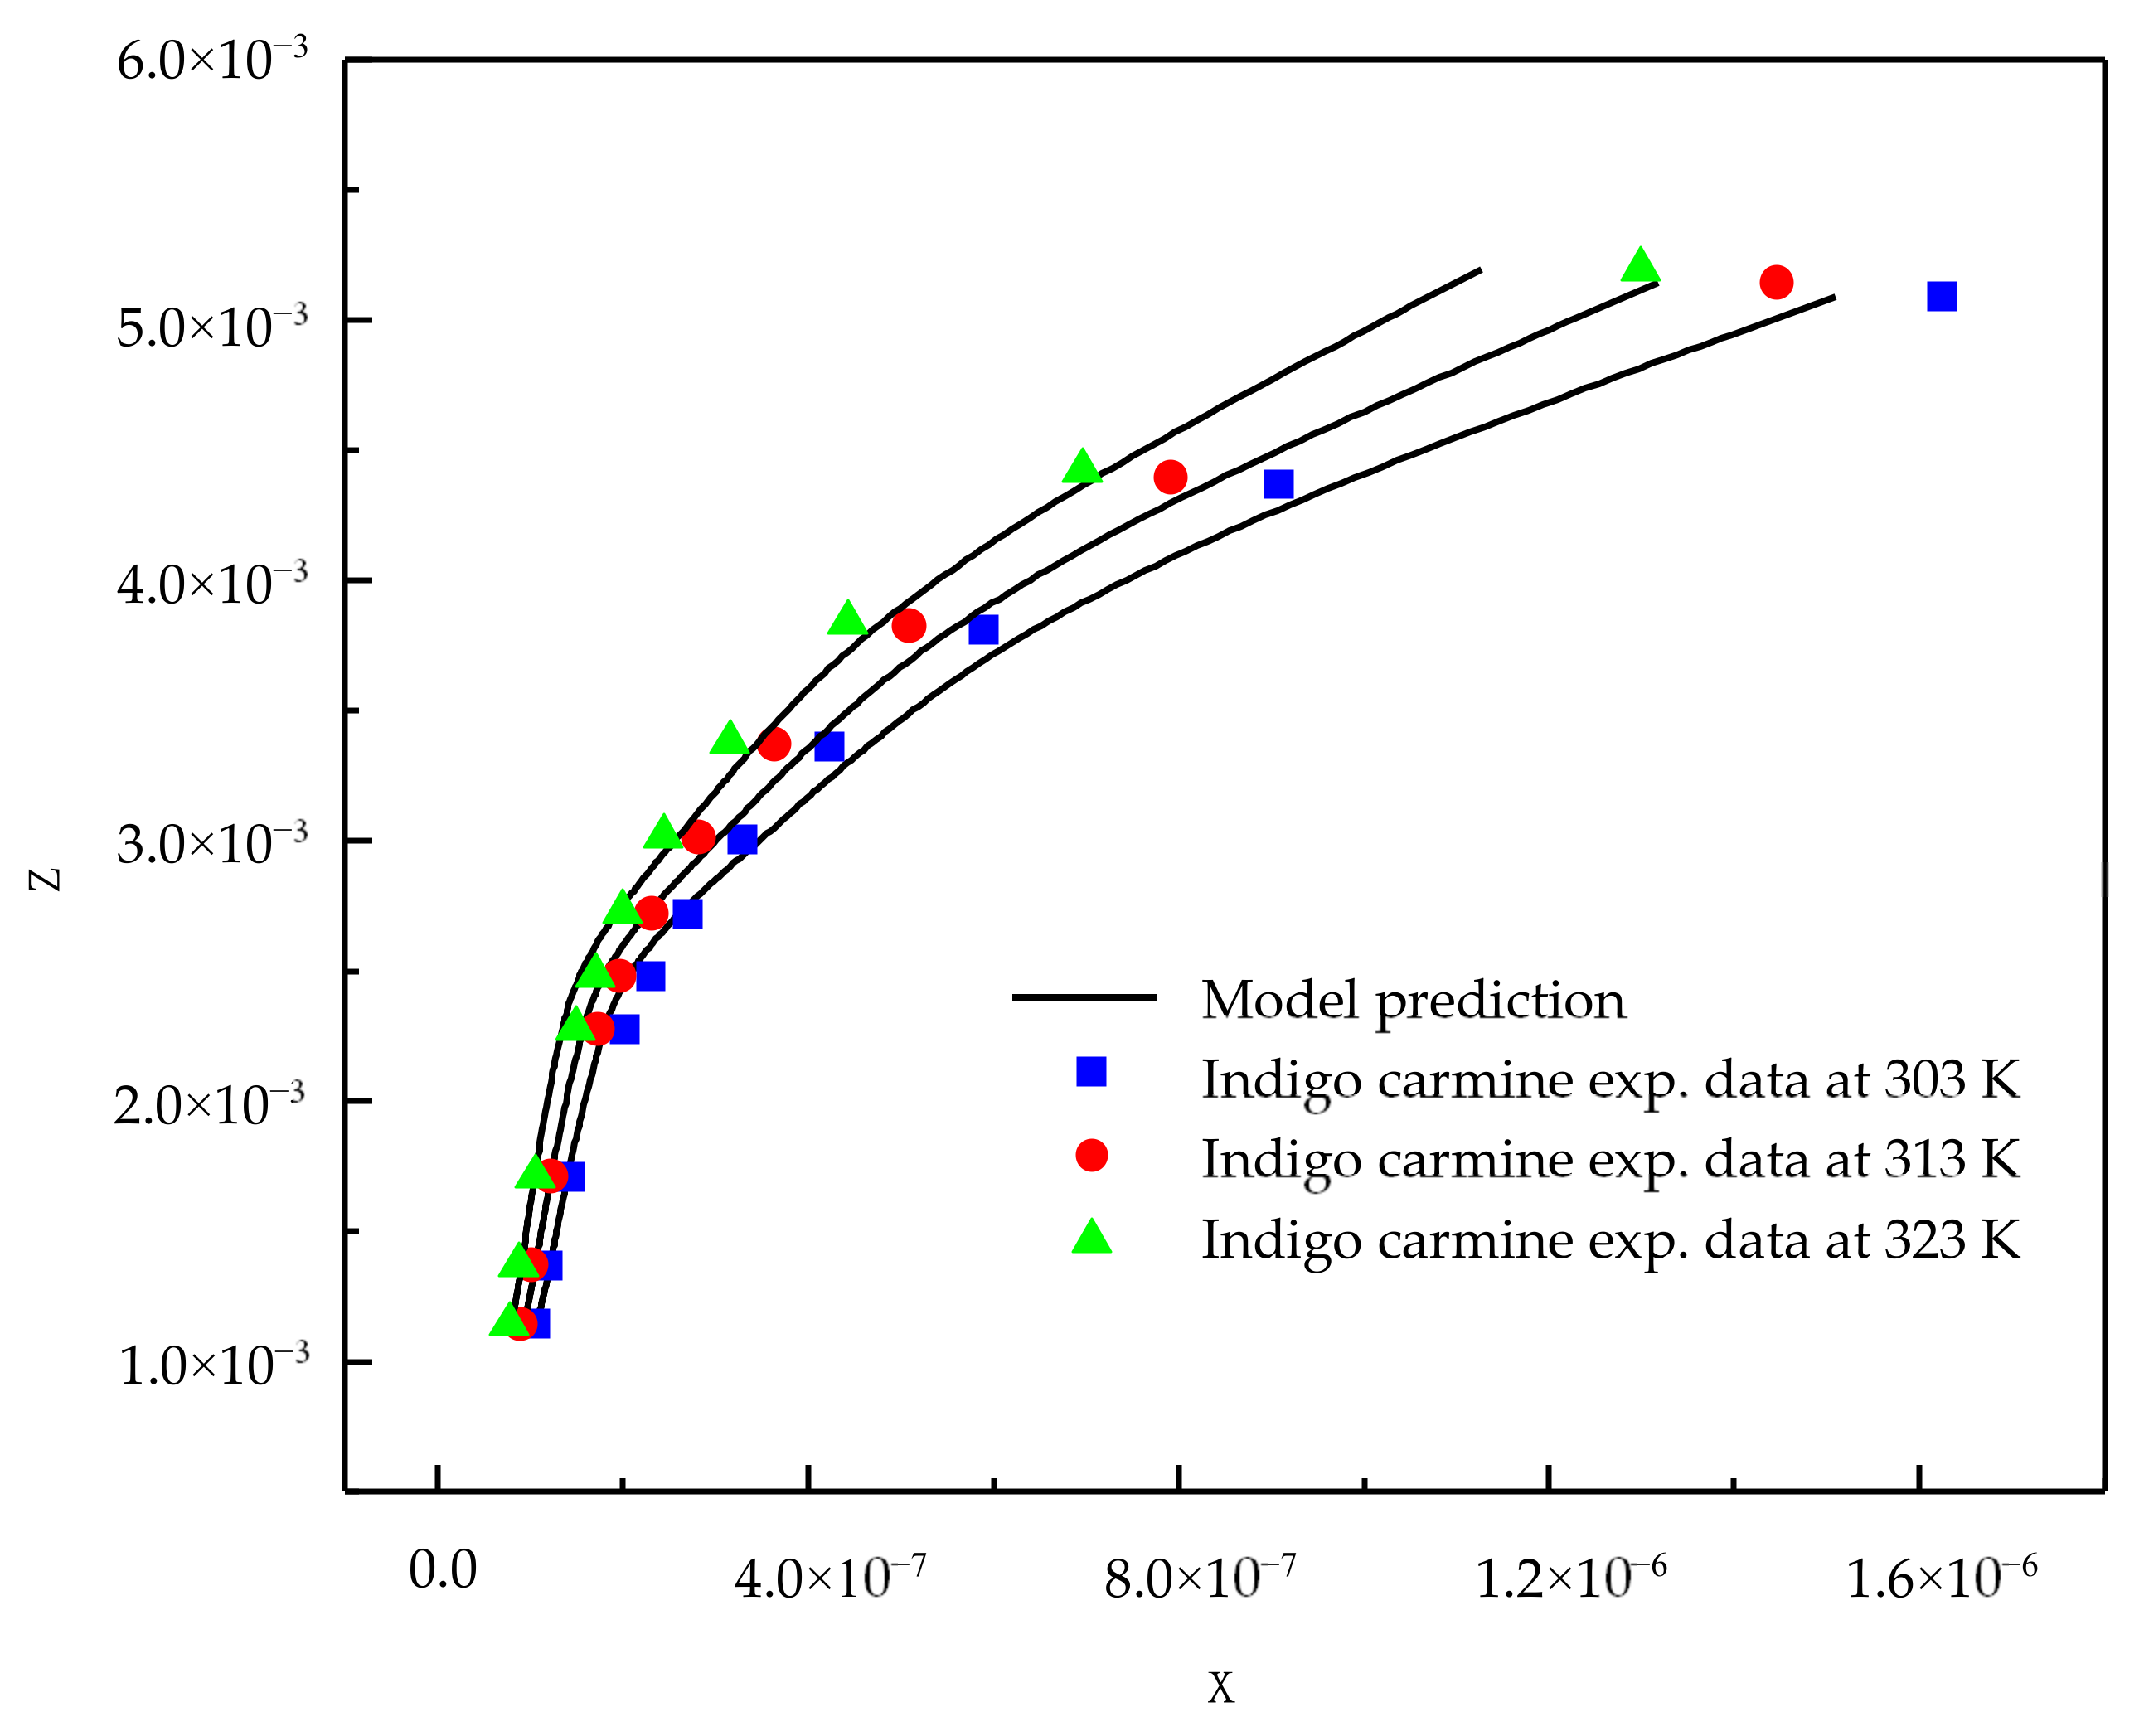
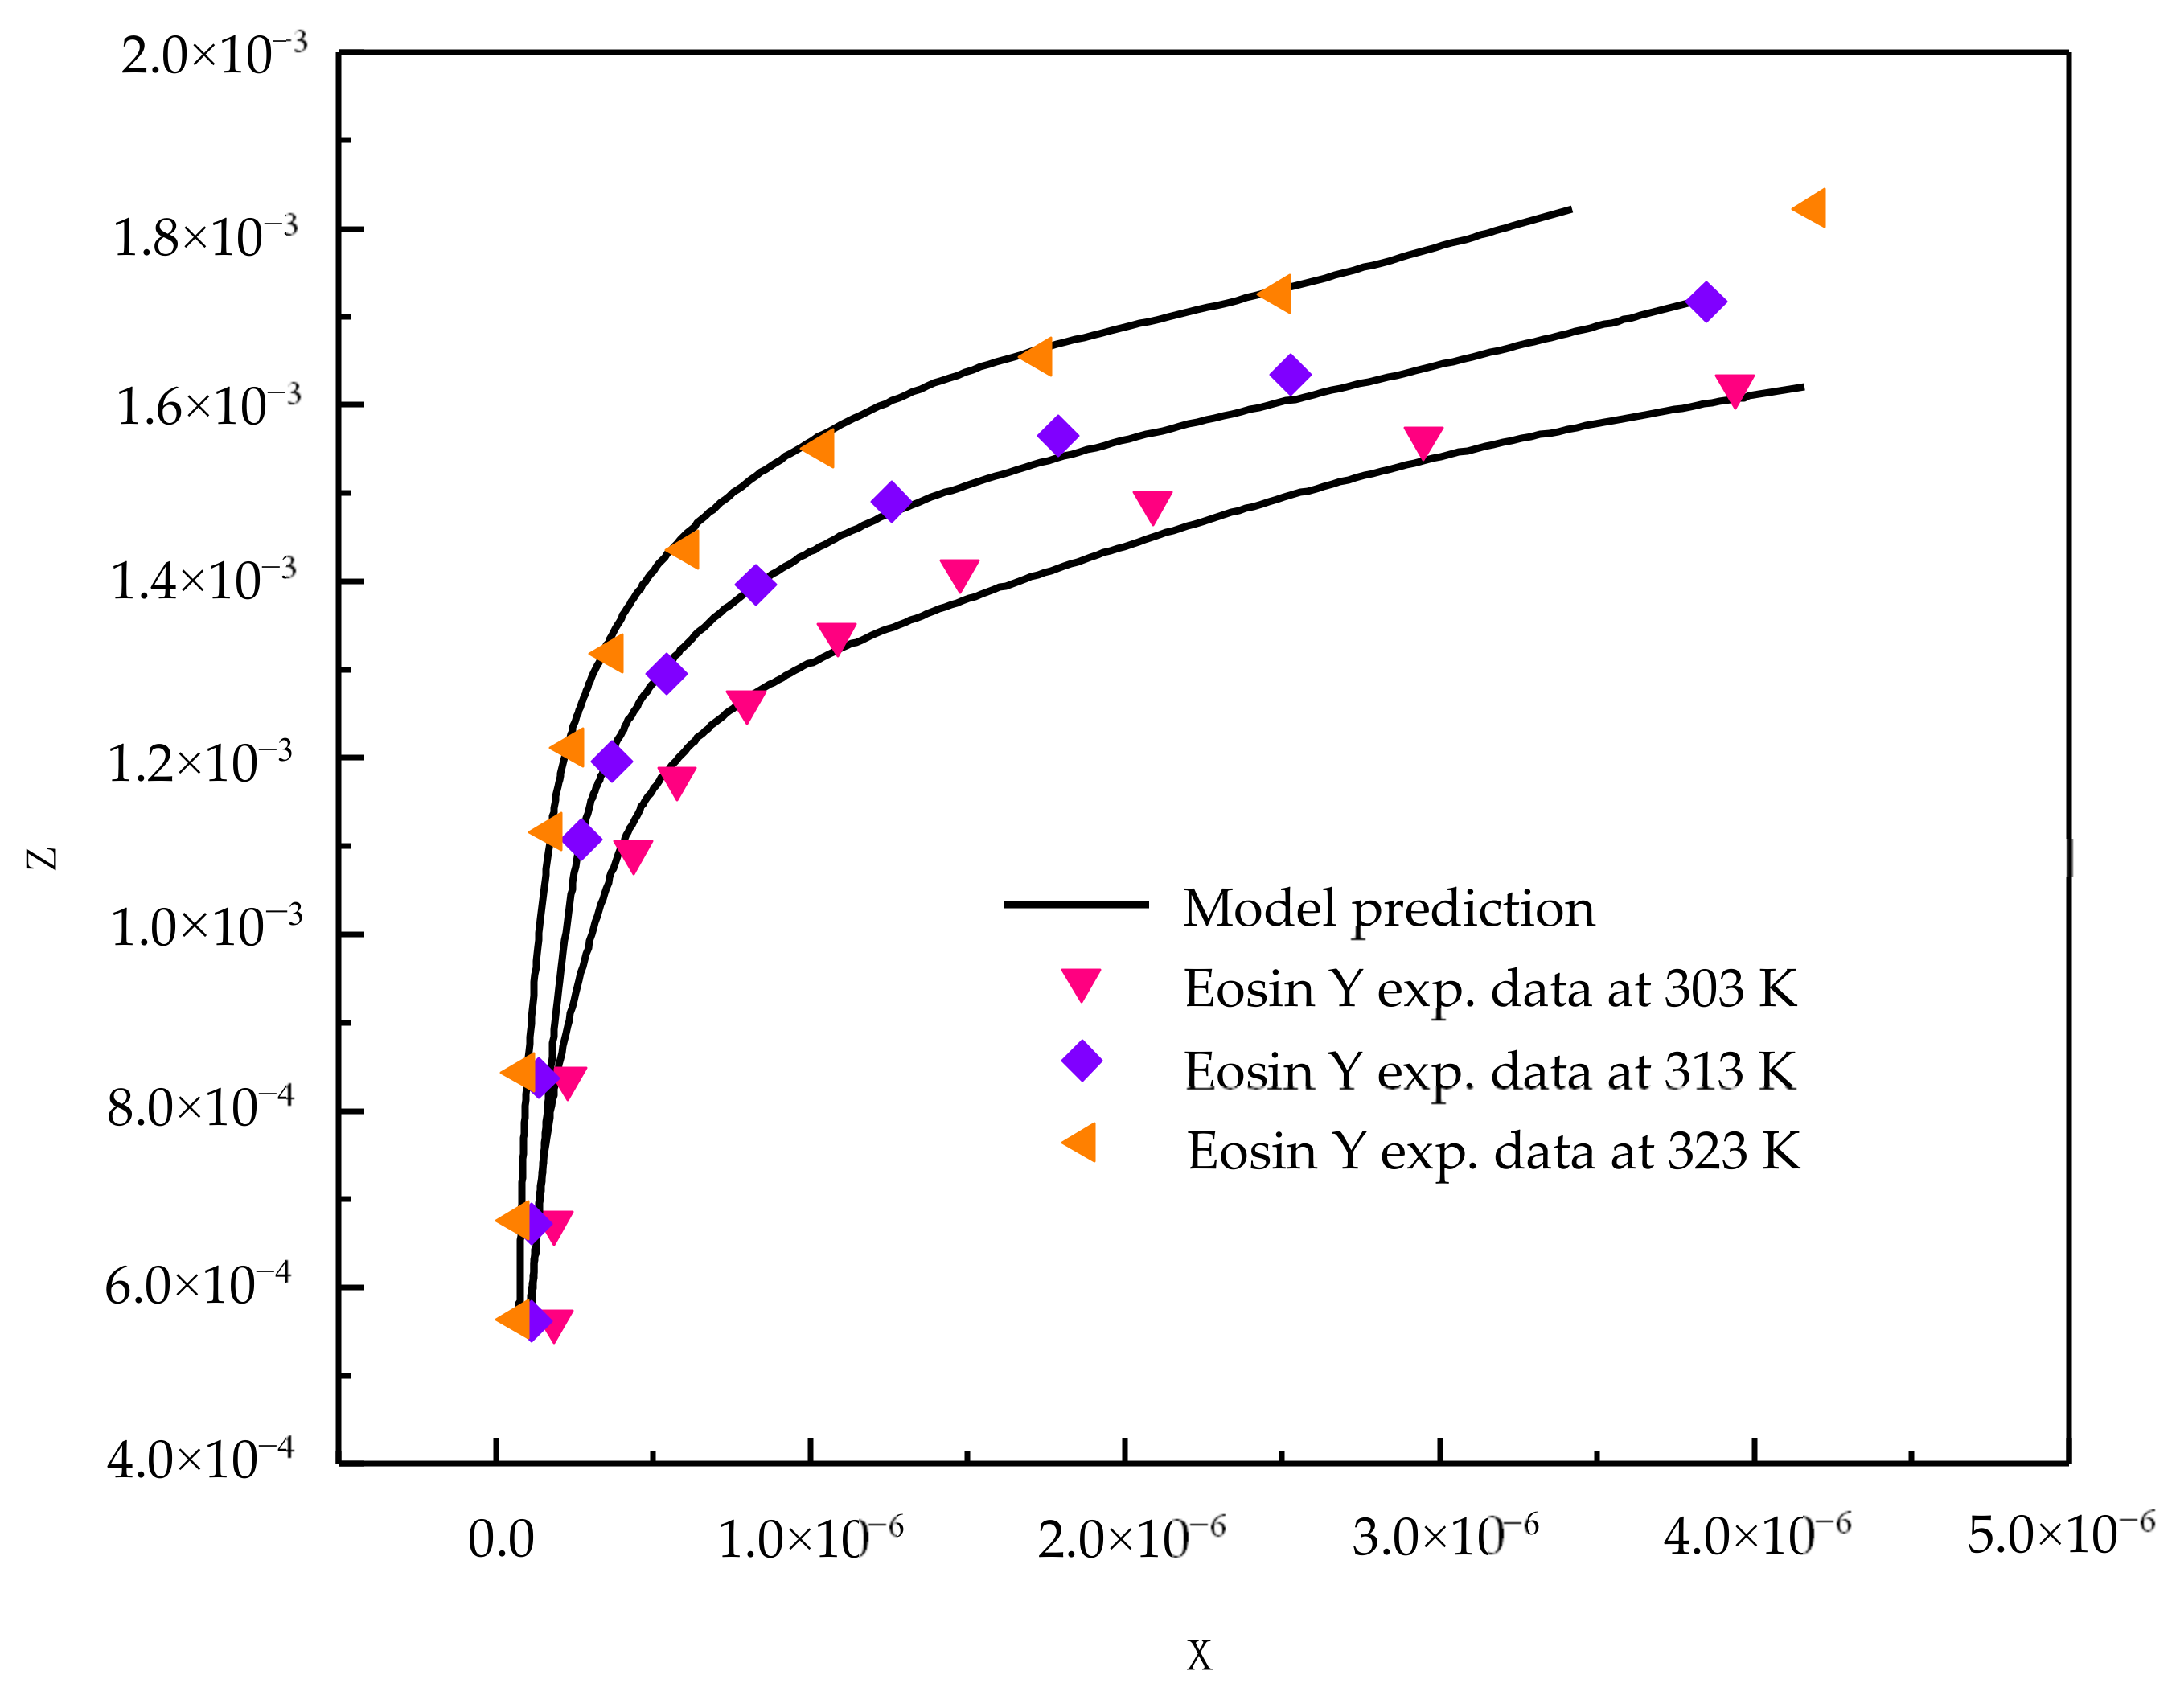
2.1. Model Correlations
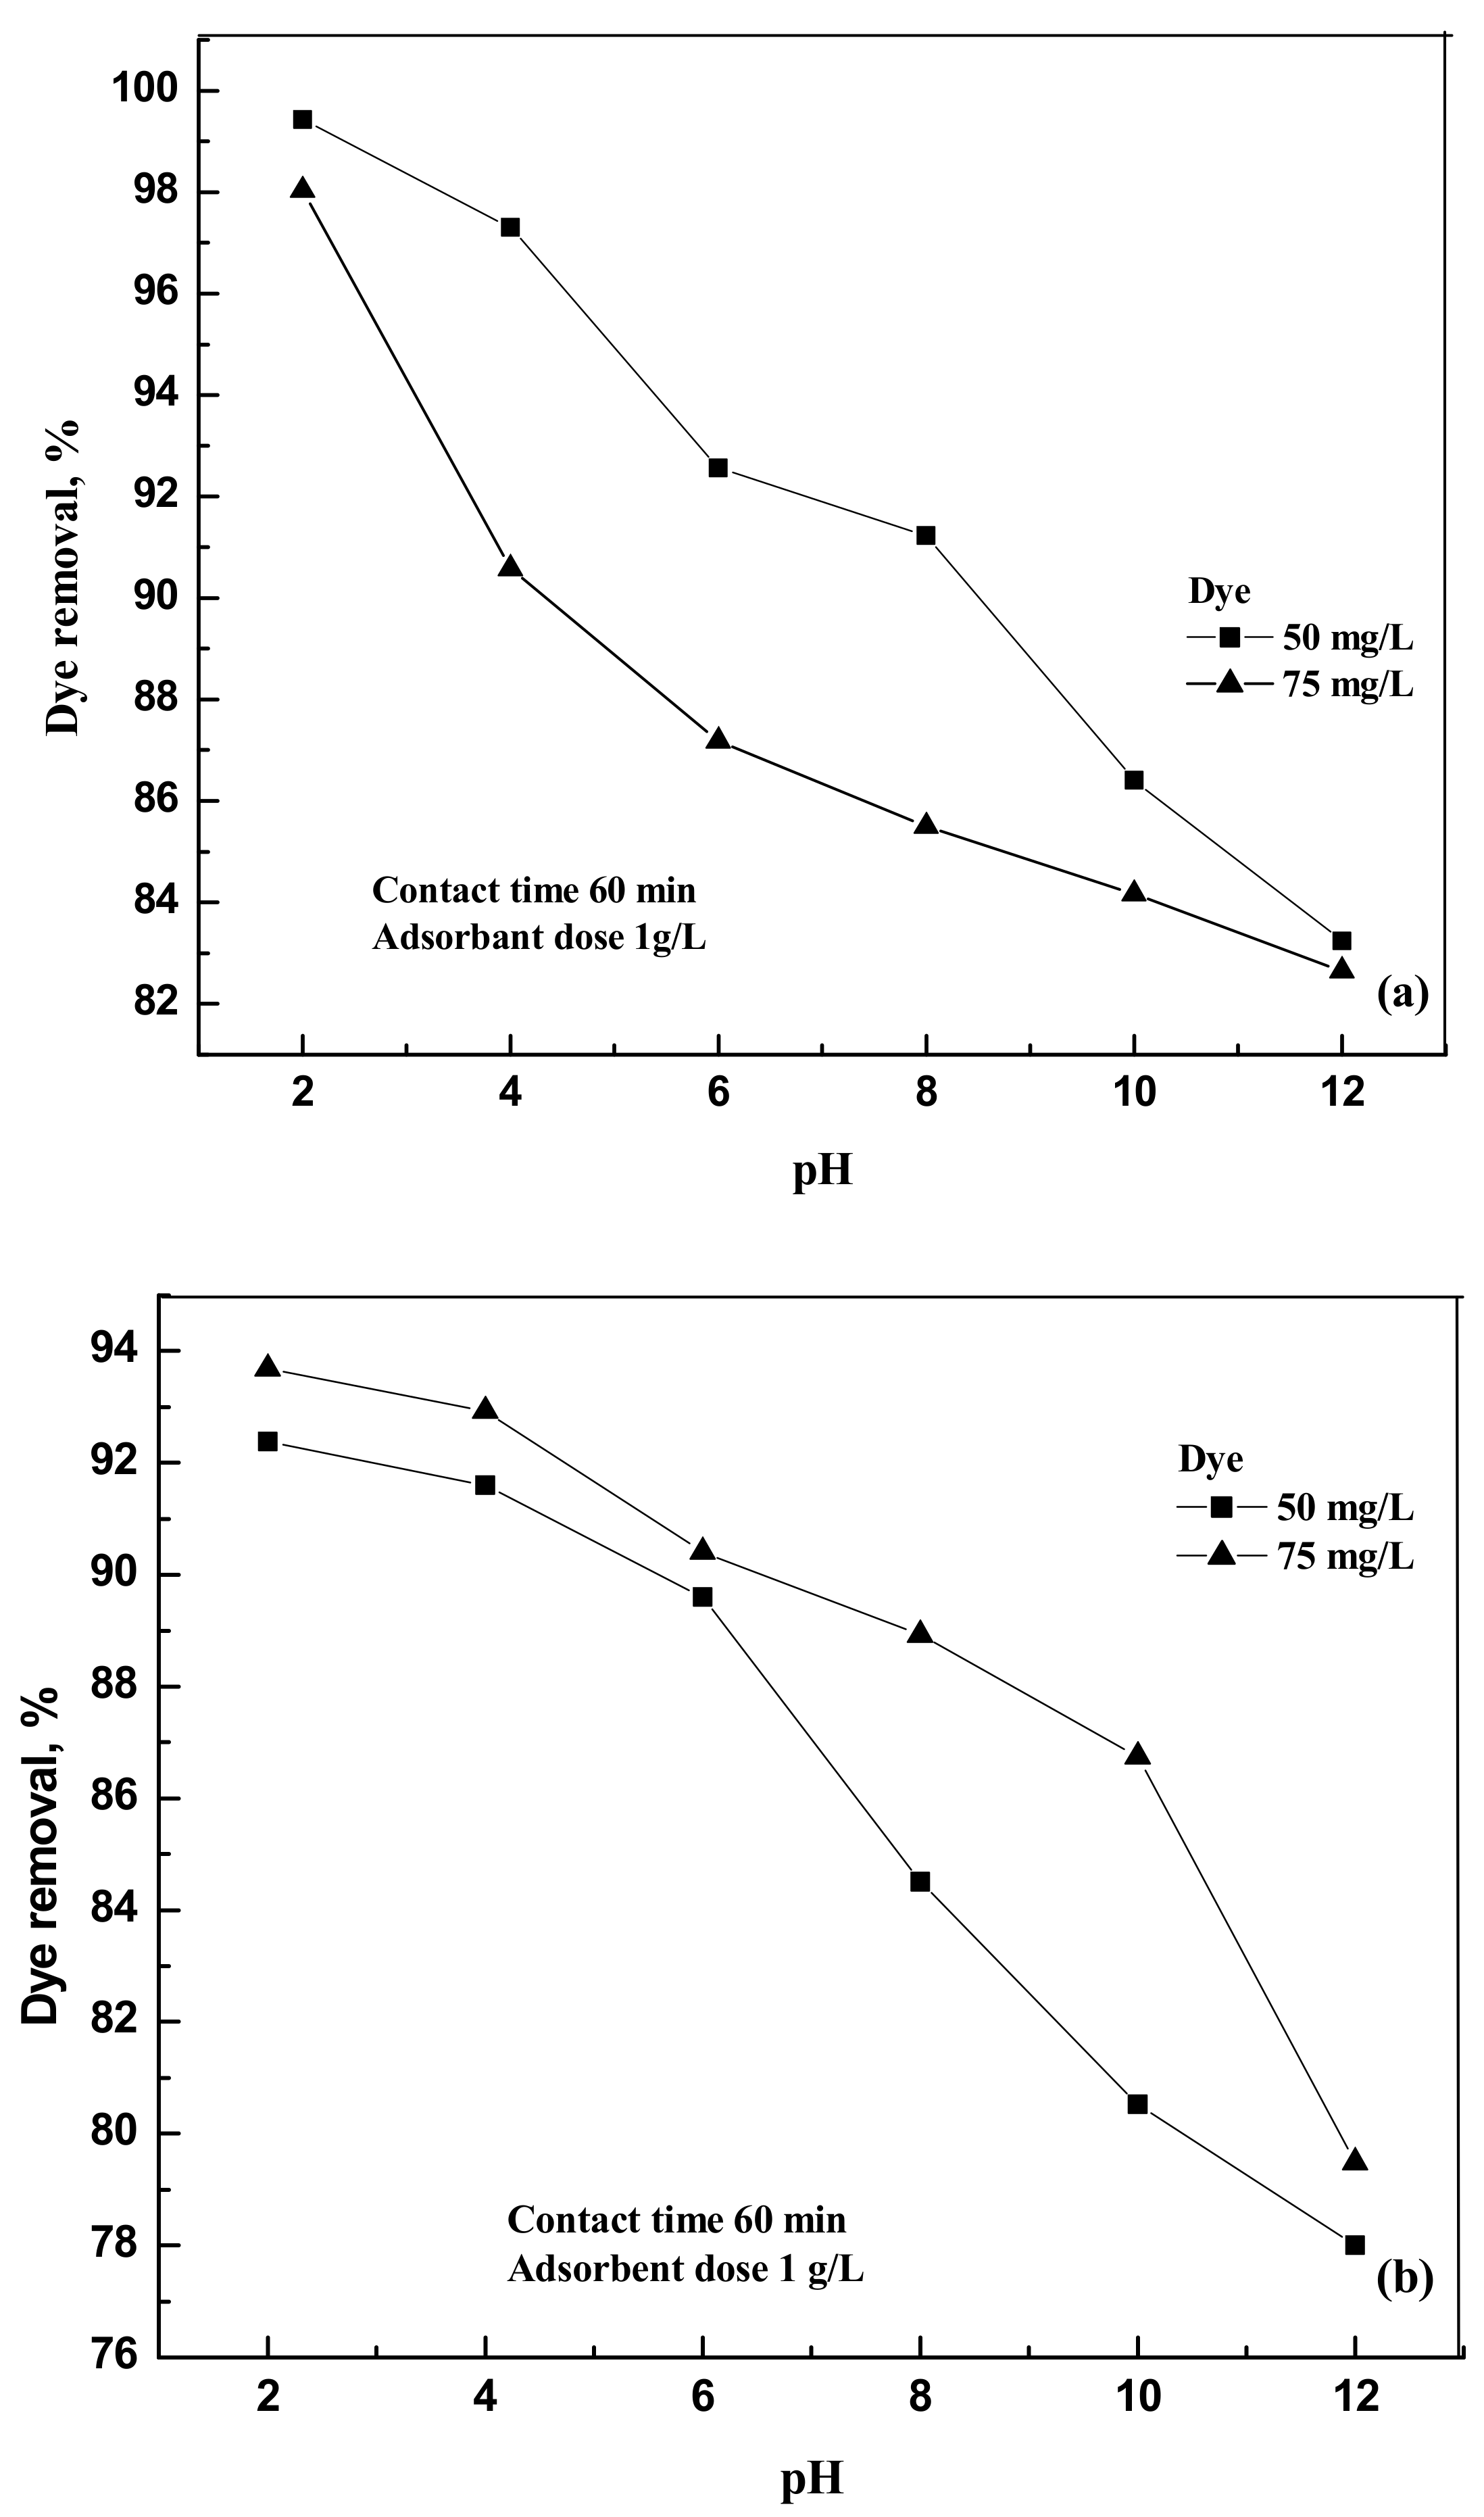
2.2. Effect of pH
2.3. Kinetic Studies
2.4. PseudoFirst Order Kinetic Model
2.5. Pseudo Second Order Kinetic Model
2.6. Intraparticle Diffusion Model
2.7. Thermodynamic Studies
3. Experimental Procedure
3.1. Materials
3.2. Batch Adsorption
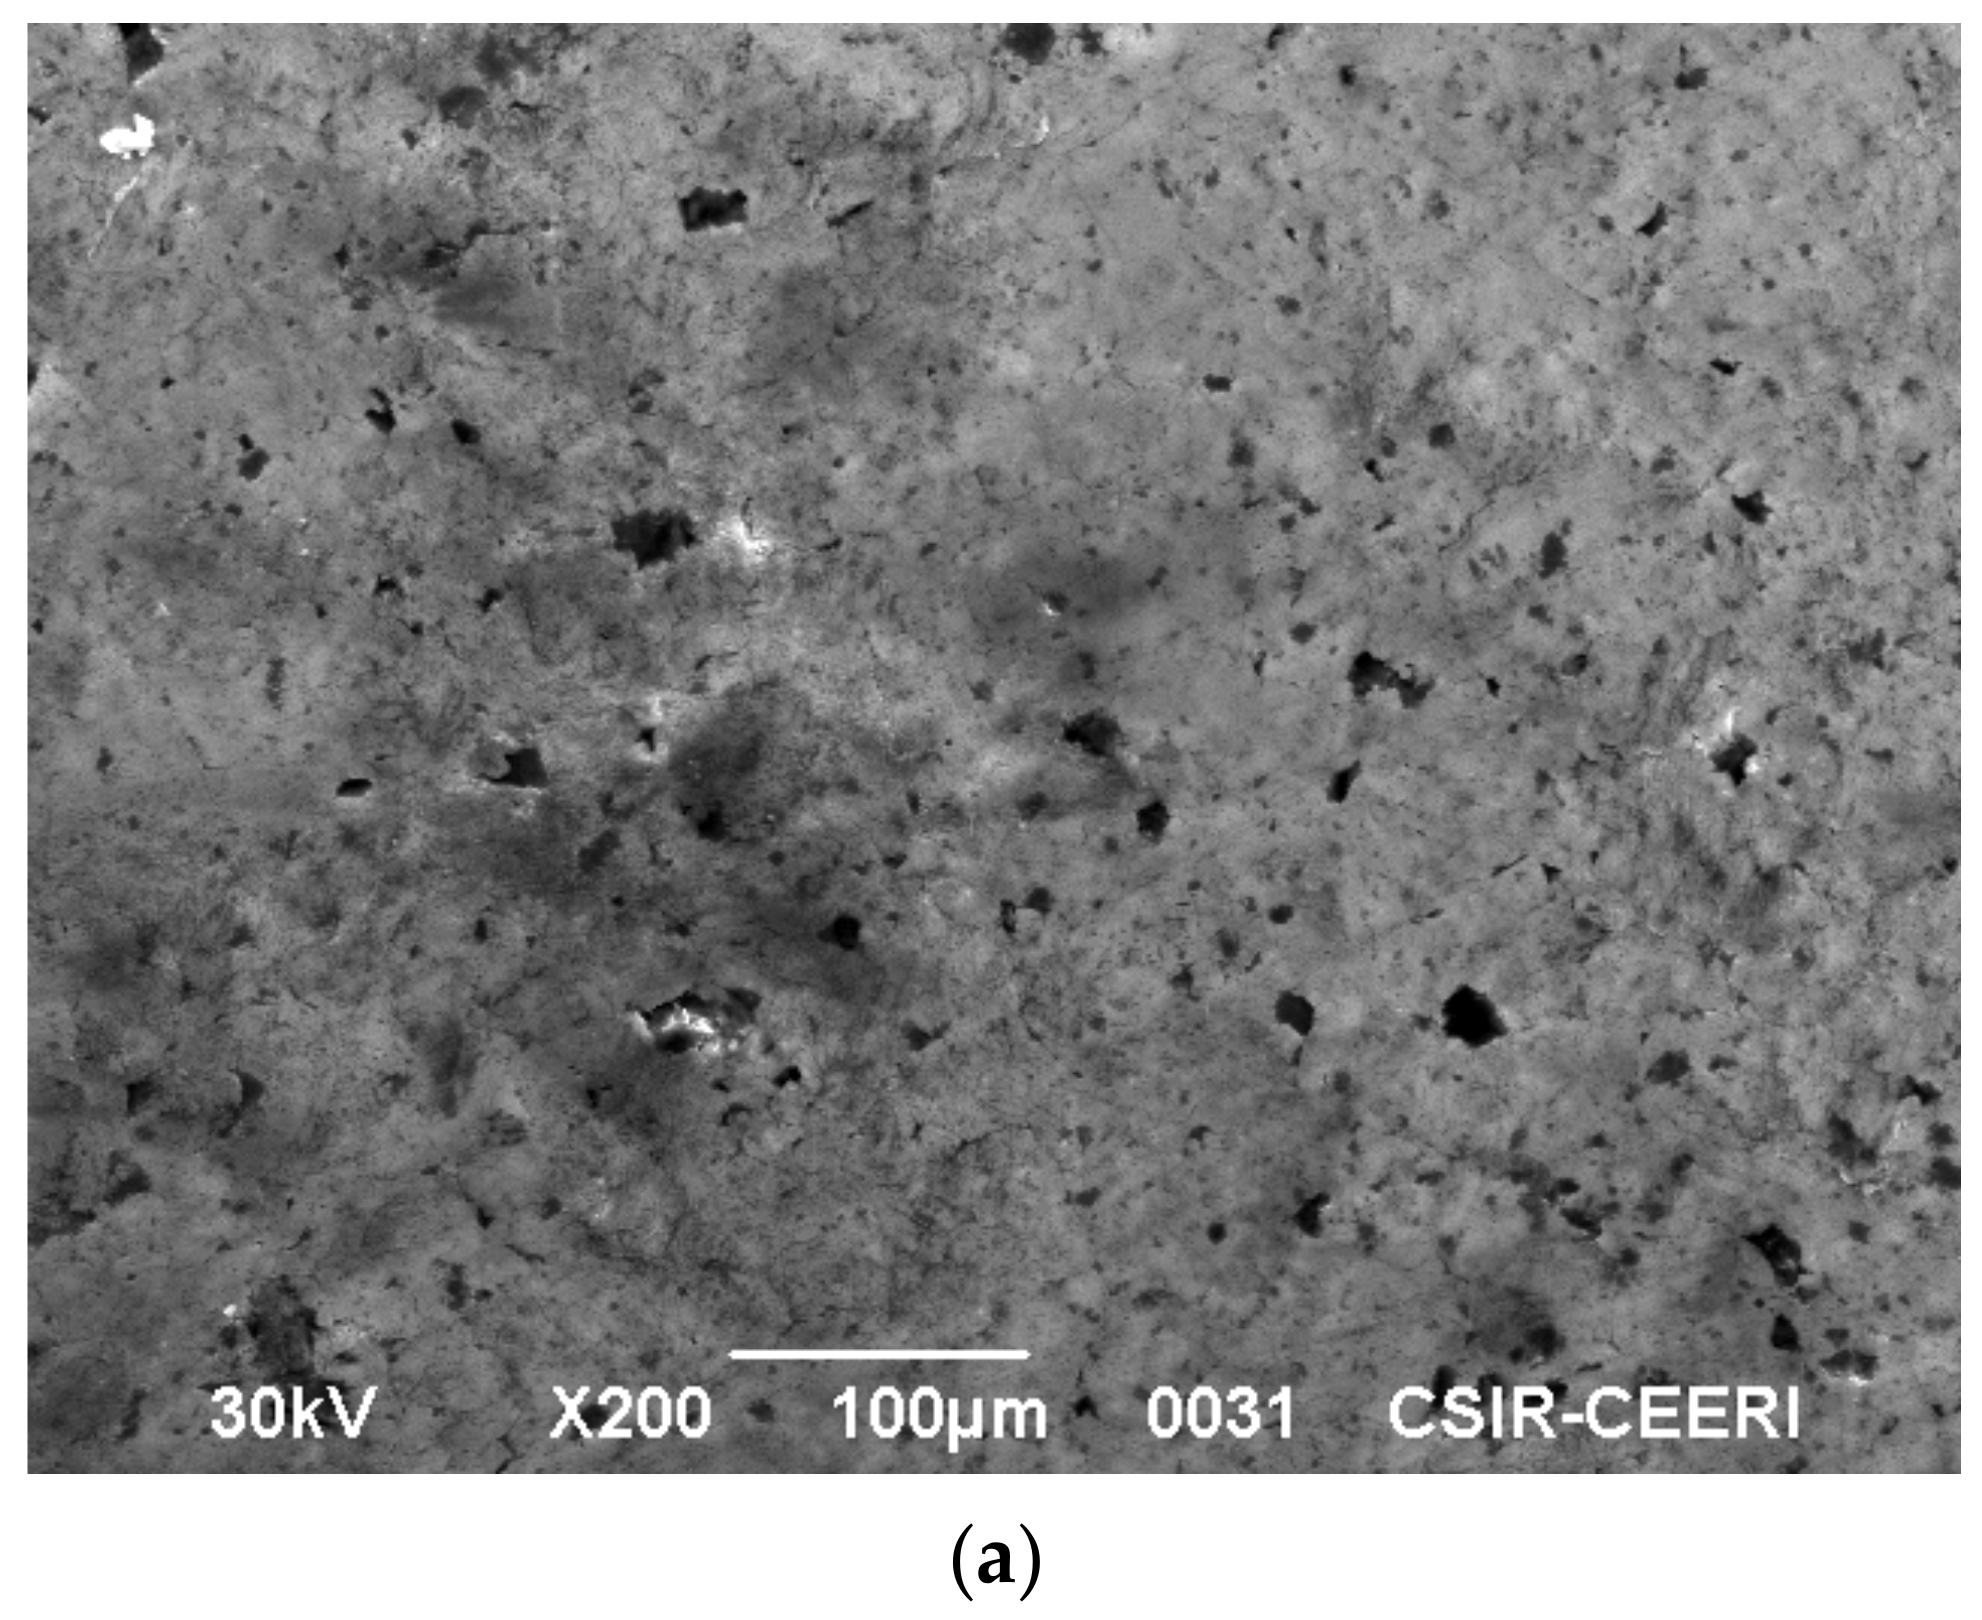
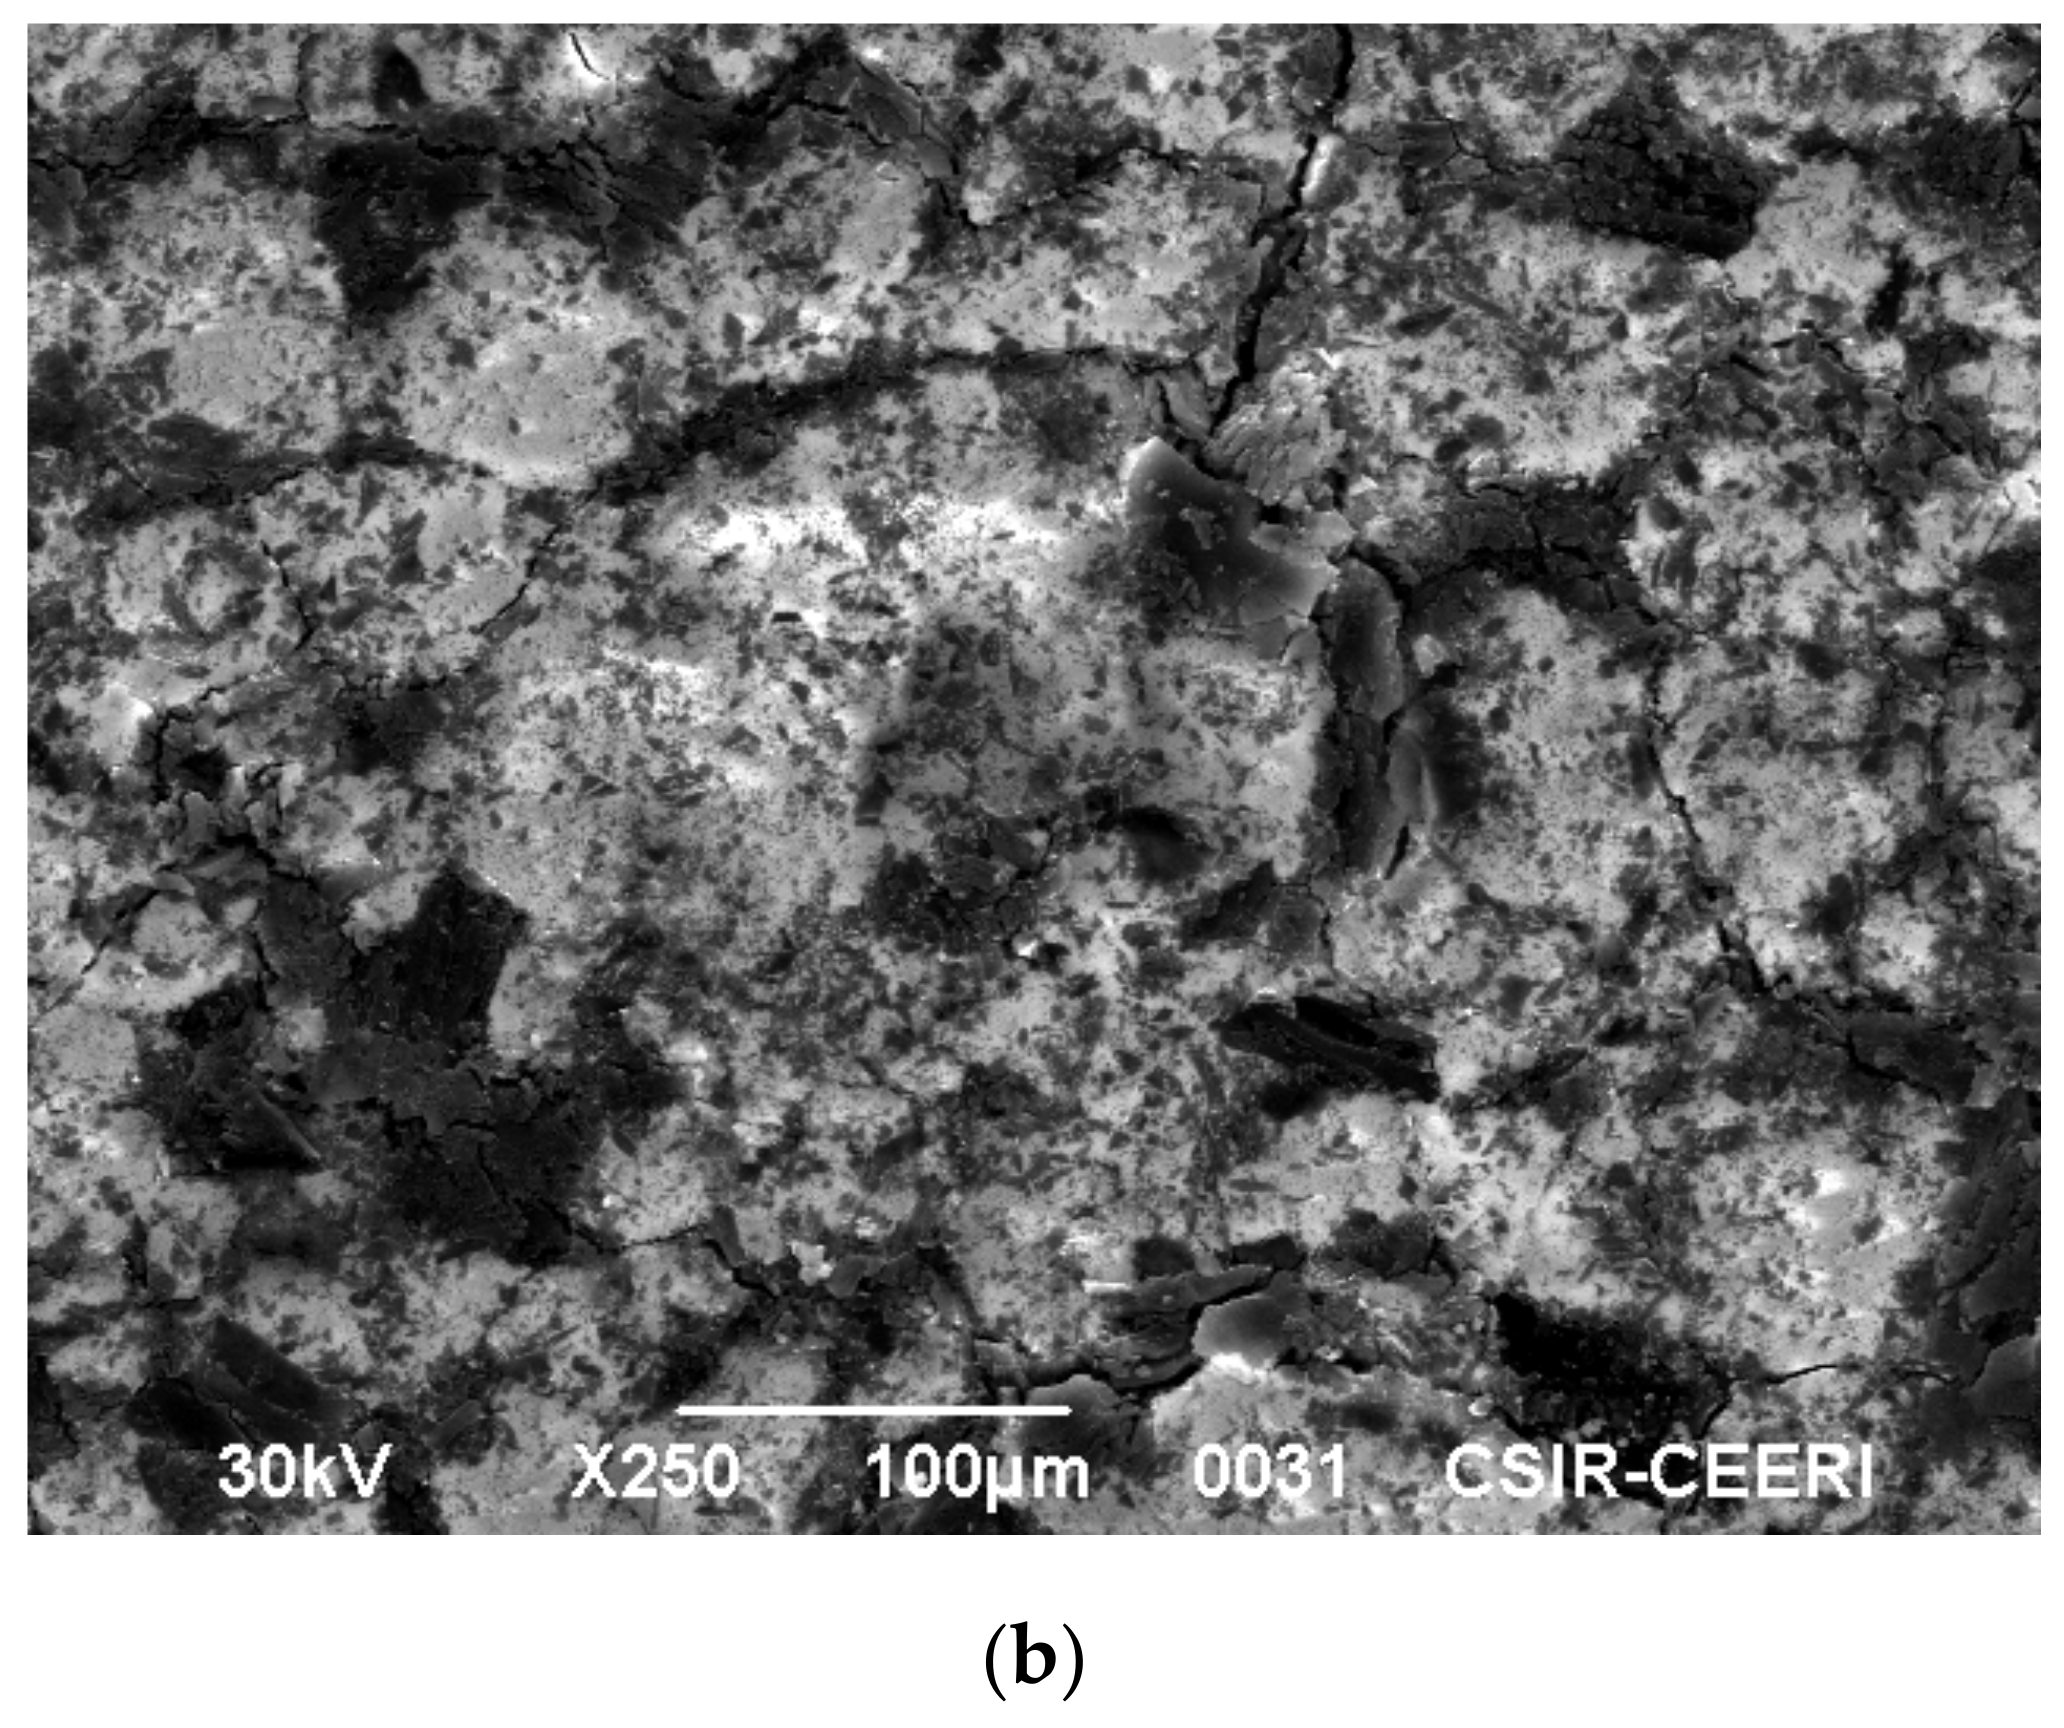
3.3. Scanning Electron Micrograph (SEM) of Activated Carbon
3.4. Thermodynamic Parameters
4. New Thermodynamic Model
Khan Model
5. Conclusions
Author Contributions
Funding
Acknowledgments
Conflicts of Interest
References
- Gopinathan, R.; Bhowal, A.; Garlapati, C. Adsorption Studies of Some Anionic Dyes Adsorbed by Chitosan and New Four-Parameter Adsorption Isotherm Model. J. Chem. Eng. Data. 2019, 64, 2320–2328. [Google Scholar] [CrossRef]
- Salleh, M.A.M.; Mahmoud, D.K.; Karim, W.A.W.A.; Idris, A. Cationic and anionic dye adsorption by agricultural solid wastes: A comprehensive review. Desalination 2011, 280, 1–13. [Google Scholar] [CrossRef]
- Mahmoodi, N.M.; Hayati, B.; Arami, M.; Lan, C. Adsorption of textile dyes on Pine Cone from colored wastewater: Kinetic, equilibrium and thermodynamic studies. Desalination 2011, 268, 117–125. [Google Scholar] [CrossRef]
- Hoda, N.; Bayram, E.; Ayranci, E. Kinetic and equilibrium studies on the removal of acid dyes from aqueous solutions by adsorption onto activated carbon cloth. J. Hazard. Mater. 2006, 137, 344–351. [Google Scholar] [CrossRef] [PubMed]
- Gürses, A.; Hassani, A.; Kıranşan, M.; Açışlı, Ö.; Karaca, S. Removal of methylene blue from aqueous solution using by untreated lignite as potential low-cost adsorbent: Kinetic, thermodynamic and equilibrium approach. J. Water Process Eng. 2014, 2, 10–21. [Google Scholar] [CrossRef]
- Mittal, A.; Malviya, A.; Kaur, D.; Mittal, J.; Kurup, L. Studies on the adsorption kinetics and isotherms for the removal and recovery of Methyl Orange from wastewaters using waste materials. J. Hazard. Mater. 2007, 148, 229–240. [Google Scholar] [CrossRef] [PubMed]
- Rodríguez, A.; García, J.; Ovejero, G.; Mestanza, M. Adsorption of anionic and cationic dyes on activated carbon from aqueous solutions: Equilibrium and kinetics. J. Hazard. Mater. 2009, 172, 1311–1320. [Google Scholar] [CrossRef]
- Devi, M.G.; Al-Hashmi, Z.S.; Sekhar, G.C. Treatment of vegetable oil mill effluent using crab shell chitosan as adsorbent. Int. J. Environ. Sci. Technol. 2012, 9, 713–718. [Google Scholar] [CrossRef]
- Güzel, F.; Tez, Z. The Characterization of the Micropore Structures of Some Activated Carbons of Plant Origin by N2 and CO2 Adsorptions. Sep. Sci. Technol. 1993, 28, 1609–1627. [Google Scholar] [CrossRef]
- Sharma, Y.C.; Srivastava, V.; Singh, V.K.; Kaul, S.N.; Weng, C.H. Nano-adsorbents for the removal of metallic pollutants from water and wastewater. Environ. Technol. 2009, 30, 583–609. [Google Scholar] [CrossRef]
- Azizian, S.; Haerifar, M.; Bashiri, H. Adsorption of methyl violet onto granular activated carbon: Equilibrium, kinetics and modeling. Chem. Eng. J. 2009, 146, 36–41. [Google Scholar] [CrossRef]
- Portugal, I.; Da Silva, F.A.; Silva, C.M.; Fernandes, D.L.A.; Xavier, A.M.R.B. Dynamic and Equilibrium Adsorption Experiments. J. Chem. Educ. 2005, 82, 919. [Google Scholar] [CrossRef]
- Lisec, O.; Hugo, P.; Seidel-Morgenstern, A. Frontal analysis method to determine competitive adsorption isotherms. J. Chromatogr. A 2001, 908, 19–34. [Google Scholar] [CrossRef]
- Al-Degs, Y.S.; El-Barghouthi, M.I.; El-Sheikh, A.H.; Walker, G.M. Effect of solution pH, ionic strength, and temperature on adsorption behavior of reactive dyes on activated carbon. Dye. Pigment. 2008, 77, 16–23. [Google Scholar] [CrossRef]
- Deniz, F.; Karaman, S. Removal of Basic Red 46 dye from aqueous solution by pine tree leaves. Chem. Eng. J. 2011, 170, 67–74. [Google Scholar] [CrossRef]
- Chen, S.; Zhang, J.; Zhang, C.; Yue, Q.; Li, Y.; Li, C. Equilibrium and kinetic studies of methyl orange and methyl violet adsorption on activated carbon derived from Phragmites australis. Desalination 2010, 252, 149–156. [Google Scholar] [CrossRef]
- Srivastava, V.C.; Mall, I.D.; Mishra, I.M. Adsorption thermodynamics and isosteric heat of adsorption of toxic metal ions onto bagasse fly ash (BFA) and rice husk ash (RHA). Chem. Eng. J. 2007, 132, 267–278. [Google Scholar] [CrossRef]
- Freitas, A.F.; Mendes, M.F.; Coelho, G.L.V. Thermodynamic study of fatty acids adsorption on different adsorbents. J. Chem. Thermodyn. 2007, 39, 1027–1037. [Google Scholar] [CrossRef]
- Lataye, D.H.; Mishra, I.M.; Mall, I.D. Adsorption of α-picoline onto rice husk ash and granular activated carbon from aqueous solution: Equilibrium and thermodynamic study. Chem. Eng. J. 2009, 147, 139–149. [Google Scholar] [CrossRef]
- Gopinathan, R.; Bhowal, A.; Garlapati, C. Adsorption Characteristics of Activated Carbon for the Reclamation of Colored Effluents Containing Orange G and New Solid−Liquid Phase Equilibrium Model. J. Chem. Eng. Data 2017, 62, 558–567. [Google Scholar] [CrossRef]
- Gopinathan, R.; Bhowal, A.; Garlapati, C. Thermodynamic study of some basic dyes adsorption from aqueous solutions on activated carbon and new correlations. J. Chem. Thermodyn. 2017, 107, 182–188. [Google Scholar] [CrossRef]
- Balzhiser, R.E.; Samuels, M.R.; Eliassen, J.D. Chemical Engineering Thermodynamics: The Study of Energy, Entropy and Equilibrium; Prentice Hall: Upper Saddle River, NJ, USA, 1974; pp. 402–404. [Google Scholar]
- Khan, A.R.; Riazi, M.R.; Al-Roomi, Y.A. A thermodynamic model for liquid adsorption isotherms. Sep. Purif. Technol. 2000, 18, 237–250. [Google Scholar] [CrossRef]


| Compound | Correlations Based on Khan et al., Model | AARD% | |||
|---|---|---|---|---|---|
| Indigo carmine | −6.8945 | 1504.5 | −126.50 | 13.05 | |
| Eosin Y | −1.8805 | 10599 | −537.12 | 51 | |
| Correlations based on new model | |||||
| Indigo carmine | −23503 | −5.2068 | 1503.9 | −126.26 | 6.84 |
| Eosin Y | 9508.5 | −6.9458 | 14023 | −778.97 | 13.7 |
| Dye | Concentration (mg/L) | R2 | |||
|---|---|---|---|---|---|
| Indigo Carmine | 50 | 47.02 | 47.28 | 0.02405 | 0.999 |
| 75 | 66.89 | 66.93 | 0.72234 | 0.999 | |
| 100 | 82.81 | 82.37 | 0.02139 | 0.999 | |
| Eosin Y | 50 | 46.62 | 47.62 | 0.00886 | 0.999 |
| 75 | 70.27 | 71.29 | 0.006717 | 0.999 | |
| 100 | 86.61 | 86.78 | 0.06135 | 0.999 |
| Compound | T/K | R2 | ||
|---|---|---|---|---|
| Indigo Carmine | ||||
| 303 | 0.0998 | 246.98 | 0.985 | |
| 313 | 0.1127 | 250.16 | 0.985 | |
| 323 | 0.1300 | 253.31 | 0.984 | |
| Eosin Y | ||||
| 303 | 0.1206 | 90.57 | 0.998 | |
| 313 | 0.1367 | 95.99 | 0.999 | |
| 323 | 0.1914 | 100.88 | 0.999 |
| Dye | T/K | |||
|---|---|---|---|---|
| Indigo Carmine | 303 | −29,012.7 | −12,010 | 56.09 |
| 313 | −30,286.6 | 58.37 | ||
| 323 | −31,637.3 | 60.74 | ||
| Eosin Y | 303 | −29,485.5 | −28,460.5 | 3.38 |
| 313 | −30,785.4 | 7.42 | ||
| 323 | −32,677.3 | 13.05 |
| Compound | Point of Zero Charge a | Basicity b | Acidity c | Particle Mean Size d |
|---|---|---|---|---|
| Activated carbon Merck Grade | 6.7 | 0.48 | 0.35 | 26.514 µm |
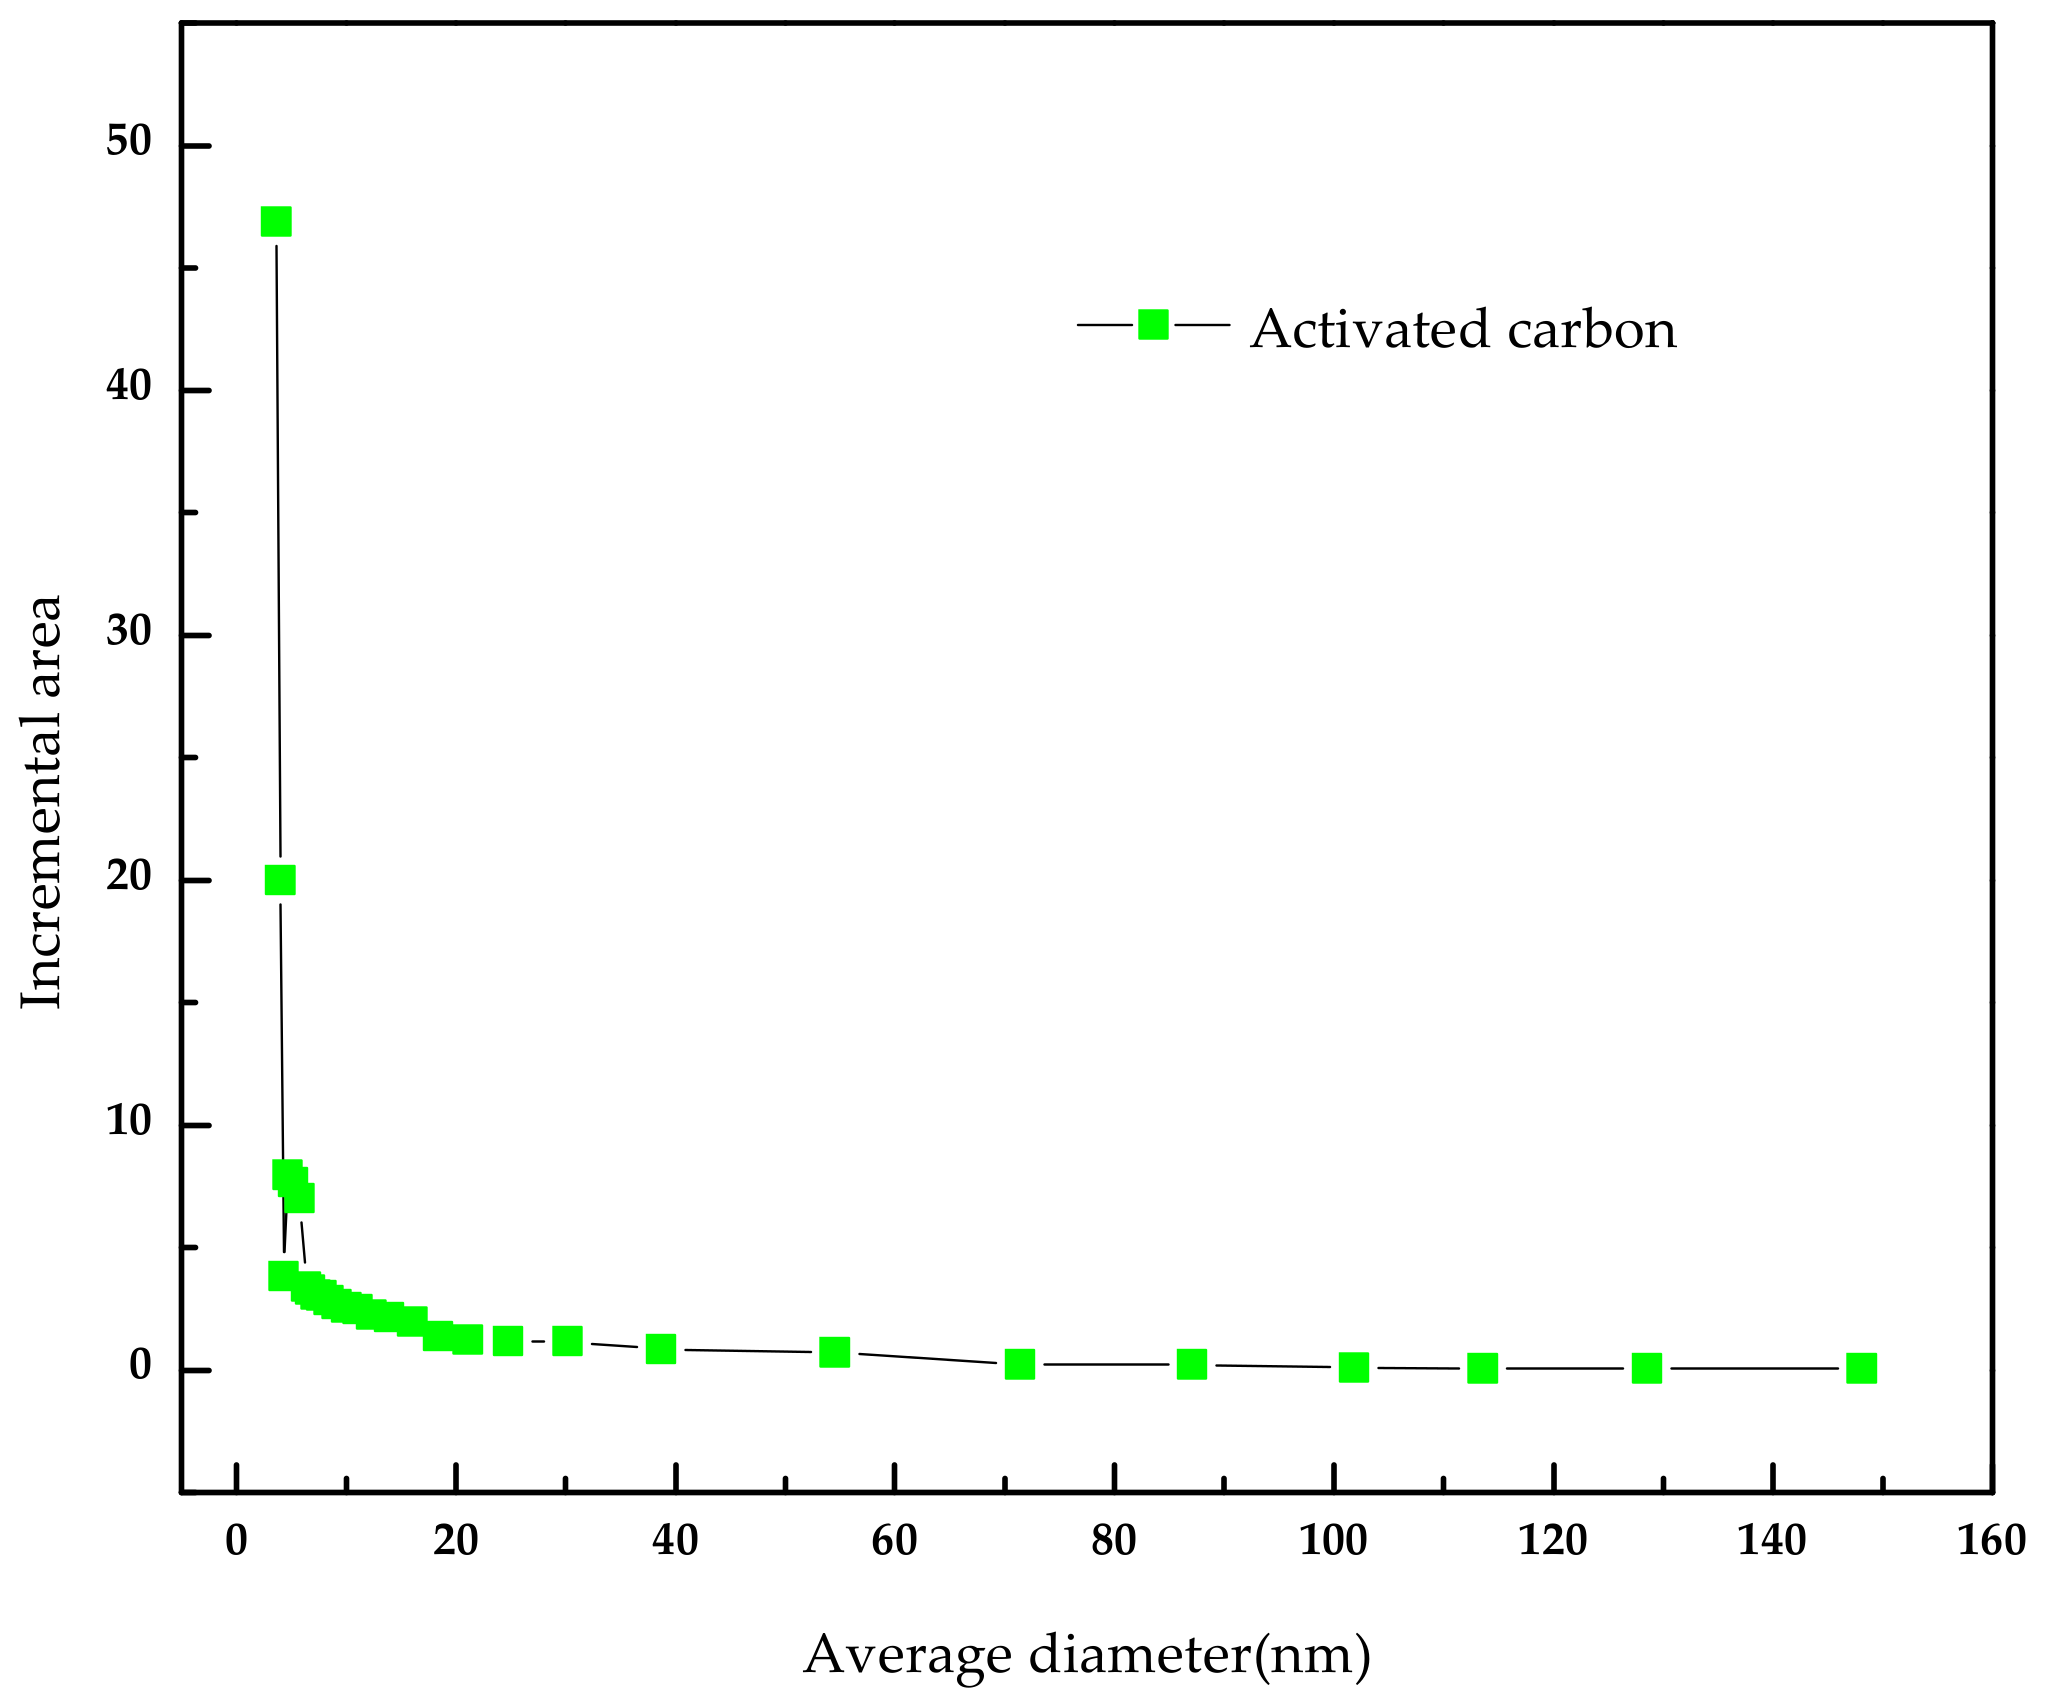
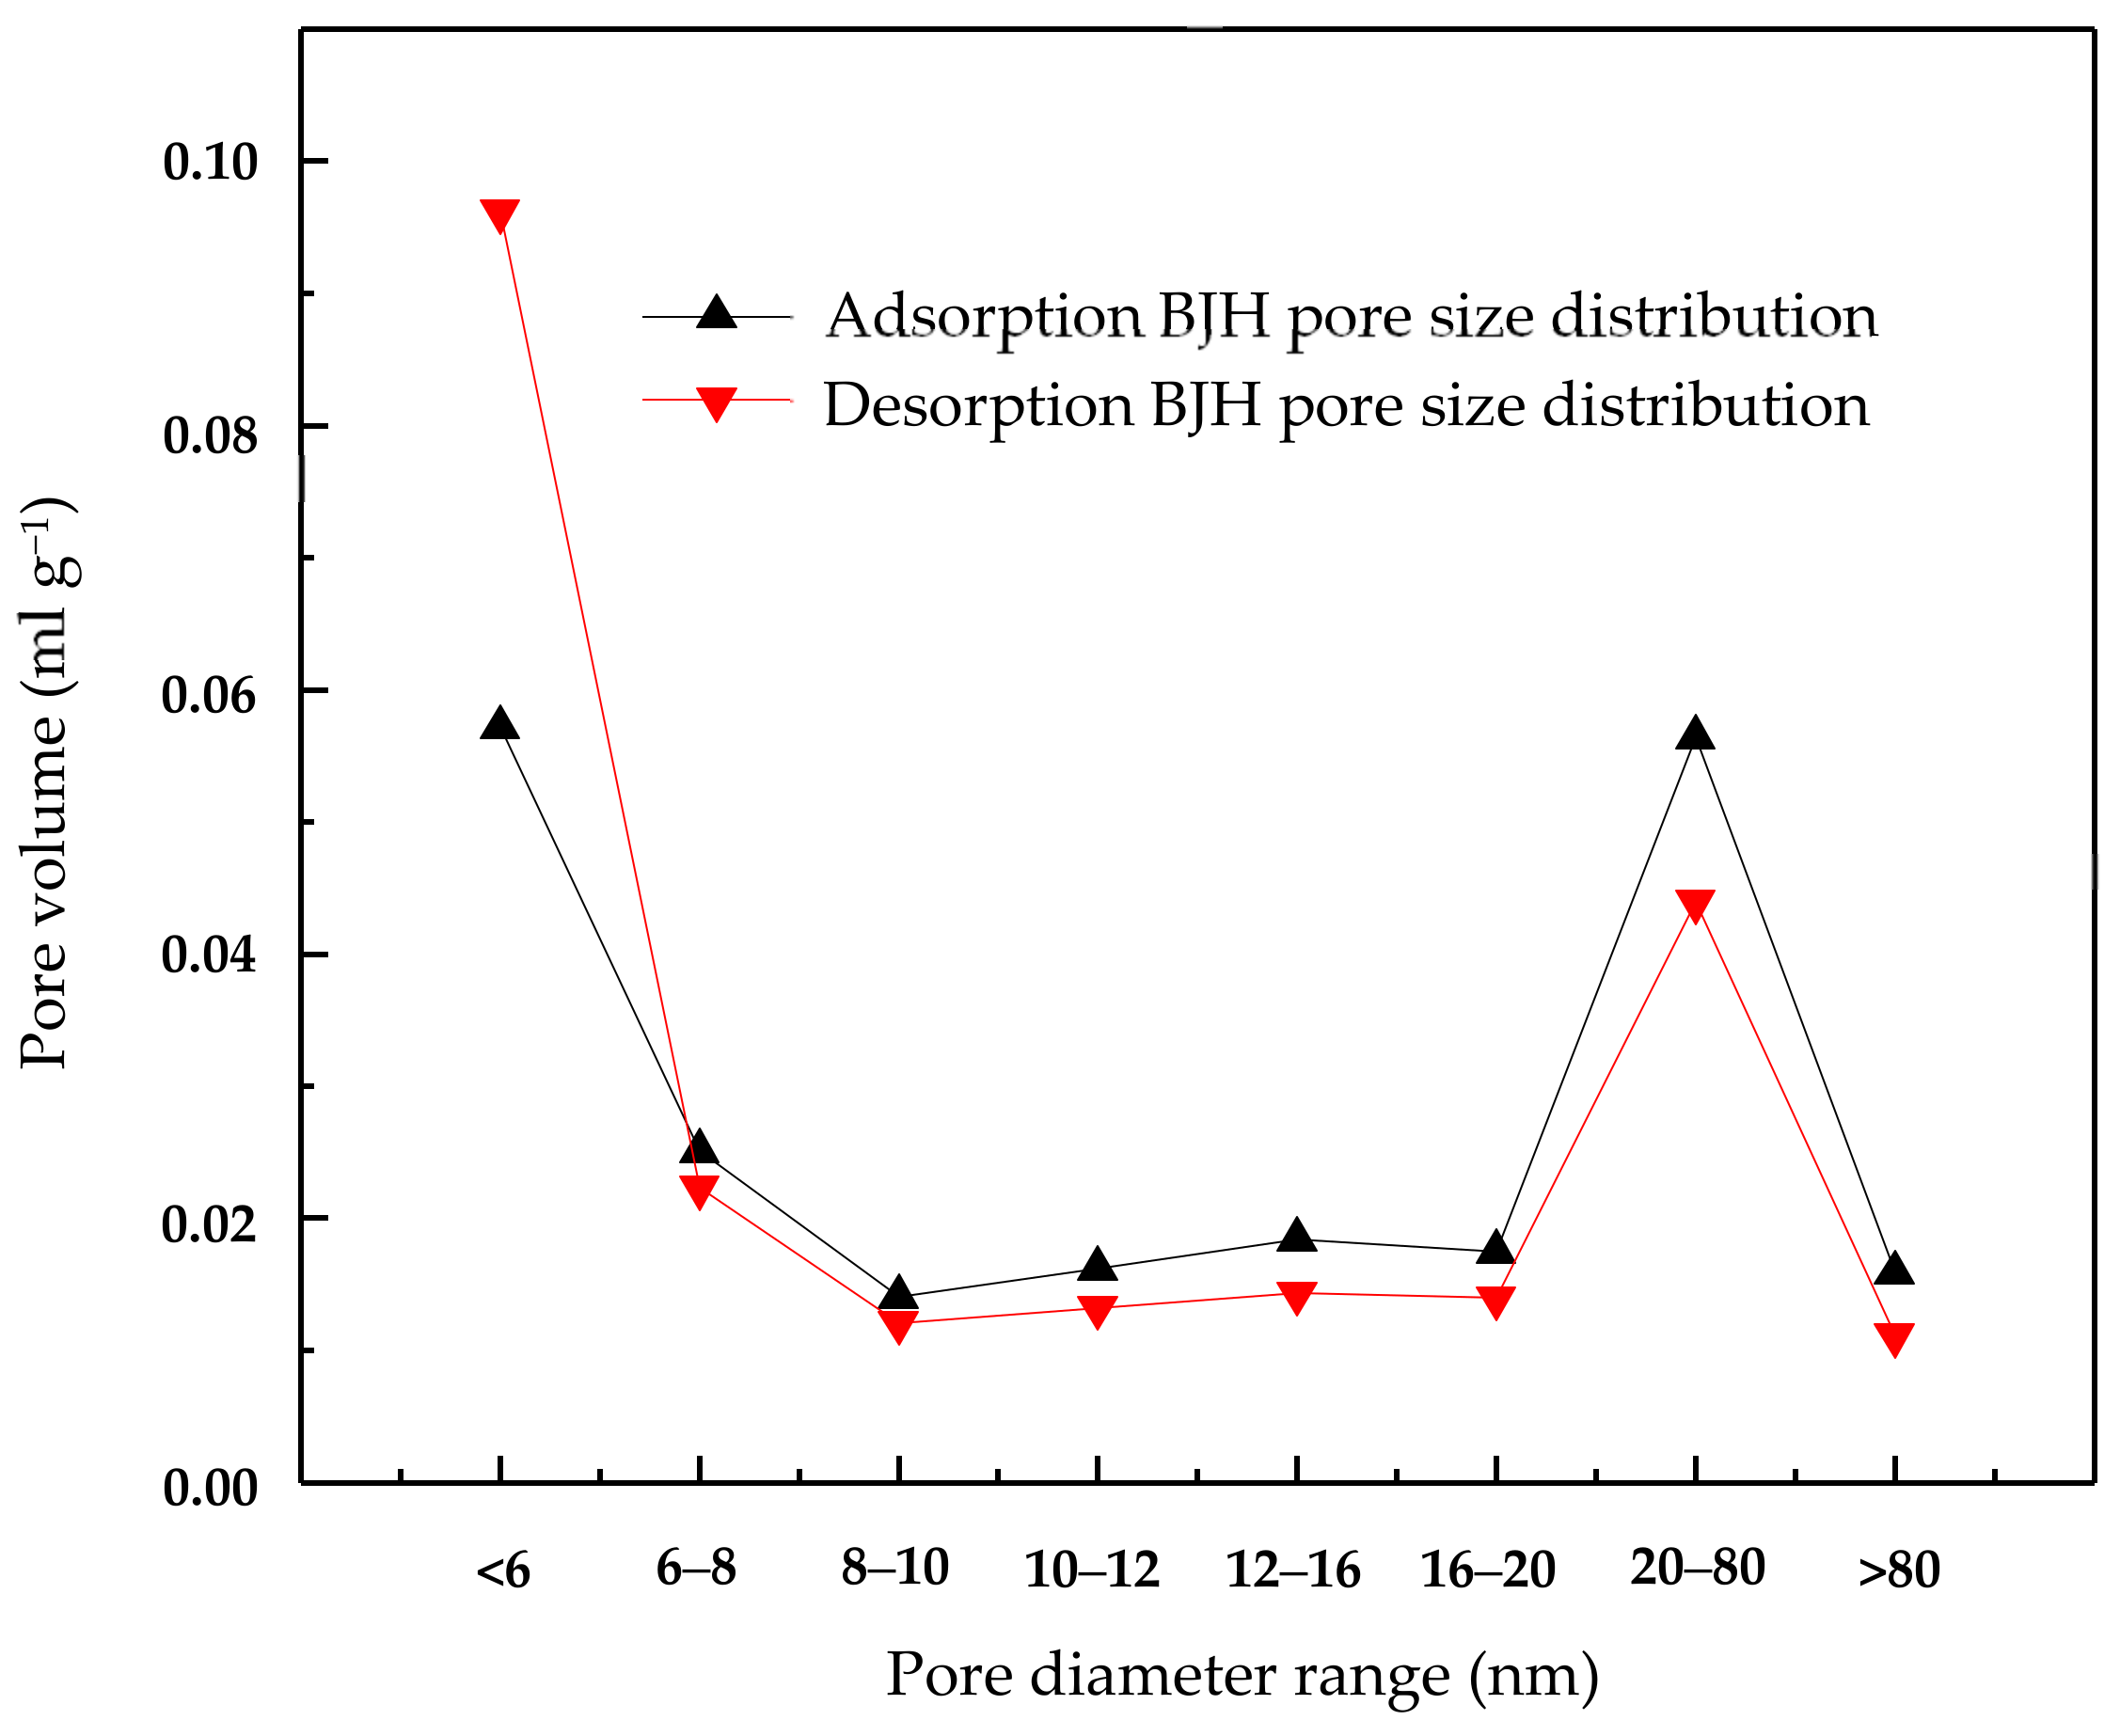
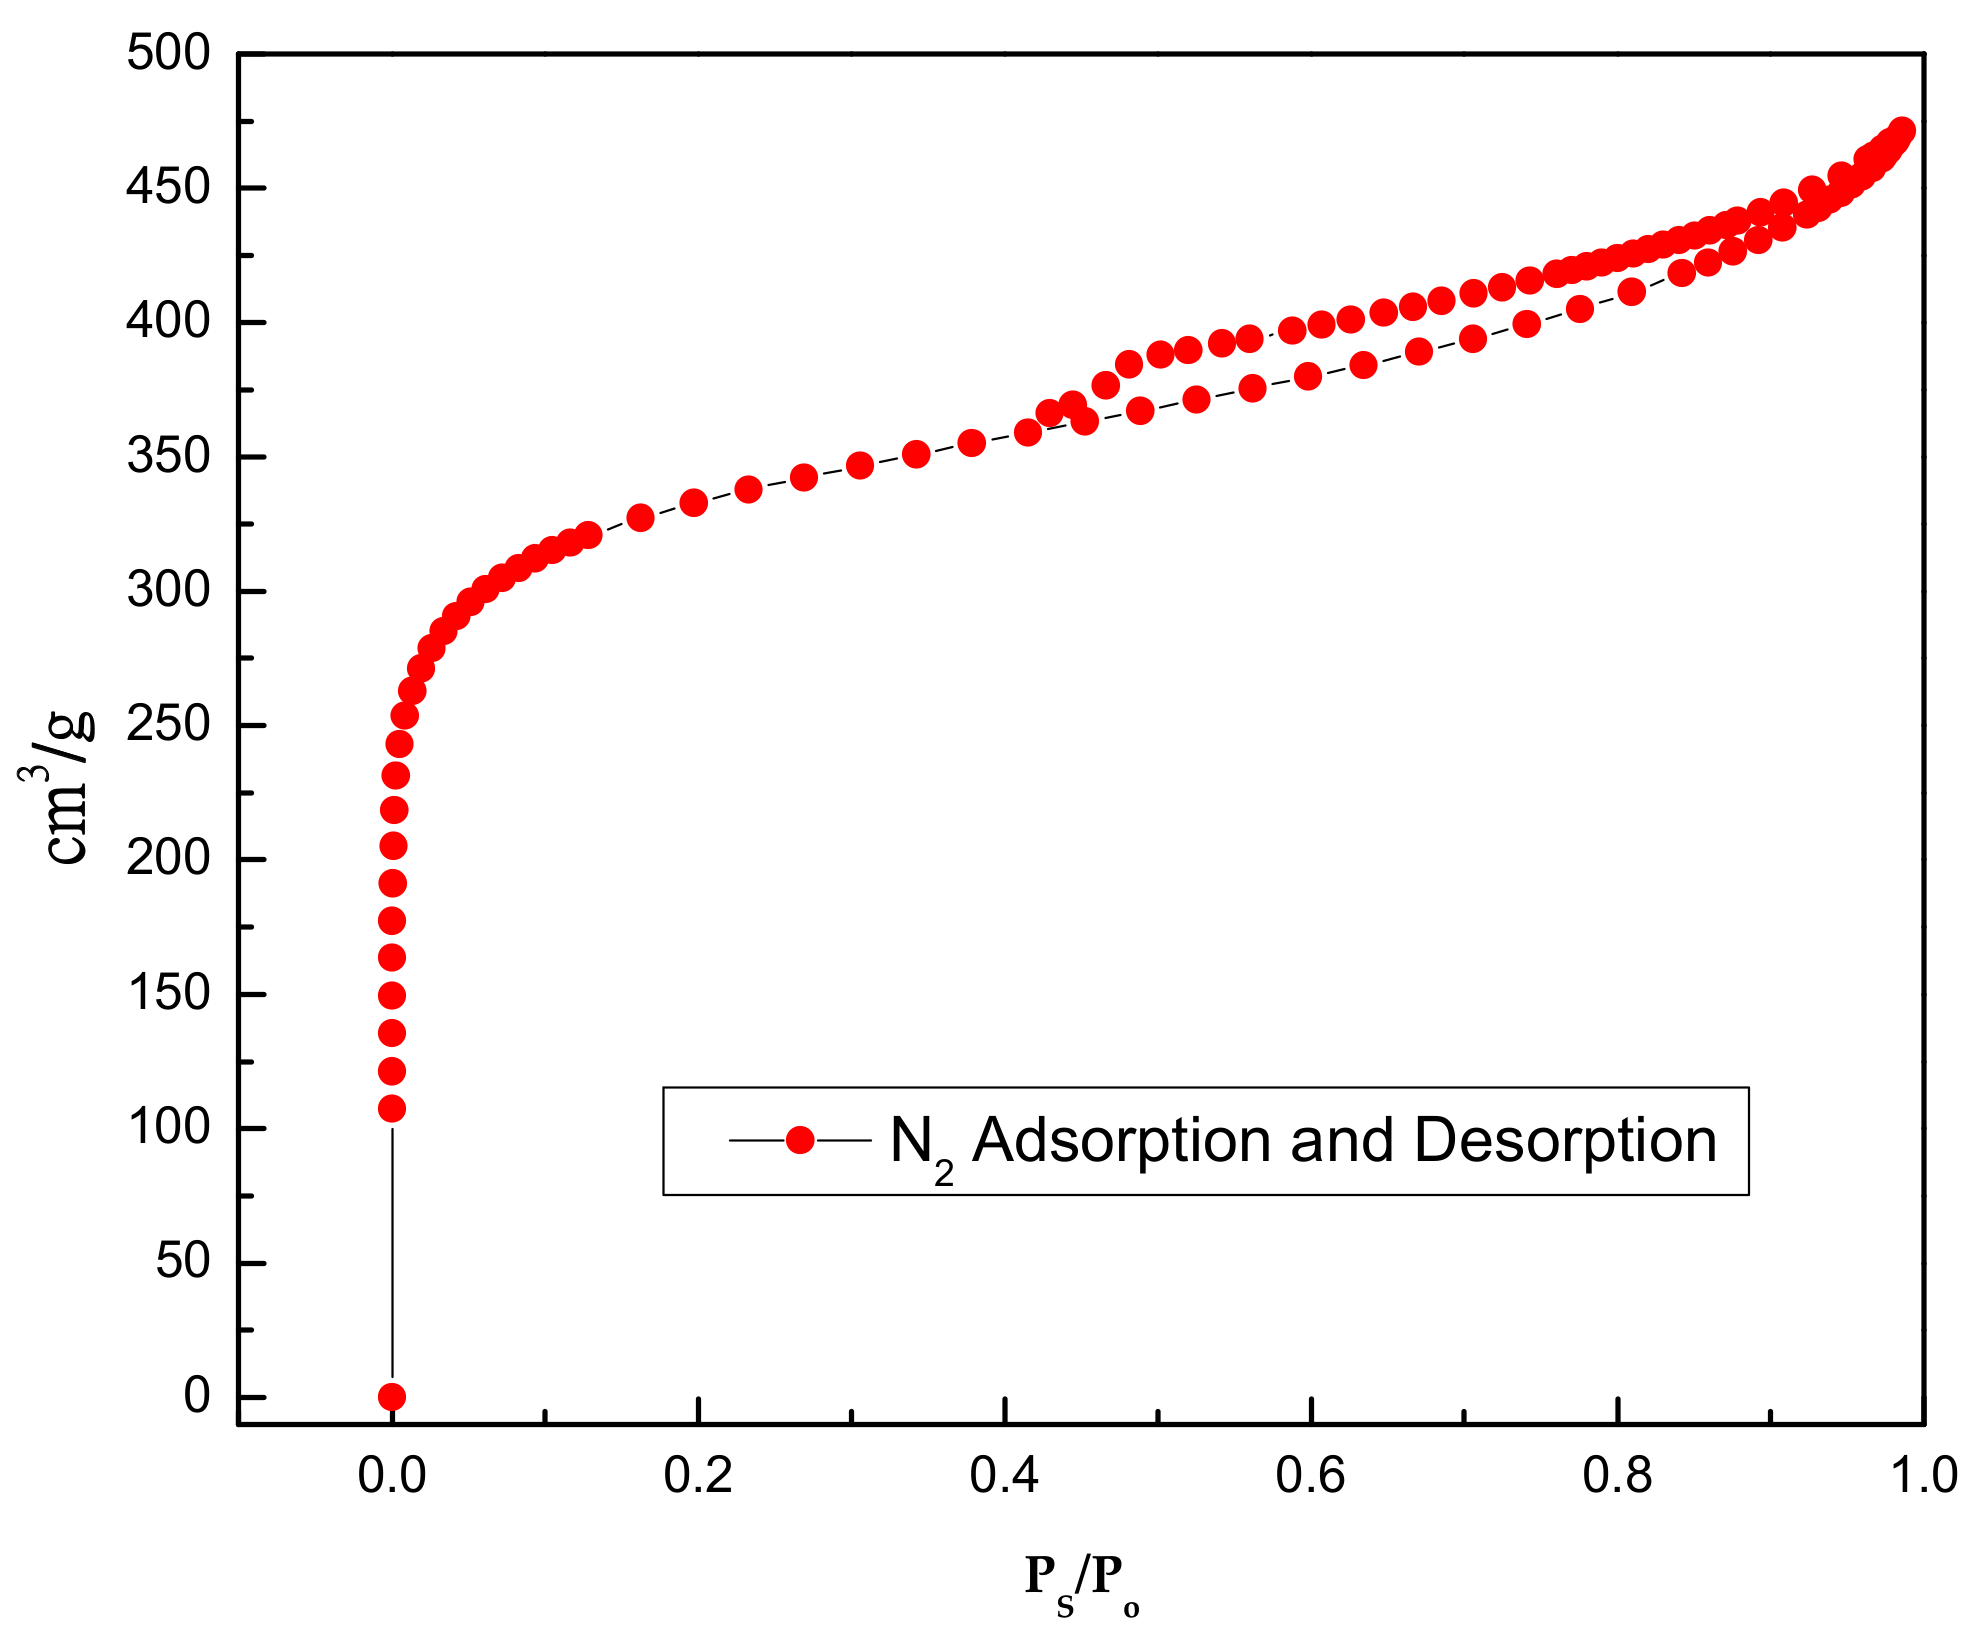
| Compound | a Surface Area | Langmuir Surface Area (m2 g−1) | b VTotal (cm3 g−1) | c Vmicro (cm3 g−1) | d Vmeso (cm3 g−1) | e Dave (nm) |
|---|---|---|---|---|---|---|
| BET (m2 g−1) | ||||||
| Activated Carbon | 1157 | 1323 | 0.72 | 0.33 | 0.39 | 2.49 |
| Dye | T/K = 303 | T/K = 313 | T/K = 323 | |||
|---|---|---|---|---|---|---|
| Eosin Y | 148.9 | 87.64 | 135.9 | 92.84 | 121.6 | 98.58 |
| 114.7 | 84.45 | 102.8 | 88.39 | 88.07 | 93.31 | |
| 86.28 | 80.49 | 71.94 | 84.59 | 54.76 | 89.50 | |
| 62.71 | 76.32 | 45.75 | 80.56 | 32.53 | 83.87 | |
| 41.98 | 72.45 | 28.31 | 75.49 | 18.60 | 77.65 | |
| 26.53 | 68.29 | 17.86 | 70.03 | 11.66 | 71.27 | |
| 18.35 | 63.57 | 12.46 | 64.64 | 7.731 | 65.50 | |
| 13.32 | 59.11 | 8.994 | 59.83 | 6.001 | 60.33 | |
| 6.378 | 45.20 | 6.007 | 45.25 | 3.348 | 45.58 | |
| 4.717 | 36.37 | 4.988 | 36.30 | 2.883 | 36.51 | |
| 4.013 | 30.33 | 3.618 | 30.37 | 2.680 | 30.44 | |
| Indigo Carmine | ||||||
| 38.91 | 198.8 | 33.83 | 200.9 | 28.82 | 202.9 | |
| 24.53 | 170.5 | 21.33 | 171.6 | 18.17 | 172.6 | |
| 16.10 | 148.5 | 14.00 | 149.1 | 11.92 | 149.7 | |
| 11.841 | 131.0 | 10.30 | 131.4 | 8.771 | 131.8 | |
| 9.001 | 117.1 | 7.828 | 117.4 | 6.668 | 117.6 | |
| 6.573 | 105.9 | 5.716 | 106.1 | 4.869 | 106.2 | |
| 5.195 | 96.51 | 4.518 | 96.63 | 3.848 | 96.76 | |
| 4.556 | 88.57 | 3.962 | 88.67 | 3.375 | 88.77 | |
| 3.569 | 66.55 | 3.103 | 66.61 | 2.644 | 66.67 | |
| 3.140 | 53.29 | 2.730 | 53.33 | 2.326 | 53.37 | |
| 2.751 | 44.44 | 2.392 | 44.47 | 2.038 | 44.50 | |
Sample Availability: Samples of the compounds are available from the authors. | |
Publisher’s Note: MDPI stays neutral with regard to jurisdictional claims in published maps and institutional affiliations. |
© 2020 by the authors. Licensee MDPI, Basel, Switzerland. This article is an open access article distributed under the terms and conditions of the Creative Commons Attribution (CC BY) license (http://creativecommons.org/licenses/by/4.0/).
Share and Cite
Alwi, R.S.; Gopinathan, R.; Bhowal, A.; Garlapati, C. Adsorption Characteristics of Activated Carbon for the Reclamation of Eosin Y and Indigo Carmine Colored Effluents and New Isotherm Model. Molecules 2020, 25, 6014. https://doi.org/10.3390/molecules25246014
Alwi RS, Gopinathan R, Bhowal A, Garlapati C. Adsorption Characteristics of Activated Carbon for the Reclamation of Eosin Y and Indigo Carmine Colored Effluents and New Isotherm Model. Molecules. 2020; 25(24):6014. https://doi.org/10.3390/molecules25246014
Chicago/Turabian StyleAlwi, Ratna Surya, Ramakrishnan Gopinathan, Avijit Bhowal, and Chandrasekhar Garlapati. 2020. "Adsorption Characteristics of Activated Carbon for the Reclamation of Eosin Y and Indigo Carmine Colored Effluents and New Isotherm Model" Molecules 25, no. 24: 6014. https://doi.org/10.3390/molecules25246014
APA StyleAlwi, R. S., Gopinathan, R., Bhowal, A., & Garlapati, C. (2020). Adsorption Characteristics of Activated Carbon for the Reclamation of Eosin Y and Indigo Carmine Colored Effluents and New Isotherm Model. Molecules, 25(24), 6014. https://doi.org/10.3390/molecules25246014