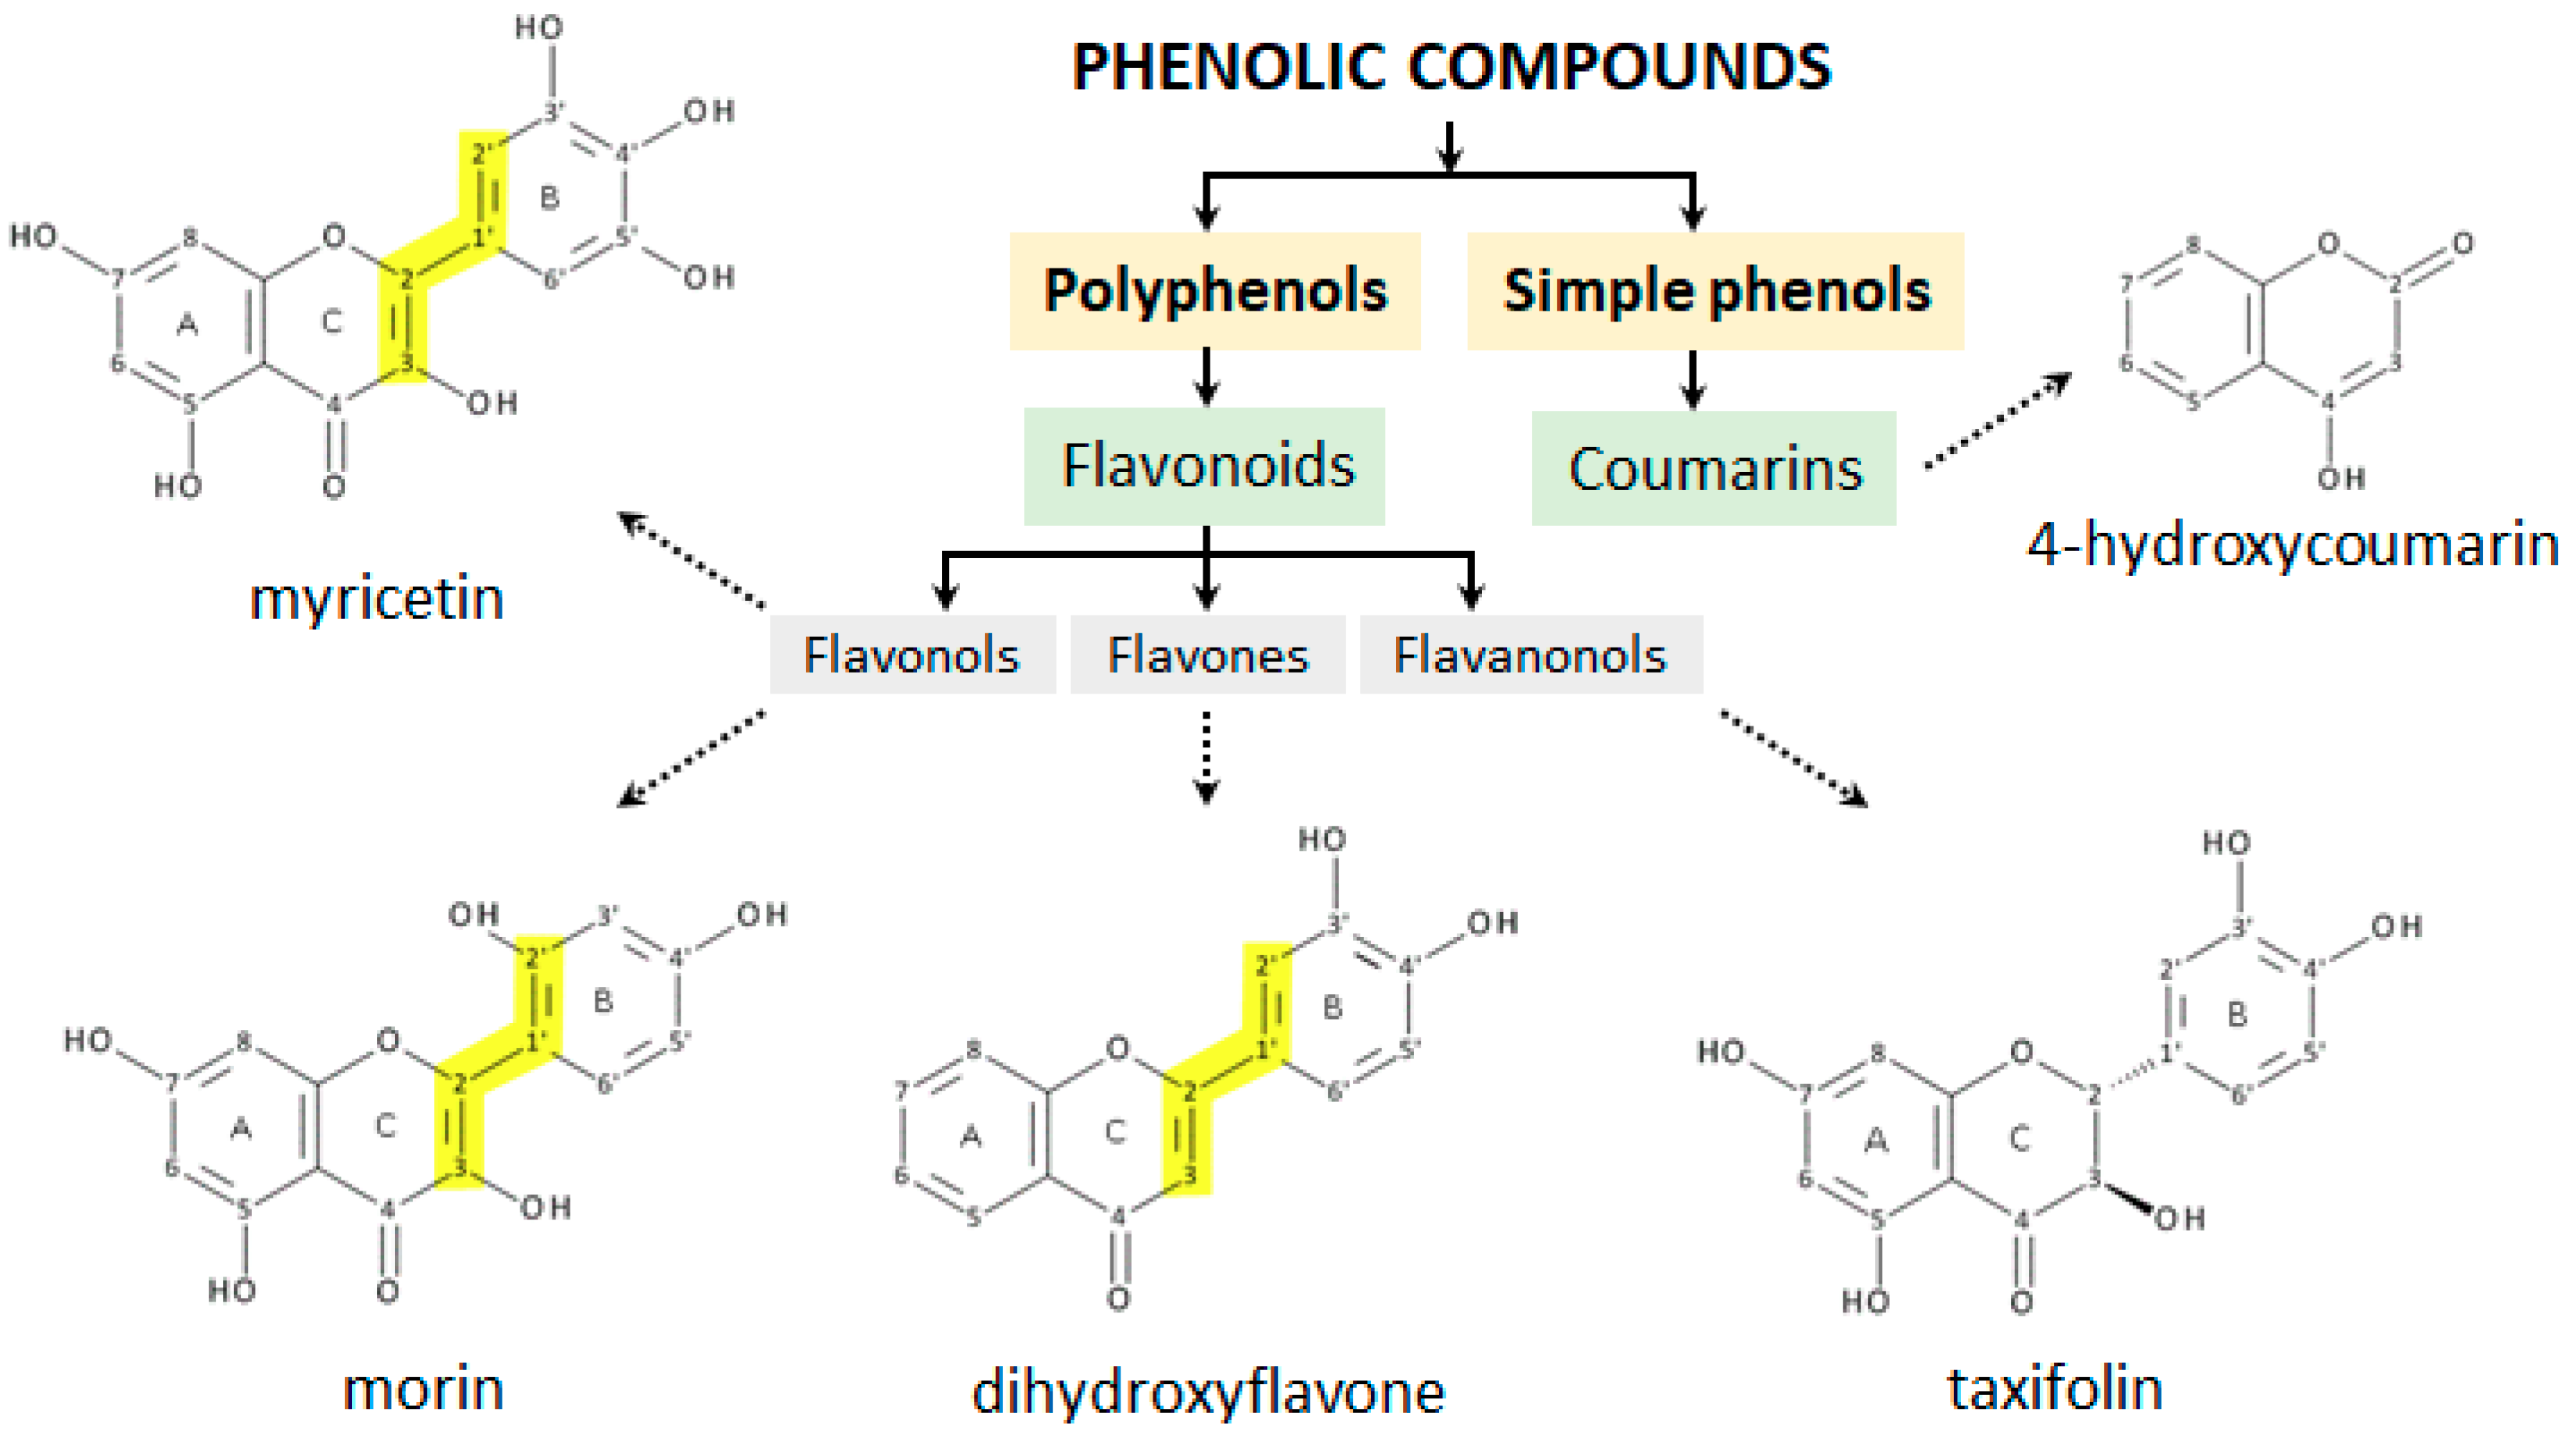
A Switch between Antioxidant and Prooxidant Properties of the Phenolic Compounds Myricetin, Morin, 3′,4′-Dihydroxyflavone, Taxifolin and 4-Hydroxy-Coumarin in the Presence of Copper(II) Ions: A Spectroscopic, Absorption Titration and DNA Damage Study


Abstract
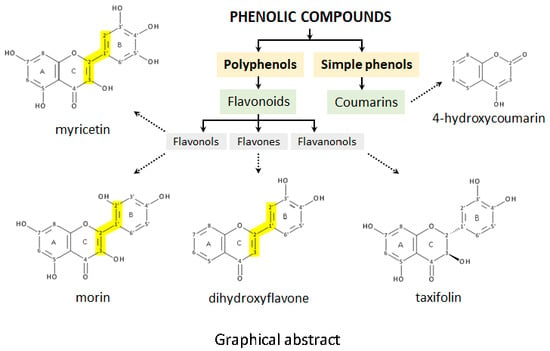
1. Introduction
2. Results and Discussion
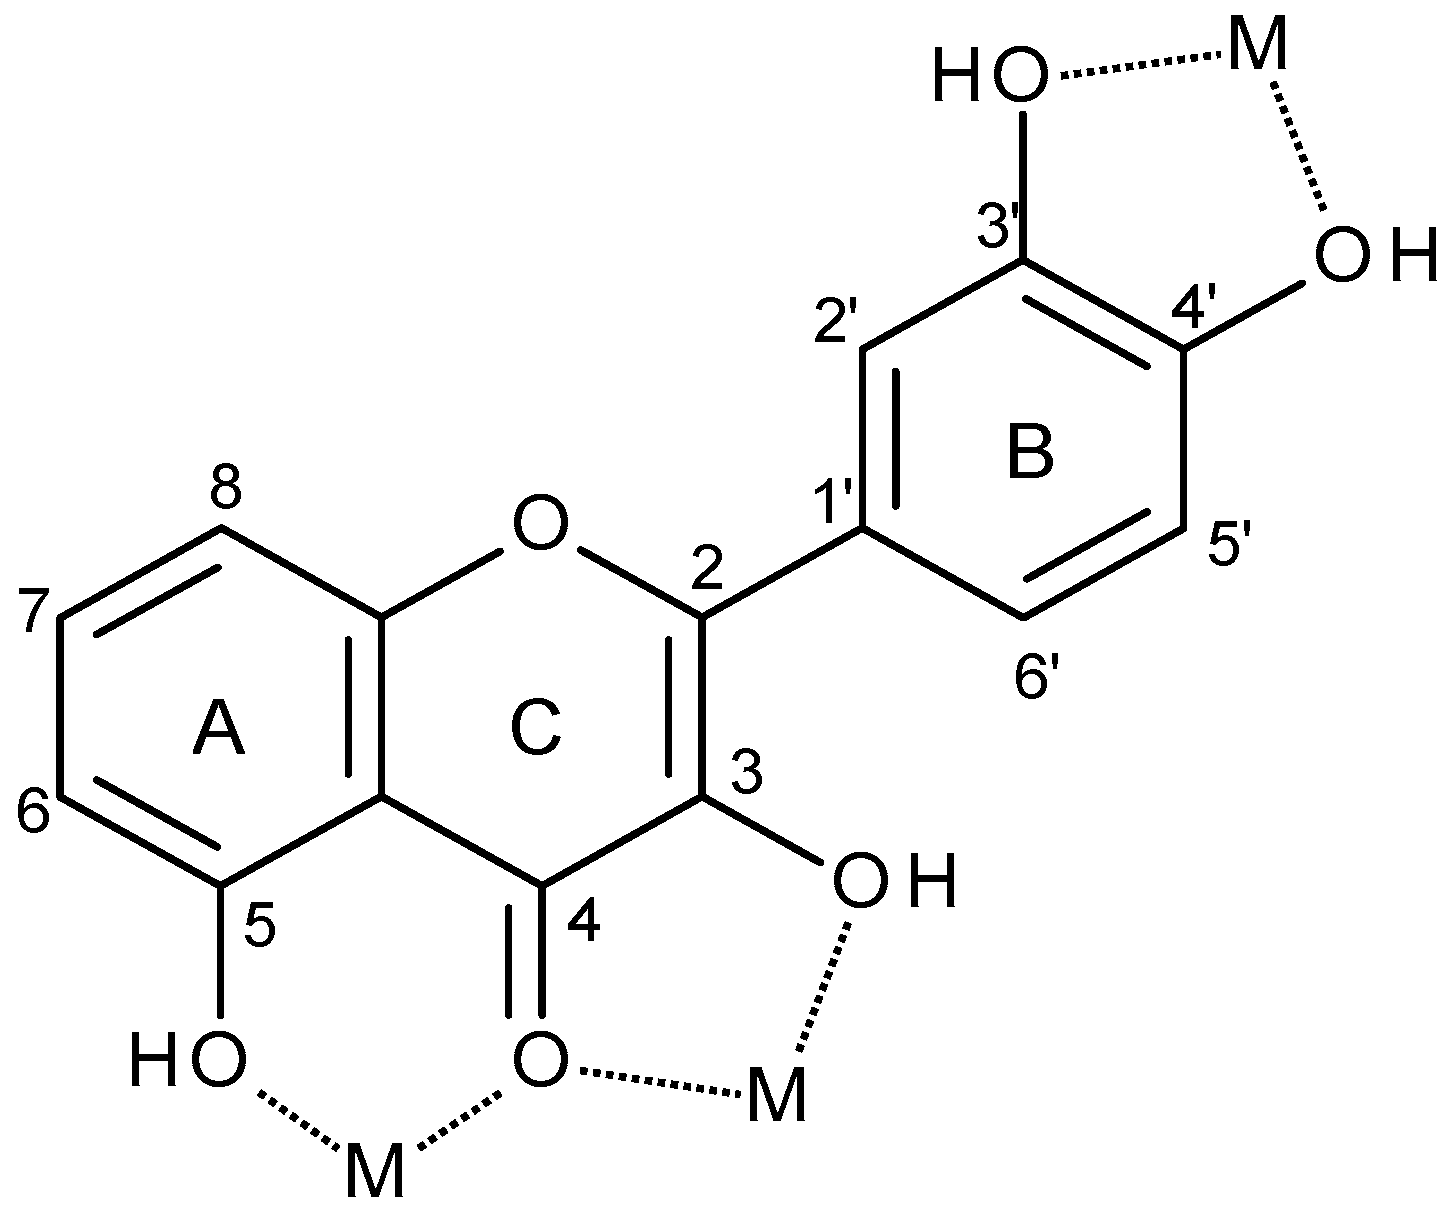
2.1. Chelation of Cu(II) by Phenolic Compounds
2.1.1. EPR Spectroscopy of Copper(II)-Phenolic Complexes
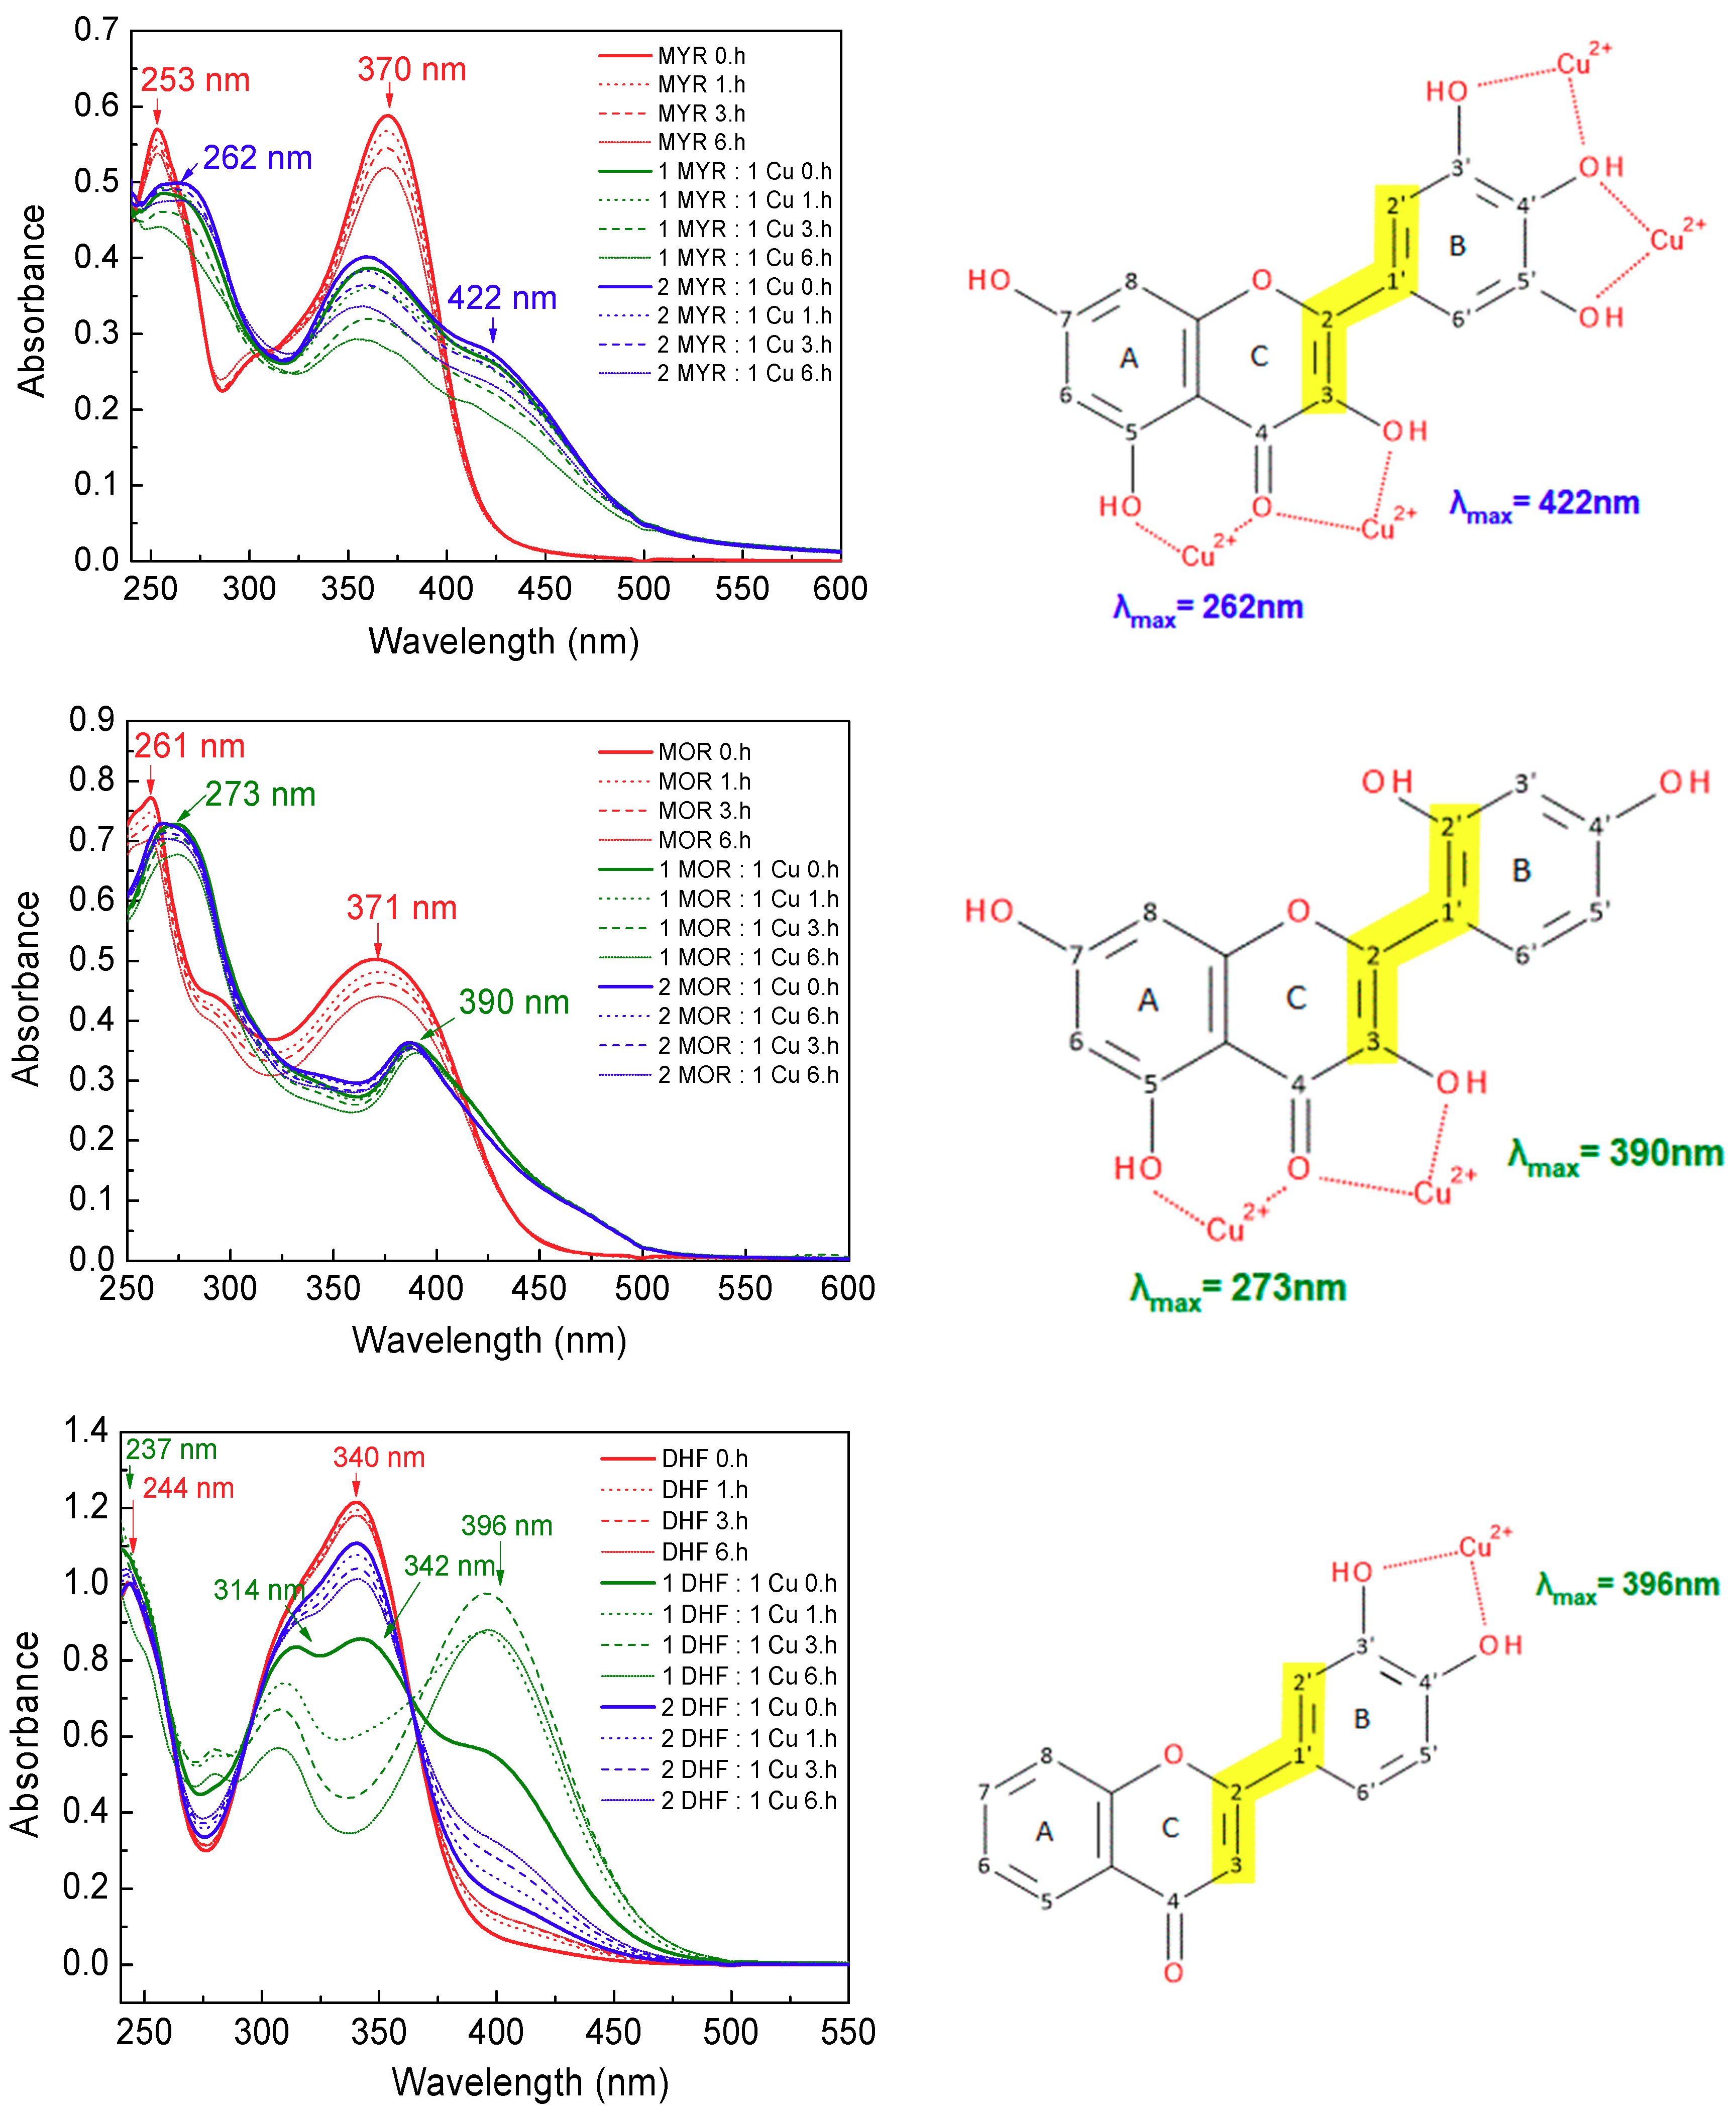
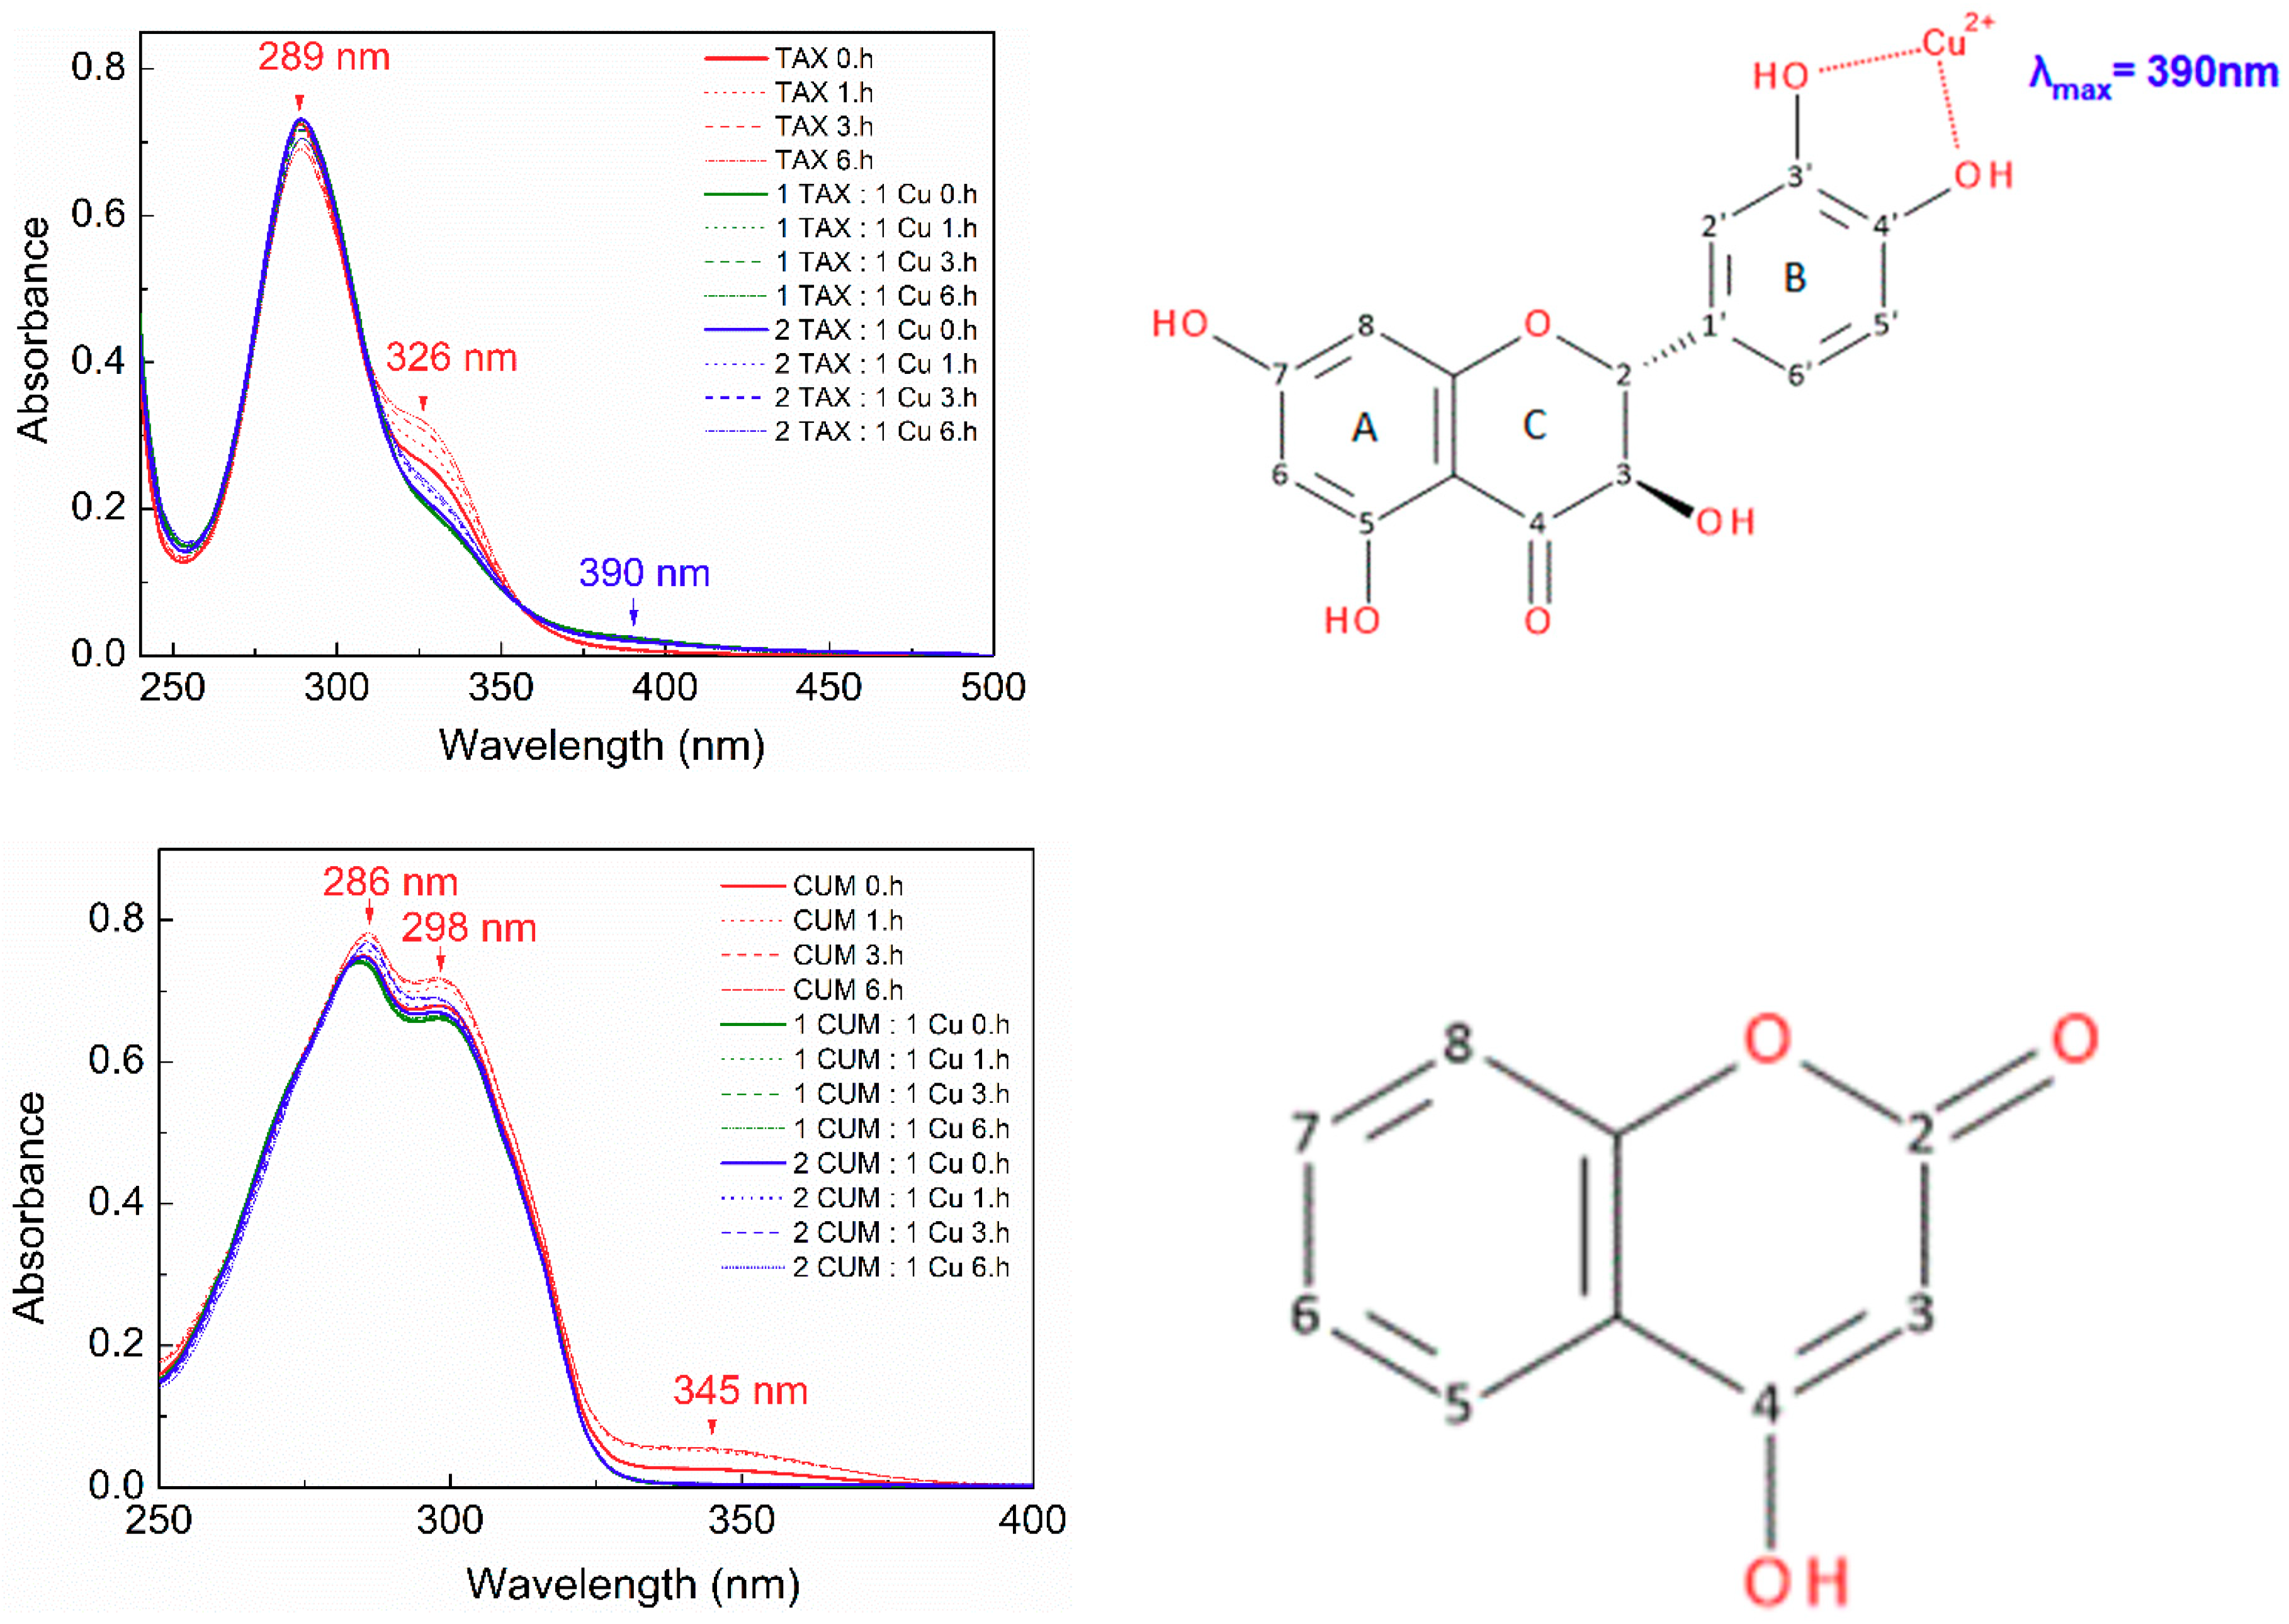
2.1.2. UV-Vis Spectroscopy of Cu(II)-Phenolic Complexes
2.2. Antioxidant Properties of Phenolic Compounds and Their Cu(II) Complexes
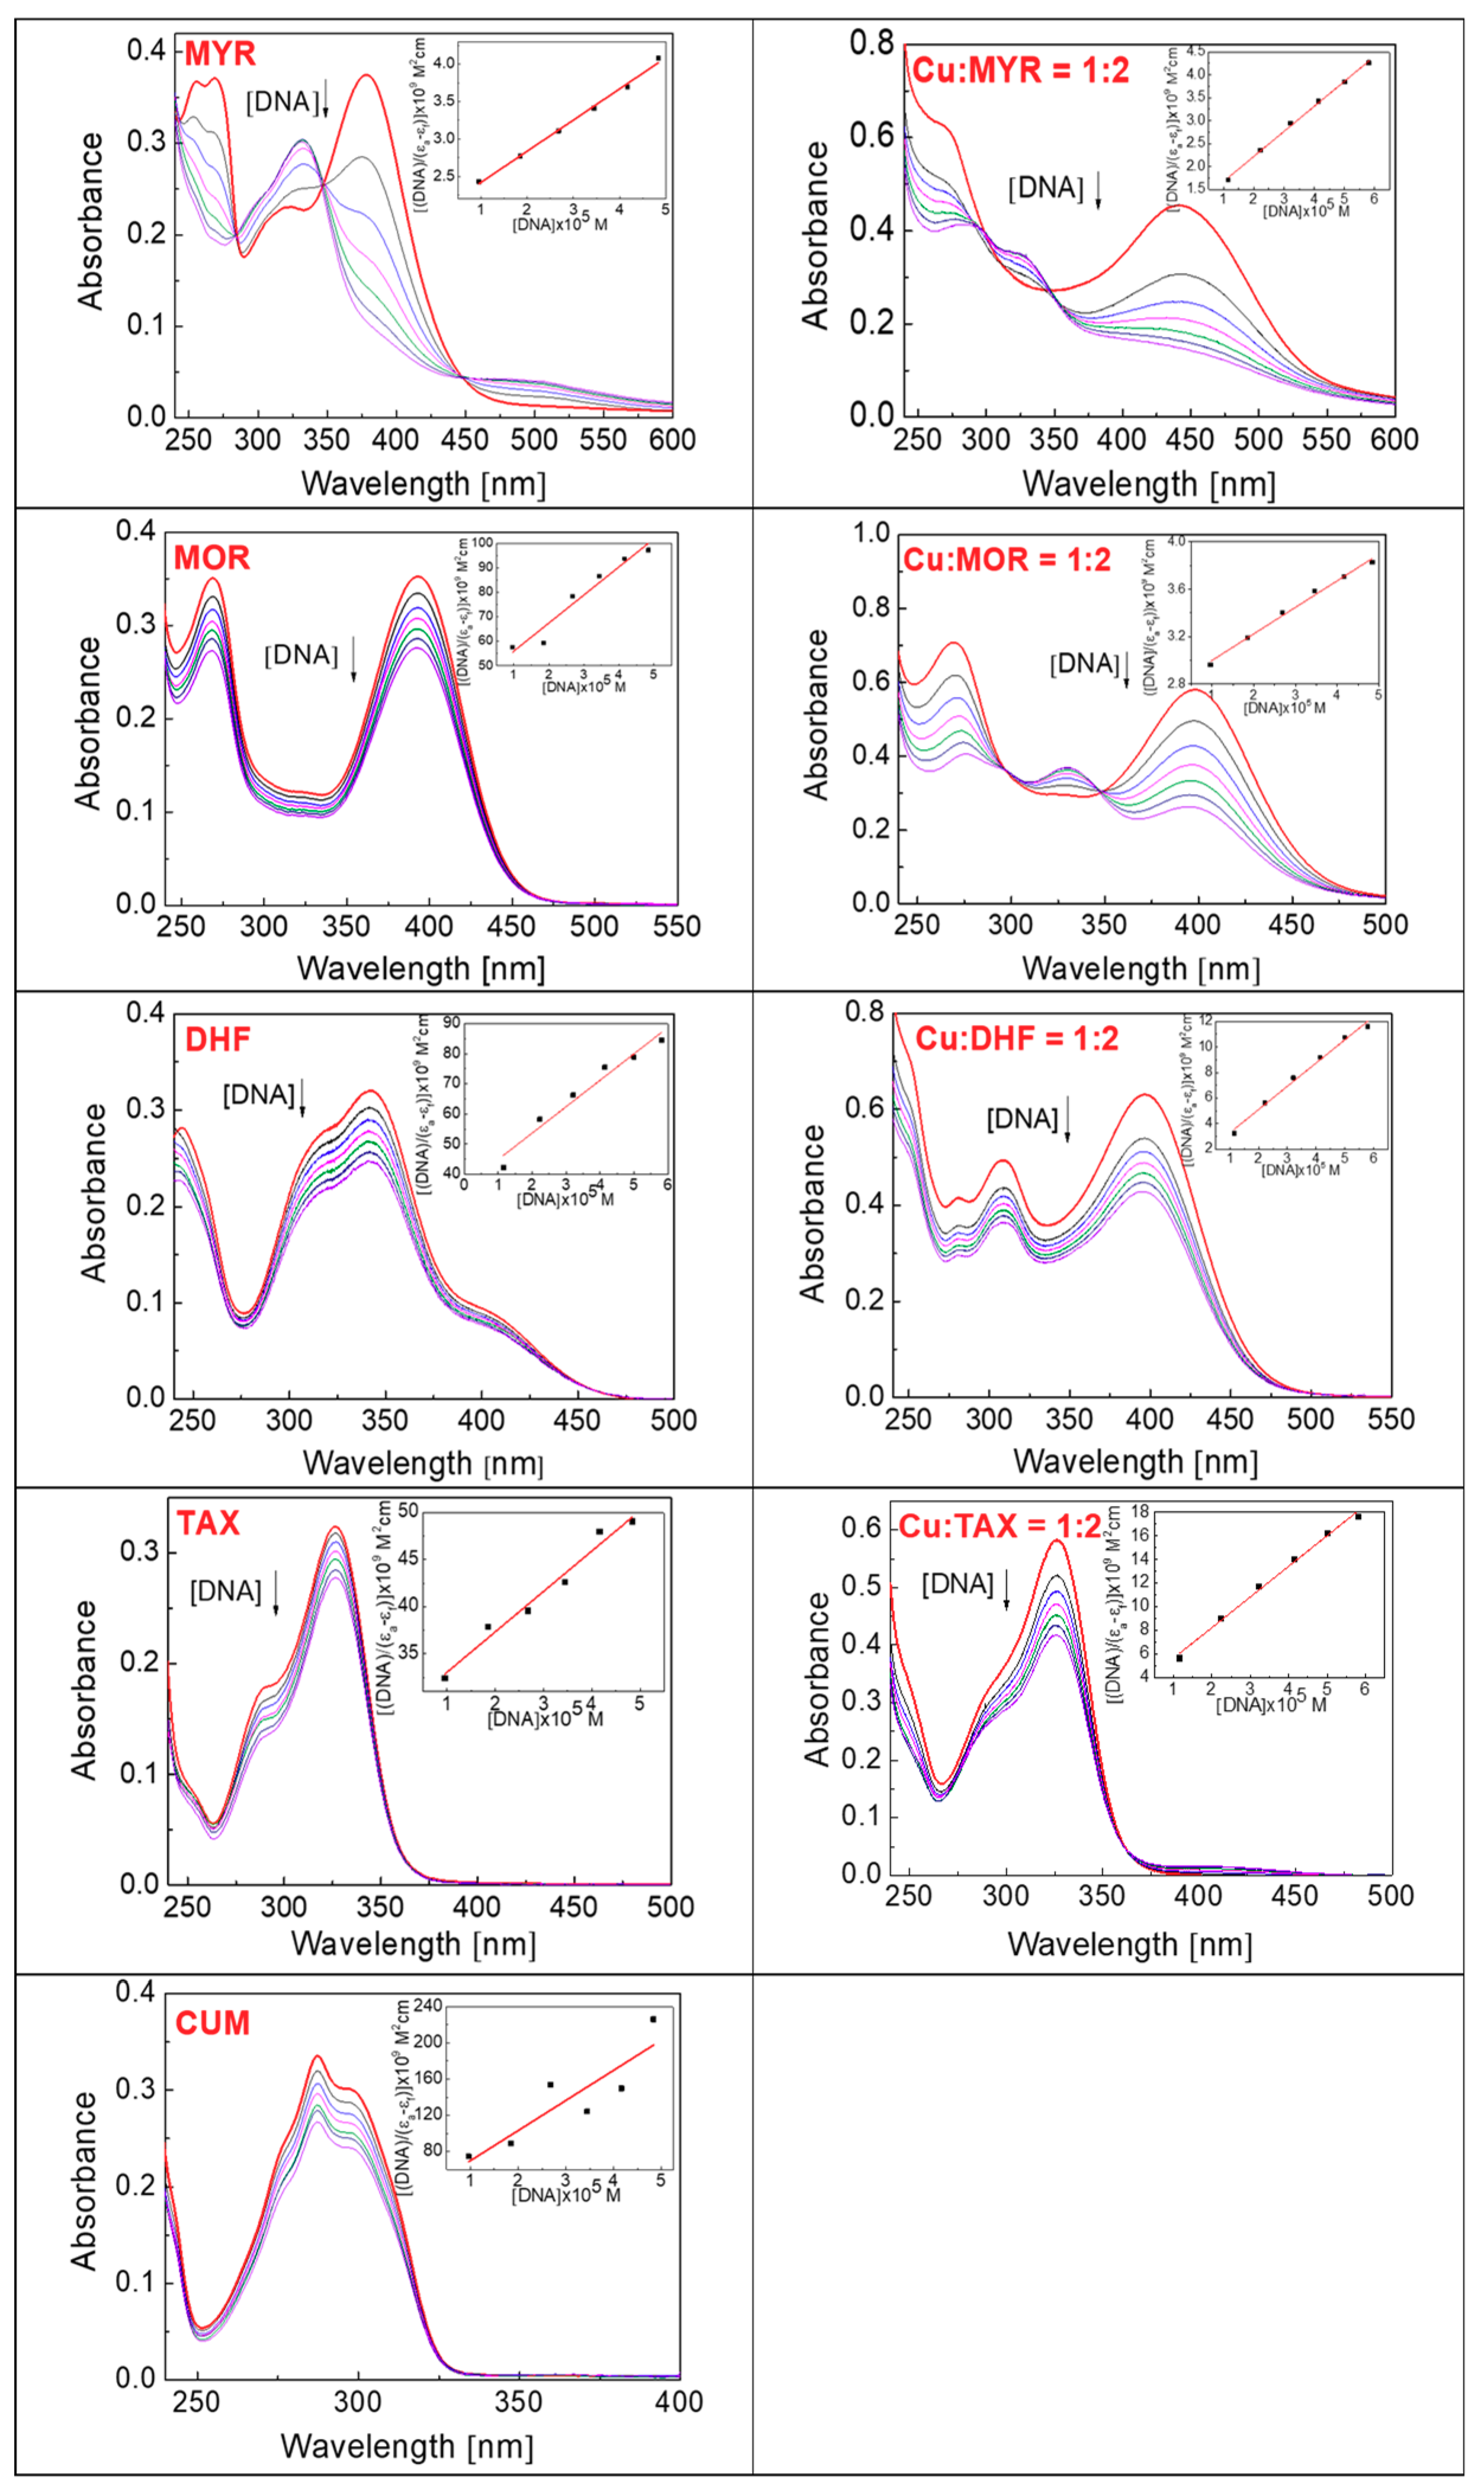
2.3. DNA Interaction Studies Using Absorption Titrations
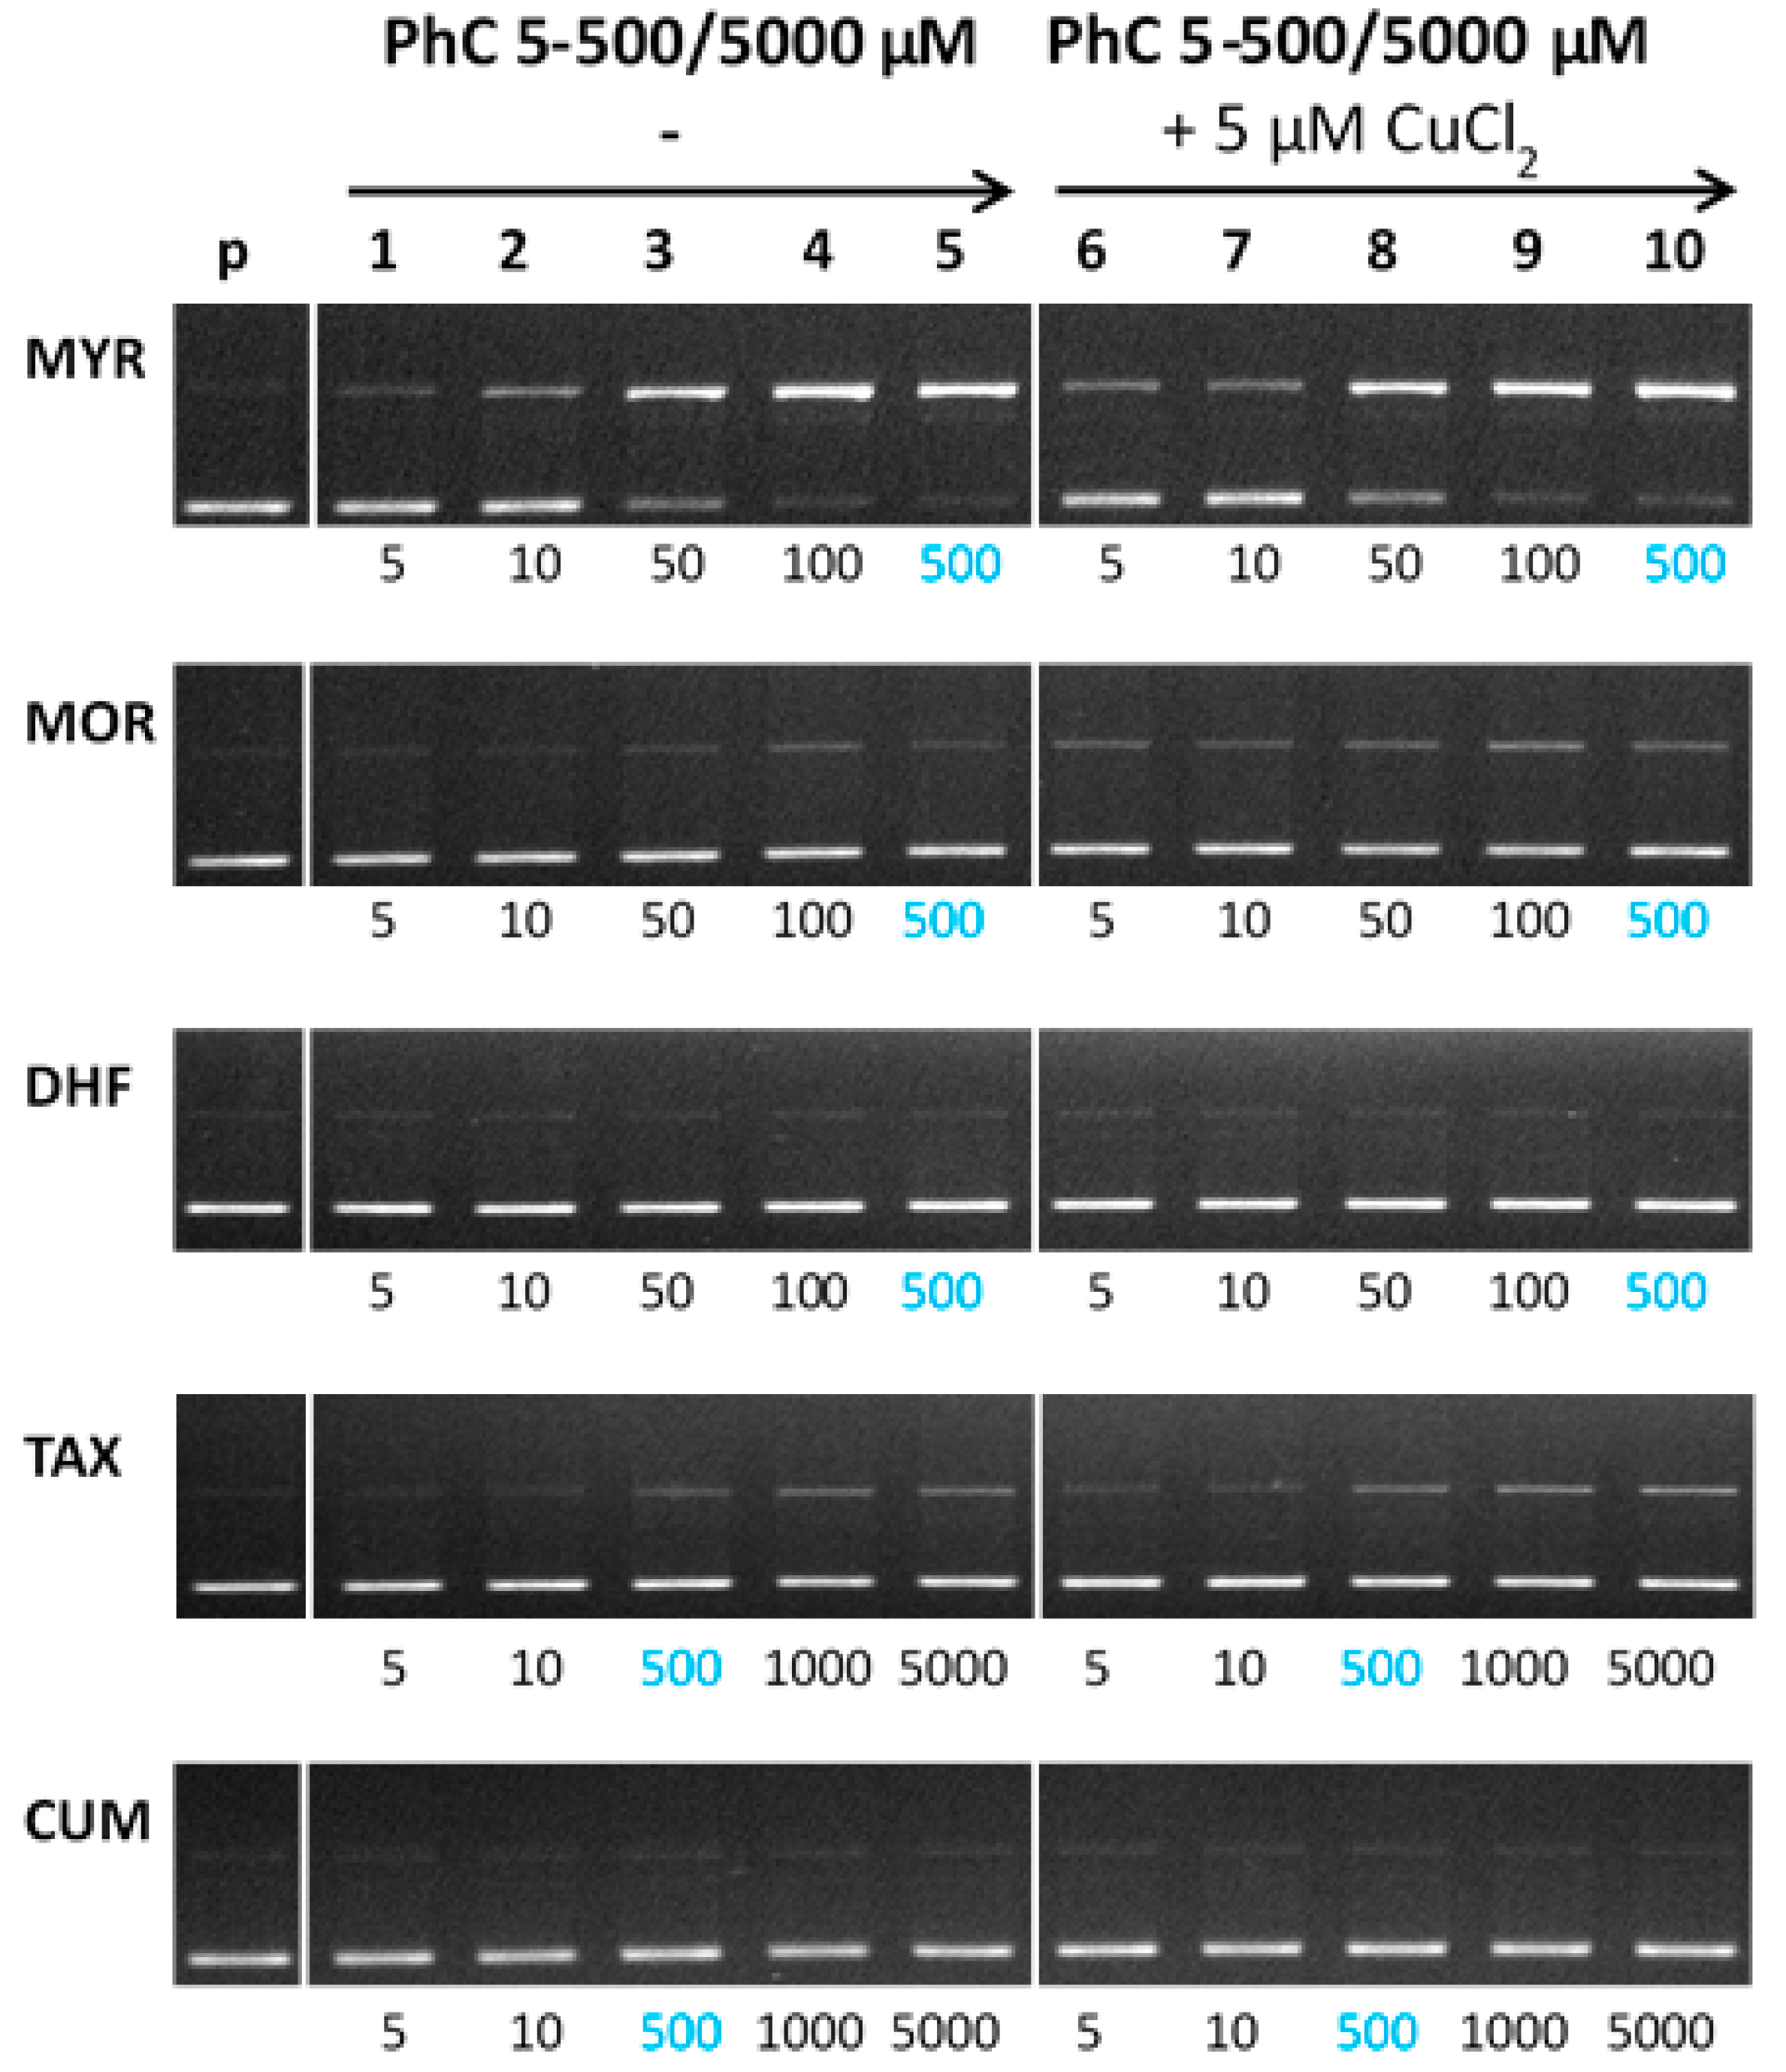
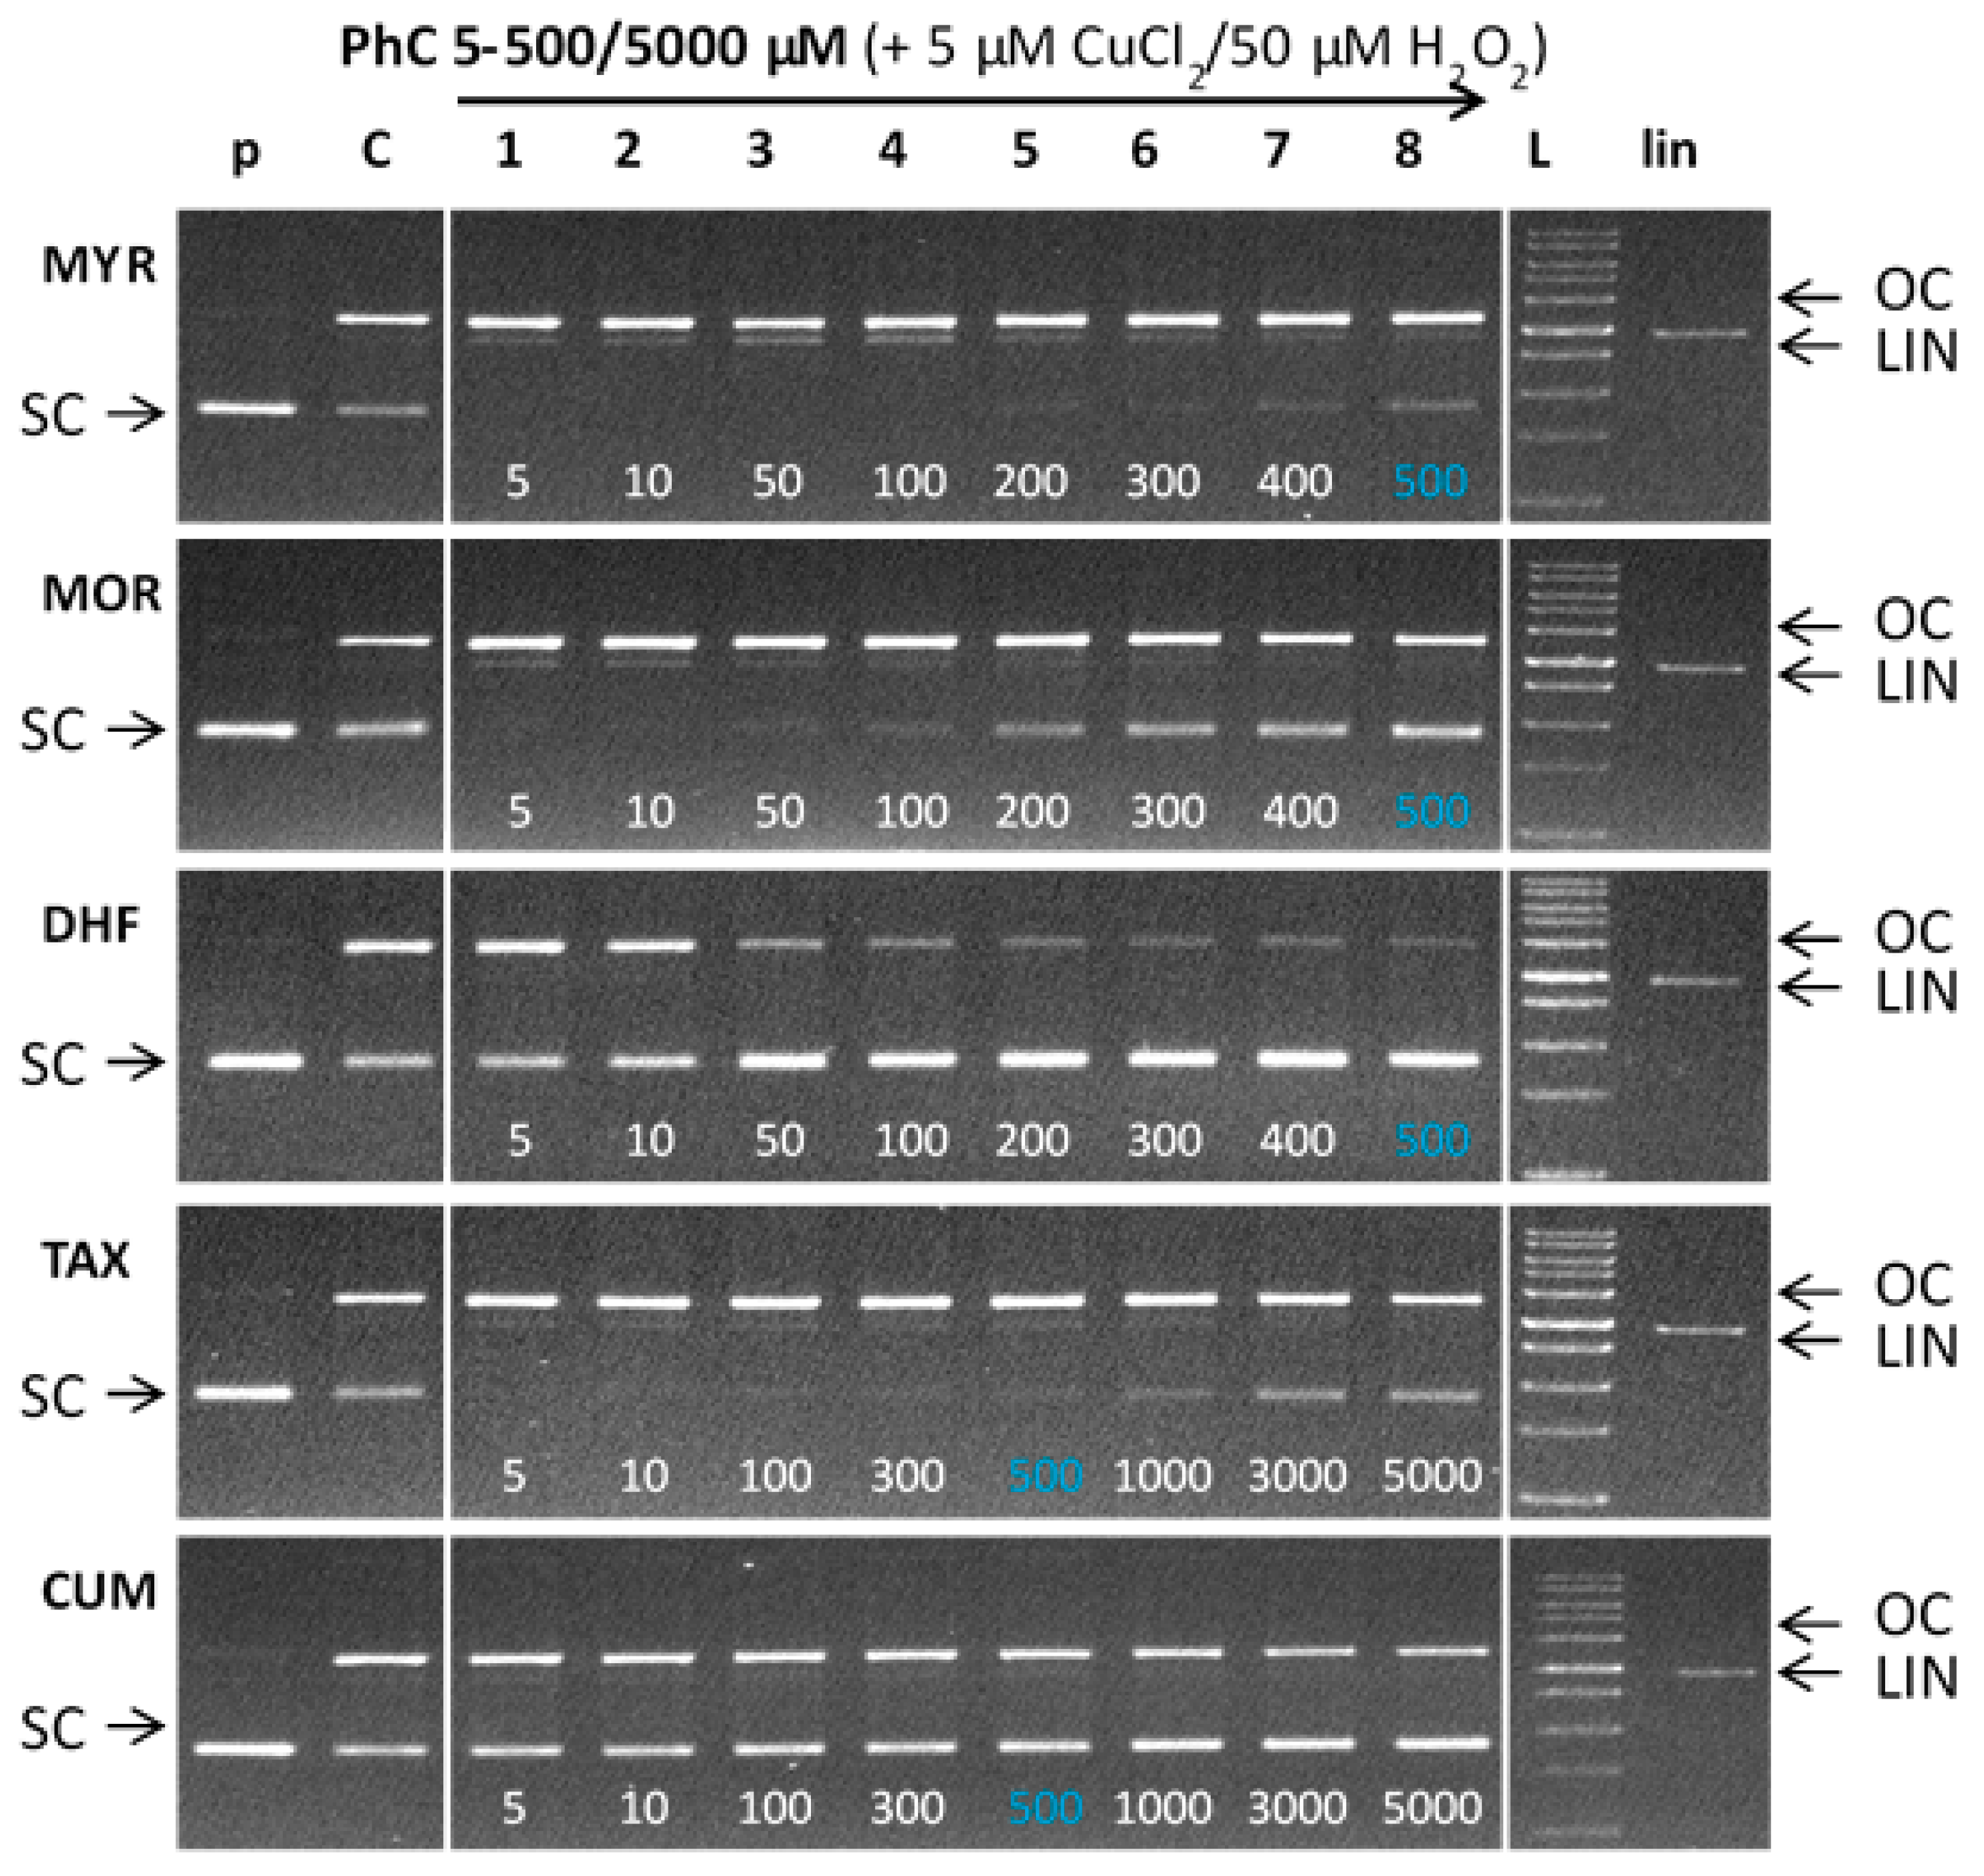
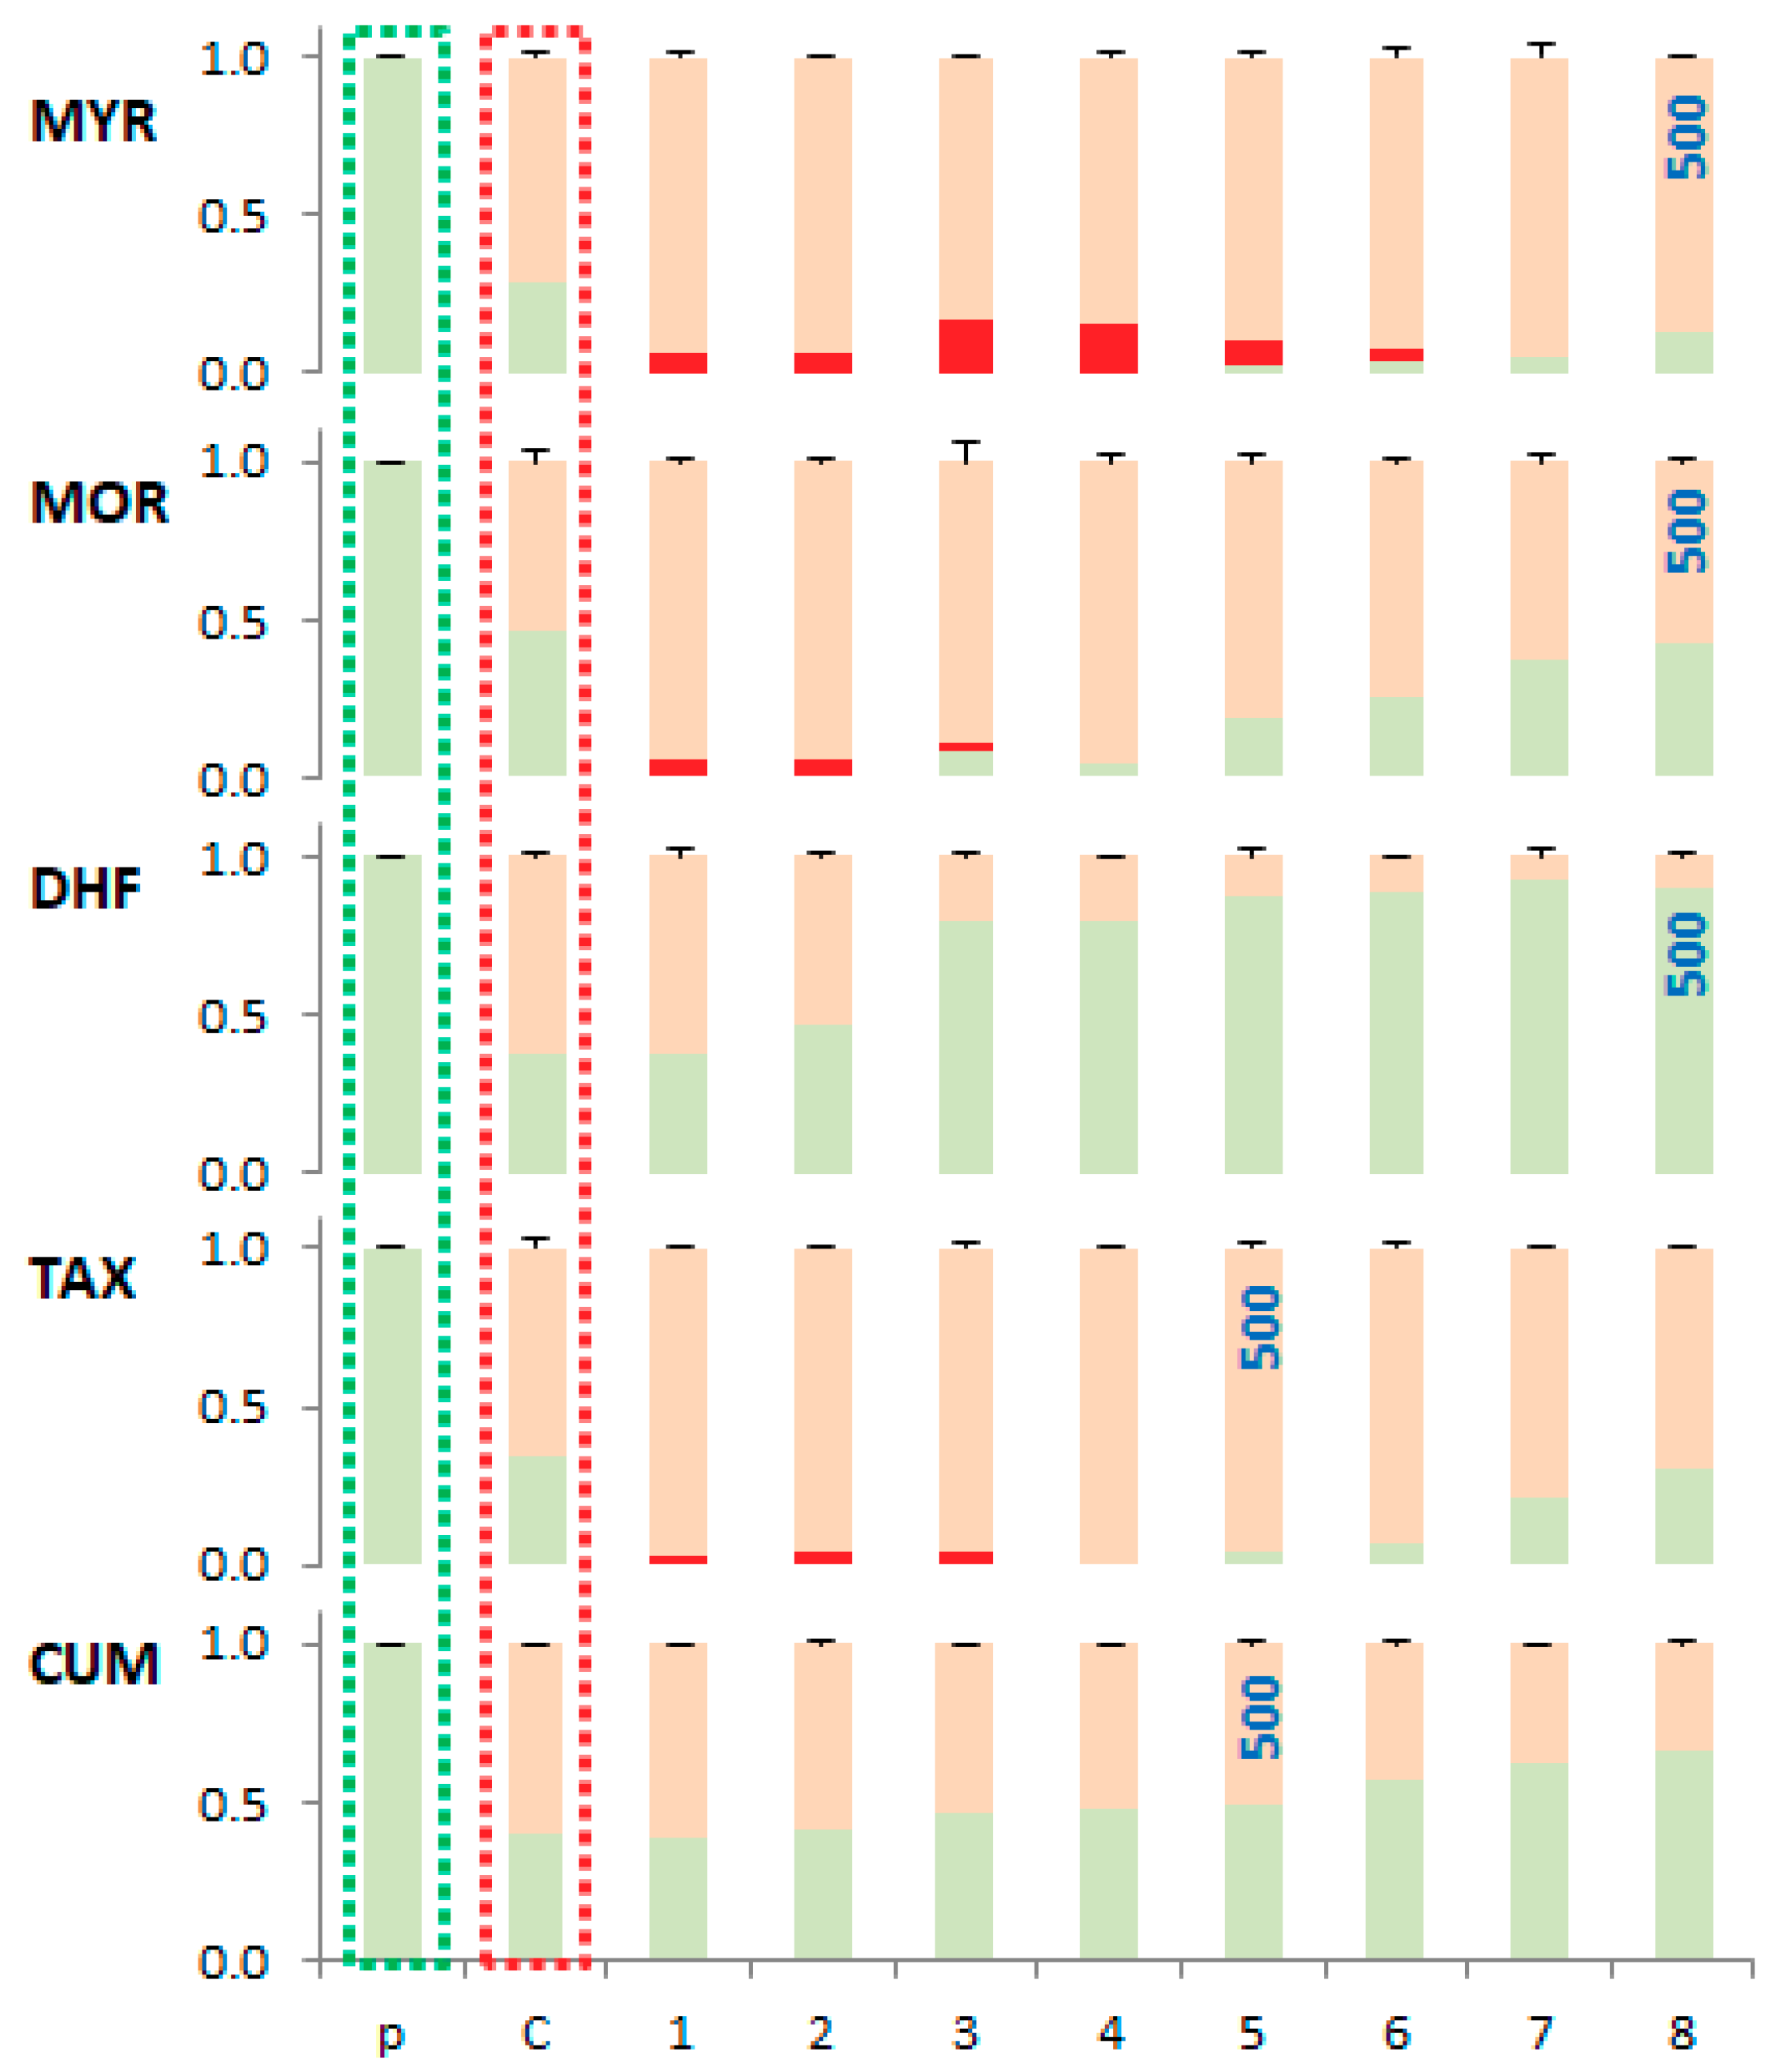
2.4. Protective Effect of Phenolic Compounds against DNA Damage
2.5. Qualitative Analysis of ROS Formation
3. Materials and Methods
3.1. Materials
3.2. Experimental Solutions
3.3. UV-Vis Spectroscopic Studies
3.4. EPR Spectroscopy
3.5. ABTS Radical Scavenging Activity
3.6. Electronic Absorption Titrations
3.7. Gel Electrophoresis
3.8. Identification of ROS
4. Conclusions
Author Contributions
Funding
Conflicts of Interest
References
- Ebrahimi, A.; Schluesener, H. Natural polyphenols against neurodegenerative disorders: Potentials and pitfalls. Ageing Res. Rev. 2012, 11, 329–345. [Google Scholar] [CrossRef] [PubMed]
- Brunetti, C.; Fini, A.; Sebastiani, F.; Gori, A.; Tattini, M. Modulation of Phytohormone Signaling: A Primary Function of Flavonoids in Plant-Environment Interactions. Front. Plant. Sci. 2018, 9, 1042. [Google Scholar] [CrossRef] [PubMed]
- Halliwell, B. Flavonoids: A Re-run of the carotenoids story? In Dietary Supplements and Health; Novartis Foundation: Basel, Switzerland, 2007. [Google Scholar] [CrossRef]
- Simunkova, M.; Alwasel, S.H.; Alhazza, I.M.; Jomova, K.; Kollar, V.; Rusko, M.; Valko, M. Management of oxidative stress and other pathologies in Alzheimer’s disease. Arch. Toxicol. 2019, 93, 2491–2513. [Google Scholar] [CrossRef] [PubMed]
- Grazul, M.; Budzisz, E. Biological activity of metal ions complexes of chromones, coumarins and flavones. Coord. Chem. Rev. 2009, 253, 2588–2598. [Google Scholar] [CrossRef]
- Fraga, C.G. Plant Phenolics and Human Health: Biochemistry, Nutrition, and Pharmacology; Wiley: Hoboken, NJ, USA, 2010; p. 593. [Google Scholar] [CrossRef]
- Samsonowicz, M.; Regulska, E. Spectroscopic study of molecular structure, antioxidant activity and biological effects of metal hydroxyflavonol complexes. Spectrochim. Acta Part A Mol. Biomol. Spectr. 2017, 173, 757–771. [Google Scholar] [CrossRef] [PubMed]
- De Souza, R.F.; De Giovani, W.F. Antioxidant properties of complexes of flavonoids with metal ions. Redox Rep. 2004, 9, 97–104. [Google Scholar] [CrossRef]
- Rusak, G.; Piantanida, I.; Masić, L.; Kapuralin, K.; Durgo, K.; Kopjar, N. Spectrophotometric analysis of flavonoid-DNA interactions and DNA damaging/protecting and cytotoxic potential of flavonoids in human peripheral blood lymphocytes. Chem-Biol. Interact. 2010, 188, 181–189. [Google Scholar] [CrossRef]
- Kumar, S.; Pandey, A.K. Chemistry and Biological Activities of Flavonoids: An Overview. Sci. World J. 2013, 162750. [Google Scholar] [CrossRef]
- Dehghan, G.; Khoshkam, Z. Tin(II)–quercetin complex: Synthesis, spectral characterisation and antioxidant activity. Food Chem. 2012, 131, 422–426. [Google Scholar] [CrossRef]
- van Acker, S.A.; van den Berg, D.J.; Tromp, M.N.; Griffioen, D.H.; van Bennekom, W.P.; van der Vijgh, W.J.; Bast, A. Structural aspects of antioxidant activity of flavonoids. Free Radic. Biol. Med. 1996, 20, 331–342. [Google Scholar] [CrossRef]
- Williams, R.J.; Spencer, J.P.; Rice-Evans, C. Flavonoids: Antioxidants or signalling molecules? Free Radic. Biol. Med. 2004, 36, 838–849. [Google Scholar] [CrossRef] [PubMed]
- Rice-Evans, C. Flavonoids and isoflavones: Absorption, metabolism, and bioactivity. Free Radic. Biol. Med. 2004, 36, 827–828. [Google Scholar] [CrossRef] [PubMed]
- Jomova, K.; Lawson, M.; Drostinova, L.; Lauro, P.; Poprac, P.; Brezova, V.; Michalik, M.; Lukes, V.; Valko, M. Protective role of quercetin against copper(II)-induced oxidative stress: A spectroscopic, theoretical and DNA damage study. Food Chem. Toxicol. 2017, 110, 340–350. [Google Scholar] [CrossRef] [PubMed]
- Heřmánková, E.; Zatloukalová, M.; Biler, M.; Sokolová, R.; Bancířová, M.; Tzakos, A.G.; Křen, V.; Kuzma, M.; Trouillas, P.; Vacek, J. Redox properties of individual quercetin moieties. Free Radic. Biol. Med. 2019, 143, 240–251. [Google Scholar] [CrossRef]
- Szabados-Furjesi, P.; Pajtas, D.; Barta, D.; Czepanyi, E.; Kiss-Szikszai, A.; Tosaki, A.; Bak, I. Synthesis, in vitro evaluation, and oxidative transformation of new flavonoid derivatives: The possible role of the phenyl-N,N dimethylamino group. Molecules 2018, 23, 3161. [Google Scholar] [CrossRef]
- Eghbaliferiz, S.; Iranshahi, M. Prooxidant Activity of Polyphenols, Flavonoids, Anthocyanins and Carotenoids: Updated Review of Mechanisms and Catalyzing Metals. Phytother. Res. 2016, 30, 1379–1391. [Google Scholar] [CrossRef]
- Selvaraj, S.; Krishnaswamy, S.; Devashya, V.; Sethuraman, S.; Krishnan, U.M. Flavonoid-metal ion complexes: A novel class of therapeutic agents. Med. Res. Rev. 2014, 34, 677–702. [Google Scholar] [CrossRef]
- Kobayashi, S.; Kanai, S. Superoxide scavenging effects of some novel bis-ligands and their solvated metal complexes prepared by the reaction of ligands with aluminum, copper and lanthanum ions. Molecules 2013, 18, 6128–6141. [Google Scholar] [CrossRef]
- Barolli, M.G.; Werner, R.A.; Slep, L.D.; Pomilio, A.B. Formation of complexes of flavonoids and metals. Determ. Stoichiom. Stab. Constants Mol. 2000, 5, 516–517. [Google Scholar] [CrossRef]
- Liu, Y.; Guo, M. Studies on transition metal-quercetin complexes using electrospray ionization tandem mass spectrometry. Molecules 2015, 20, 8583–8594. [Google Scholar] [CrossRef]
- Křížová, L.; Dadáková, K.; Kašparovská, J.; Kašparovský, T. Isoflavones. Molecules 2019, 24, 1076. [Google Scholar] [CrossRef] [PubMed]
- Valko, M.; Morris, H.; Mazur, M.; Telser, J.; McInnes, E.J.L.; Mabbs, F.E. High-Affinity Binding Site for Copper(II) in Human and Dog Serum Albumins (an EPR Study). J. Phys. Chem. B 1999, 103, 5591–5597. [Google Scholar] [CrossRef]
- Woźnicka, E.; Kopacz, M.; Umbreit, M.; Kłos, J. New complexes of La(III), Ce(III), Pr(III), Nd(III), Sm(III), Eu(III) and Gd(III) ions with morin. J. Inorg. Biochem. 2007, 101, 774–782. [Google Scholar] [CrossRef] [PubMed]
- Kasprzask, M.M.; Erxleben, A.; Ochocki, J. Properties and applications of flavonoid metal complexes. RSC Adv. 2015, 5, 45853–45877. [Google Scholar] [CrossRef]
- Malesev, D.; Kuntic, V. Investigation of metal-flavonoid chelates and the determination of flavonoids via metal-flavonoid complexing reactions. J. Serb. Chem. Soc. 2007, 72, 921–939. [Google Scholar] [CrossRef]
- Jovanovic, S.V.; Steenken, S.; Tosic, M.; Marjanovic, B.; Simic, M.G. Flavonoids as Antioxidants. J. Am. Chem. Soc. 1994, 116, 4846–4851. [Google Scholar] [CrossRef]
- Wang, T.Y.; Li, Q.; Bi, K.S. Bioactive flavonoids in medicinal plants: Structure, activity and biological fate. Asian J. Pharmacol. Sci. 2018, 13, 12–23. [Google Scholar] [CrossRef]
- Panhwar, Q.K.; Memon, S.; Bhanger, M.I. Synthesis, characterization, spectroscopic and antioxidation studies of Cu(II)–morin complex. J. Mol. Struct. 2010, 967, 47–53. [Google Scholar] [CrossRef]
- Li, X.; Jiang, Q.; Chen, B.; Luo, X.; Chen, D. Structure Activity Relationship and Prediction of the Electron-Transfer Potential of the Xanthones Series. Chem. Open 2018, 7, 730–736. [Google Scholar] [CrossRef]
- Shubina, V.S.; Shatalin, Y.V. Antioxidant and iron-chelating properties of taxifolin and its condensation product with glyoxylic acid. J. Food Sci. Technol. 2017, 54, 1467–1475. [Google Scholar] [CrossRef]
- Riha, M.; Karlickova, J.; Filipsky, T.; Macakova, K.; Rocha, L.; Bovicelli, P.; Silvestri, I.P.; Saso, L.; Jahodar, L.; Hrdina, R.; et al. In vitro evaluation of copper-chelating properties of flavonoids. RSC Adv. 2014, 4, 32628–32638. [Google Scholar] [CrossRef]
- Cao, G.; Sofic, E.; Prior, R.L. Antioxidant and prooxidant behavior of flavonoids: Structure-activity relationships. Free Radic. Biol. Med. 1997, 22, 749–760. [Google Scholar] [CrossRef]
- Perron, N.R.; Brumaghim, J.L. Review of the Antioxidant Mechanisms of Polyphenol Compounds Related to Iron Binding. Cell Biochem. Biophys. 2009, 53, 75–100. [Google Scholar] [CrossRef] [PubMed]
- Mehta, J.V.; Gajera, S.B.; Patel, M.N. Antimalarial, antimicrobial, cytotoxic, DNA interaction and SOD like activities of tetrahedral copper(II) complexes. Spectrochim. Acta Part A Mol. Biomol. Spectr. 2015, 136, 1881–1892. [Google Scholar] [CrossRef] [PubMed]
- Vyas, K.M.; Jadeja, R.N.; Patel, D.; Devkar, R.V.; Gupta, V.K. Effect of ligand substitution in pyrazolone based binary and ternary Cu(II) complexes on DNA binding, protein binding and anti-cancer activity on A549 lung carcinoma cell lines. Polyhedron 2014, 80, 20–33. [Google Scholar] [CrossRef]
- Patel, M.N.; Patidar, A.P. DNA interactions and promotion in antibacterial activities of the norfloxacin drug due to formation of mixed-ligand copper(II) complexes. Monatsh. Chem. 2014, 145, 369–381. [Google Scholar] [CrossRef]
- Patel, M.N.; Joshi, H.N.; Patel, C.R. Cytotoxic, antibacterial, DNA interaction and superoxide dismutase like activities of sparfloxacin drug based copper(II) complexes with nitrogen donor ligands. Spectrochim. Acta-Part A Mol. Biomol. Spectrosc. 2013, 104, 48–55. [Google Scholar] [CrossRef]
- Tolia, C.; Papadopoulos, A.N.; Raptopoulou, C.P.; Psycharis, V.; Garino, C.; Salassa, L.; Psomas, G. Copper(II) interacting with the non-steroidal antiinflammatory drug flufenamic acid: Structure, antioxidant activity and binding to DNA and albumins. J. Inorg. Biochem. 2013, 123, 53–65. [Google Scholar] [CrossRef]
- Topala, T.; Bodoki, A.; Oprean, L.; Oprean, R. Experimental techniques employed in the study of metal complexes-DNA-interactions. Farmacia 2014, 62, 1049–1061. [Google Scholar]
- Bhuiya, S.; Chowdhury, S.; Haque, L.; Das, S. Spectroscopic, photophysical and theoretical insight into the chelation properties of fisetin with copper (II) in aqueous buffered solutions for calf thymus DNA binding. Int. J. Biol. Macromol. 2018, 120, 1156–1169. [Google Scholar] [CrossRef]
- Sohrabi, N. Binding And UV/Vis Spectral Investigation of Interaction of Ni(II) Piroxicam Complex With Calf Thymus Deoxyribonucleic Acid (Ct-DNA): A Thermodynamic Approach. J. Pharm. Sci. Res. Vol. 2015, 7, 533–537. [Google Scholar]
- Liu, J.; Zhang, T.; Lu, T.; Qu, L.; Zhou, H.; Zhang, Q.; Ji, L. DNA-binding and cleavage studies of macrocyclic copper(II) complexes. J. Inorg. Biochem. 2002, 91, 269–276. [Google Scholar] [CrossRef]
- Sirajuddin, M.; Ali, S.; Badshah, A. Drug-DNA interactions and their study by UV-Visible, fluorescence spectroscopies and cyclic voltametry. J. Photochem. Photobiol. B. 2013, 124, 1–19. [Google Scholar] [CrossRef] [PubMed]
- Dorotíková, S.; Kožíšková, J.; Malček, M.; Jomová, K.; Herich, P.; Plevová, K.; Briestenská, K.; Chalupková, A.; Mistríková, J.; Milata, V.; et al. Copper(II) complexes with new fluoroquinolones: Synthesis, structure, spectroscopic and theoretical study, DNA damage, cytotoxicity and antiviral activity. J. Inorg. Biochem. 2015, 150, 160–173. [Google Scholar] [CrossRef]
- Battin, E.E.; Brumaghim, J.L. Antioxidant activity of sulfur and selenium: A review of reactive oxygen species scavenging, glutathione peroxidase, and metal-binding antioxidant mechanisms. Cell. Biochem. Biophys. 2009, 55, 1–23. [Google Scholar] [CrossRef]
- Imran, M.; Salehi, B.; Sharifi-Rad, J.; Gondal, T.A.; Saeed, F.; Imran, A.; Shahbaz, M.; Fokou, P.V.T.; Arshad, M.U.; Khan, H.; et al. Kaempferol: A key emphasis to its anticancer potential. Molecules 2019, 24, 2277. [Google Scholar] [CrossRef]
- Catapano, M.C.; Protti, M.; Fontana, T.; Mandrioli, R.; Mladěnka, P.; Mercolini, L. An Original HPLC Method with Coulometric Detection to Monitor Hydroxyl Radical Generation via Fenton Chemistry. Molecules 2019, 24, 3066. [Google Scholar] [CrossRef]
- Brezova, V.; Valko, M.; Breza, M.; Morris, H.; Telser, J.; Dvoranova, D.; Kaiserova, K.; Varecka, L.; Mazur, M.; Leibfritz, D. Role of Radicals and Singlet Oxygen in Photoactivated DNA Cleavage by the Anticancer Drug Camptothecin: An Electron Paramagnetic Resonance Study. J. Phys. Chem. B 2003, 107, 2415–2425. [Google Scholar] [CrossRef]
- Poprac, P.; Jomova, K.; Simunkova, M.; Kollar, V.; Rhodes, C.J.; Valko, M. Targeting Free Radicals in Oxidative Stress-Related Human Diseases. Trends Pharmacol. Sci. 2017, 38, 592–607. [Google Scholar] [CrossRef]
- Mazúr, M.; Valko, M.; Morris, H. Analysis of the radial and longitudinal effect in a double TE(104) and a single TE(102) rectangular cavity. J. Magn. Reson. 2000, 142, 37–56. [Google Scholar] [CrossRef]
- Ciulu, M.; Cádiz-Gurrea, M.L.; Segura-Carretero, A. Extraction and Analysis of Phenolic Compounds in Rice: A Review. Molecules 2018, 23, 2890. [Google Scholar] [CrossRef] [PubMed]
- Pyle, A.M.; Rehmann, J.P.; Meshoyrer, R.; Kumar, C.V.; Turro, N.J.; Barton, J.K. Mixed-Ligand Complexes of Ruthenium: Factors Governing Binding to DNA. J. Am. Chem. Soc. 1989, 111, 3051–3058. [Google Scholar] [CrossRef]
- Perron, N.R.; García, C.R.; Pinzón, J.R.; Chaur, M.N.; Brumaghim, J.L. Antioxidant and prooxidant effects of polyphenol compounds on copper-mediated DNA damage. J. Inorg. Biochem. 2011, 105, 745–753. [Google Scholar] [CrossRef] [PubMed]
- Mori, A.; Nishino, C.; Enoki, N.; Tawata, S. Antibacterial activity and mode of action of plant flavonoids against Proteus vulgaris and Staphylococcus aureus. Phytochemistry 1987, 26, 2231–2234. [Google Scholar] [CrossRef]
- Sak, K. Cytotoxicity of dietary flavonoids on different human cancer types. Pharmacogn. Rev. 2014, 8, 122–146. [Google Scholar] [CrossRef]
- Romanucci, V.; Di Fabio, G.; Zarrelli, A. A new class of synthetic flavonolignan-like dimers: Still few molecules, but with attractive properties. Molecules 2019, 24, 108. [Google Scholar] [CrossRef]
- Rodríguez-García, C.; Sánchez-Quesada, C.; Toledo, E.; Delgado-Rodríguez, M.; Gaforio, J.J. Naturally lignan-rich foods: A dietary tool for health promotion? Molecules 2019, 24, 917. [Google Scholar] [CrossRef]
- Hussain, G.; Zhang, L.; Rasul, A.; Anwar, H.; Sohail, M.U.; Razzaq, A.; Aziz, N.; Shabbir, A.; Ali, M.; Sun, T. Role of plant-derived flavonoids and their mechanism in attenuation of Alzheimer’s and Parkinson’s diseases: An update of recent data. Molecules 2018, 23, 814. [Google Scholar] [CrossRef]
- Martinez-Gonzalez, A.I.; Díaz-Sánchez, A.G.; De La Rosa, L.A.; Vargas-Requena, C.L.; Bustos-Jaimes, I.; Alvarez-Parrilla, E. Polyphenolic compounds and digestive enzymes: In vitro non-covalent interactions. Molecules 2017, 22, 669. [Google Scholar] [CrossRef] [PubMed]
- Kachlicki, P.; Piasecka, A.; Stobiecki, M.; Marczak, Ł. Structural characterization of flavonoid glycoconjugates and their derivatives with mass spectrometric techniques. Molecules 2016, 21, 1494. [Google Scholar] [CrossRef]
- Cirmi, S.; Ferlazzo, N.; Lombardo, G.E.; Ventura-Spagnolo, E.; Gangemi, S.; Calapai, G.; Navarra, M. Neurodegenerative diseases: Might citrus flavonoids play a protective role? Molecules 2016, 21, 1312. [Google Scholar] [CrossRef] [PubMed]
- Mierziak, J.; Kostyn, K.; Kulma, A. Flavonoids as important molecules of plant interactions with the environment. Molecules 2014, 19, 16240–16265. [Google Scholar] [CrossRef] [PubMed]
Sample Availability: Samples of the compounds are available from the authors. |


| % Inhibition | |||||
|---|---|---|---|---|---|
| MYR | MOR | DHF | TAX | CUM | |
| PhC | 98.10 ± 1.42 | 74.05 ± 0.41 | 36.56 ± 0.77 | 21.79 ± 0.71 | 35.67 ± 0.77 |
| Cu:PhC (1:1) | 81.50 ± 1.48 | 69.22 ± 1.36 | 38.02 ± 1.12 | 23.71 ± 0.34 | 36.62 ± 1.20 |
| Cu:PhC (1:2) | 79.66 ± 1.76 | 60.59 ± 1.66 | 38.82 ± 1.32 | 29.19 ± 0.45 | 36.28 ± 1.13 |
| Phenolic Compound | Band 1 | ↓↑ % →/← nm | Band 2 | ↓↑ % →/← nm | Band 3 | ↓↑ % →/← nm |
|---|---|---|---|---|---|---|
| MYR | 267 nm | ↓ 45.95 → 8 nm | 322 nm | ↑ 23.33 → 10 nm | 378 nm | ↓ 72.97 ← 5 nm |
| Cu-MYR | 267 nm | ↓ 36.51 ← 5 nm | 346 nm | ↑ 23.33 ← 21 nm | 441 nm | ↓ 66.67 → 2 nm |
| MOR | 269 nm | ↓ 22.86 - | 393 nm | ↓ 21.64 - | ||
| Cu-MOR | 269 nm | ↓ 42.25 → 7 nm | 330 nm | ↑ 21.62 - | 398 nm | ↓ 55.17 ← 2 nm |
| DHF | 244 nm | ↓ 17.86 ← 2 nm | 342 nm | ↓ 22.83 - | ||
| Cu-DHF | 281 nm | ↓ 26.83 - | 308 nm | ↓ 28.00 - | 397 nm | ↓ 31.75 - |
| TAX | 326 nm | ↓ 25.37 - | ||||
| Cu-TAX | 326 nm | ↓ 27.59 - | ||||
| CUM | 287 nm | ↓ 20.59 - |
| Flavonoid | MYR | MOR | DHF | TAX | CUM |
|---|---|---|---|---|---|
| FL | 2.07 × 10⁴ | 3.23 × 10⁴ | 2.43 × 10⁴ | 1.44 × 10⁴ | 6.61 × 10⁴ |
| Cu:FL (1:2) | 4.02 × 10⁴ | 8.08 × 10³ | 1.23 × 10⁵ | - | - |
© 2019 by the authors. Licensee MDPI, Basel, Switzerland. This article is an open access article distributed under the terms and conditions of the Creative Commons Attribution (CC BY) license (http://creativecommons.org/licenses/by/4.0/).
Share and Cite
Jomová, K.; Hudecova, L.; Lauro, P.; Simunkova, M.; Alwasel, S.H.; Alhazza, I.M.; Valko, M. A Switch between Antioxidant and Prooxidant Properties of the Phenolic Compounds Myricetin, Morin, 3′,4′-Dihydroxyflavone, Taxifolin and 4-Hydroxy-Coumarin in the Presence of Copper(II) Ions: A Spectroscopic, Absorption Titration and DNA Damage Study. Molecules 2019, 24, 4335. https://doi.org/10.3390/molecules24234335
Jomová K, Hudecova L, Lauro P, Simunkova M, Alwasel SH, Alhazza IM, Valko M. A Switch between Antioxidant and Prooxidant Properties of the Phenolic Compounds Myricetin, Morin, 3′,4′-Dihydroxyflavone, Taxifolin and 4-Hydroxy-Coumarin in the Presence of Copper(II) Ions: A Spectroscopic, Absorption Titration and DNA Damage Study. Molecules. 2019; 24(23):4335. https://doi.org/10.3390/molecules24234335
Chicago/Turabian StyleJomová, Klaudia, Lenka Hudecova, Peter Lauro, Miriama Simunkova, Saleh H. Alwasel, Ibrahim M. Alhazza, and Marian Valko. 2019. "A Switch between Antioxidant and Prooxidant Properties of the Phenolic Compounds Myricetin, Morin, 3′,4′-Dihydroxyflavone, Taxifolin and 4-Hydroxy-Coumarin in the Presence of Copper(II) Ions: A Spectroscopic, Absorption Titration and DNA Damage Study" Molecules 24, no. 23: 4335. https://doi.org/10.3390/molecules24234335
APA StyleJomová, K., Hudecova, L., Lauro, P., Simunkova, M., Alwasel, S. H., Alhazza, I. M., & Valko, M. (2019). A Switch between Antioxidant and Prooxidant Properties of the Phenolic Compounds Myricetin, Morin, 3′,4′-Dihydroxyflavone, Taxifolin and 4-Hydroxy-Coumarin in the Presence of Copper(II) Ions: A Spectroscopic, Absorption Titration and DNA Damage Study. Molecules, 24(23), 4335. https://doi.org/10.3390/molecules24234335