Article

Ultrahigh Performance Liquid Chromatography–Electrospray Ionization Tandem Mass Spectrometry Method for Qualitative and Quantitative Analyses of Constituents of Corydalis bungeana Turcz Extract

1
Key Laboratory of Chinese Materia Medical (Ministry of Education), Heilongjiang University of Chinese Medicine, Harbin 150040, China
2
Department of Pharmaceutical Analysis and Analytical Chemistry, College of Pharmacy, Harbin Medical University, No. 157 Baojian Road, Nangang District, Harbin 150081, China
3
Analytical Department, Johnson & Johnson, 199 Grandview Road, Skillman, NJ 08558, USA
*
Author to whom correspondence should be addressed.
These authors contributed equally to this work.
Molecules 2019, 24(19), 3463; https://doi.org/10.3390/molecules24193463
Submission received: 30 August 2019 / Revised: 17 September 2019 / Accepted: 19 September 2019 / Published: 24 September 2019

Abstract

:
In this study, the constituents of a Corydalis bungeana Turcz extract were qualitatively analyzed using gradient elution with a mobile phase of 0.2% acetic acid and acetonitrile. We obtained comprehensive insight into the constituents of C. bungeana Turcz extracts through the quantitative analysis of 14 compounds by comparison with authentic reference standards, and tentatively identified an additional 44 compounds through electrospray ionization mass spectrometry (ESI–MS) and tandem MS detection. The separation was successfully achieved using an Agilent SB-C18 column (1.8 µm, 150 × 2.1 mm; Agilent, Santa, CA, USA). A tandem quadrupole spectrometer was operated in either full-scan mode or multiple reaction monitoring (MRM) for the qualitative and quantitative analyses of the constituents, respectively. Validation data (inter-day and intra-day combined) for accuracy and precision ranged from −4.80% to 4.73%, and 0.30% to 4.97%, respectively. An ultrahigh performance liquid chromatographic–ESI–tandem MS (UHPLC–ESI–MS/MS) method for qualitative of C. bungeana Turcz (C. bungeana) extract and the quantification of 14 alkaloids, namely, A–N, was developed and validated. Quantitative analysis involved gradient elution with a mobile phase of 0.1% acetic acid and methanol for 45 min. The separation was successfully achieved using a Waters SB-C18 column (1.8 µm, 100 mm × 2.1 mm, Waters, Milford, Massachusetts, USA). The repeatability and stability of the method also met USFDA criteria with CV values lower than 5%. The limit of detection of the 14 alkaloids ranged from 9.74 to 13.00 ng/mL, whereas the linearities of the standard curves were between 0.9991 and 0.9995. In total, 15 commercial samples from 11 different sources were analyzed.

1. Introduction

The global market share of traditional Chinese medicine (TCM) has been growing, given their relatively few side effects in contrast to modern therapeutics. Corydalis bungeana Turcz, belonging to the Papaveraceae family, is a perennial herb grown in parts of China [1]. The dried whole plant, also considered C. bungeana in TCM, is included in the Chinese Pharmacopeia (2015 Edition) [2]. C. bungeana has long been used in China [3] for the treatment of different ailments such as hordeolum [4], icteric hepatitis [5], and hemorrhoids [6]. C. bungeana has many constituents including alkaloids, steroids, and flavonoid glycosides [7]. Among these components, the alkaloids are the most abundant active ingredients. Modern pharmacological studies have shown that isoquinoline alkaloids of Corydalis incisa have anti-inflammatory [4], antinociceptive [8], antibacterial [9,10], and other related activities. All 14 alkaloids mentioned above are the major constituents of C. bungeana that are responsible for its various activities.
Although the acceptance of herbal remedies is increasing worldwide, the problem of quality control remains. Various analytical methods, including colorimetry [11], high-performance liquid chromatography (HPLC) with UV detection [12,13,14], and thin-layer chromatography (TLC), have been applied to the qualitative or quantitative analysis of alkaloids in vitro. However, the lack of standard compounds and information are two key problems frequently encountered in identification work. Therefore, ultrahigh-performance liquid chromatography mass spectrometry (UHPLC–MS) is the best choice for qualitative analysis of the chemical components in plants. Especially given the absence of standards, UHPLC–MS has been commonly applied in the identification of minor components in TCMs. UHPLC–tandem MS (UHPLC–MS/MS) methods are fast and more selective and sensitive, and have become the primary choice for both qualitative and quantitative analyses of complex samples, such as TCMs. For example, Hossain developed a rapid UHPLC–MS/MS method to identify and quantify steroidal alkaloids of potato, and the method can be used in other potato varieties [15]. In our previous research, we isolated several alkaloids from C. bungeana extracts. In that work, we achieved full characterization of the chemical constituents of C. bungeana. Overall, the complexity of TCMs has been determined via the development of analysis techniques, leading to the separation and detection of more previously unidentified components. Owing to the high sensitivity of the multiple reaction monitoring (MRM) technique, liquid chromatography coupled with the triple quadrupole MS method has been extensively applied in quantitative analysis. To the best of our knowledge, no qualitative and quantitative methods for examining C. bungeana using UHPLC–ESI–MS/MS have been published. In the current research, we developed an UHPLC–ESI–MS/MS method for inferring the structure of the main constituents of C. bungeana and the validated UHPLC–ESI–MS/MS method with a positive MRM mode was used for the determination of 14 central alkaloids.

2. Results

2.1. Method Optimization

The results showed that the alkaloid content in the 70% ethanol extract was higher than in other experimental solvents or extraction methods, as determined using a method combining quantitative analysis and qualitative evaluation. The mobile phase was adjusted and optimized to achieve optimal separation and ionization efficiency. Acetic acid (0.2% for qualitative; 0.1% for quantitative) was used to adjust the pH value of the mobile phase. To achieve appropriate chromatographic separation, an Agilent SB-C18 column (1.8 µm, 150 mm × 2.1 mm; Agilent, Santa, CA, USA) was used to identify constituents of C. bungeana, and a Waters SB-C18 column (1.8 µm, 100 mm × 2.1 mm, Waters, Milford, MA, USA) was used for the quantitative analysis. The gradient ratio and column temperature were also optimized, and the gradient elution programs are listed in Tables S2 and S3. The column temperature of both methods was then set to 35 °C.

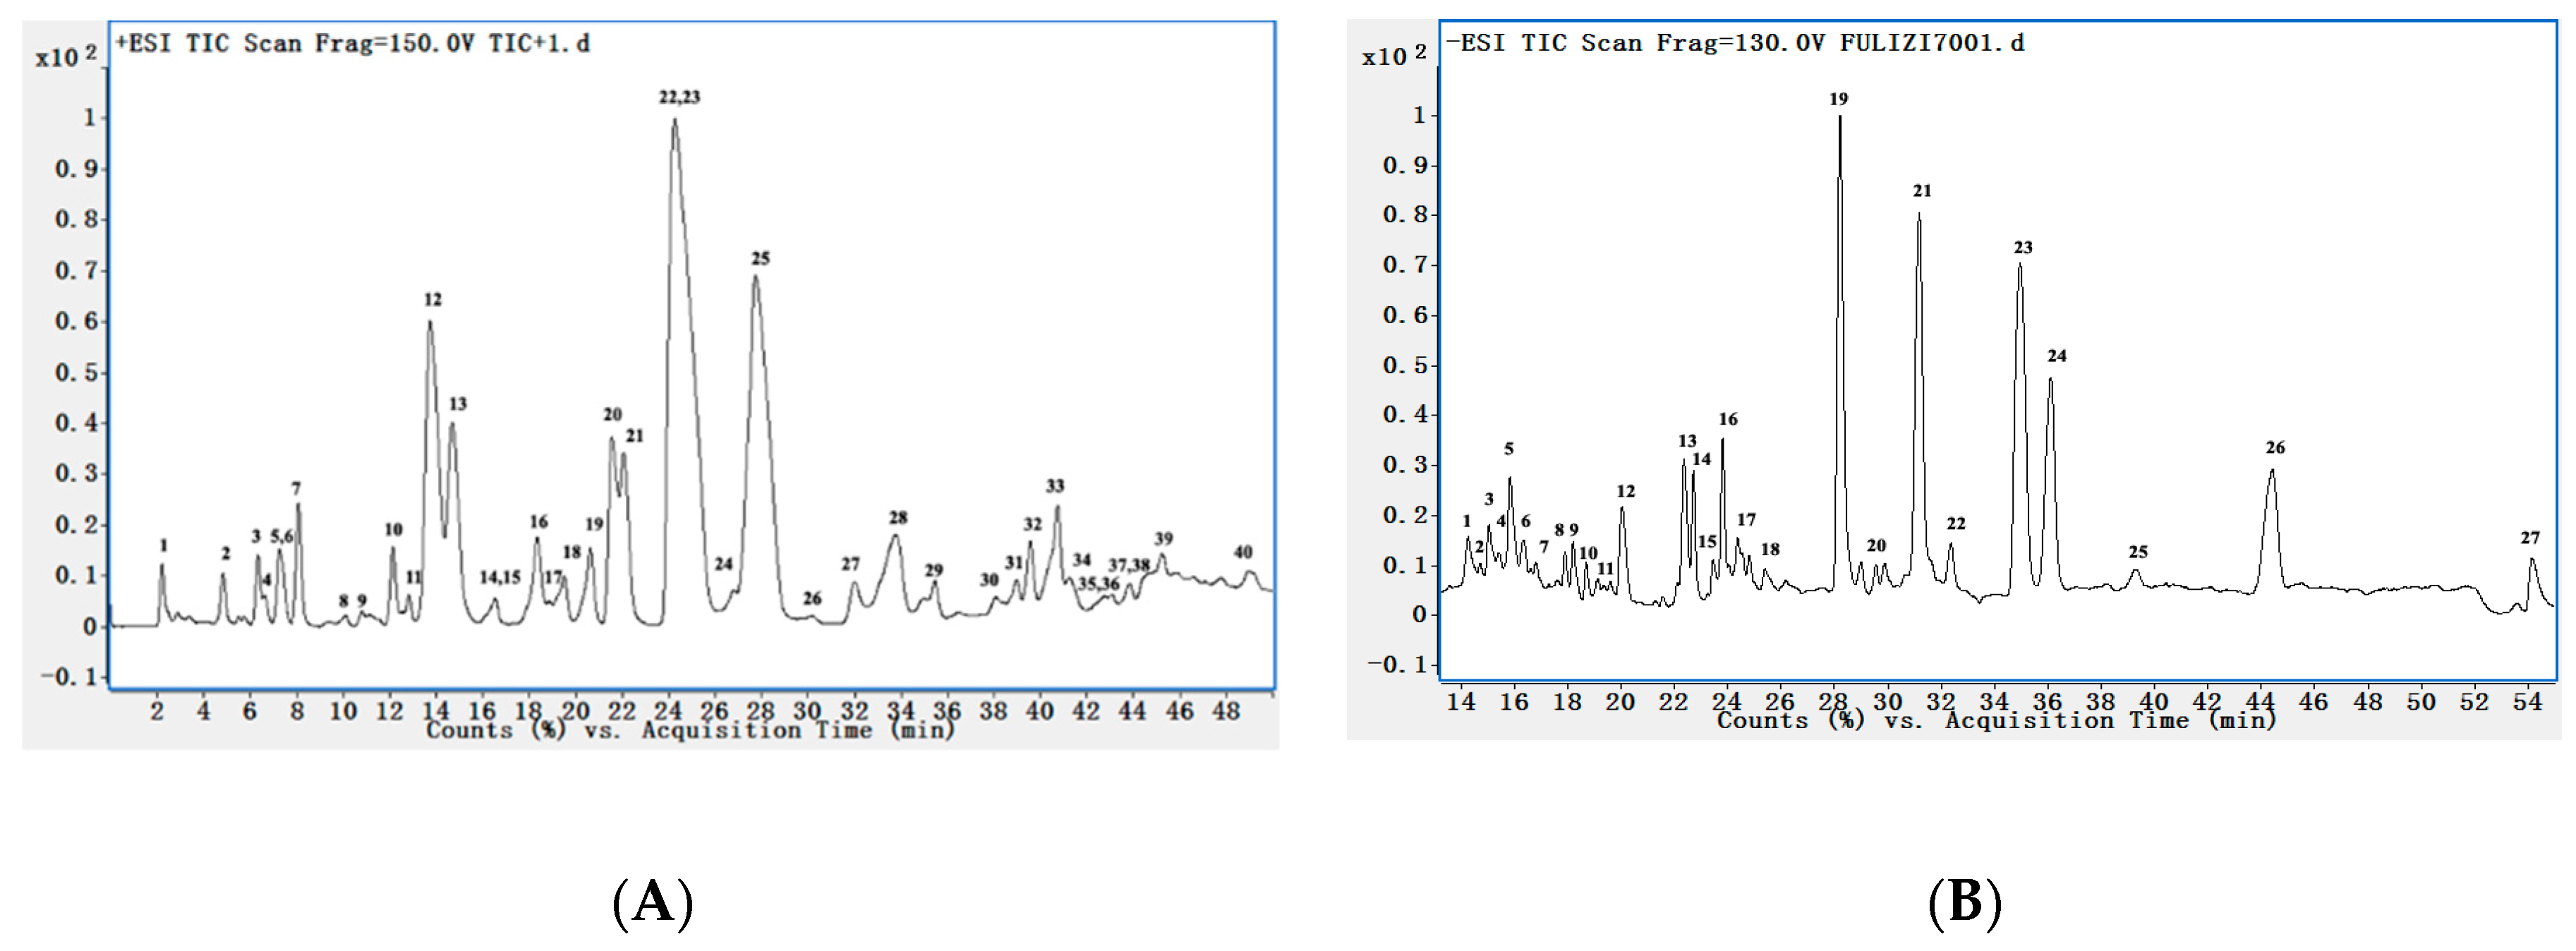
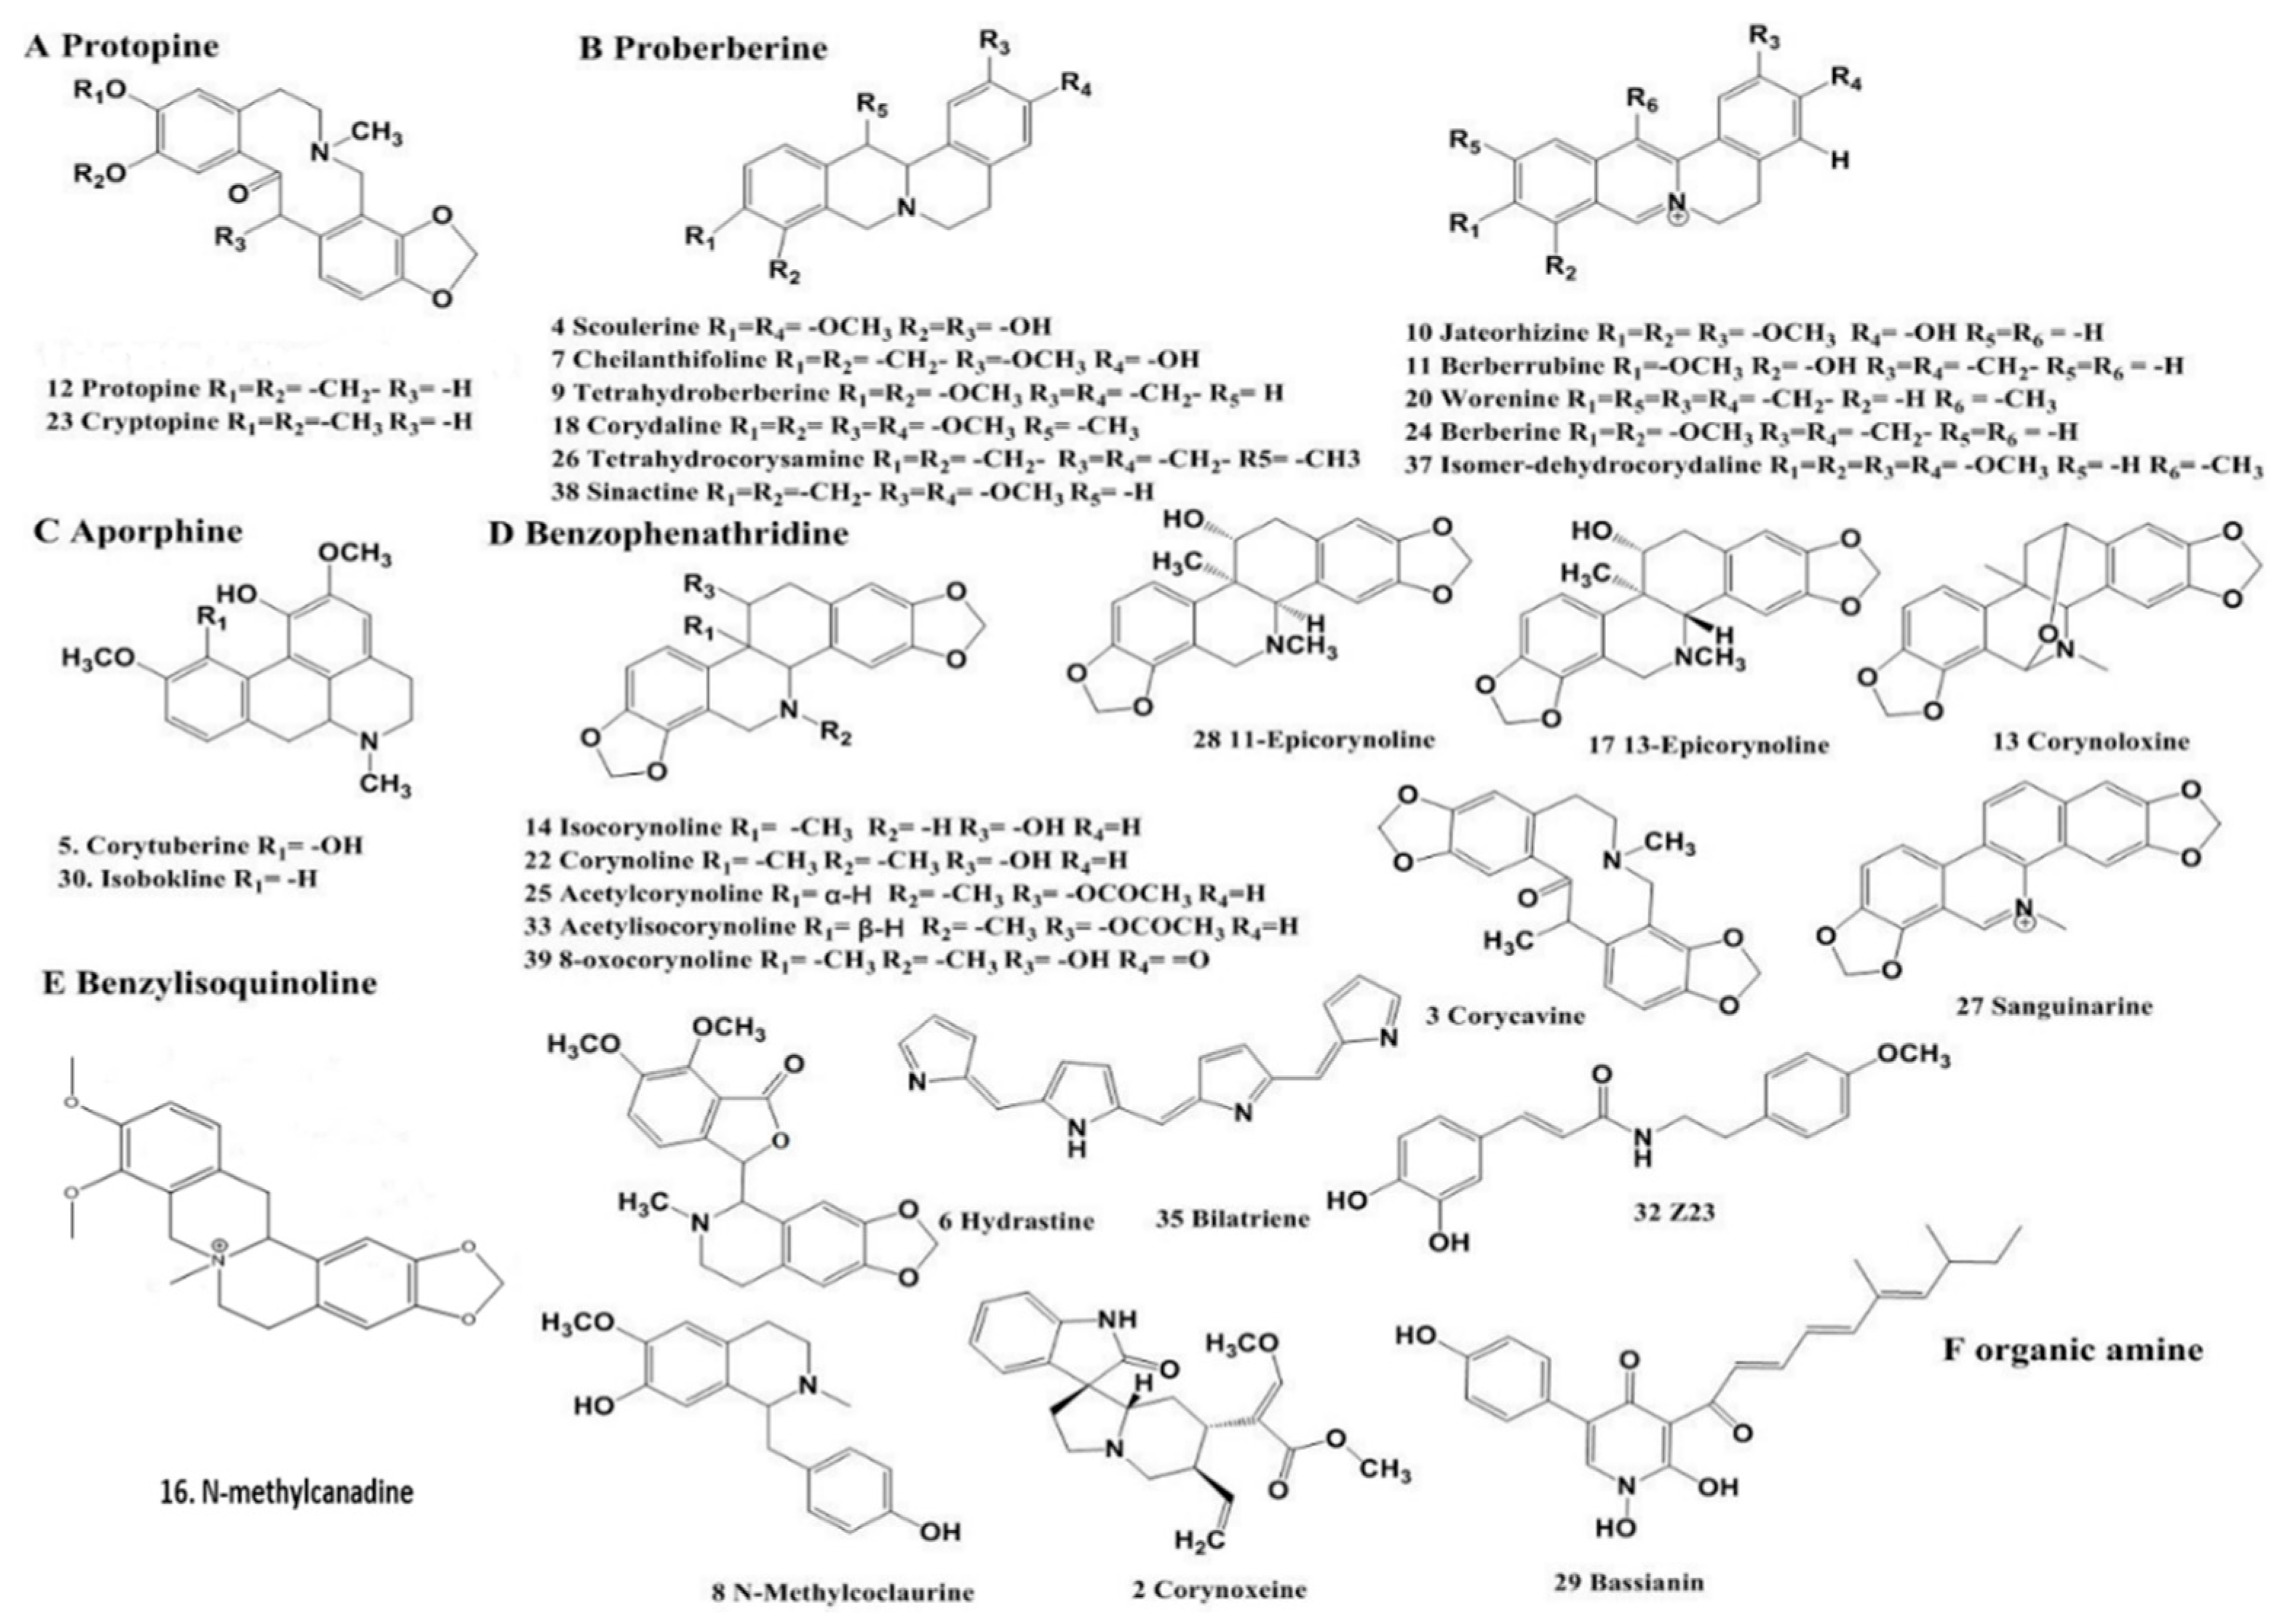
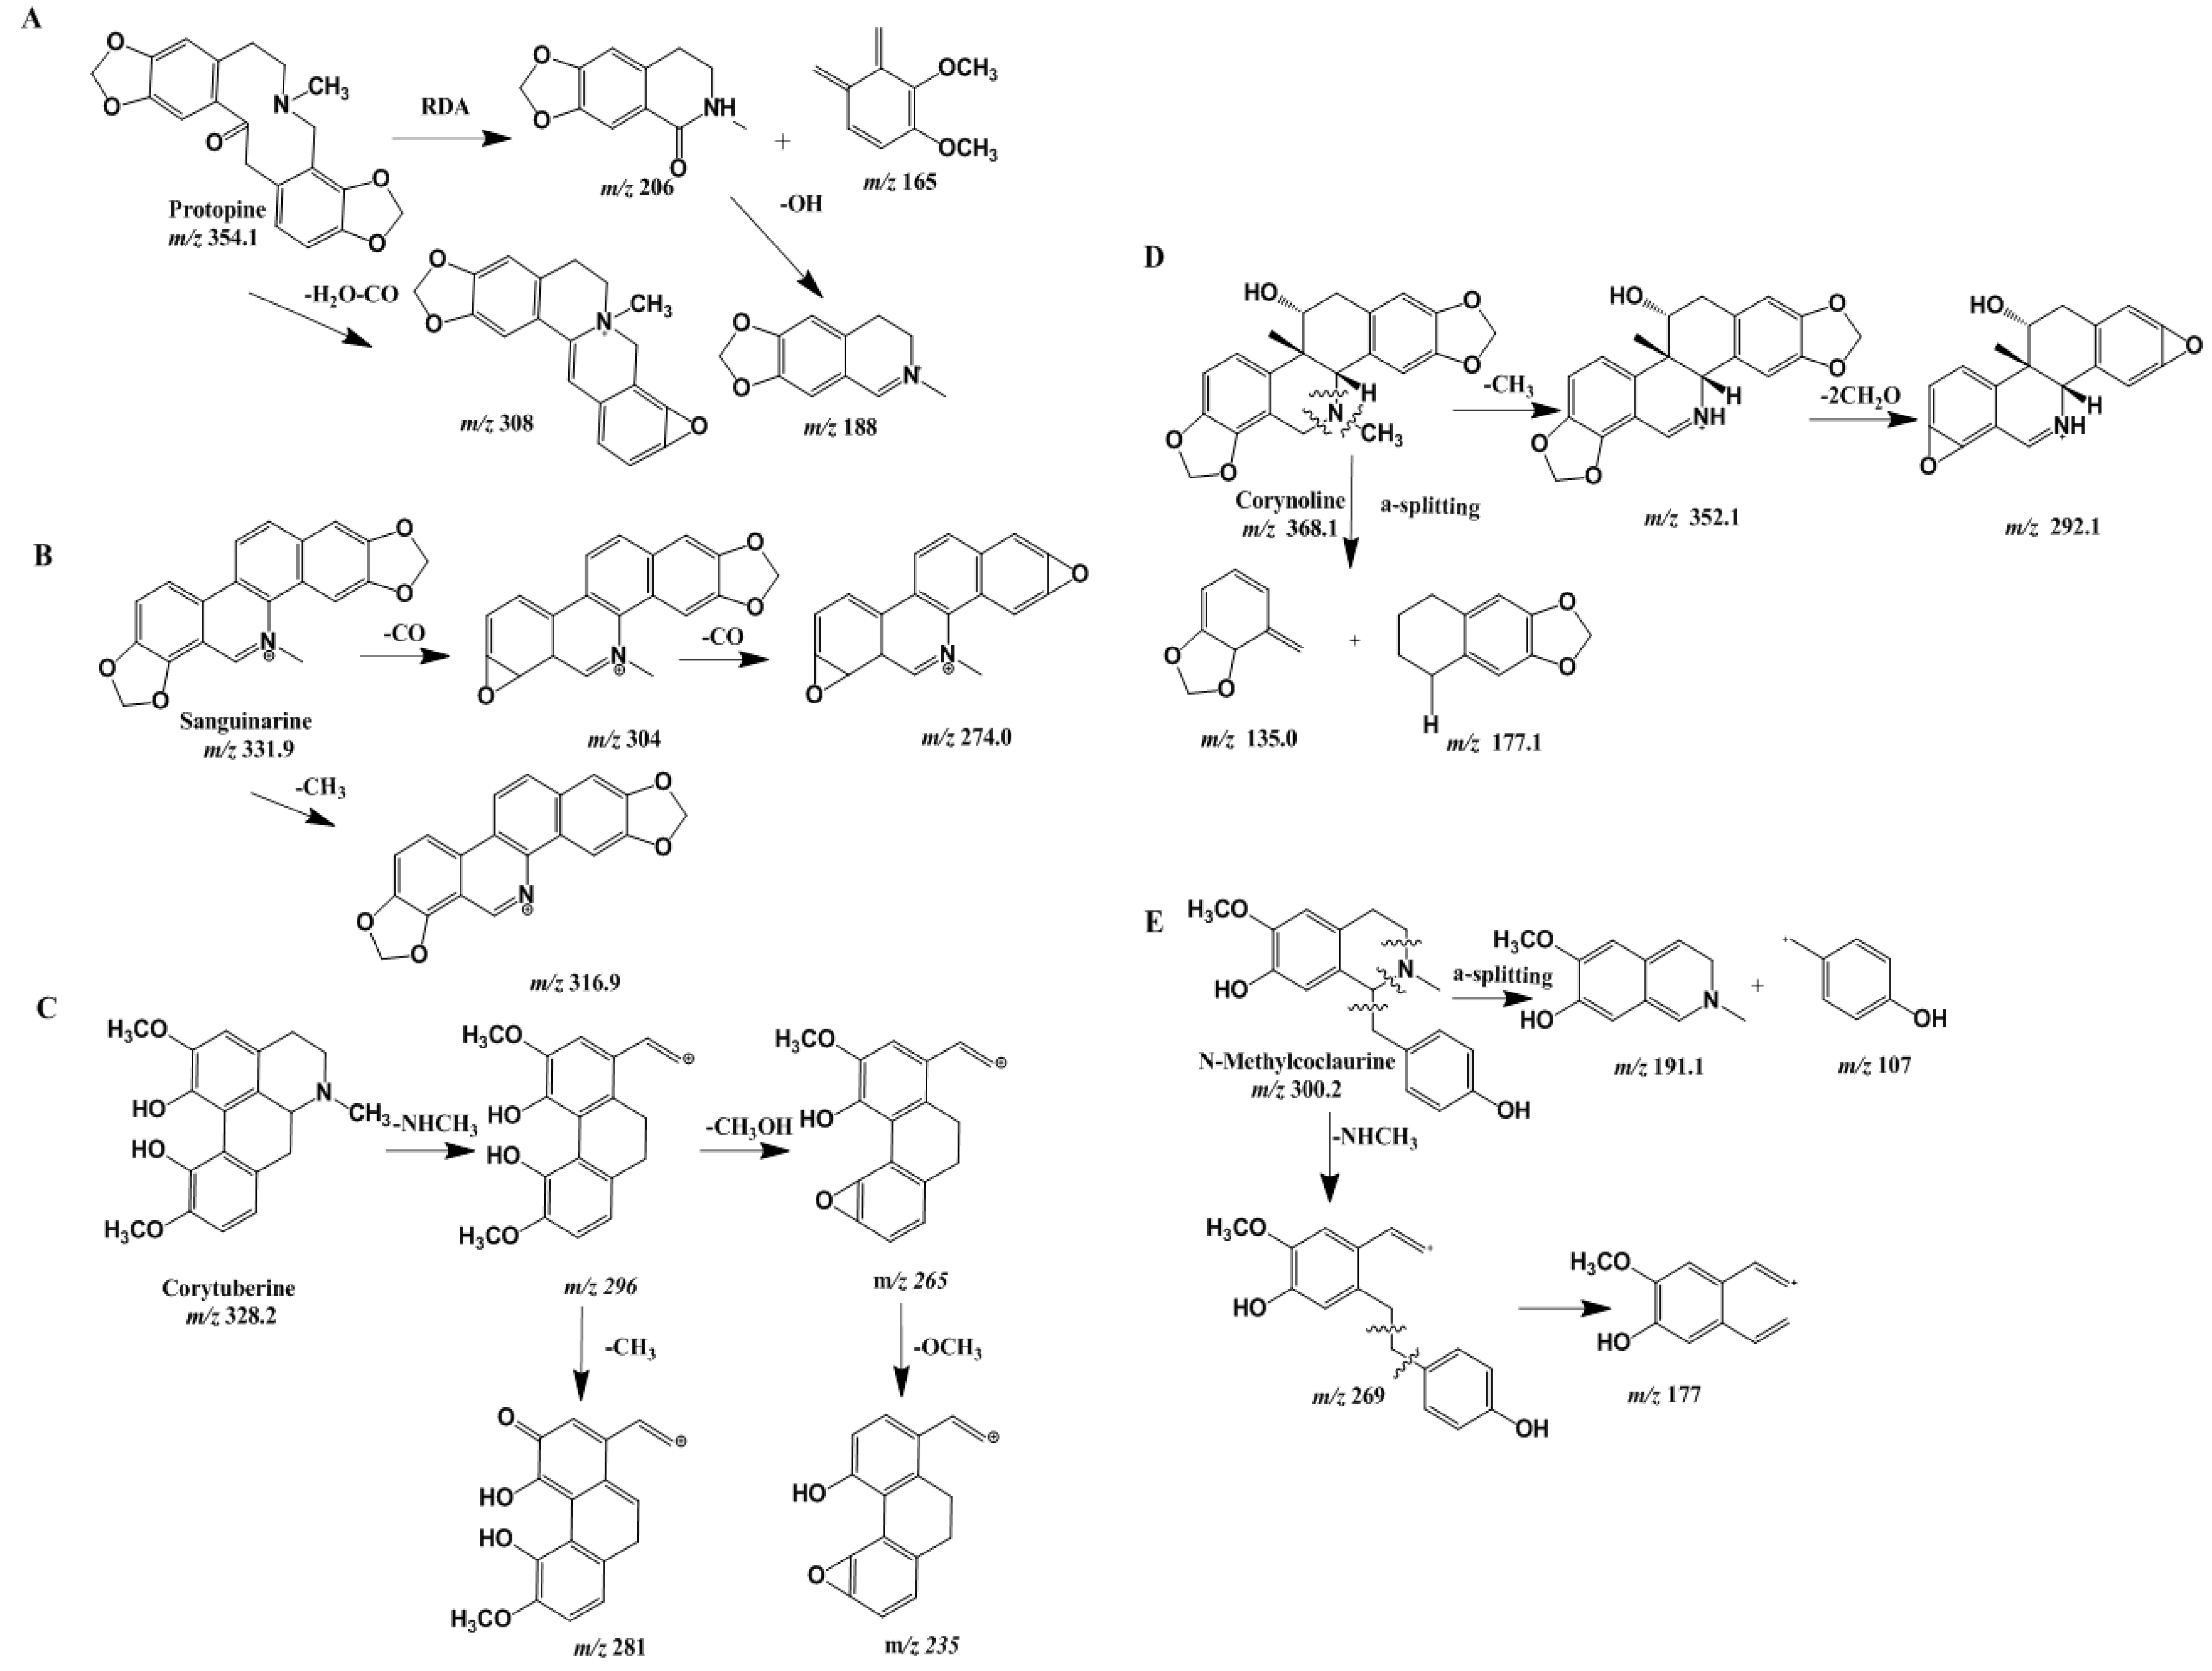
2.2. Qualitative Analysis

Through UHPLC–ESI–MS/MS analysis, we found that the positive ion mode is more suitable for alkaloid detection, and fragment ions of sufficient abundance can be stably detected. The aim of optimizing collision energy is to obtain suitable ion fragments using MS/MS. Over 67 peaks were detected within 50 min in the MS chromatogram of the 70% EtOH extract in both negative and positive ion modes (Figure 1). The compounds were tentative identified on the basis of UHPLC retention time as listed in Table 1 and Table 2. The possible chemical composition of the 44 compounds were inferred by means of rigorous study of their MS and MS/MS spectra, and we compared literature data and information from Agilent PCDL manager (Agilent, Santa, CA, USA). The deduced chemical structures of 32 constituents in positive ion mode are displayed in Figure 2. The quantification of alkaloids A–N was also confirmed by spiking samples with reference compounds that were available in our laboratory [16].

Fragmentation Regularity

Alkaloids are the main active compounds in C. bungeana. Approximately 42 different alkaloid compounds derived from C. bungeana have been reported so far, with ~105 alkaloid compounds reported from the species of the genus Corydalis [17]. The alkaloids are mainly isoquinoline alkaloids. Based on previous research, the isoquinoline alkaloids gained from this herb can be divided into the following types; protopine (A), proberberine (B), aporphine (C), benzophenanthridine (D), benzylisoquinoline (E), and others [16,18]. According to this classification, compounds 3, 12, and 23 are type A; compounds 4, 7, 9, 10, 11, 18, 20, 24, 26, 37, and 38 are type B; compounds 5 and 30 are type C; compounds 13, 14, 22, 25, 27, 33, and 39 are type D; and compound 8 was the only type E isoquinoline alkaloid isolated in this study. The characteristics of the pattern of fragmentation for the different types of isoquinoline alkaloids vary regarding the pattern that is followed. Accordingly, the chemical structure of some alkaloid compounds can be deduced on the basis of their characteristic fragments.
To study the fragmentation patterns of these constituents and obtain more complete information about the product ions, the collision energy (CE) was examined at various values (20, 30, and 40 eV). Taking the MS/MS data of components 12, 4, 5, 6, 27, 22, and 8 (the representative compounds of different types of alkaloids) as an example, the structures were determined as follows.
The [M + 1]+ ion of compound 12 at m/z 354 corresponds to its molecular weight. When analyzing the fragments of this compound, we found that the fragmentation pattern of this alkaloid corresponds to a retro-Diels–Alder (RDA) mode of fragmentation (m/z 206 and 165) [19]. The loss of fragments corresponding to peaks at m/z 308 and 320 is consistent with a loss of H2O or methoxyl. We also found that additional peaks at m/z 188, 194, and 91 from ESI are characteristic of protopine. This demonstrated that compound 12 is protopine, which was also confirmed by spiking with a reference compound. Compounds 3 and 23 had similar fragmentation pathways.
The [M + H]+ ions of compounds 4, 7, 9, 18, 26, and 38 that eluted at 6.6, 83.1, 10.9, 19.4, and 44.7 min, respectively, were observed to undergo the RDA fragmentation reaction. The C ring opened due to the presence of a double bond in the C ring opposite to the B ring. Two fragment ions were obtained from the precursor. Taking compound 4 as an example, two fragment ions (m/z 178 and 151) were obtained, and the RDA fragmentation reaction always occurred as type B dissociation [20,21].
For aporphine-type alkaloids with a secondary amine ring, the initial fragmentation involved a loss of methylamine [M − NCH3]+ (m/z 296) to form a three-membered cyclic ring. The unique losses of 31 and 30 Da, due to the loss of CH3OH (m/z 265) with the subsequent loss of OCH3 (m/z 235), led to the formation of a stable three-membered ring structure. The [M + 1]+ ion at m/z 328 of compound 5 was observed to follow a similar fragmentation pathway as described above. Hence, compound 5 was deduced to be corytuberine [22]. Compound 30 also had a similar fragmentation pathway.
The MS/MS spectra of compound 8 exhibited a pseudo-molecular ion at m/z 300, with ion [M − 30]+ (m/z 269) or [M − 123]+ (m/z 177) obtained after the elimination of a nitrogen methyl group and subsequent loss of a benzyl group. We proposed that compound 8 is N-methylcoclaurine, which is type E. Further supporting evidence was found by the existence of ions corresponding to m/z 191 and 107 in the fragmentation pattern. The C-1 and 1a in N-methylcoclaurine are prone to breakage and the resulting formation of fragment ions. The double bonds in the adjacent rings tend to rearrange, and the electrons in the vicinity of the nitrogen atoms are influenced by the electrophilic effect of two double bonds, which leads to the final cleavage [23].
Corynoline and acetylcorynoline are representative type D compounds and the main components of C. bungeana. The ESI mass spectra of compound 22 produced a characteristic quasi-molecular ion of 368. At certain collision energy and fragmentor voltage, the electrons around the nitrogen atoms were influenced and fragmented into smaller molecules (m/z 177 and 135). The unique losses of 15 and 76 Da occurred due to the loss of CH3 (m/z 352) with the subsequent loss of 2OCH2 (m/z 292), which was also confirmed through addition of a reference standard. Compound 22 was found to be corynoline, compound 25 was found to be acetylcorynoline, and compound 39 was found to be 8-oxocorynoline.
In conclusion, a total of 32 alkaloids were identified in positive ion mode. The identification of chromatographic peaks in positive ion mode mainly depended on the literature data and the information from Agilent PCDL manager. In total, we confirmed the identities of 12 phenolic acids, as listed in Table 1 and Table 2. The proposed fragmentation patterns of the characteristic compounds in C. bungeana mentioned above are listed in Figure 3. This is the first time corytuberine, jateorhizine, corydaline, and coryptopine have been identified in C. bungeana, and the first report of bassianin, bilatriene, berberrubine, and worenine in Papaveraceae.

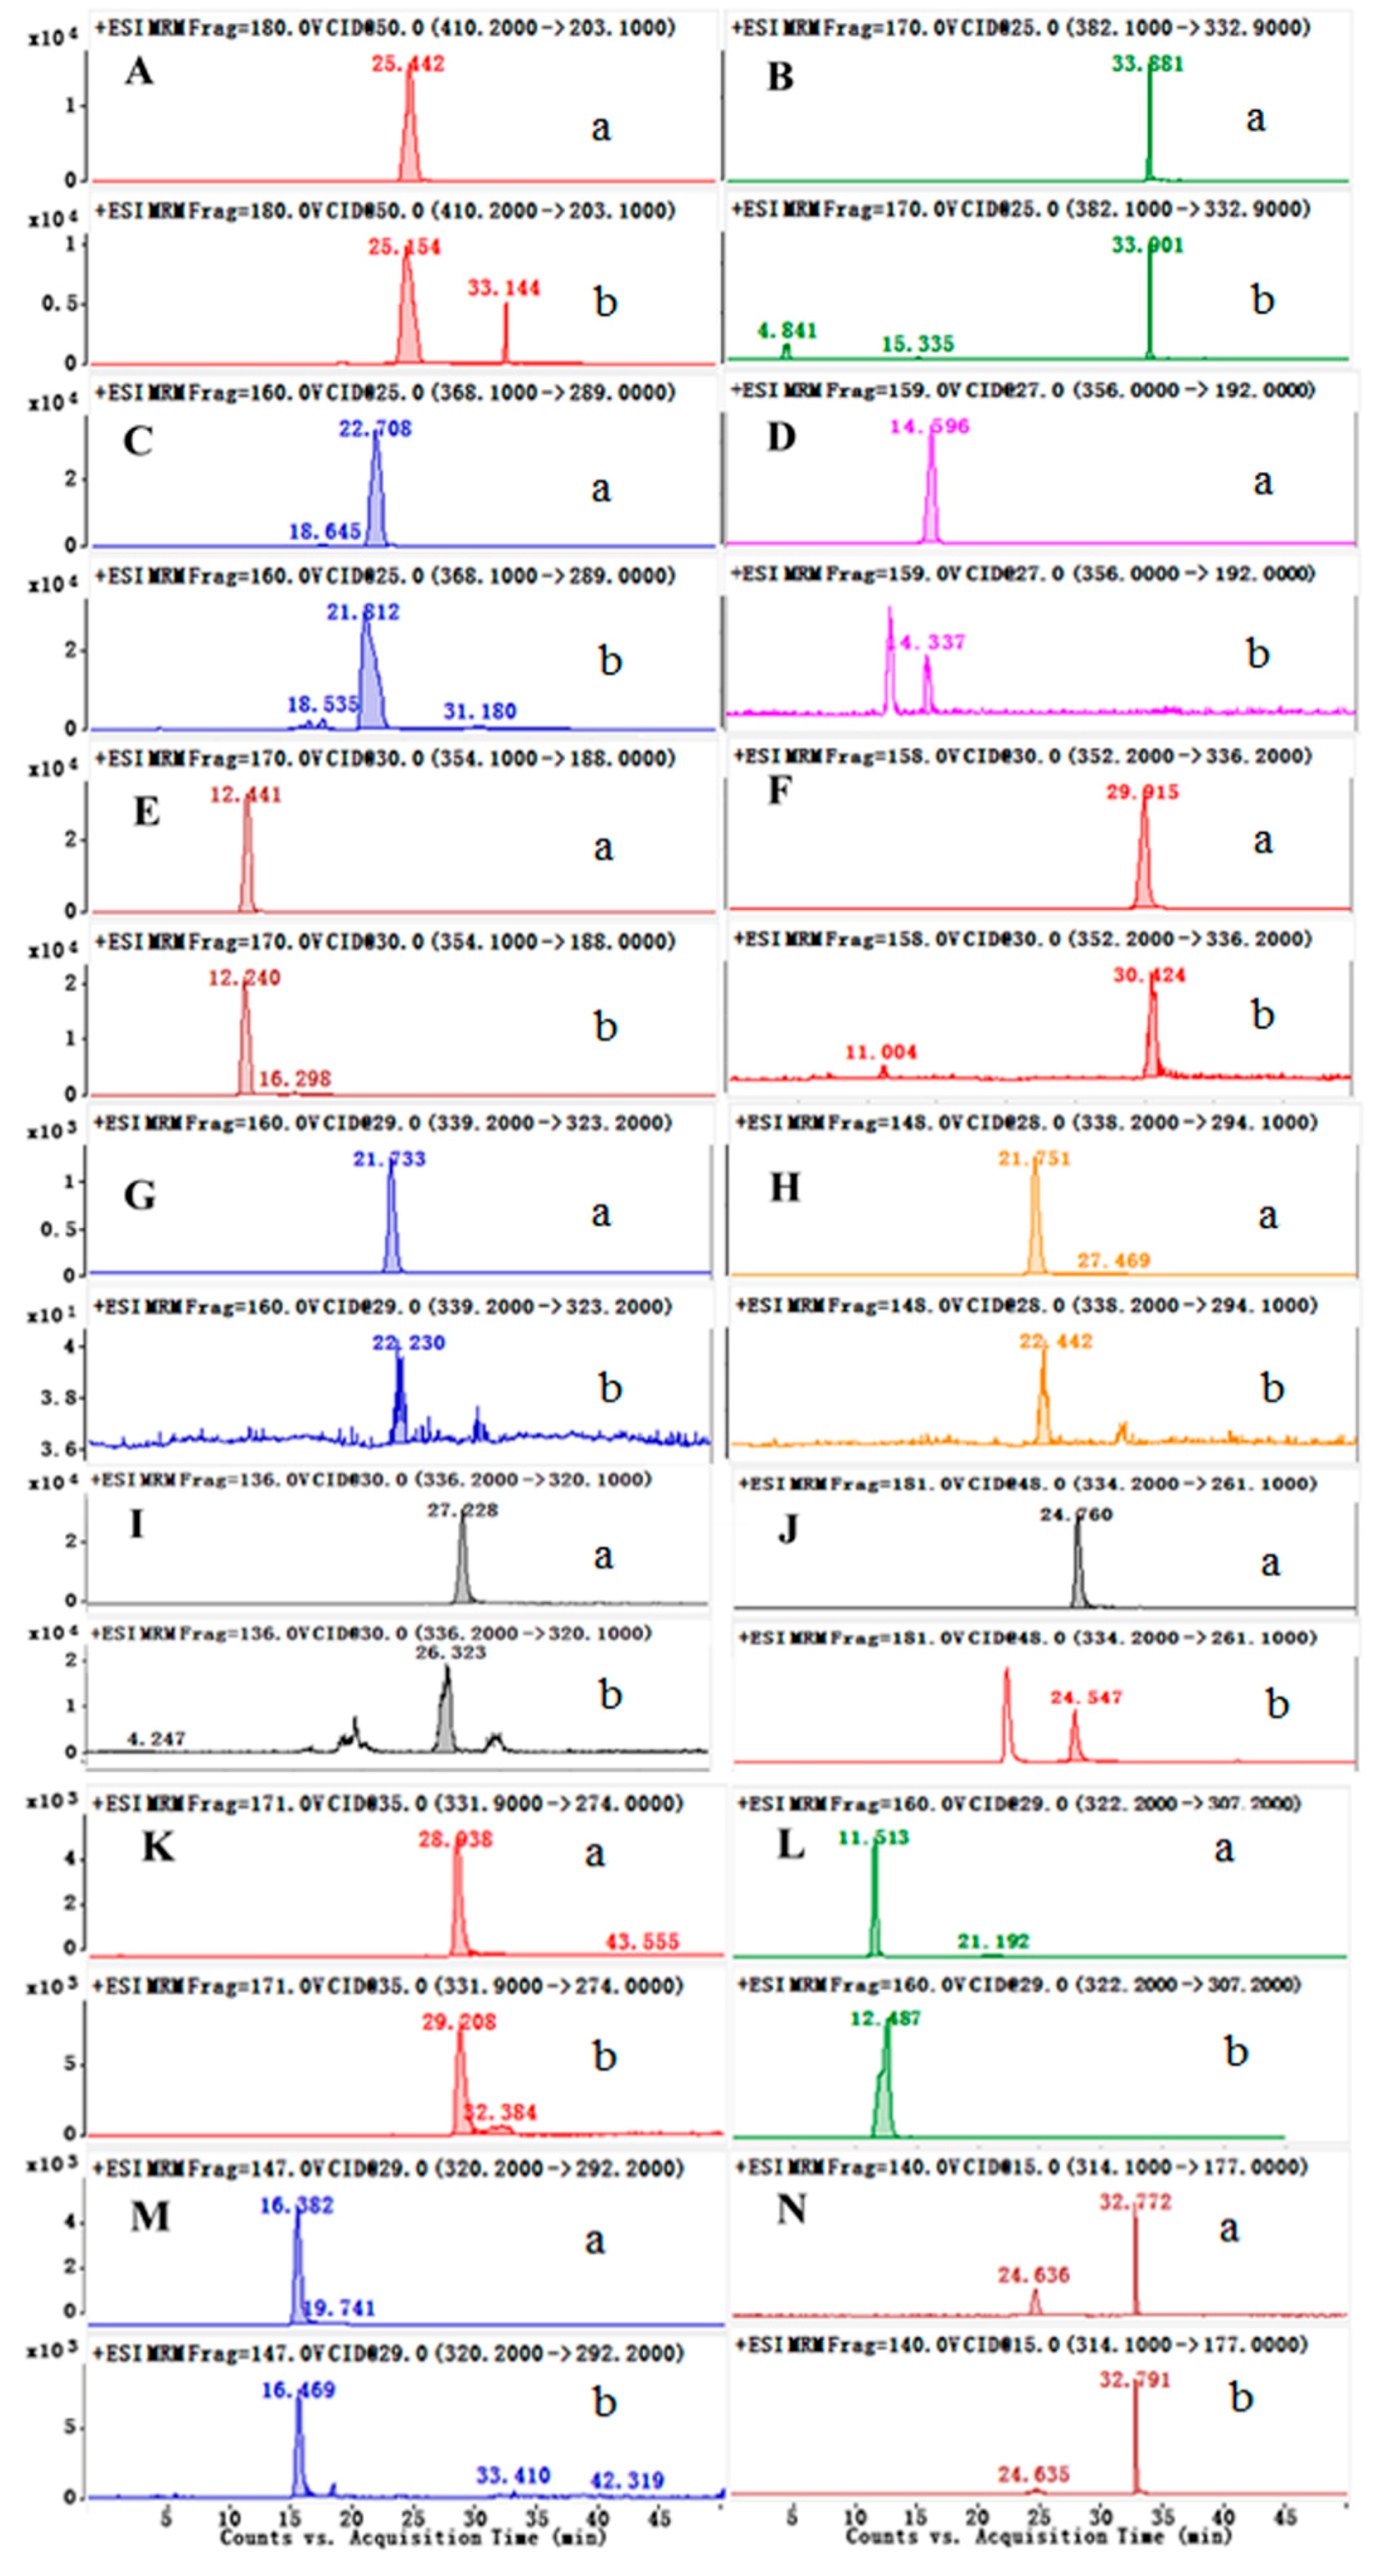
2.3. Quantitative Analysis

2.3.1. Optimization of the Condition

At the beginning of the present study, we separated 14 alkaloids, (Acetylcorynoline(A), 8-oxocorynoline (B), Corynoline (C), Tetrahydropalmatine (D), Protopine (E), Palmatine (F), Columbamine (G), Jateorhizine (H), Berberine (I), Worenine (J), Sanguinarine (K), Berberrubine (L), Coptisine (M), and Z23 (N), from C. bungeana using UHPLC–ESI–MS/MS. We selected MRM mode to monitor MS/MS ion transitions avoiding the co-eluting peaks. The qualitative results indicated that these alkaloids are the major constituents in this plant and the optimized parameters are listed in Table S4. Figure 4 depicts the typical MRM chromatograms of 14 compounds.

2.3.2. Linearity

Stock solutions, including 14 reference standards (Acetylcorynoline(A), 8-oxocorynoline (B), Corynoline (C), Tetrahydropalmatine (D), Protopine (E), Palmatine (F), Columbamine (G), Jateorhizine (H), Berberine (I), Worenine (J), Sanguinarine (K), Berberrubine (L), Coptisine (M), and Z23 (N), were configured and diluted to seven different concentrations for the preparation of calibration curves. The linear regression equations, correlation coefficients, and ranges of calibration curves for the listed alkaloids are display in Table 3. The calibration curves for actual standards were linear, with correlation coefficients larger than 0.9991. The limits of detection (LODs) and limits of quantification (LOQs) were 3 and 10 times the noise level, respectively. The LODs and LOQs for all standard analytes were in the range of 4.87 to 6.50 and 9.74 to 13.00 ng/mL, respectively, revealing that this method is sensitive for the quantitative analysis of the major components of C. bungeana.

2.3.3. Precision and Accuracy

The standard solutions with low, medium, and high concentrations were determined at the optimum conditions, and intra- and inter-day variations were chosen to measure the precision of the method. The intra- and inter-day precisions were within 0.30% and 4.97%, respectively. The accuracies ranged from −4.80% to 4.73%. The intra-and inter-day precisions and accuracies are displayed in Table 4.

2.3.4. Repeatability and Stability

The repeatability and stability of the method were also validated for each analyte. The RSDs were less than 2.88% and 4.83%, respectively. Our experimental method was found to have high repeatability and stability, as shown in Table S5.

2.3.5. Recovery

As shown in Table 5, the recovery rate of the 14 standards varied from 92.11% to 108.84% (RSD ≤ 4.60%). These results verified the high recovery of this method.

2.3.6. Sample Detection

The proposed method was used to quantify the 14 alkaloids in C. bungeana from 15 sources (S1–S15). As shown in Table 6, quantities of A–N in C. bungeana varied depending on their origin. For example, the alkaloid content, except for jateorhizine originating from Hebei Baoding and Zhejiang, was significantly higher in Hebei Anguo than in Gansu, Henan, and other places. In addition to Hebei Baoding and Zhejiang, the quantities of total alkaloids in plants from Jilin Changchun were higher than in plants from other provinces. The alkaloid contents among the herb samples varied widely according to differences in growing conditions and postharvest storage, and further research is necessary for complete characterization and understanding of these differences.
According to the quantity profiles of the 14 alkaloids, the analytical results demonstrated that C. bungeana from S1 (Table S1) has the greatest similarity with S9 and S11, in accordance with the actual contents of the alkaloids from the 15 sources. C. bungeana from Bozhou in Anhui province was the most optimal material for extraction of S2, S13, and S15 based on their higher abundance. However, S3 and S6 differed in other sources to a lesser extent, which illustrated that C. bungeana from Tongjiang in Zhejiang province and Jiangsu were lower quality as some of the alkaloids, such as D, F, H, and K, could not detected in these sources. The cluster analysis results provide a foundation for the selection of raw materials of C. bungeana and guarantee its quality for efficient clinical usage.

3. Materials and Methods

3.1. Reagents and Materials

C. bungeana was collected in different provinces in China from the period of August 2015 to March 2016, and was identified by Professor Zhenyue Wang of Heilongjiang University of Chinese Medicine (Harbin, China). The 15 sources and other information about C. bungeana are listed in Table S1. Acetylcorynoline (A), 8-oxocorynoline (B), corynoline (C), protopine (E), and Z23 (N) with 98% purity, as determined using UV, MS, NMR, and HPLC analysis, were isolated from C. bungeana provided by Harbin Medical University (Harbin, China). The alkaloids tetrahydropalmatine (D), palmatine (F), columbamine (G), jateorhizine (H), berberine (I), worenine (J), berberrubine (L), and coptisine (M) were purchased from the Chengdu Pufei De Biotech Co., Ltd. (Chengdu, China). The chemical structures of the 14 alkaloids are listed in Figure S1. HPLC-grade solvents containing methanol, water, acetic acid, 2-propanol, and acetonitrile were purchased from Sigma-Aldrich (Wicklow, Ireland). Ultrapure water was prepared using a MilliQ water purification system (Millipore, Molsheim, France).

3.2. Preparation of Standards

The crude extract of C. bungeana (10 kg) was powdered, mixed, and extracted with 95% ethanol (200 L, 3 × 1 h) three times, and then filtered. The total extract was evaporated under reduced pressure at 50 °C, and then dissolved in 100 L water, passed through D101 macroporous resin, and eluted with water including 30%, 60%, and 90% (v/v) ethanol in succession. The samples were subject to chromatography on silica gel and on Sephadex LH-20. The 60% and 90% ethanol elute yielded protopine, corynoline, Z23, 8-oxocorynoline, and acetylcorynoline. The structures of these alkaloids were confirmed by comparing their MS and NMR (1H-NMR and 13C-NMR) spectral data with those reported [24]. HPLC–DAD and UHPLC-MS were applied to analyze the percentage of total peak area, which showed that their purities exceeded 98%.

3.3. Sample Preparation

Dried powder (1 g) of C. bungeana was refluxed with 70% ethanol for 1 h. The extraction was repeated twice, and the extracts were combined and dissolved in 10 mL water. The aqueous solution was then extracted three times with 30 mL CHCl3 to remove the lipophilic impurities. The total alkaloids were extracted with CHCl3 twice. The CHCl3 extracts were combined and evaporated to dryness, and the extracts were combined and dissolved in 25 mL with methanol and stored in a refrigerator. The herbal extract was passed through a syringe filter of 0.22 µm and the filtrate was then injected for UHPLC–ESI–MS/MS analysis.

3.4. Instrumentation and Operation Conditions

3.4.1. Optimization of the UHPLC System

The analysis was performed on a series 1290 UHPLC instrument (Agilent, Santa, CA, USA) coupled with a 6430 QQQ-MS mass spectrometer with an ESI interface consisting of a binary pump G4220A, autosampler G4226A, and TCC G1316C module. Two separation methods were employed in the analysis. (1) Qualitative analysis was performed to analyze the chemical constituents of C. bungeana. To retain as many chemical constituents as possible, we adjusted the separation conditions using an Agilent SB-C18 column (1.8 µm, 50 mm × 2.1 mm) (Agilent Technologies, Santa Clara, CA, USA) at 35 °C with the flow rate of mobile phase set to 0.35 mL/min. The mobile phase consisted of 0.2% acetic acid in water (A) and acetonitrile (B). A linear gradient elution program was developed as follows; 0–5 min: 30% B; 5–10 min: 30%–31% B; 10–15 min: 31% B; 15–18 min: 31%–33% B; 18–20 min: 33% B; 20–21 min: 33%–34% B; 21–28 min: 34% B; and 28–50 min: 52% B. The sample injection volume was 10 µL. (2) A quantitative assay was simultaneously performed to determine the 14 alkaloids in C. bungeana. Chromatographic separation was conducted on a Waters C18 column (ACQUITY UPLC® HSS T3, 1.8 µm, 2.1 mm × 100 mm, Waters, Milford, MA, USA) at 35 °C. The mobile phase consisted of 0.1% acetic acid in water (A) and methanol (B). The eluting conditions were optimized as follows; isocratic at 30% B (0–5 min), linear gradient from 30% to 31% B (5–10 min), 31% B (10–15 min), 31% B to 33% B (15–18 min), 33% B (18–20 min), 33% to 34% B (20–21 min), 34% B (21–28 min), 34% to 45% B (28–40 min), and 45% B (40–45 min). The flow rate was 0.35 mL/min, the autosampler was set to 10 °C, and the sample injection volume was 10 µL. The gradient elution programs for the mobile phase for qualitative and quantitative analyses are listed in Tables S2 and S3, respectively.

3.4.2. Optimization of MS System

The ionization of the two methods was achieved using an ESI interface. The MS parameters were as follows: capillary voltage of 4.5 kV, dying gas flow of 11 L/min, source temperature of 100 °C, and desolvation temperature of 350 °C. In qualitative and quantitative analyses, the nebulizer gas pressure was 40 and 45 psi, respectively.
MassHunter workstation software version B.02.00 (Agilent, Santa, CA, USA) was used to control the system, acquire data, and conduct qualitative and quantitative analysis. In the qualitative analysis, the TIC spectra were obtained in positive and negative ion modes from m/z 50 to 800. We measured protonated and deprotonated molecules to determine the precise molecular masses of different compounds in positive and negative ion modes, respectively. An Agilent PCDL Manager (Agilent, Santa, CA, USA) equipped with the TCM database was applied for qualitative analysis. We used MRM to quantify different steroidal alkaloids in the quantitative assay. The specific parameters of the 14 alkaloids are provided in Table S4.

3.5. Validation of UHPLC–ESI–MS/MS Quantitation

3.5.1. Preparation of the Standard Solutions

For LC–MS/MS analysis, the 14 reference compounds were accurately weighed, placed separately into 10 mL volumetric flasks, and dissolved in methanol to create reference stock solution. All solutions were stored at 4 °C and brought to room temperature before use. Calibrated reference working solutions were freshly prepared by appropriate dilution of the mixed stock solution. Their respective concentrations are as follows (in μg/mL); A = 6.50, B = 11.60, C = 5.11, D = 5.07, E = 4.87, F = 5.65, G = 5.575, H = 5.00, I = 5.40, J = 5.55, K = 5.00, L = 5.525, M = 5.00, and N = 5.34 L. The stock solution was then further diluted with methanol to obtain reference stock solutions, producing final concentrations of 6.50 to 3250 ng/mL for A, 5.80 to 2900 ng/mL for B, 5.11 to 2555 ng/mL for C, 5.07 to 2535 ng/mL for D, 4.87 to 2435 ng/mL for E, 5.65 to 2825 ng/mL for F, 5.60 to 2788 ng/mL for G, 5.00 to 2500 ng/mL for H, 5.40 to 2700 ng/mL for I, 5.55 to 2775 ng/mL for J, 5.00 to 2500 ng/mL for K, 5.53 to 2763 ng/mL for L, 5.00 to 2500 ng/mL for M, and 5.34 to 2670 ng/mL for N. The QC(Quality control) samples were prepared at three different concentration levels: high QC (1625, 1450, 1278, 1268, 1218, 1413, 1394, 1250, 1350, 1388, 1250, 1381, 1250, and 1335 ng/mL), medium QC (325, 290, 256, 254, 244, 283, 279, 250, 270, 278, 250, 276, 250, and 267 ng/mL), and low QC (13.00, 11.60, 10.22, 10.14, 9.74, 11.30, 11.15, 10.00, 10.80, 11.10, 10.00, 11.05, 10.00, and 10.68 ng/mL for compounds 1–14, respectively.

3.5.2. Calibration Curve and Limit of Detection

The calibration curves were created through plotting the peak area obtained in MRM mode against the concentration of each analyte. The limit of detection (LOD) and limit of quantification (LOQ) were regarded as the analyte concentration with a signal-to-noise ratio (SNR) of approximately 3 and 10, respectively.

3.5.3. Precision and Accuracy

Intra-day and inter-day precision for each analyte at three different QC concentrations were determined using six replicates on the same day (intra-day) and over three consecutive days (inter-day). The accuracy was calculated by the relative error (RE) of the measured mean value deviated from the nominal value.

3.5.4. Recovery

Recovery was used to further evaluate the accuracy of the method. Known amounts of each standard solution at different concentration levels (high, middle, and low) were added to known amounts of sample (Zhejiang, China). The samples were analyzed as described above to determine the recoveries of the 14 C. bungeana samples. Six parallel samples were prepared and the RSD of the recoveries was calculated.

3.5.5. Repeatability and Stability

Five samples from the same batch (Zhejiang) were extracted and determined to measure the repeatability of this method (n = 6). The stability of the alkaloids in C. bungeana extract was assessed by repeated injections at 0, 1, 2, 4, 8, and 12 h to detect the peak area of these alkaloids. The percentage of RSD over the time points during this period was used to measure the stability of the compounds.

3.6. Qualitative Analysis and Quantitative analysis

For exploring this method, the extracted ion mode and product ion mode were used, and an ESI source was operated in positive and negative modes simultaneously during qualitative analysis. The MRM mode was then employed for quantitative analysis. Finally, 15 batches of C. bungeana from 11 different cities in China were compared using this new method.

4. Conclusions

In this research, qualitative and quantitative methods were combined to evaluate the quality of the chemical constituents of C. bungeana. An UHPLC–ESI–MS/MS method was developed for qualitative and quantitative analyses of the C. bungeana extract. More than 67 peaks were detected in the 70% EtOH extract, and the chemical structures of 44 constituents were deduced according to their MS/MS spectra, fragmentation patterns, and other information. We also employed this method to determine the identities of 14 alkaloids in this plant. This is the first time that 14 alkaloids were simultaneously analyzed. The new method was found to have suitable precision and accuracy, and acceptable repeatability and stability. The results indicate that the components of TCMs can be quantified clearly and that the quality control can be improved using updated analysis methods based on modern technology.

Supplementary Materials

The following are available online at https://www.mdpi.com/1420-3049/24/19/3463/s1, Figure S1: Cluster analysis of C. bungeana, Table S1: Summary of the tested plants of Corydalis bungeana. Table S2: Gradient elution program of mobile phase in qualitative analysis. Table S3: Gradient elution program of mobile phase in quantitative detection. Table S4: Quantitative, Qualifier ions and MS parameters of alkaloids, Table S5: The repeatability and stability results for fourteen reference compounds in the C. bungeana Turcz. z

Author Contributions

C.Y., M.T., and Z.W. designed research; M.T., H.D., Y.R., J.Y., and L.L. performed research and analyzed the data; M.T., H.D., and Y.R. wrote the paper. All authors read and approved the final manuscript.

Funding

Our work was supported by The Scientific Research Project of the National Natural Science Foundation of China (No. 81202875), the Harbin Science and Technology Bureau (No. 2015RQQXJ077), the Natural Science Foundation of Heilongjiang Province 2017 (G2017005), the Science Foundation Project of Heilongjiang Province (No. H2018056), Post-Doctoral Research Start-Up Grant Subsidy Project of Heilongjiang province (No. LBH-Q16214), and Research Project of “Supporting Plan for Excellent Innovative Talents” of Heilongjiang University of Traditional Chinese Medicine (No. 2018RCD03), and the Special Fund for Scientific Research Practice of Undergraduates in Pharmaceutical College of Heilongjiang University of Traditional Chinese Medicine (No. 039376).

Conflicts of Interest

The authors declare no conflict of interest.

Abbreviations

C.bungeanaCorydalis bungeana Turcz
CEcollision energy
ESI+positive electrospray ionization
ESInegative electrospray ionization
I.S.internal standard
LODlimits of detection
LOQlimits of quantification
MRMmultiple reaction monitoring
RDARetro-Diels–Alder
TCMTraditional Chinese Medicine
UHPLC–ESI–MS/MSultrahigh performance liquid chromatography–electrospray ionization–tandem mass spectrometry
Z237’-(3’,4’-dihydroxy-phenyl)-N-[(4-methoxyphenyl)-ethyl]propenamide

References

  1. Yang, C.; Zhang, C.; Wang, Z.; Tang, Z.; Kuang, H.; Kong, A.-N.T. Corynoline Isolated from Corydalis bungeana Turcz. Exhibits Anti-Inflammatory Effects via Modulation of Nfr2 and MAPKs. Molcules 2016, 21, 975. [Google Scholar] [CrossRef] [PubMed]
  2. China Pharmacopoeia Committee. Pharmacopoeia of the People’s Republic of China; China Chemical Industry Press: Beijing, China, 2015; p. 234. [Google Scholar]
  3. Niu, L.; Xie, Z.; Cai, T.; Wu, P.; Xue, P.; Chen, X. Preparative isolation of alkaloids from corydalis bungeana turcz. by high-speed counter-current chromatography using stepwise elution. J. Sep. Sci. 2015, 34, 987–994. [Google Scholar] [CrossRef] [PubMed]
  4. Zhai, X.-T.; Chen, J.-Q.; Jiang, C.-H.; Song, J.; Li, D.-Y.; Zhang, H.; Jia, X.-B.; Tan, W.; Wang, S.-X.; Yang, Y.; et al. Corydalis bungeana Turcz. attenuates LPS-induced inflammatory responses via the suppression of NF-κB signaling pathway in vitro and in vivo. J. Ethnopharmacol. 2016, 194, 153–161. [Google Scholar] [CrossRef] [PubMed]
  5. Dong, Z.-B.; Zhang, Y.-H.; Zhao, B.-J.; Li, C.; Tian, G.; Niu, B.; Qi, H.; Feng, L.; Shao, J.-G. Screening for anti-inflammatory components from Corydalis bungeana Turcz. based on macrophage binding combined with HPLC. BMC Complement. Altern. Med. 2015, 15, 987. [Google Scholar] [CrossRef] [PubMed]
  6. Gao, C.; Du, Y.; Wang, X.; Cao, H.; Lin, B.; Liu, Y. Hexahydroben-zophenanthridine alkaloids from corydalis bungeana turcz. and their anti-inflammatory activity. Bioorganic Med. Chem. Lett. 2018, 28, 2265–2269. [Google Scholar] [CrossRef]
  7. Wang, X.; Geng, Y.; Li, F.; Shi, X.; Liu, J. Large-scale separation of alkaloids from corydalis decumbens by ph-zone-refining counter-current chromatography. J. Chromatogr. A 2012, 17, 267–270. [Google Scholar] [CrossRef] [PubMed]
  8. Zhong, M.; Huang, K.L.; Zeng, J.G.; Li, S.; She, J.M.; Li, G.; Zhang, L. Optimization of microwave-assisted extraction of protopine and allocryptop-ine from stems of Macleaya cordata (Willd) R. Br. using response surface methodology. J. Sep. Sci. 2010, 33, 2160–2167. [Google Scholar] [CrossRef] [PubMed]
  9. Liu, Y.; Song, M.; Zhu, G.; Xi, X.; Li, K.; Wu, C.; Huang, L. Corynoline attenuates LPS-induced acute lung injury in mice by activating Nrf2. Int. Immunopharmacol. 2017, 48, 96. [Google Scholar] [CrossRef]
  10. Huang, T.; Xiao, Y.; Yi, L.; Li, L.; Wang, M.; Tian, C.; Ma, H.; He, K.; Wang, Y.; Han, B.; et al. Coptisine from Rhizoma Coptidis Suppresses HCT-116 Cells-related Tumor Growth in vitro and in vivo. Sci. Rep. 2017, 7, 38524. [Google Scholar] [CrossRef]
  11. Liu, B.; Su, K.; Wang, J.; Wang, J.; Xin, Z.; Li, F.; Fu, Y. Corynoline Exhibits Anti-inflammatory Effects in Lipopolysaccharide (LPS)-Stimulated Human Umbilical Vein Endothelial Cells through Activating Nrf2. Inflammation 2018, 41, 1640–1647. [Google Scholar] [CrossRef]
  12. Liu, R.; Zheng, L.; Cheng, M.; Wu, Y.; Gu, P.; Liu, Y.; Ma, P.; Ding, L. Simultaneous determination of corynoline and acetylcorynoline in human urine by LC–MS/MS and its application to a urinary excretion study. J. Chromatogr. B 2016, 1014, 83–89. [Google Scholar] [CrossRef] [PubMed]
  13. Wen, C.; Cai, J.; Lin, C.; Ma, J.; Wang, X. Gradient elution liquid chromatography mass spectrometry determination of acetylcorynoline in rat plasma and its application to a pharmacokinetic study. Xenobiotica 2014, 44, 743–748. [Google Scholar] [CrossRef] [PubMed]
  14. Liu, R.; Gu, P.; Wang, L.; Cheng, M.; Wu, Y.; Zheng, L.; Liu, Y.; Ding, L. Study on the pharmacokinetic profiles of corynoline and its potential interaction in traditional Chinese medicine formula Shuanghua Baihe tablets in rats by LC–MS/MS. J. Pharm. Biomed. Anal. 2016, 117, 247–254. [Google Scholar] [CrossRef] [PubMed]
  15. Hossain, M.B.; Rai, D.K.; Brunton, N.P. Optimisation and validation of ultra-high performance liquid chromatographic-tandem mass spectrometry method for qualitative and quantitative analysis of potato steroidal alkaloids. J. Chromatogr. B 2015, 997, 110–115. [Google Scholar] [CrossRef] [PubMed]
  16. Liu, L.; Wu, L.J.; Yang, C.J. Research progress on chemical structure and biological activity of isoquinoline alkaloids in Corydalis plants. Pract. Pharm. Clin. Remedies 2016, 19, 371–380. [Google Scholar]
  17. Wang, X.; Dong, H.; Shu, X.; Zheng, Z.; Yang, B.; Huang, L. Large-Scale Separation of Alkaloids from Corydalis bungeana Turcz. by pH-Zone-Refining Counter-Current Chromatography. Molcules 2012, 17, 14968–14974. [Google Scholar] [CrossRef]
  18. Qing, Z.X.; Huang, J.L.; Yang, X.Y.; Liu, J.H.; Cao, H.L.; Xiang, F.; Cheng, P.; Zeng, J.G. Anticancer and Reversing Multidrug Resistance Activities of Natural Isoquinoline Alkaloids and their Structure-activity Relationship. Curr. Med. Chem. 2018, 25, 5088–5114. [Google Scholar] [CrossRef]
  19. Yu, F.U.; Liang, J.; Bai, Y.; Zhuo-Ma, D.; Bai, B.R.; Ding, L.S. Tandem mass spectrometry analysis of total alkaloids from corydalis hendersonii. J. Chin. Mass Spectrom. Soc. 2010, 2, 98–102. [Google Scholar]
  20. Qi, L.W.; Chen, C.Y.; Li, P. Structural characterization and identification of iridoid glycosides, saponins, phenolic acids and flavonoids in flos lonicerae japonicae by a fast liquid chromatography method with diode-array detection and time-of-flight mass spectrometry. Rapid Commun. Mass Spectrom. Rcm 2010, 23, 3227–3242. [Google Scholar] [CrossRef]
  21. Moshafi, M.H.; Sharififar, F.; Dehghan, G.R.; Ameri, A. Bioassay screening of the essential oil and various extracts of fruits of heracleum persicum desf. and rhizomes of zingiber officinale rosc. using brine shrimp cytotoxicity assay. Iran. J. Pharm. Res. 2009, 8, 373–384. [Google Scholar]
  22. Soušek, J.; Guédon, D.; Adam, T.; Bochořáková, H.; Táborská, E.; Válka, I. Alkaloids and organic acids content of eight fumaria species. Phytochem. Anal. 2015, 10, 6–11. [Google Scholar] [CrossRef]
  23. Deng, X.; Zhao, L.; Fang, T.; Xiong, Y.; Ogutu, C.; Yang, D.; Vimolmangkang, S.; Liu, Y.; Han, Y. Investigation of benzylisoquinoline alkaloid biosynthetic pathway and its transcriptional regulation in lotus. Hortic Res. 2018, 5, 29. [Google Scholar] [CrossRef] [PubMed]
  24. Yang, X.; Yang, C.J.; Zhong, M.L.; Jiang, X.C.; Liu, G.F.; Pharmacy, S.O. Chemical constituents from corydalis bungeana turcz. Nat. Prod. Res. Dev. 2013, 25, 1665–1668. [Google Scholar]
Sample Availability: Samples of the compounds 7’-(3’,4’-dihydroxyphenyl)-N-[(4-methoxyphenyl)-ethyl] propena-mide, coptisine, berberrubine, sanguinarine, worenine, berberine, jateorhizine, columbamine, palmatine, protopine, tetrahydropalmatine, corynoline, 8-oxocorynoline, acetylcorynoline are available from the authors.
Figure 1. The total ion chromatograms (TIC) of C. bungeana extract in positive (A) and negative (B) ionization mode.
Molecules 24 03463 g001
Figure 2. The chemical structures of constituents identified in extract of C. bungeana.
Molecules 24 03463 g002
Figure 3. The proposed fragmentation pattern of representative alkaloids in C. bungeana.
Molecules 24 03463 g003
Figure 4. C. bungeana UHPLC-MRM chromatograms. (a) Fourteen alkaloids (Acetylcorynoline (A), 8-oxocorynoline (B), Corynoline (C), Tetrahydropalmatine (D), Protopine (E), Palmatine (F), Columbamine (G), Jateorhizine (H), Berberine (I), Worenine (J), Sanguinarine (K), Berberrubine (L), Coptisine (M), and Z23 (N) reference solutions. (b) Test solution of C. bungeana.
Molecules 24 03463 g004
Table 1. Precursor and product ions of the constituents in the 70% EtOH extract of C. bungeana in ultrahigh performance liquid chromatography–electrospray ionization mass spectrometry–tandem mass spectrometry (UHPLC–ESI+–MS/MS) experiments.
No.Tr (min)Calcd Mass [M H]+MS/MS Fragments m/zTentative Identification
12.1301 [M + X]+Unknown
24.9382 [M]+178; 265; 222; 162; 207Corynoxeine
36.4368277; 190; 90; 44; 307;Corycavine
46.6328178; 150; 264Scoulerine
57.4328296; 235; 281Corytuberine
67.5384364; 303; 58Hydrastine
78.1326178; 151; 91; 311; 283Cheilanthifoline
810.1300191; 177; 107N-Methylcoclaurine
910.9340208;114;Tetrahydroberberine
1012.2338322; 294Jateorhizine
1112.7323307; 279; 250; 197Berberrubine
1213.9354188; 149; 247; 320; 91Protopine
1314.8366317; 206; 146Corynoloxine
1416.6354188; 149; 247; 249Isocorynoline
1516.5426UnknownLythranidine
1618.4354 [M]+190; 247;1 88; 174; 166N-methylcanadine
1718.8368176; 289; 319; 17413-epicorynoline
1819.4369 [M]+174; 274; 246; 259Corydaline
1920.3368 [M + X]+Unknown
2021.6334 [M]+261; 291; 2333; 332; 147Worenine
2122.0408UnknownErysothiopine
2224.3368289; 261; 177; 319; 231; 135Corynoline
2325.1369 [M]+336; 190; 188; 158; 181Coryptopine
2426.8336 [M]+320; 292Berberine
2527.9410204; 246; 162; 332Acetylcorynoline
2630.1338277; 163Tetrahydrocorysamine
2732.0331 [M]+317; 274; 246; 218; 189Sanguinarine
2833.5368289; 261; 17711-Epicorynoline
2934.8396114; 209; 114Bassianin
3037.9312119Corytuberine
3139.1394UnknownCoryincine
3239.6314289; 177; 261; 231; 135; 79Z23
3340.7410394; 349; 334; 321; 190; 176Acetylisocorynoline
3441.2344[M + X]+Unknown
3542.6299295; 99Bilatriene
3643.1395[M + X]+Unknown
3743.8366[M]+350; 334; 308; 292Isomerdehydrocorydaline
3844.8340113Sinactine
3945.3382333;275;247;189;1358-oxocorynoline
4049.2181[M + X]+Unknown
Table 2. Precursor and product ions of the constituents in the 70% EtOH extract of C. bungeana in UHPLC-ESI-MS/MS experiments.
NoTR (min) Calcd mass [M − H]+MS/MS Fragments m/zTentative Identification
214.8329279; 223; 212; 194Tianshic acid
515.9942923; 733Soysaponin 1
616.5795 [M+HCOO]615; 113; 119Dipsacussaponin L
717.3311223; 57Caftaric acid
818.0577299Acacia-7-o-β-d-apiose-(1→2)-β-d-glucose
1623.9295277; 195; 171; 183Tanshinone II A
1928.2277127;59Linolenic acid
2029.6339177; 133; 105Aesculin
2131.3279 Isolinolic acid
2232.4253223; 195Daidzein
2334.9255 Bupleurynol
2435.9281236; 203; 174; 150Gloeosteretriol
Table 3. Linearity equations, correlation coefficients, linear ranges, and limits of quantitation for the fourteen alkaloids determined.
CompoundLinear Range (ng/mL)Linearity EquationR2LOQ (ng/mL)
Acetylcorynoline13.00–3250Y = 18.47X + 829.270.9992 13.00
8-oxocorynoline11.60–2900Y = 1.66X + 57.440.9994 11.60
Corynoline10.22–2555Y = 60.43X + 1730.900.9994 10.22
Tetrahydropalmatine10.14–2535Y = 54.83X + 2275.200.9991 10.14
Protopine9.74–2435Y = 33.34X + 1766.500.9991 9.74
Palmatine11.30–2825Y = 58.96X + 1811.500.9992 11.30
Columbamine11.15–2788Y = 15.74X + 943.690.9991 11.15
Jateorhizine10.00–2500Y = 45.28X + 1907.300.9992 10.00
Berberine10.80–2700Y = 13.67X + 478.400.9995 10.80
Worenine11.10–2775Y = 5.64X + 230.930.9993 11.10
Sanguinarine10.00–2500Y = 14.54X + 500.130.9992 10.00
Berberrubine11.05–2763Y = 86.92X + 4687.200.999111.05
Coptisine10.00–2500Y = 16.42X + 712.740.9994 10.00
Z2310.68–2670Y = 1.67X + 44.100.9996 10.68
Table 4. Intra- and inter-assay accuracy and precision values of the LC–MS/MS method for the measurement of fourteen alkaloids in C. bungeana (n = 6).
CompoundsNominal Mass Concentration (ng/mL)Observed Mass Concentration (ng/mL)Accuracy (bias %)Intra-Day Precision (RSD %)Inter-Day Precision (RSD %)
Acetylcorynoline13.0013.00 ± 0.800.112.421.41
325312.5 ± 3.90−3.834.211.83
16251495.3 ± 62.40−3.901.243.82
8-oxocorynoline 11.6010.60 ± 0.60−4.802.701.90
290261.8 ± 6.90−0.601.201.20
14501462.7 ± 40.000.922.731.32
Corynoline10.2210.60 ± 1.004.014.433.74
255.5261.8 ± 6.902.542.622.62
1277.51231.3 ± 77.20−3.631.331.71
Tetrahydropalmatine10.1411.25 ± 0.304.732.823.70
253.5275.4 ± 6.503.602.432.62
1267.51235.4 ± 3.10−2.540.301.72
Protopine 9.7410.80 ± 1.604.714.802.41
243.5250.8 ± 2.403.031.021.23
1217.51320.5 ± 26.803.512.034.34
Palmatine 11.3011.20 ± 1.40−1.024.603.63
282.5285.7 ± 9.701.123.441.82
1412.51331.6 ± 5.40−1.720.403.13
Columbamine11.1510.80 ± 0.50−2.821.133.63
278.8273.6 ± 5.50−1.852.000.76
1393.81355.7 ± 30.60−2.702.283.10
Jateorhizine 10.0011.60 ± 0.204.681.604.97
250244.6 ± 3.40−2.221.371.12
12501282.2 ± 13.802.551.104.78
Berberine 10.8010.14 ± 0.50−1.131.223.57
270268.9 ± 9.40−0.433.480.79
13501342.5 ± 27.20−0.572.033.12
Worenine 11.1010.70 ± 0.90−4.023.783.56
277.5273.9 ± 12.00−1.344.400.78
1387.51364.6 ± 13.00−1.601.043.13
Sanguinarine10.0011.60 ± 2.304.324.274.89
250252.1 ± 11.300.994.554.90
12501226.8 ± 15.50−1.891.303.45
Berberrubine11.0511.70 ± 0.802.303.123.56
276.25276.1 ± 6.60−0.012.420.78
1381.21398.3 ± 6.301.230.453.13
Coptisine10.0013.20 ± 2.503.233.704.83
250266.3 ± 9.101.453.430.78
12501222.9 ± 24.20−2.202.002.13
Z2310.6811.90 ± 2.201.101.783.56
267256.8 ± 6.80−3.782.600.78
13351336.5 ± 55.501.234.223.10
Observed mass concentrations are expressed as mean ± SD.
Table 5. Recoveries (%) of fourteen reference compounds following spiking the C. bungeana (n = 3).
CompoundsOriginal (ng)Addition (ng)Detection (ng)Recovery (%) RSD (%)
Acetylcorynoline163130.0293.65100.502.43
162.5320.8997.163.25
195.0359.02100.523.73
8-oxocorynoline231.62184.0421.30103.084.35
230.0466.21101.992.20
276.0513.62102.173.24
Corynoline2021.031616.73643.62100.361.77
2020.94045.78100.191.06
2425.04432.9699.462.88
Tetrahydropalmatine1034.79828.31850.3798.463.40
1035.42069.0599.892.20
1242.02283.14100.511.41
Protopine3580.282864.06439.8799.842.30
3580.07123.0598.964.33
4296.07879.34100.071.77
Palmatine2103.251682.73780.4099.672.98
2103.34215.15100.403.21
2524.04662.71101.403.82
Columbamine15933.8212746.928513.1298.684.30
15933.731850.0199.892.05
19120.535262.08101.081.11
Jateorhizine1296.321036.82326.8499.392.88
1296.02607.07101.383.27
1555.22893.62102.704.21
Berberine3243.262594.95656.7593.002.51
3243.66374.0496.523.47
3892.37223.13102.253.16
Worenine728.54583.21326.20102.482.54
729.11445.0398.272.29
874.91615.78101.414.06
Sanguinarine8653.426923.415564.2699.821.78
8654.317458.99101.752.26
10385.219321.52102.721.15
Berberrubine3721.642977.66962.49108.842.24
3722.07150.2892.114.60
4466.48482.74106.903.28
Coptisine1698.231358.43033.2798.283.16
1698.03379.3599.012.32
2037.63742.09100.311.94
Z23793.85635.21443.83102.322.86
794.11529.7692.674.55
952.91772.56102.701.50
Found = observed value − basal value.
Table 6. Mass fractions of the fourteen alkaloids (%) in the C. bungeana from 15 different sources (n = 3).
SourcesCompounds (%)
ABCDEFGHIJKLMNTotal
10.1740.1170.3340.0020.1060.0020.0040.0020.0220.0370.0450.0100.0220.6931.570
20.1750.0950.2880.0010.1080.001ND0.0010.0020.0010.0020.0010.0020.2130.883
30.1220.0540.181ND0.0560.0030.003ND0.0040.004ND0.0040.0050.0060.440
40.0010.0360.5020.0010.002ND0.001ND0.001NDND0.0010.0010.0040.547
50.0010.0360.6000.0010.0040.0010.0010.0020.0010.0020.0010.0010.0010.0110.654
60.0060.0110.092ND0.024NDNDND0.0010.005ND0.001ND0.0550.197
7ND0.0680.7100.0010.0020.0010.0010.0020.0010.0010.0020.0020.0010.0440.826
80.0140.0180.5510.0010.004NDND0.0010.0010.0010.0010.001ND0.0020.592
90.2050.1320.7330.0010.0990.0030.0180.0010.0080.0380.0670.0190.0100.4311.763
100.0070.0090.430ND0.012NDND0.0010.0010.0010.0210.001ND0.0420.524
110.2580.1930.7920.0010.1210.0030.0050.0020.0810.0410.0540.0480.0280.3281.954
120.0030.0010.6490.0010.0080.0010.0010.0020.0010.0020.0190.0030.0010.1800.866
130.0290.0040.4020.0010.0440.0010.0010.0020.0020.0210.0260.0060.0010.1900.724
140.0020.0160.580ND0.006ND0.0010.0010.0030.0010.0250.0020.0010.0790.712
150.0410.0090.4040.0010.0490.0010.0010.0010.006ND0.0310.0160.0010.1740.730

