Quercetin Inhibits the Proliferation of Glycolysis-Addicted HCC Cells by Reducing Hexokinase 2 and Akt-mTOR Pathway


Abstract
1. Introduction
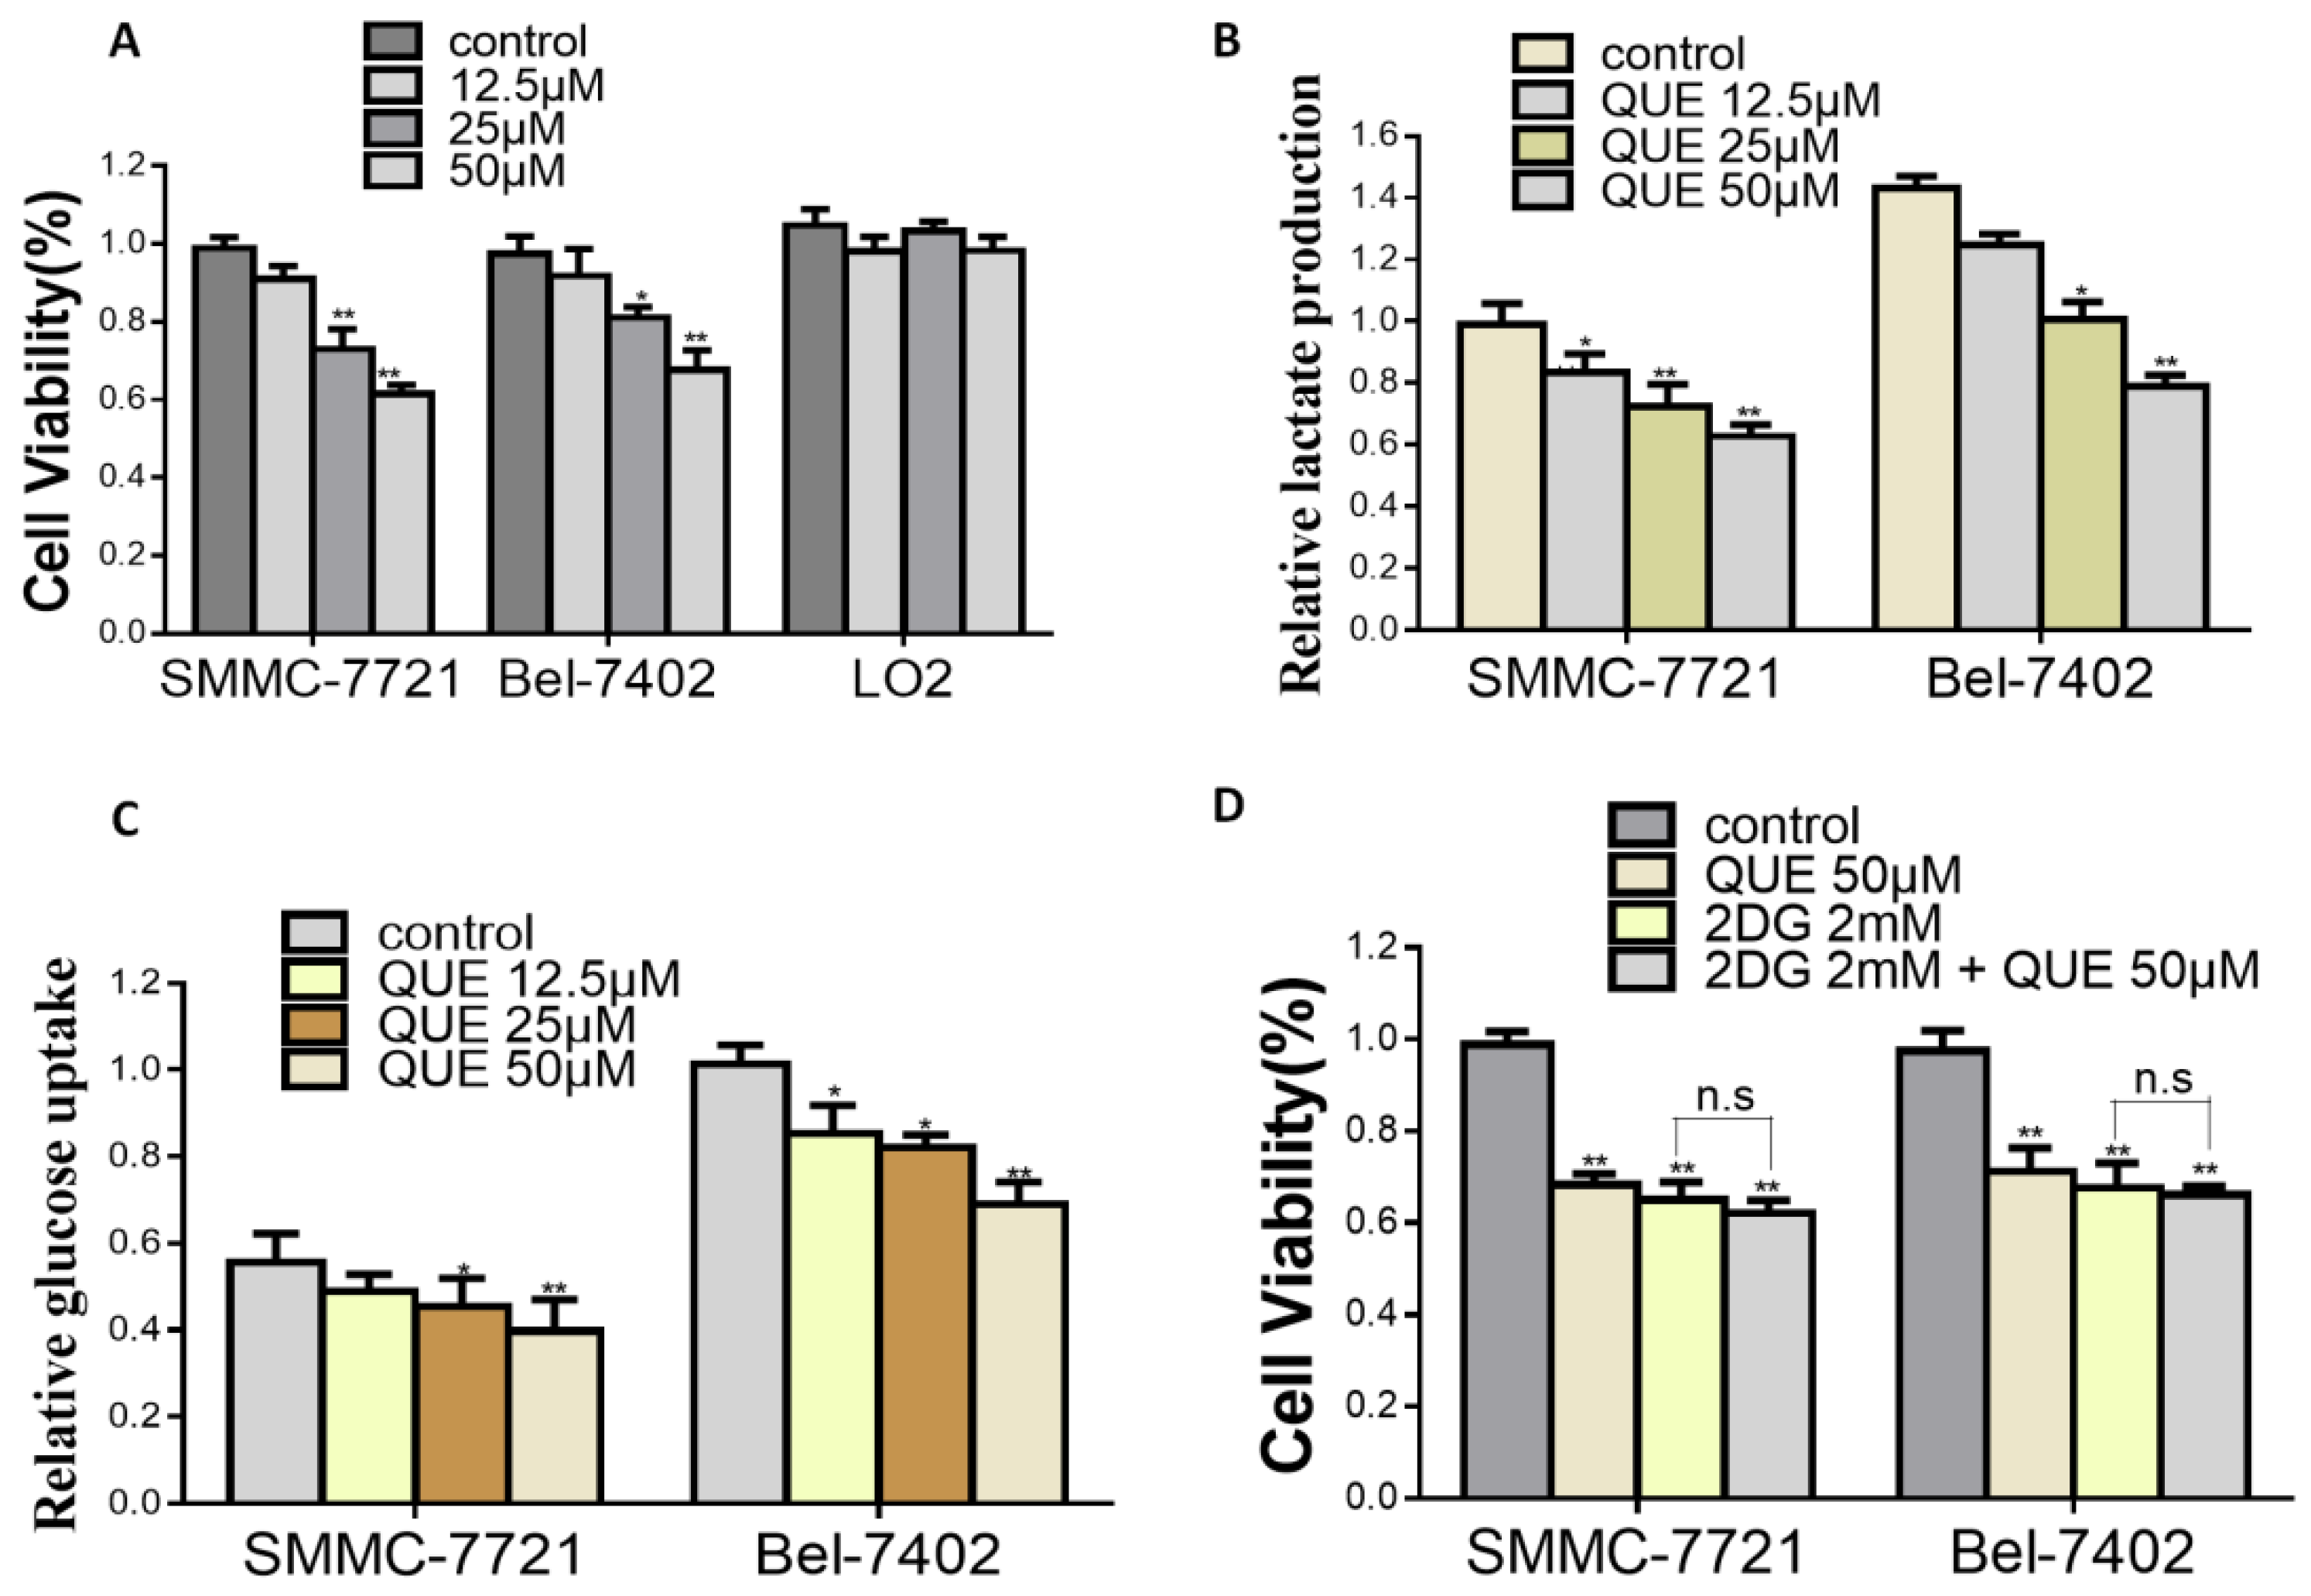
2. Results
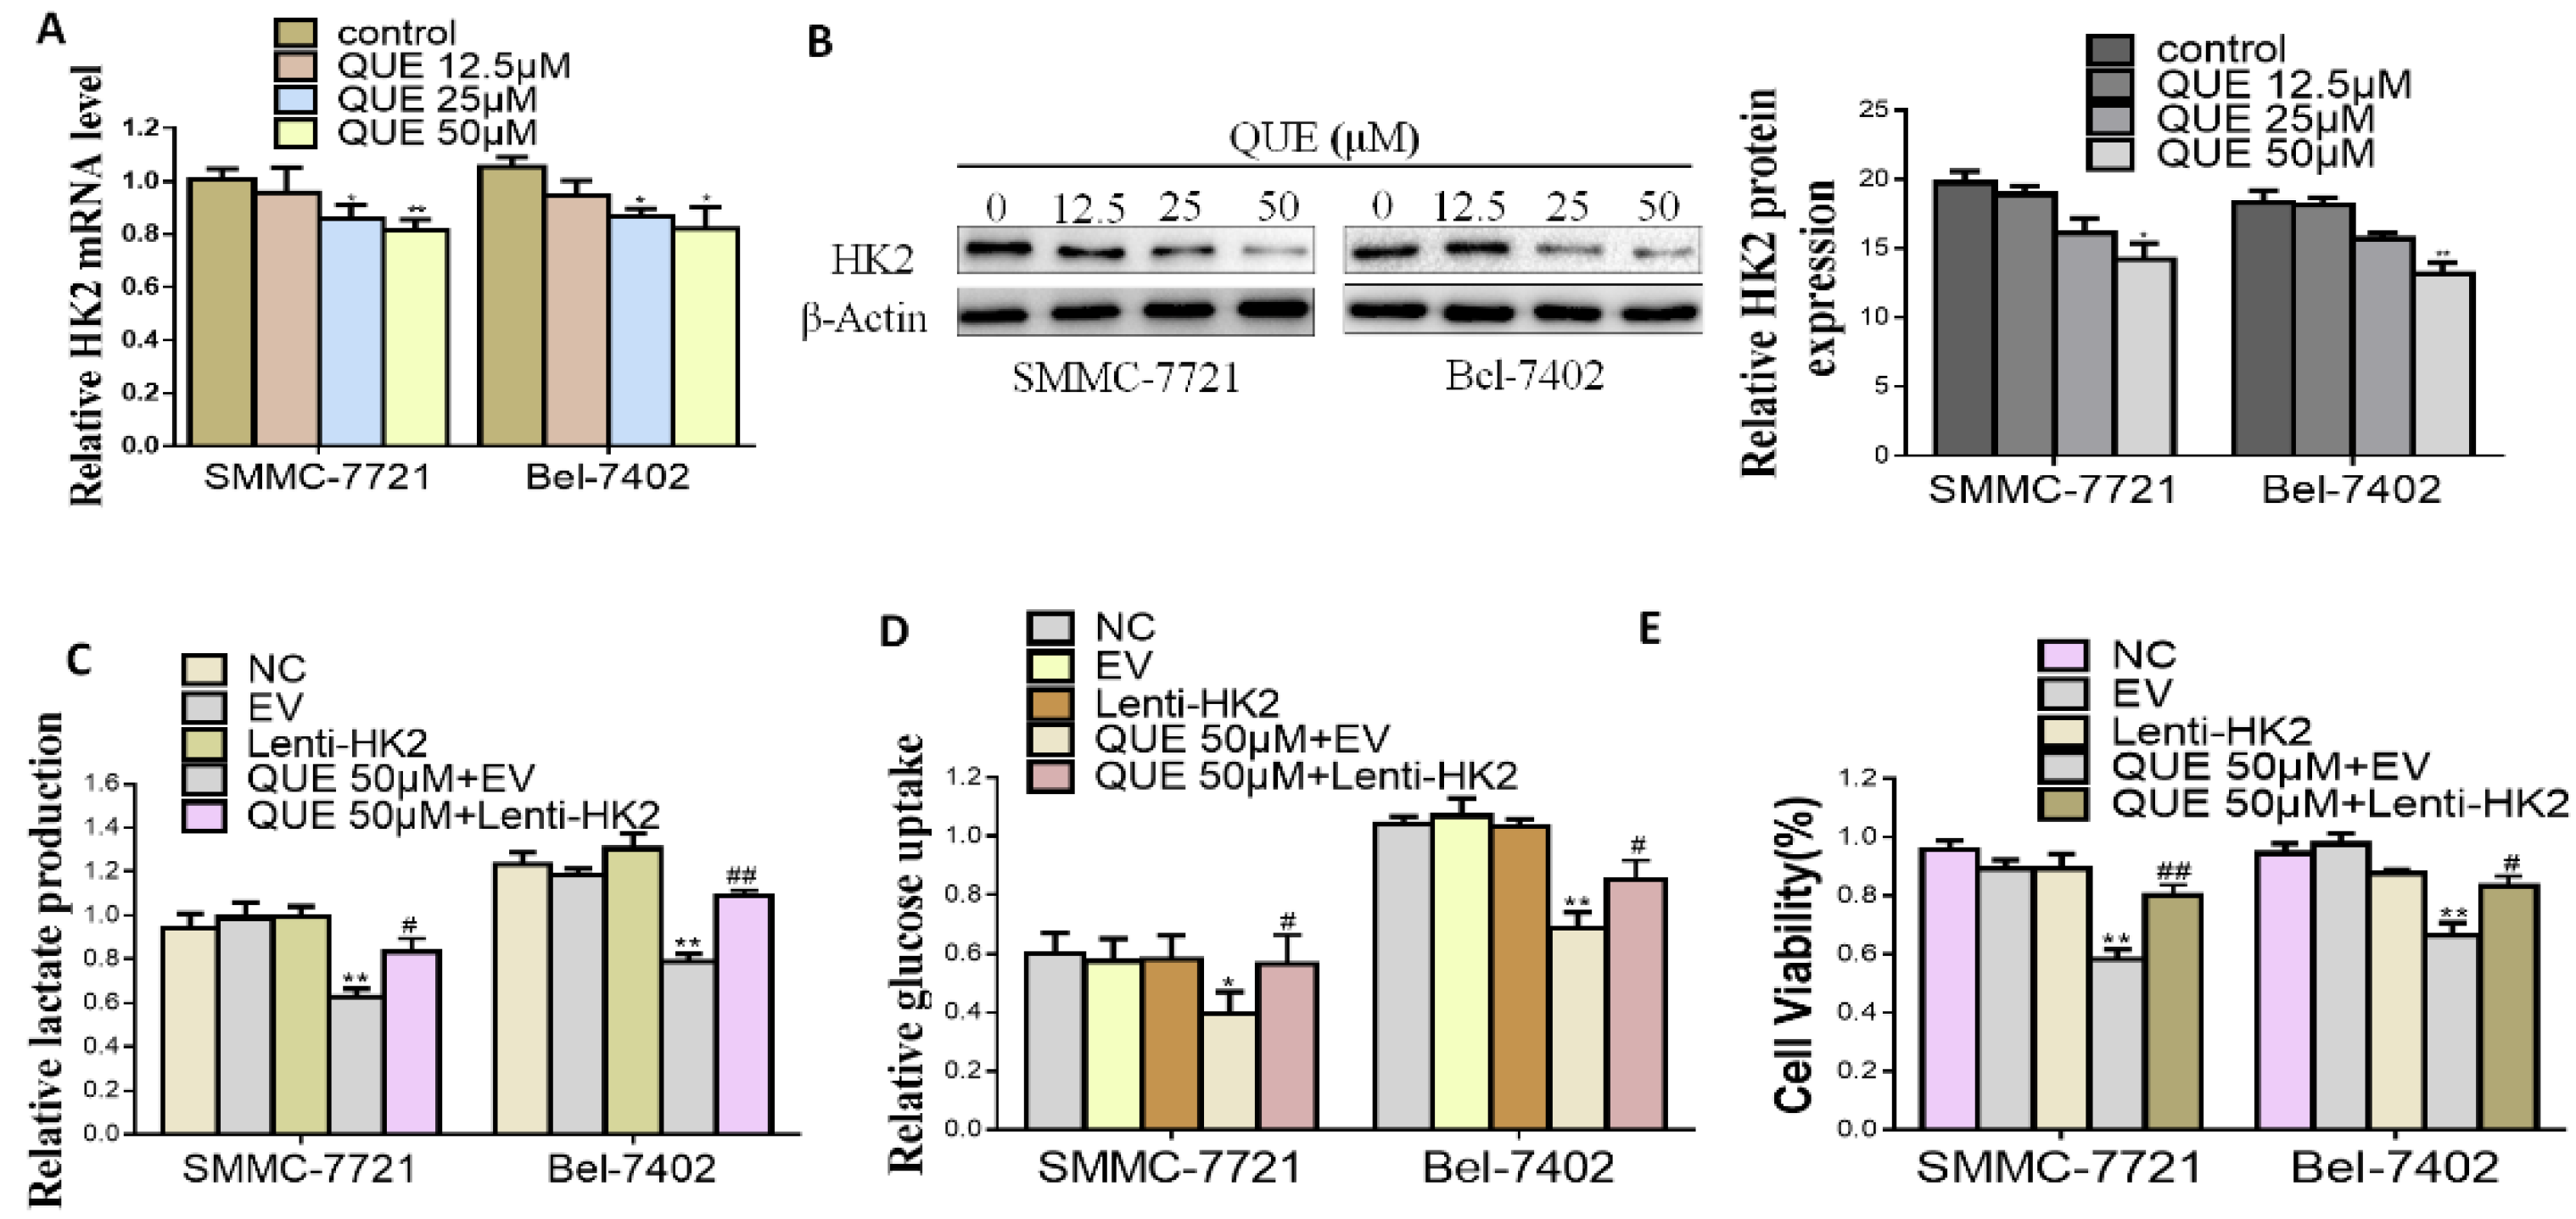
2.2. HK2 is Essential for QUE-Suppressed HCC Glycolysis and Proliferation
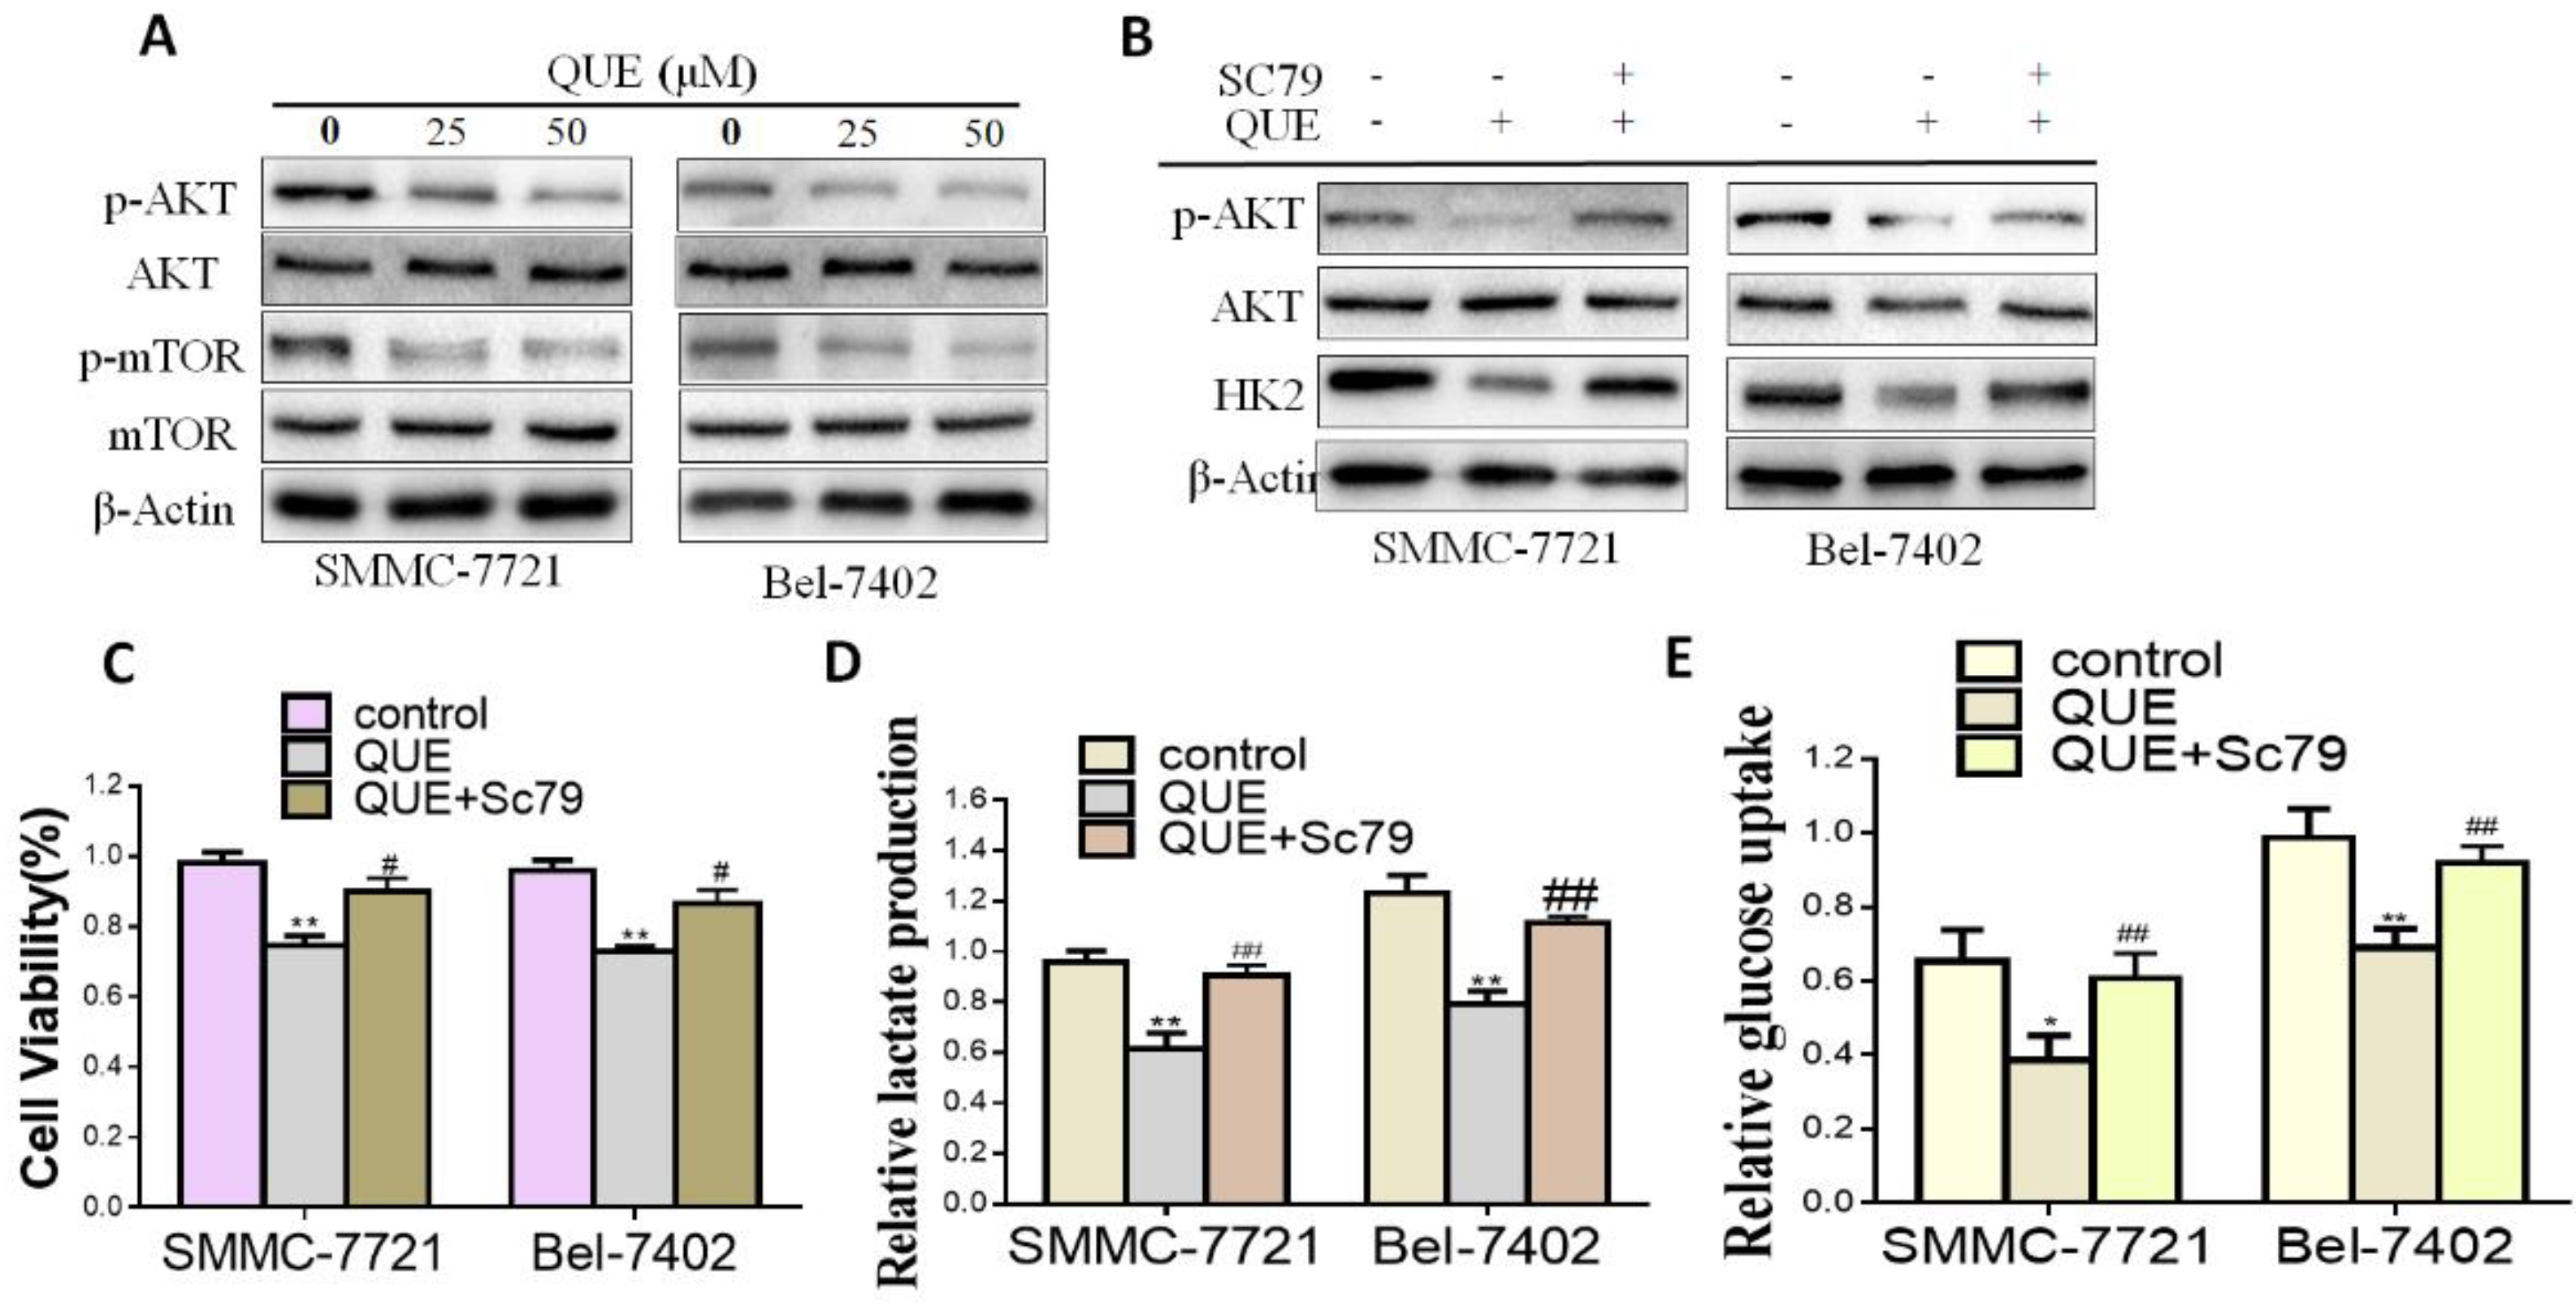
2.3. QUE Suppressed Glycolysis through Akt-mTOR Pathway-Mediated HK2 Regulation in HCC Cells
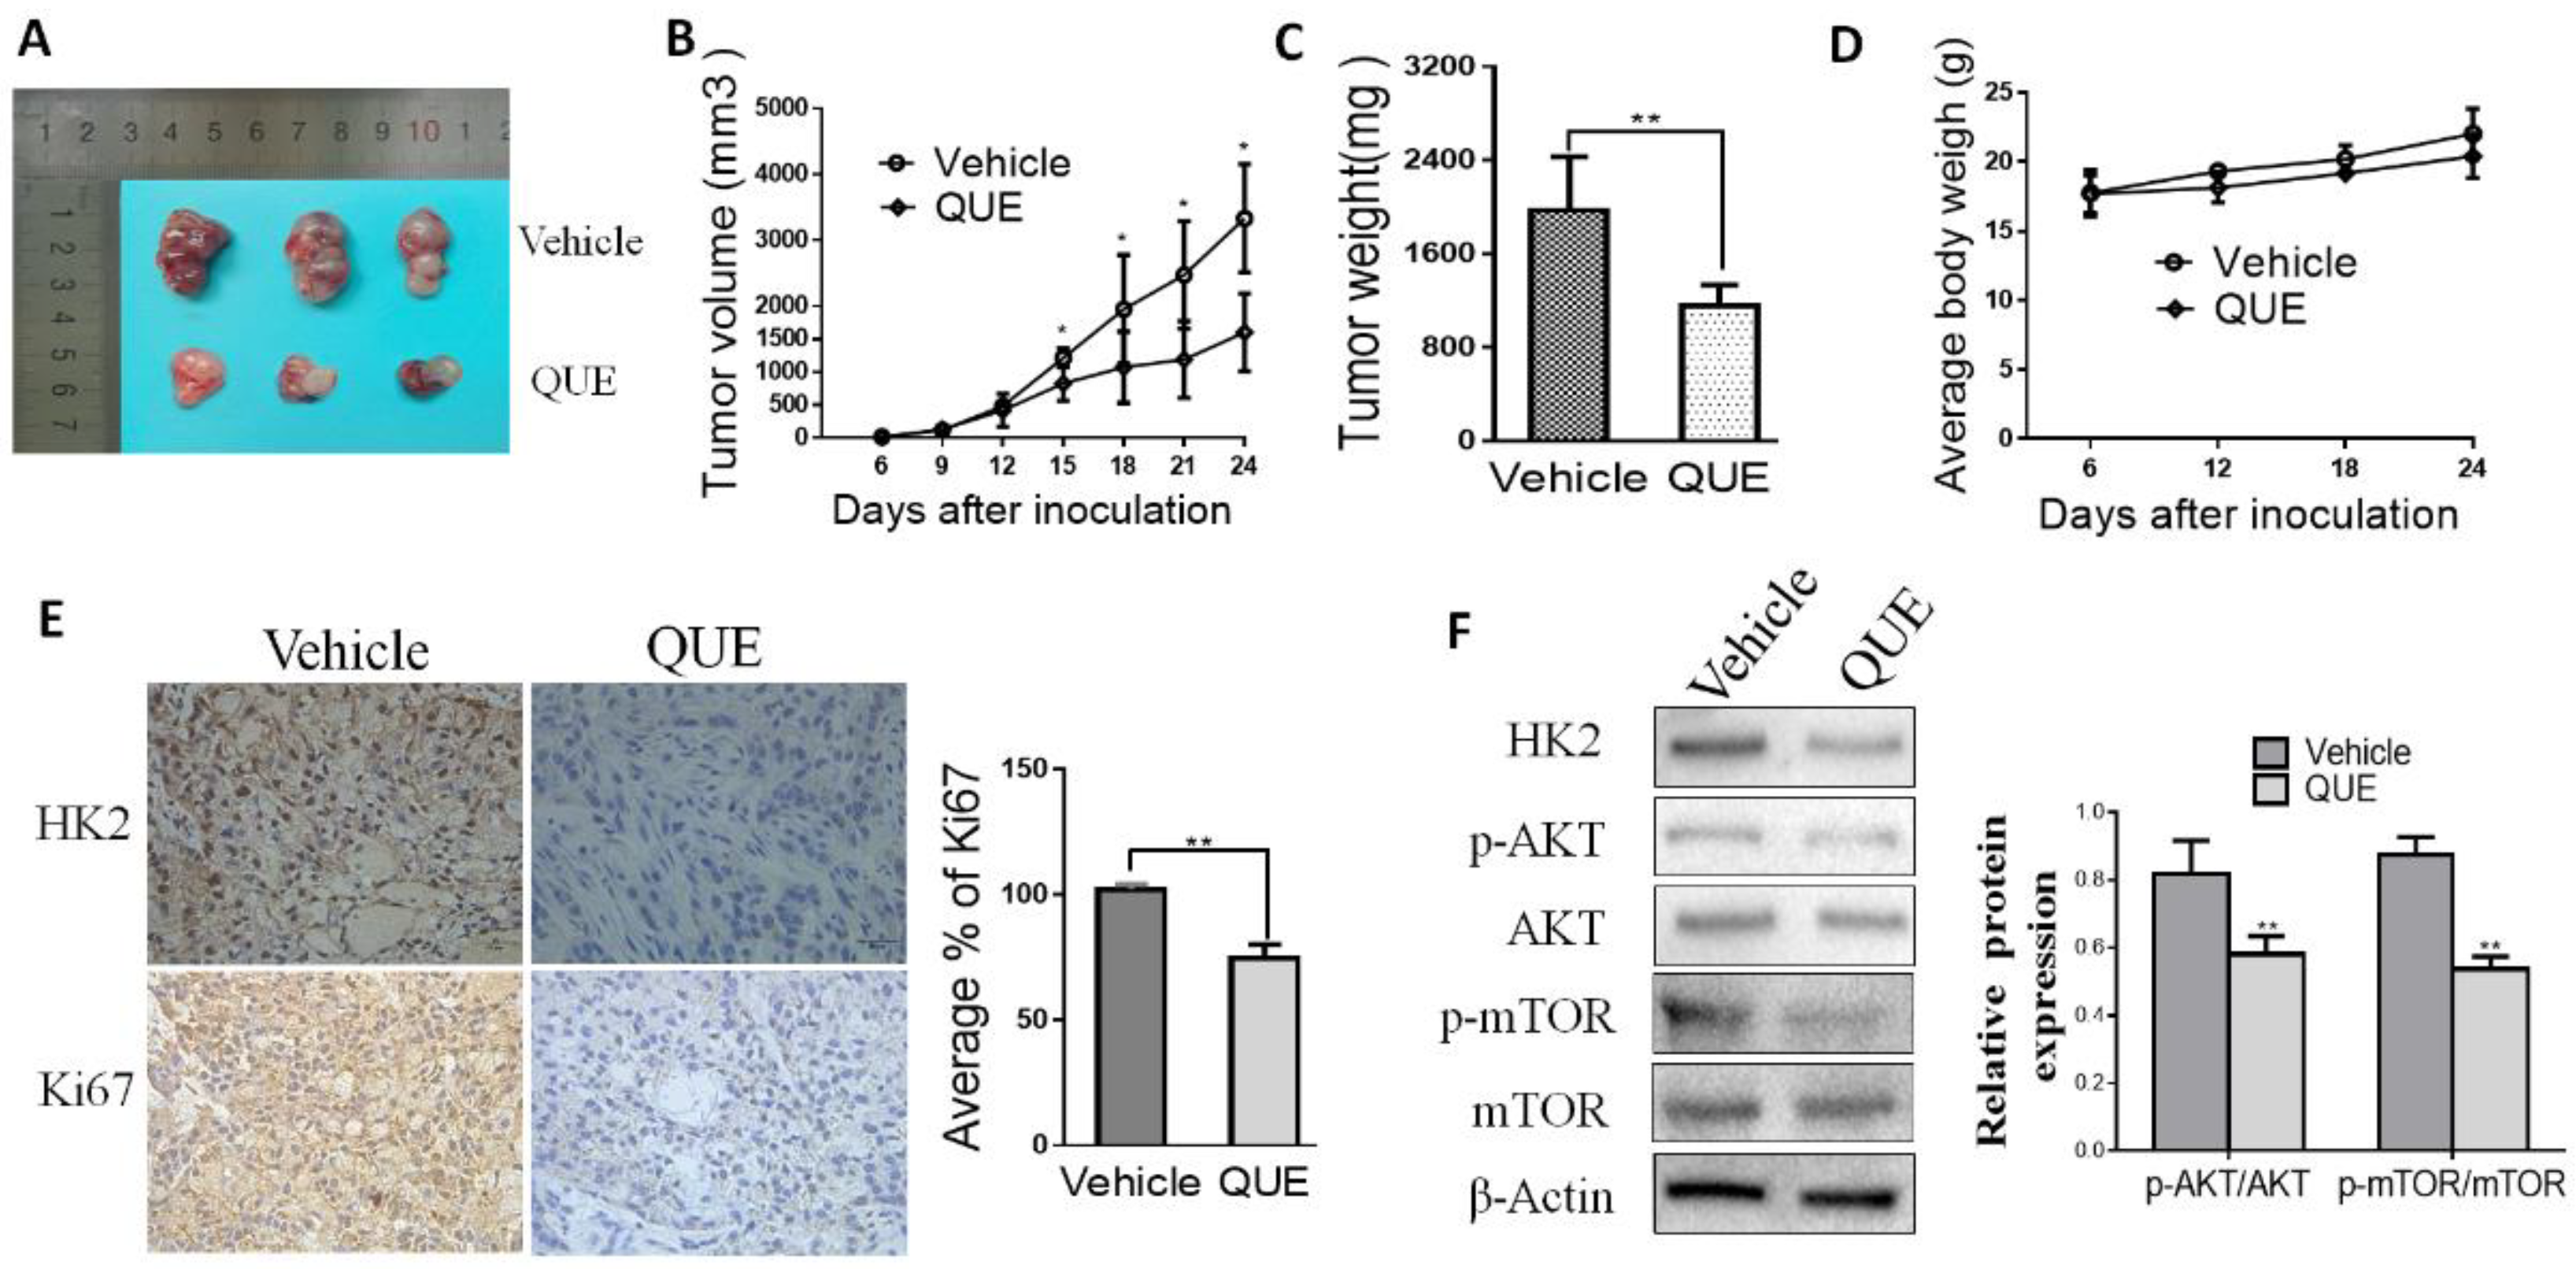
2.4. QUE Inhibits Tumor Growth and HK2 Expression in a Xenograft Mouse Model
3. Experimental Section
3.1. Antibodies and Reagents
3.2. Cell Culture and Animals
3.3. Cell Proliferation Assays
3.4. Glucose Uptake and Lactate Production Assays
3.5. RNA Isolation and Quantitative Real-Time Polymerase Chain Reaction (qRT-PCR)
3.6. Western Blotting
3.7. HK2 Lentivirus Vector Transfection
3.8. Animal Experiments and Ethics Statement
3.9. Immunohistochemistry
3.10. Statistical Analysis
4. Discussion
Supplementary Materials
Author Contributions
Funding
Conflicts of Interest
References
- Schutte, K.; Bornschein, J.; Malfertheiner, P. Hepatocellular carcinoma—epidemiological trends and risk factors. Dig. Dis. 2009, 27, 80–92. [Google Scholar] [PubMed]
- Yang, J.D.; Roberts, L.R. Hepatocellular carcinoma: A global view. Nat. Rev. Gastroenterol. Hepatol. 2010, 7, 448–458. [Google Scholar] [CrossRef] [PubMed]
- Venook, A.P.; Papandreou, C.; Furuse, J.; de Guevara, L.L. The incidence and epidemiology of hepatocellular carcinoma: A global and regional perspective. Oncologist 2010, 15, 5–13. [Google Scholar]
- Hua, S.; Liu, C.; Liu, L.; Wu, D. miR-142-3p inhibits aerobic glycolysis and cell proliferation in hepatocellular carcinoma via targeting LDHA. Biochem. Biophys. Res. Commun. 2018, 496, 947–954. [Google Scholar] [CrossRef] [PubMed]
- Iansante, V.; Choy, P.M.; Fung, S.W.; Liu, Y.; Chai, J.G.; Dyson, J.; Del Rio, A.; D’Santos, C.; Williams, R.; Chokshi, S.; et al. PARP14 promotes the Warburg effect in hepatocellular carcinoma by inhibiting JNK1-dependent PKM2 phosphorylation and activation. Nat. Commun. 2015, 6, 7882. [Google Scholar] [CrossRef]
- Warburg, O. On the origin of cancer cells. Science 1956, 123, 309–314. [Google Scholar] [CrossRef] [PubMed]
- Hanahan, D.; Weinberg, R.A. Hallmarks of cancer: The next generation. Cell 2011, 144, 646–674. [Google Scholar] [CrossRef]
- Koppenol, W.H.; Bounds, P.L.; Dang, C.V. Otto Warburg’s contributions to current concepts of cancer metabolism. Nat. Rev. Cancer 2011, 11, 325–337. [Google Scholar] [CrossRef]
- Lincet, H.; Icard, P. How do glycolytic enzymes favour cancer cell proliferation by nonmetabolic functions? Oncogene 2015, 34, 3751–3759. [Google Scholar] [CrossRef] [PubMed]
- Mayer, D.; Klimek, F.; Rempel, A.; Bannasch, P. Hexokinase expression in liver preneoplasia and neoplasia. Biochem. Soc. Trans. 1997, 25, 122–127. [Google Scholar] [CrossRef] [PubMed]
- Zhang, Z.F.; Feng, X.S.; Chen, H.; Duan, Z.J.; Wang, L.X.; Yang, D.; Liu, P.X.; Zhang, Q.P.; Jin, Y.L.; Sun, Z.G.; et al. Prognostic significance of synergistic hexokinase-2 and beta2-adrenergic receptor expression in human hepatocelluar carcinoma after curative resection. BMC Gastroenterol. 2016, 16, 57. [Google Scholar] [CrossRef]
- Li, S.; Li, J.; Dai, W.; Zhang, Q.; Feng, J.; Wu, L.; Liu, T.; Yu, Q.; Xu, S.; Wang, W.; et al. Genistein suppresses aerobic glycolysis and induces hepatocellular carcinoma cell death. Brit. J. Cancer 2017, 117, 1518–1528. [Google Scholar] [CrossRef] [PubMed]
- Dai, W.; Wang, F.; Lu, J.; Xia, Y.; He, L.; Chen, K.; Li, J.; Li, S.; Liu, T.; Zheng, Y.; et al. By reducing hexokinase 2, resveratrol induces apoptosis in HCC cells addicted to aerobic glycolysis and inhibits tumor growth in mice. Oncotarget 2015, 6, 13703–13717. [Google Scholar] [CrossRef] [PubMed]
- Brito, A.F.; Ribeiro, M.; Abrantes, A.M.; Mamede, A.C.; Laranjo, M.; Casalta-Lopes, J.E.; Goncalves, A.C.; Sarmento-Ribeiro, A.B.; Tralhao, J.G.; Botelho, M.F. New Approach for Treatment of Primary Liver Tumors: The Role of Quercetin. Nutr. Cancer 2016, 68, 250–266. [Google Scholar] [CrossRef] [PubMed]
- Neuhouser, M.L. Dietary flavonoids and cancer risk: Evidence from human population studies. Nutr. Cancer 2004, 50, 1–7. [Google Scholar] [CrossRef] [PubMed]
- Tang, N.P.; Zhou, B.; Wang, B.; Yu, R.B.; Ma, J. Flavonoids intake and risk of lung cancer: A meta-analysis. Jpn. J. Clin. Oncol. 2009, 39, 352–359. [Google Scholar] [CrossRef] [PubMed]
- Cui, Y.; Morgenstern, H.; Greenland, S.; Tashkin, D.P.; Mao, J.T.; Cai, L.; Cozen, W.; Mack, T.M.; Lu, Q.Y.; Zhang, Z.F. Dietary flavonoid intake and lung cancer--a population-based case-control study. Cancer 2008, 112, 2241–2248. [Google Scholar] [CrossRef]
- Russo, M.; Spagnuolo, C.; Tedesco, I.; Bilotto, S.; Russo, G.L. The flavonoid quercetin in disease prevention and therapy: Facts and fancies. Biochem. Pharmacol. 2012, 83, 6–15. [Google Scholar] [CrossRef]
- Vidya Priyadarsini, R.; Senthil Murugan, R.; Maitreyi, S.; Ramalingam, K.; Karunagaran, D.; Nagini, S. The flavonoid quercetin induces cell cycle arrest and mitochondria-mediated apoptosis in human cervical cancer (HeLa) cells through p53 induction and NF-kappaB inhibition. Eur. J. Pharmacol. 2010, 649, 84–91. [Google Scholar] [CrossRef] [PubMed]
- Jia, L.; Huang, S.; Yin, X.; Zan, Y.; Guo, Y.; Han, L. Quercetin suppresses the mobility of breast cancer by suppressing glycolysis through Akt-mTOR pathway mediated autophagy induction. Life Sci. 2018, 208, 123–130. [Google Scholar] [CrossRef] [PubMed]
- Moreira, L.; Araujo, I.; Costa, T.; Correia-Branco, A.; Faria, A.; Martel, F.; Keating, E. Quercetin and epigallocatechin gallate inhibit glucose uptake and metabolism by breast cancer cells by an estrogen receptor-independent mechanism. Exp. Cell Res. 2013, 319, 1784–1795. [Google Scholar] [CrossRef] [PubMed]
- Maurya, A.K.; Vinayak, M. Quercetin regresses Dalton’s lymphoma growth via suppression of PI3K/AKT signaling leading to upregulation of p53 and decrease in energy metabolism. Nutr. Cancer 2015, 67, 354–363. [Google Scholar] [CrossRef] [PubMed]
- Tan, W.F.; Lin, L.P.; Li, M.H.; Zhang, Y.X.; Tong, Y.G.; Xiao, D.; Ding, J. Quercetin, a dietary-derived flavonoid, possesses antiangiogenic potential. Eur. J. Pharmacol. 2003, 459, 255–262. [Google Scholar] [CrossRef]
- Guo, D.; Wu, C.; Li, J.; Guo, A.; Li, Q.; Jiang, H.; Chen, B.; Wang, X. Synergistic Effect of Functionalized Nickel Nanoparticles and Quercetin on Inhibition of the SMMC-7721 Cells Proliferation. Nanoscale Res. Lett. 2009, 4, 1395–1402. [Google Scholar] [CrossRef] [PubMed]
- Elstrom, R.L.; Bauer, D.E.; Buzzai, M.; Karnauskas, R.; Harris, M.H.; Plas, D.R.; Zhuang, H.; Cinalli, R.M.; Alavi, A.; Rudin, C.M.; et al. Akt stimulates aerobic glycolysis in cancer cells. Cancer Res. 2004, 64, 3892–3899. [Google Scholar] [CrossRef] [PubMed]
- Guha, M.; Fang, J.K.; Monks, R.; Birnbaum, M.J.; Avadhani, N.G. Activation of Akt is essential for the propagation of mitochondrial respiratory stress signaling and activation of the transcriptional coactivator heterogeneous ribonucleoprotein A2. Mol. Biol. Cell 2010, 21, 3578–3589. [Google Scholar] [CrossRef] [PubMed]
- So, E.Y.; Ouchi, T. BRAT1 deficiency causes increased glucose metabolism and mitochondrial malfunction. BMC cancer 2014, 14, 548. [Google Scholar] [CrossRef]
- Fan, F.; Tian, C.; Tao, L.; Wu, H.; Liu, Z.; Shen, C.; Jiang, G.; Lu, Y. Candesartan attenuates angiogenesis in hepatocellular carcinoma via downregulating AT1R/VEGF pathway. Biomed. Pharmacother. 2016, 83, 704–711. [Google Scholar] [CrossRef]
- Wu, H.; He, L.; Shi, J.; Hou, X.; Zhang, H.; Zhang, X.; An, Q.; Fan, F. Resveratrol inhibits VEGF-induced angiogenesis in human endothelial cells associated with suppression of aerobic glycolysis via modulation of PKM2 nuclear translocation. Clin. Exp. Pharmacol. Physiol. 2018, 45, 1265–1273. [Google Scholar] [CrossRef]
- Blanchard, T.G.; Lapidus, R.; Banerjee, V.; Bafford, A.C.; Czinn, S.J.; Ahmed, H.; Banerjee, A. Upregulation of RASSF1A in Colon Cancer by Suppression of Angiogenesis Signaling and Akt Activation. Cell. Physiol. Biochem. 2018, 48, 1259–1273. [Google Scholar] [CrossRef]
- Li, L.; Kang, L.; Zhao, W.; Feng, Y.; Liu, W.; Wang, T.; Mai, H.; Huang, J.; Chen, S.; Liang, Y.; et al. miR-30a-5p suppresses breast tumor growth and metastasis through inhibition of LDHA-mediated Warburg effect. Cancer Lett. 2017, 400, 89–98. [Google Scholar] [CrossRef] [PubMed]
- Zhao, Y.; Butler, E.B.; Tan, M. Targeting cellular metabolism to improve cancer therapeutics. Cell Death Dis. 2013, 4, e532. [Google Scholar] [CrossRef]
- Cheung, E.C.; Ludwig, R.L.; Vousden, K.H. Mitochondrial localization of TIGAR under hypoxia stimulates HK2 and lowers ROS and cell death. Proc. Natl. Acad. Sci. USA 2012, 109, 20491–20496. [Google Scholar] [CrossRef] [PubMed]
- Krasnov, G.S.; Dmitriev, A.A.; Lakunina, V.A.; Kirpiy, A.A.; Kudryavtseva, A.V. Targeting VDAC-bound hexokinase II: A promising approach for concomitant anti-cancer therapy. Expert Opin. Ther. Tar. 2013, 17, 1221–1233. [Google Scholar] [CrossRef] [PubMed]
- Xu, D.; Jin, J.; Yu, H.; Zhao, Z.; Ma, D.; Zhang, C.; Jiang, H. Chrysin inhibited tumor glycolysis and induced apoptosis in hepatocellular carcinoma by targeting hexokinase-2. J. Exp. Clin. Cancer Res. 2017, 36, 44. [Google Scholar] [CrossRef]
- Manning, B.D.; Cantley, L.C. AKT/PKB signaling: Navigating downstream. Cell 2007, 129, 1261–1274. [Google Scholar] [CrossRef]
- Chan, C.H.; Li, C.F.; Yang, W.L.; Gao, Y.; Lee, S.W.; Feng, Z.; Huang, H.Y.; Tsai, K.K.; Flores, L.G.; Shao, Y.; et al. The Skp2-SCF E3 ligase regulates Akt ubiquitination, glycolysis, herceptin sensitivity, and tumorigenesis. Cell 2012, 149, 1098–1111. [Google Scholar] [CrossRef]
- Li, W.; Ma, X.; Li, N.; Liu, H.; Dong, Q.; Zhang, J.; Yang, C.; Liu, Y.; Liang, Q.; Zhang, S.; et al. Resveratrol inhibits Hexokinases II mediated glycolysis in non-small cell lung cancer via targeting Akt signaling pathway. Exp. Cell Res. 2016, 349, 320–327. [Google Scholar] [CrossRef]
- Levine, A.J.; Puzio-Kuter, A.M. The control of the metabolic switch in cancers by oncogenes and tumor suppressor genes. Science 2010, 330, 1340–1344. [Google Scholar] [CrossRef]
- Denko, N.C. Hypoxia, HIF1 and glucose metabolism in the solid tumour. Nat. Rev. Cancer 2008, 8, 705–713. [Google Scholar] [CrossRef]
- Mathupala, S.P.; Ko, Y.H.; Pedersen, P.L. Hexokinase II: cancer’s double-edged sword acting as both facilitator and gatekeeper of malignancy when bound to mitochondria. Oncogene 2006, 25, 4777–4786. [Google Scholar] [CrossRef] [PubMed]
Sample Availability: Samples of the compounds (quercetin) are available from the authors. |


© 2019 by the authors. Licensee MDPI, Basel, Switzerland. This article is an open access article distributed under the terms and conditions of the Creative Commons Attribution (CC BY) license (http://creativecommons.org/licenses/by/4.0/).
Share and Cite
Wu, H.; Pan, L.; Gao, C.; Xu, H.; Li, Y.; Zhang, L.; Ma, L.; Meng, L.; Sun, X.; Qin, H. Quercetin Inhibits the Proliferation of Glycolysis-Addicted HCC Cells by Reducing Hexokinase 2 and Akt-mTOR Pathway. Molecules 2019, 24, 1993. https://doi.org/10.3390/molecules24101993
Wu H, Pan L, Gao C, Xu H, Li Y, Zhang L, Ma L, Meng L, Sun X, Qin H. Quercetin Inhibits the Proliferation of Glycolysis-Addicted HCC Cells by Reducing Hexokinase 2 and Akt-mTOR Pathway. Molecules. 2019; 24(10):1993. https://doi.org/10.3390/molecules24101993
Chicago/Turabian StyleWu, Hongyan, Lanlan Pan, Cuixiang Gao, Hongtao Xu, Yanping Li, Lihu Zhang, Linwei Ma, Li Meng, Xiulan Sun, and Hongbing Qin. 2019. "Quercetin Inhibits the Proliferation of Glycolysis-Addicted HCC Cells by Reducing Hexokinase 2 and Akt-mTOR Pathway" Molecules 24, no. 10: 1993. https://doi.org/10.3390/molecules24101993
APA StyleWu, H., Pan, L., Gao, C., Xu, H., Li, Y., Zhang, L., Ma, L., Meng, L., Sun, X., & Qin, H. (2019). Quercetin Inhibits the Proliferation of Glycolysis-Addicted HCC Cells by Reducing Hexokinase 2 and Akt-mTOR Pathway. Molecules, 24(10), 1993. https://doi.org/10.3390/molecules24101993