Abstract
There is a growing market for the use of hydrolysates from animal side-streams for production of high-protein supplements. However, there can be issues with development of off-flavors, either due to the raw material in question or due to the hydrolysis process itself. This study examined the development of volatile compounds during hydrolysis of hemoglobin. Briefly, porcine hemoglobin was hydrolyzed by 0.5% papain for up to 5 h, and the development of volatile compounds was analyzed via gas chromatography-mass spectrometry. The results showed that there was significant development of a number of volatile compounds with time, e.g., certain Maillard reaction and lipid oxidation products, which are likely candidates for the aroma development during hydrolysis. Furthermore, it was shown that development of a number of the volatiles was due to the hydrolysis process, as these compounds were not found in a control without enzyme.
1. Introduction
Porcine blood is a significant by-product from the slaughter industry, reported to make up 6–7% of the lean meat content of the carcass [1]. Whereas blood was previously often used in dishes such as blood sausage, it is now rarely used in household cooking and, instead, used for other purposes, mainly animal feed [1,2] and fertilizer [2,3,4]. Increasing the use of by-products from animal slaughter can significantly improve both profit for the meat industry and the sustainability of animal production [2].
At the slaughterhouse, blood is usually divided into its two fractions, plasma and the cellular fraction, the latter mainly consisting of hemoglobin [5]. The plasma fraction is currently being used in food products for human consumption, e.g., as an emulsifier [5,6]. This is rarely the case for hemoglobin, partly due to the color, but also due to the strong flavor, which in many products may be considered an off-flavor [7,8], and due to the prooxidant effect of heme [9]. However, due to the high protein content [7] and high lysine content in particular [1,10], there is a large potential for the use of hemoglobin in different types of food products, which are low in lysine.
One way of adding the hemoglobin-derived protein to food products is by adding them in the form of hydrolysates, which may provide additional health benefits [11,12,13,14,15]. Additionally, by hydrolyzing hemoglobin, the heme group can easily be removed, reducing the intense, metallic taste as well as the prooxidant activity [16]. However, hemoglobin hydrolysates, on top of showing bitter taste, which is characteristic for protein hydrolysates in general, show off-flavors that make the product unacceptable for many food applications.
In order to optimize the flavor of hemoglobin hydrolysates, it is crucial to establish whether such off-flavors are already formed during the acquisition and storage of the cellular fraction, or if they are formed during the hydrolysis process. A first approach to tentatively address the origin of this off-flavor is to identify the volatile compounds present in the raw material as well as those formed during the hydrolysis process. Previous studies on different types of hydrolysate have shown that both the raw material and the conditions during the hydrolysis may influence the profile of volatile compounds formed [17,18,19]. In these studies, compounds from lipid oxidation and from Maillard reactions have been found. While some of those compounds may actually contribute positively to the final aroma profile of the hydrolysates, others might constitute off-flavors, inhibiting the use of the hydrolysate in food applications.
Hence, the aim of this work was to determine the development of volatile compounds during hydrolysis of hemoglobin in order to address to what extent these compounds are a result of the hydrolysis itself or already present in the raw material. If possible, candidates for off-flavor-development during hydrolysis of hemoglobin will be identified.
The results showed that during hydrolysis of hemoglobin, there was a significant development of a number of volatile compounds over time, e.g., certain Maillard reaction and lipid oxidation products, which are likely candidates contributing to the aroma of the final product. Furthermore, it was shown that the development of a number of the volatiles was due to the hydrolysis process itself, as these compounds were not found in a control undergoing the same processing conditions but without enzyme.
2. Results and Discussion
Table 1 shows the yield, defined as percentage of the total dry matter content of the hydrolysate recovered in the protein fraction, at each time point during hydrolysis. Not surprisingly, yield appeared to increase with time of hydrolysis, but particularly in the last two hours of hydrolysis, whereas no change in yield was apparent between 1 h and 3 h.

Table 1.
Yield for each time point of the hydrolysis.
When producing a protein hydrolysate, as high a yield as possible is generally desirable. But of course, the development and disappearance of both desirable and undesirable volatile compounds during the course of hydrolysis should be considered.
Table 2 shows the names and relative concentrations of the volatile compounds detected via gas chromatography-mass spectrometry (GC-MS). Among the 67 volatile compounds that were detected, 23 were found to change significantly in concentration during hydrolysis, and four exhibited an increase by a factor 4 or more. It is likely that some of these compounds could change the flavor of the hydrolysate, though it should be kept in mind that perceived aroma depends on factors such as concentration, threshold, and matrix [20].
Table 2.
Relative concentrations as peak area/1000 of volatile compounds detected during hydrolysis.
The Strecker aldehydes 3-methylbutanal and benzeneacetaldehyde increased by factors 4.5 and 8 and have dry/green and hyacinth odors. 3-Methylbutanoic acid and hexanoic acid (cheesy and rancid odor descriptors) increased 15 and 42 times, respectively (all odor descriptors from [21]). Some of the mentioned compounds contribute with unpleasant/unwanted odors, but even more pleasant odors may be perceived as off-flavors, depending on the context in which the hydrolysate is used.
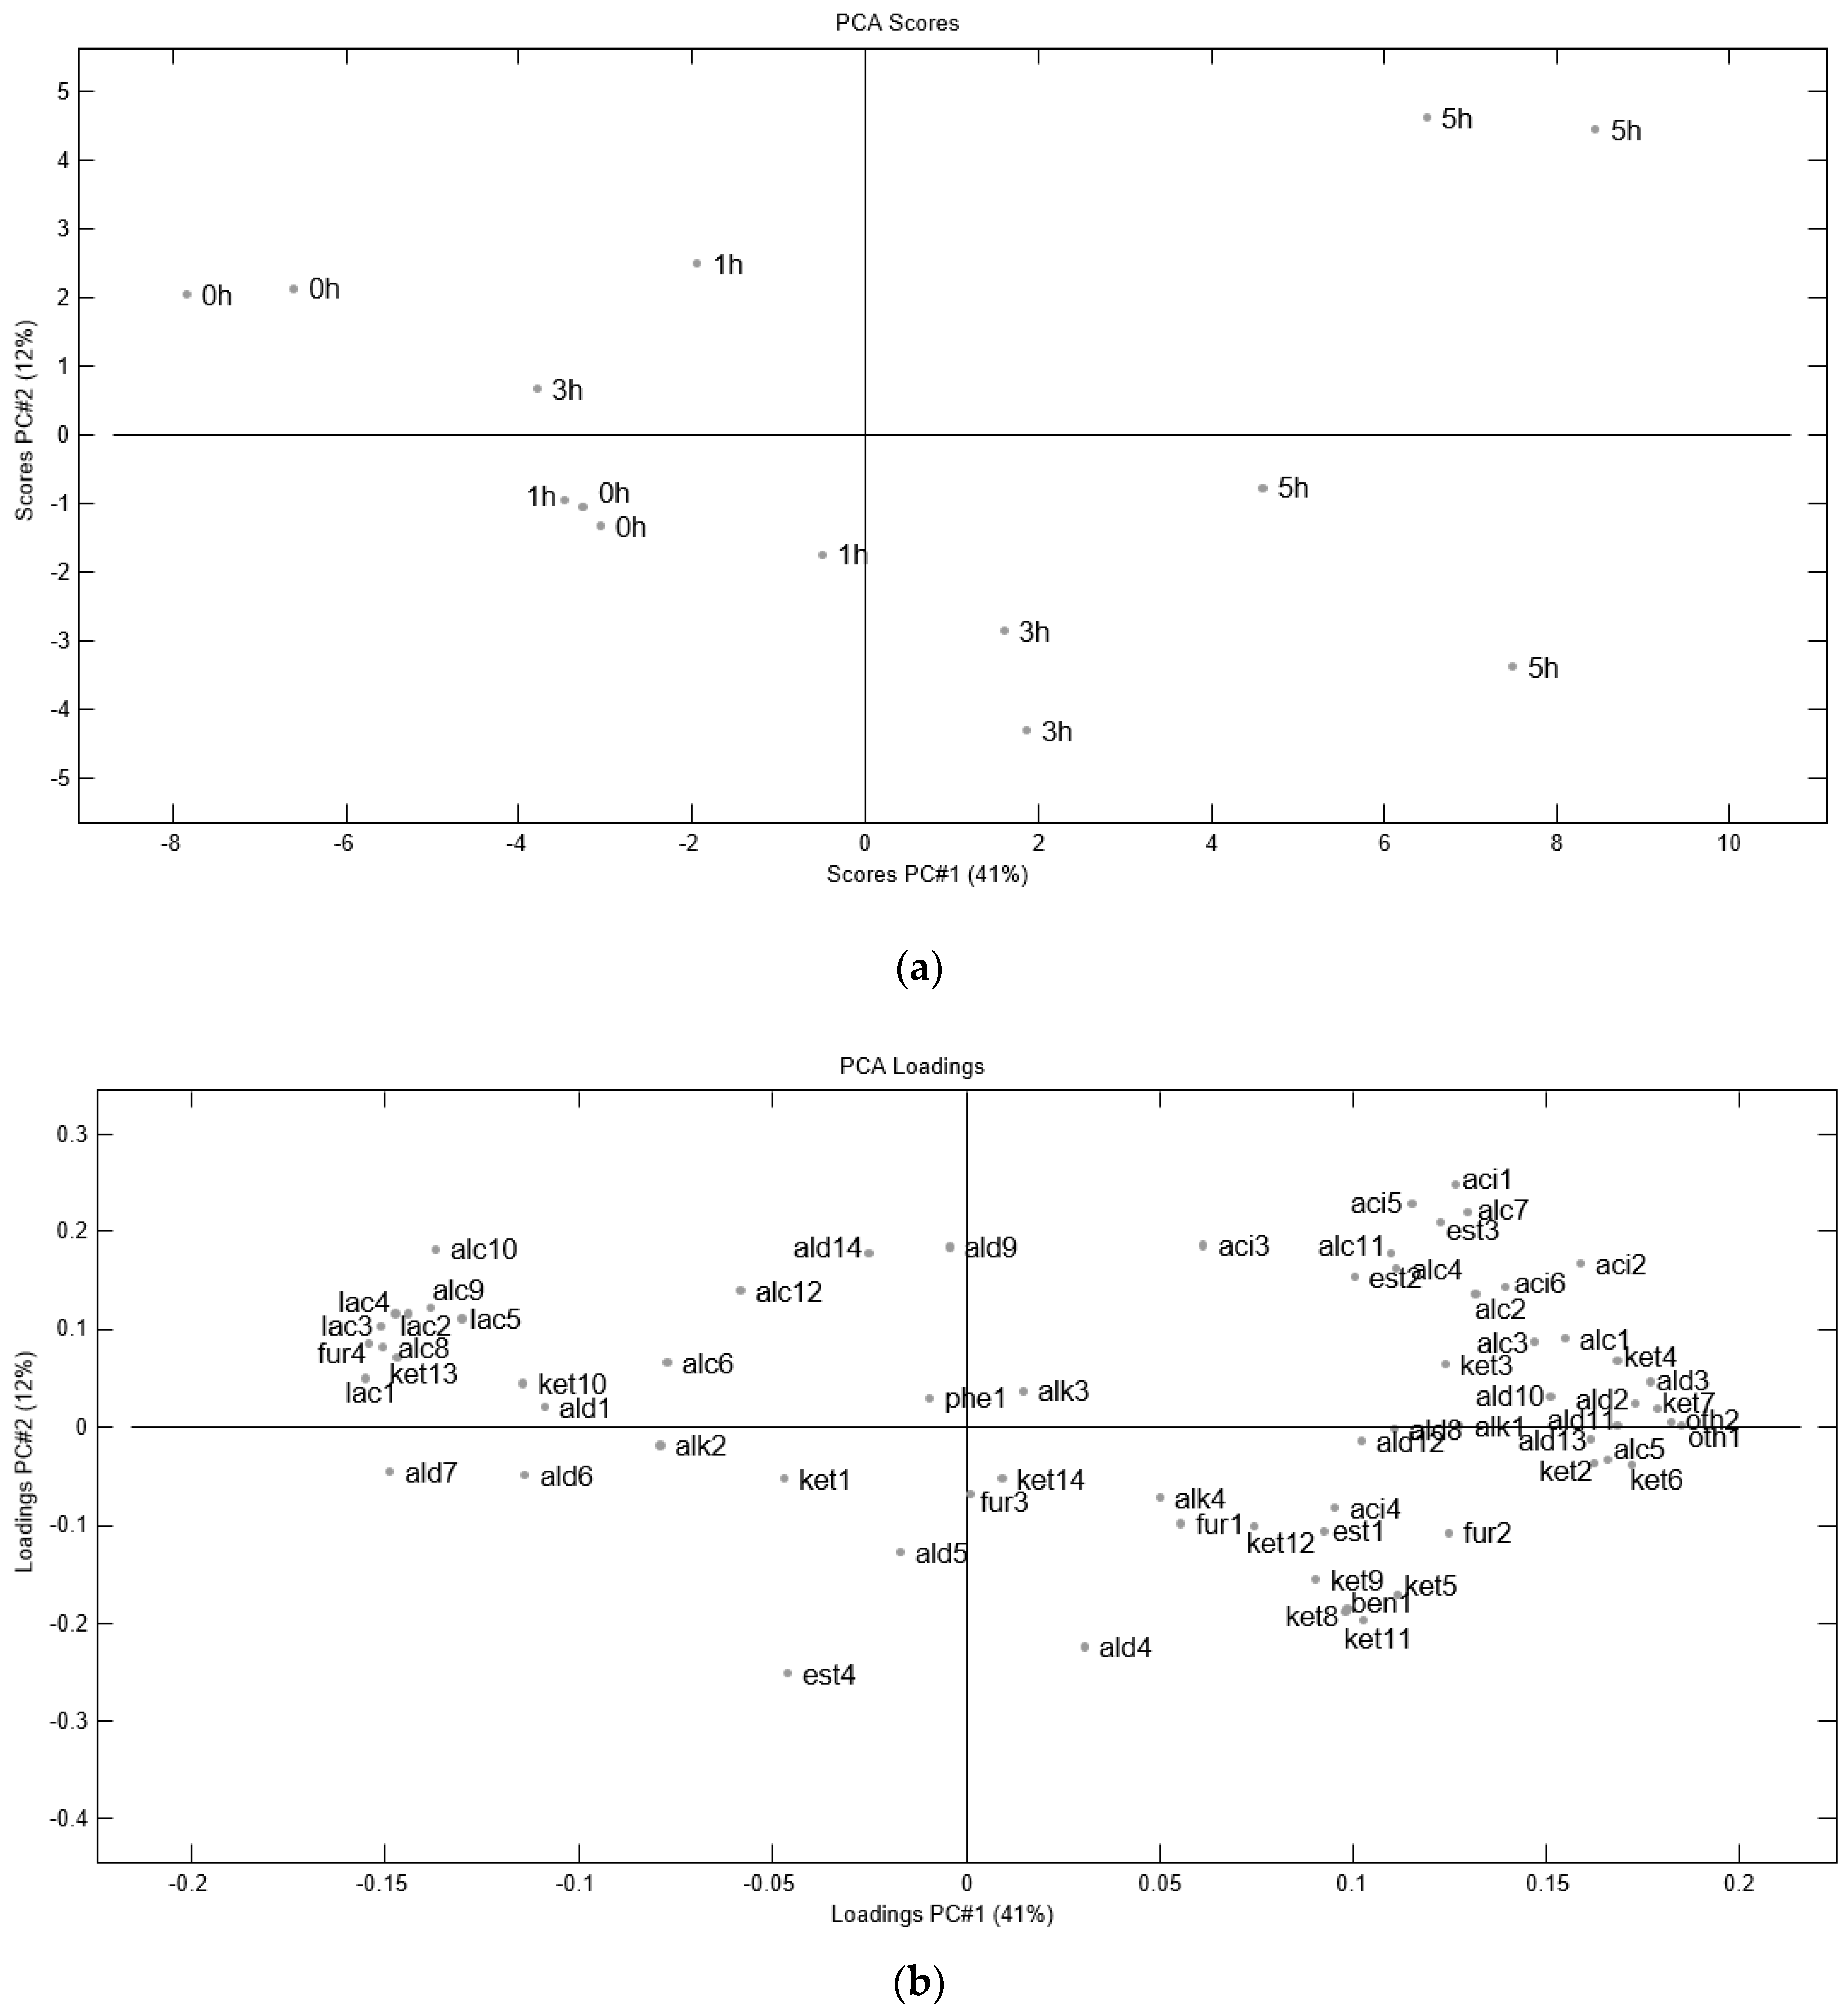
Figure 1a shows the score plot from the Principal Component Analysis (PCA) on volatile compounds during hydrolysis of porcine hemoglobin. As expected, there is a clear effect of time, especially a clear separation between 0 h and 5 h on PC1, which explains 41% of the variance. The loading plot in Figure 1b shows how the occurrence of different volatile compounds changes during hydrolysis, since compounds to the left of the loading plot are present mainly at 0 h, whereas compounds to the right of the loading plot are present mainly after 5 h of hydrolysis.

Figure 1.
(a) Principal Component Analysis (PCA) score plot (minus outliers) for the effect of time on enzymatic hydrolysis of porcine hemoglobin with papain; (b) PCA loading plot showing the occurrence of volatile compounds during hydrolysis. Codes are equivalent to those found in Table 2.
Compounds that were found to increase with time of hydrolysis but were not found in the controls without enzyme (results not shown) include: 3-methyl-2-pentanone, benzoic acid, tetradecane, and 3-methylbutanenitrile. These compounds must therefore be a result of the enzymatic hydrolysis.
The most abundant compound was by far benzaldehyde, which also increased in concentration with time (Figure 1b, Table 2). Benzaldehyde and its derivatives have been described as compounds arising from Maillard reactions [22], although other routes of formation have been suggested, such as the oxidation of different toluenes and other hydrocarbons [23].
Compounds derived from the Strecker degradation of amino acids, such as 2- and 3-methylbutanal showed a clearly increasing trend throughout hydrolysis. This makes sense, since the substrates for the formation of such aldehydes, leucine and isoleucine respectively, together with different reducing sugars, are present in blood [8]. Moreover, carbonyl compounds from the oxidation of lipids [24] or proteins [25] have been demonstrated to promote the oxidative degradation of amino acids and yield the corresponding Strecker aldehydes.
Some of the compounds with a higher load on PC1 were methyl ketones (3-methyl-2-pentanone and 3-methyl-2-butanone) and 𝛼-diketones (e.g., 2,3-pentanedione and 2,3-butanedione), meaning that these compounds showed a trend towards increasing their levels throughout hydrolysis time. Both methyl-ketones and 𝛼-diketones have been described as arising as a consequence of microbial metabolism in different food products [26]. This could actually have been possible during hemoglobin hydrolysis, since there is no previous sterilization, and the incubation temperature (55 °C) would allow for the growing of some microorganisms.
Typical compounds from fatty acid autoxidation, such as straight chain aldehydes and alk-1-ols were found. Not all of these compounds showed the same trend. Hexanal, the most extensively used marker for lipid oxidation, showed a clear growing trend during the initial hours of hydrolysis, followed by a decrease to the original level. Other compounds showed only minor, statistically insignificant variation or even a decreasing trend in the case of octanal. The presence of these compounds is most likely a consequence of the oxidation of the phospholipids remaining in the red cell fraction given the conditions during hydrolysis, at 55 °C and with a massive amount of prooxidant heme.
In this study, the effect of hydrolysis time on the development of volatile compounds was analyzed. There are other factors, which could commonly change in an industrial setup, including the raw material and choice of enzyme(s) and its concentration, to name a few. The final produced hydrolysate should be tested in a real product for a realistic evaluation of the effect of hydrolysates on off-flavor and -odor. For instance, Meinert et al. [27] found that addition of hydrolysates of porcine and bovine origin increased the occurrence of off-flavors and -odors in saveloys compared to the control without hydrolysate.
3. Materials and Methods
3.1. Enzymatic Hydrolysis
Hemoglobin was provided by a commercial slaughterhouse and kept frozen in 50 mL tubes at −80 °C prior to use. The appropriate volume of hemoglobin was thawed overnight in the fridge. Four replicas of the hemoglobin were hydrolyzed as follows: Eighty mL of thawed hemoglobin was poured into a blue cap bottle (500 mL) and 160 mL of cold tap water was added. A magnet was added to each bottle for extra friction at the bottom of the bottles. The bottles were placed in a shaking water bath at 55 °C for temperature equilibration. Enzyme stock solution was made (four replica) by weighing out 1.4057 g of the endopeptidase papain (BSC Biochemicals, Hamme, Belgium) and adding 9.378 mL of cold tap water. When the temperature of the hemoglobin had reached 55 °C, 8 mL enzyme stock solution was added to each bottle for a final enzyme concentration of 0.5%.
In a similar way, four control samples without enzyme were produced by simply adding 8 mL of cold tap water instead of the enzyme stock solution.
At time points 0 h, 1 h, 3 h, and 5 h, a 40 mL sample was taken from each blue cap bottle and transferred to a 50 mL tube (for controls, only time points 0 h and 5 h) and immediately placed in a water bath set at 95 °C for 20 min of heat treatment to inactivate the enzyme. After cooling in an ice bath for 5 min, pH was lowered by adding 1400 µL 2 M sulfuric acid in order to precipitate the heme group. The tubes were then centrifuged at 3000 g for 15 min, and the supernatants (protein fraction) were poured into clean 15 mL tubes.
Dry matter content was determined for both the complete sample (taken prior to centrifugation) and the supernatant after overnight drying at 105 °C of a small sub-sample of each sample. The remaining sample was frozen (−20 °C) until further analysis.
3.2. Volatile Compound Analysis
3.2.1. Dynamic Headspace Sampling
Samples were thawed overnight in the fridge (−4 °C). For each time point, 20 mL of each replica was transferred to a 100 mL gas washing flask and closed with a purge head. The samples were equilibrated to 37 °C in a circulating water bath and then purged with nitrogen (150 mL/min) for 60 min under magnetic stirring (200 rpm). The volatile compounds were collected on traps containing 200 mg of Tenax-TA with mesh size 60/80 (Markes International, Llantrisant, UK). Water was removed from the traps by dry-purging with nitrogen (100 mL/min) for 20 min.
3.2.2. Gas Chromatography-Mass Spectrometry
The trapped volatiles were desorbed using an automatic thermal desorption unit (TurboMatrix 350, Perkin Elmer, Shelton, CT, USA). Primary desorption was carried out by heating the trap to 250 °C with a flow (50 mL/min) of carrier gas (H2) for 15.0 min. The stripped volatiles were trapped in a Tenax TA cold trap (30 mg held at 5 °C), which was subsequently heated at 300 °C for 4 min (secondary desorption, outlet split 1:10). This allowed for rapid transfer of volatiles to a gas chromatograph-mass spectrometer (GC-MS, 7890A GC-system interfaced with a 5975C VL MSD with Triple-Axis detector from Agilent Technologies, Palo Alto, CA, USA) through a heated (225 °C) transfer line. Separation of volatiles was carried out on a ZB-Wax capillary column 30 m long × 0.25 mm internal diameter, 0.50 µm film thickness. The column pressure was held constant at 2.3 psi, resulting in an initial flow rate of 1.4 mL/min using hydrogen as the carrier gas. The column temperature program was: 10 min at 30 °C, from 30 °C to 240 °C at 8 °C/min, and finally, 5 min at 240 °C. The mass spectrometer was operating in the electron ionization mode at 70 eV. Mass-to-charge ratios between 15 and 300 were scanned. Peak areas and mass spectra were extracted from the chromatograms using the PARAFAC2 based software PARADISe [28] and mass spectra were identified using the NIST05 database. Volatile compound identification was confirmed by comparison with retention indices (RI) of authentic reference compounds or retention indices reported in literature.
3.3. Data Analysis
3.3.1. GC-MS
Principal component analysis was performed on autoscaled peak areas using the software Latentix 2.12 (Latentix Aps, Frederiksberg, Denmark). Analysis of variance was performed using JMP 13.0.0 (SAS Institute Inc., Cary, NC, USA) and least square means were compared by Student’s t-test (p ≤ 0.05) (JMP 13.0.0, SAS Institute Inc.).
3.3.2. Yield
Yield was calculated for each time point as the percentage of total dry matter content of the hydrolysate recovered in the supernatant (protein fraction) after centrifugation.
4. Conclusions
The obtained results showed that during hydrolysis of hemoglobin, there was a significant development of 23 volatile compounds over time, e.g., certain Maillard reaction and lipid oxidation products, which are likely candidates contributing to the aroma of the final product. Furthermore, it was shown that the development of a number of the volatiles was due to the hydrolysis process itself, as these compounds were not found in a control having undergone the same processing conditions, only without enzyme. The final produced hydrolysate should be tested in a real product for a realistic evaluation of the effect of the hydrolysate on off-flavor and -odor.
Acknowledgments
This project was funded by the Norma og Frode S. Jacobsens Foundation and by Danish Crown Ingredients.
Author Contributions
J.R.-C., K.H.B., E.T.H. and R.L. conceived and designed the experiments; K.H.B. performed the experiments; M.A.P. analyzed the data; J.R.-C., K.H.B., M.A.P. and R.L. wrote the paper.
Conflicts of Interest
This project was partially funded by Danish Crown Ingredients, who participated in the design of the experiment and agreed to publish the results.
References
- Wismer-Pedersen, J. Use of haemoglobin in foods—A review. Meat Sci. 1988, 24, 31–45. [Google Scholar] [CrossRef]
- Ur Rahman, U.; Sahar, A.; Khan, M.A. Recovery and utilization of effluents from meat processing industries. Food Res Int. 2014, 65(Part C), 322–328. [Google Scholar] [CrossRef]
- Roy, M.; Karmakar, S.; Debsarcar, A.; Sen, P.K.; Mukherjee, J. Application of rural slaughterhouse waste as an organic fertilizer for pot cultivation of solanaceous vegetables in India. Int. J. Recycl. Org. Waste Agric. 2013, 2, 6. [Google Scholar] [CrossRef]
- Alao, B.; Falowo, A.; Chulayo, A.; Muchenje, V. The Potential of Animal By-Products in Food Systems: Production, Prospects and Challenges. Sustainability 2017, 9, 1089. [Google Scholar] [CrossRef]
- Bah, C.S.F.; Bekhit, A.E.-D.A.; Carne, A.; McConnell, M.A. Slaughterhouse Blood: An Emerging Source of Bioactive Compounds. Compr. Rev. Food Sci. Food Saf. 2013, 12, 314–331. [Google Scholar] [CrossRef]
- Ofori, J.A.; Hsieh, Y.-H.P. The use of blood and derived products as food additives. In Food Additive; El-Samragy, Y., Ed.; InTech: Rijeka, Croatia, 2012; pp. 229–256. [Google Scholar]
- Piot, J.M.; Guillochon, D.; Thomas, D. Preparation of decolorized peptides from slaughter-house blood. MIRCEN J. Appl. Microbiol. Biotechnol. 1986, 2, 359–364. [Google Scholar] [CrossRef]
- Duarte, R.T.; Carvalho Simões, M.C.; Sgarbieri, V.C. Bovine Blood Components: Fractionation, Composition, and Nutritive Value. J. Agric. Food Chem. 1999, 47, 231–236. [Google Scholar] [CrossRef] [PubMed]
- Igene, J.O.; King, J.A.; Pearson, A.M.; Gray, J.I. Influence of heme pigments, nitrite, and non-heme iron on development of warmed-over flavor (WOF) in cooked meat. J. Agric. Food Chem. 1979, 27, 838–842. [Google Scholar] [CrossRef]
- Landmann, W.A.; Dill, C.W.; Young, C.R. Nutritive Value of Globin-Amino Acid and Complementary Globin-Cereal Mixtures. J. Nutr. 1980, 110, 2254–2262. [Google Scholar] [CrossRef] [PubMed]
- Lafarga, T.; Hayes, M. Bioactive peptides from meat muscle and by-products: Generation, functionality and application as functional ingredients. Meat Sci. 2014, 98, 227–239. [Google Scholar] [CrossRef] [PubMed]
- Mora, L.; Reig, M.; Toldrá, F. Bioactive peptides generated from meat industry by-products. Food Res. Int. 2014, 65(Part C), 344–349. [Google Scholar] [CrossRef]
- Li-Chan, E.C.Y. Bioactive peptides and protein hydrolysates: Research trends and challenges for application as nutraceuticals and functional food ingredients. Curr. Opin. Food Sci. 2015, 1, 28–37. [Google Scholar] [CrossRef]
- Clemente, A. Enzymatic protein hydrolysates in human nutrition. Trends Food Sci. Technol. 2000, 11, 254–262. [Google Scholar] [CrossRef]
- Sun, Q.; Shen, H.; Luo, Y. Antioxidant activity of hydrolysates and peptide fractions derived from porcine hemoglobin. J. Food Sci. Technol. 2011, 48, 53–60. [Google Scholar] [CrossRef] [PubMed]
- Ofori, J.A.; Hsieh, Y.-H.P. Issues Related to the Use of Blood in Food and Animal Feed. Crit. Rev. Food Sci. Nutr. 2014, 54, 687–697. [Google Scholar] [CrossRef] [PubMed]
- Leksrisompong, P.P.; Miracle, R.E.; Drake, M. Characterization of Flavor of Whey Protein Hydrolysates. J Agric. Food Chem. 2010, 58, 6318–6327. [Google Scholar] [CrossRef] [PubMed]
- Guo, X.; Tian, S.; Small, D.M. Generation of meat-like flavourings from enzymatic hydrolysates of proteins from Brassica sp. Food Chem. 2010, 119, 167–172. [Google Scholar] [CrossRef]
- Jarunrattanasri, A.; Theerakulkait, C.; Cadwallader, K.R. Aroma Components of Acid-Hydrolyzed Vegetable Protein Made by Partial Hydrolysis of Rice Bran Protein. J. Agric. Food. Chem. 2007, 55, 3044–3050. [Google Scholar] [CrossRef] [PubMed]
- Guichard, E. Interactions between flavor compounds and food ingredients and their influence on flavor perception. Food Rev. Int. 2002, 18, 49–70. [Google Scholar] [CrossRef]
- The Good Scents Company Information System. Available online: http://www.thegoodscentscompany.com/ (accessed on 8 January 2017).
- Cui, H.; Jia, C.; Hayat, K.; Yu, J.; Deng, S.; Karangwa, E.; Duhoranimana, E.; Xia, S.; Zhang, X. Controlled formation of flavor compounds by preparation and application of Maillard reaction intermediate (MRI) derived from xylose and phenylalanine. RSC Adv. 2017, 7, 45442–45451. [Google Scholar] [CrossRef]
- Varlet, V.; Prost, C.; Serot, T. Volatile aldehydes in smoked fish: Analysis methods, occurence and mechanisms of formation. Food Chem. 2007, 105, 1536–1556. [Google Scholar] [CrossRef]
- Hidalgo, F.J.; Zamora, R. Strecker-type Degradation Produced by the Lipid Oxidation Products 4,5-Epoxy-2-Alkenals. J. Agric. Food Chem. 2004, 52, 7126–7131. [Google Scholar] [CrossRef] [PubMed]
- Estévez, M.; Ventanas, S.; Heinonen, M. Formation of Strecker aldehydes between protein carbonyls—α-Aminoadipic and γ-glutamic semialdehydes—and leucine and isoleucine. Food Chem. 2011, 128, 1051–1057. [Google Scholar] [CrossRef]
- Ott, A.; Germond, J.-E.; Baumgartner, M.; Chaintreau, A. Aroma Comparisons of Traditional and Mild Yogurts: Headspace Gas Chromatography Quantification of Volatiles and Origin of α-Diketones. J. Agric. Food Chem. 1999, 47, 2379–2385. [Google Scholar] [CrossRef] [PubMed]
- Meinert, L.; Broge, E.H.; Bejerholm, C.; Jensen, K. Application of hydrolyzed proteins of animal origin in processed meat. Food Sci. Nutr. 2016, 4, 290–297. [Google Scholar] [CrossRef] [PubMed]
- Johnsen, L.G.; Skou, P.B.; Khakimov, B.; Bro, R. Gas chromatography–mass spectrometry data processing made easy. J. Chromatogr. A 2017, 1503, 57. [Google Scholar] [CrossRef] [PubMed]
Sample Availability: Samples of the compounds are not available from the authors. |
© 2018 by the authors. Licensee MDPI, Basel, Switzerland. This article is an open access article distributed under the terms and conditions of the Creative Commons Attribution (CC BY) license (http://creativecommons.org/licenses/by/4.0/).