Abstract
The Guan-Xin-Shu-Tong capsule (GXSTC) is a well-known traditional Chinese medicine that is used for the treatment of coronary heart disease. Despite its common use in China, basic pharmacological research on its active components is limited. A comprehensive analytical method using quadrupole-time-of-flight mass spectrometry (Q-TOF/MS), specifically with the Triple TOF 5600 platform, was developed to characterize the compounds in the GXSTC powder itself (in vitro) as well as the active components in healthy and heart disease model rats after its oral administration (in vivo). The 5600 platform was operated in both positive and negative ion modes, before the raw data were processed using the extracted ion chromatography (EIC), mass defect filtering (MDF) and fragment filtering (FF) techniques. With the aid of reference compounds for retention time and fragment ion comparisons, 18 compounds were unambiguously identified in vitro. An additional 56 other compounds were tentatively characterized using the accurate quasi-molecular ion mass and Tandem mass spectrometry (MS/MS) fragmentation pattern strategies. Among them, 30 compounds were characterized based on the MDF and FF approaches. Normal rats in addition to hyperlipidemic (HL) and acute blood stasis (ABS) model rats were given a single oral dose of GXSTC solution for subsequent blood analysis at 1 and 2 h after administration. A total of 24 prototypecomponents and 20 metabolites derived from GXSTC were differentially detected across the three animal groups, including the absence of four phase II phenolic acid metabolites in the ABS group and the presence of three diterpenoid-related metabolites exclusive to the HL group. The use of reference compounds as well as the mass defect and fragment-filtering strategies were critical to identify GXSTC compounds in vitro and in vivo. This can be used for further quality control and pharmacological studies aimed at characterizing the active and potential beneficial compounds of this ancient medicine.
1. Introduction
The developments of traditional Chinese medicine (TCM) are based on the clinical outcomes with a history of more than 3000 years [1,2,3,4,5]. With the development of analytical technology and pharmacology, the mechanism of how different ingredients in the formulation work together has attracted more attention than ever before [6,7]. To date, most of the individual materials used in TCM have been investigated for the active compounds [8,9,10]. However, the extracted active compounds may cause additional unexpected side effects compared to the formulation in clinical trials [11,12]. Therefore, it is worthwhile to study the formulation as a whole family, especially with the comparison of the data in vitro and in vivo [13].
The Guan-Xin-Shu-Tong capsule (GXSTC), developed from a Mongolian medicine formulation, has been widely used for the treatment of coronary heart disease and angina pectoris since 2002 in China. It is consisted of Choerospondias axillaris, Salvia miltiorrhiza Bunge, Syzigium aromaticum, Dryobalanops and Tabaschir at the ratio of 16:8:2:1:1 by weight, with the curative clinical effects on alleviating the degree and scope of myocardial ischemia, minimizing the occurrence of cardiac infarction markedly [14], inhibiting the elevation of phosphate kinase in dogs [15] and decreasing the ventricular premature beat ventricular tachycardia in rats [16]. Furthermore, GXSTC was also found to be effective in the treatment of Alzheimer’s disease [17]. However, the mechanisms of the various ingredients work together at the molecular level and the key active components in vivo are unknown, resulting in the research outcomes not being recognized internationally. Therefore, it is of great importance to investigate its chemical constituents both in vitro and in vivo in order to reveal the real mechanism with the aid of state-of-the-art technologies.
To date, a number of studies on the composition of the single herbs in GXSTC have been reported [18,19,20,21,22,23]. The pharmacological and pharmacodynamics studies [24,25,26,27,28] indicated that the total flavonoids, gallic acid (Choerospondias axillaris), diterpenoids and phenolic acids (Salvia miltiorrhiza Bunge) in the raw materials may be the main active component. However, only salvianolic acid B, tanshinone IIA, and bornel were used as marker compounds for the quality control in the current specification for GXSTC [29].The chemical substances are one of the important factors to explore their mechanism of action. However, the constituents in GXSTC in vitro and in vivo have not been fully investigated [30]. Until now, there were only three published papers on the chromatographic fingerprint and determination of several compounds in GXSTC by high performance liquid chromatography [31,32] or gas chromatography [33]. Among the five herbs in GXSTC, Choerospondias axillaris accounts for the highest ratio (57%). However, there was only nuclear magnetic resonance spectroscopy data available for the purpose of identification of this compound [18,19]. No relevant mass spectrometry data have been reported and a similar situation was found for Tabaschir. The reported identification analysis of Salvia miltiorrhiza Bunge only included nuclear magnetic resonance spectroscopy, high performance liquid chromatography and liquid chromatography quadrupole-time-of-flight mass spectrometry (LC-Q-TOF/MS) [20,21,22,23]. Currently, LC-Q-TOF/MS has been applied widely in the separation and identification of complex components in TCM [30,34,35]. Compared to other mass spectrometry methods, Q-TOF/MS has the characteristics of greater accuracy, higher scanning speed and a wider range of masses [36]. It can provide an accurate molecular mass and adequate structural information for the characteristic fragment as well as the isotopic abundance and element composition [37]. For mass data provided by high-resolution mass spectrometry, the information dependent acquisition (IDA) strategy can maximize the discovery of compounds [30].Mass defect refers to the difference between the exact molecular weight of an element (compound) and its nearest integral value. For the similar structure compounds (such as the parent drug and its metabolites being natural homologues), there is a large difference in the molecular weight of integral part, but the mass defect is usually located in a very narrow range [35]. This provides the theoretical basis for identification of a type of compounds with similar structure via mass defect filtering (MDF). For TCM, a type of compounds with similar structure usually occurs in a similar cleavage in collision-induced dissociation to generate one or more similar fragment ions. At the same time, the neutral loss of specificity is common in the collision induced dissociation process, such as the loss of neutral sugar residue in the most common glycosides [38]. MDF and FF approaches can greatly reduce the chromatogram response of non-target compounds and back ground ions, so that the covered target compounds in complex background could appear and be qualitatively analyzed [39,40].
In this paper, a comprehensive analytical method with high resolution, sensitivity, and accuracy based on Q-TOF/MS was developed to explore the compounds in the GXSTC powder itself (in vitro) and the active components of GXSTC in vitro for the first time. Furthermore, the data profiling procedure with the MDF and FF approaches was highlighted in this study. There were mainly three steps for this study design strategy. The first step was to characterize the compounds in GXSTC (in vitro) and further identify their source by comparing them with five plant extracts, respectively. Then, the typical heart disease models of rats were established in order to approach the clinical condition, which included hyperlipidemia (HL) and acute blood stasis (ABS) models. The last step was to identify and statistically analyze the active components in healthy and heart disease model rats after oral administration of GXSTC (in vivo).This study may be the foundation for the quality control and pharmacological study for GXSTC, which may further provide valuable data for the development of new drug.
2. Results and Discussion
2.1. Optimization of Method Conditions
The acetonitrile/water system provided better separation, sensitivity and less background noise when compared with methanol/water system. Furthermore, the addition of formic acid with different ratios (from 0.01% to 0.5%) could inhibit ionization of acidic ingredients in the sample and influence the peak shape. Overall, 0.1% formic acid acetonitrile/water was the optimal solvent systems in this paper.
2.2. Analysis of the Compounds of GXSTC In Vitro
Under the optimized LC–MS conditions described above, the base peak chromatograms (BPC) of GXSTC in positive and negative modes in vitro are shown in Figure 1A,B. A total of 18 compounds were unambiguously identified by comparing the retention time and MS data against that of the reference standards, which are illustrated in Table S1. The other 56 compounds were tentatively characterized by an accurate mass of quasi-molecular ions (<5 ppm) and MS/MS fragmentation patterns with the aid of the related literature. Among them, 30 compounds were identified based on MDF and FF approach, which are shown in Table 1. A total of 74 compounds were identified in GXSTC in vivo, which is listed in Table 2 with the ion fragment MS/MS data in Table S2. Furthermore, the structures of 74 compounds are shown in Figure S1.
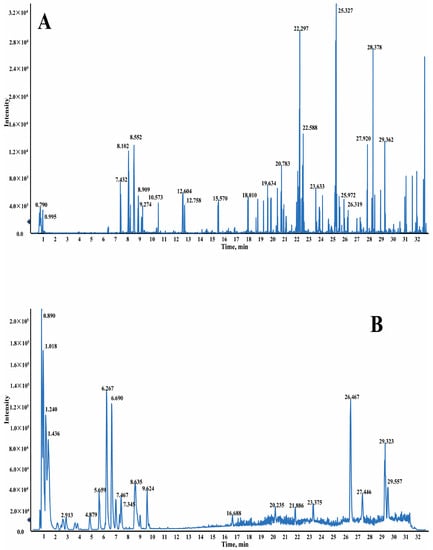
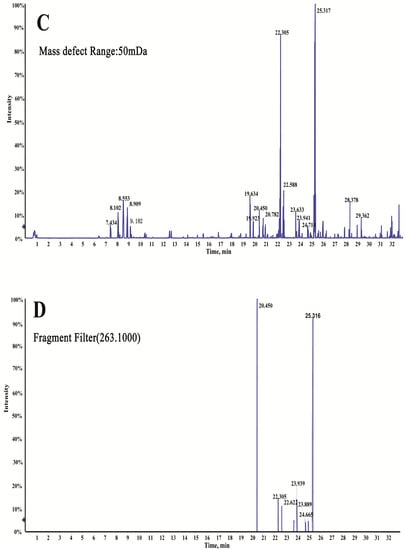
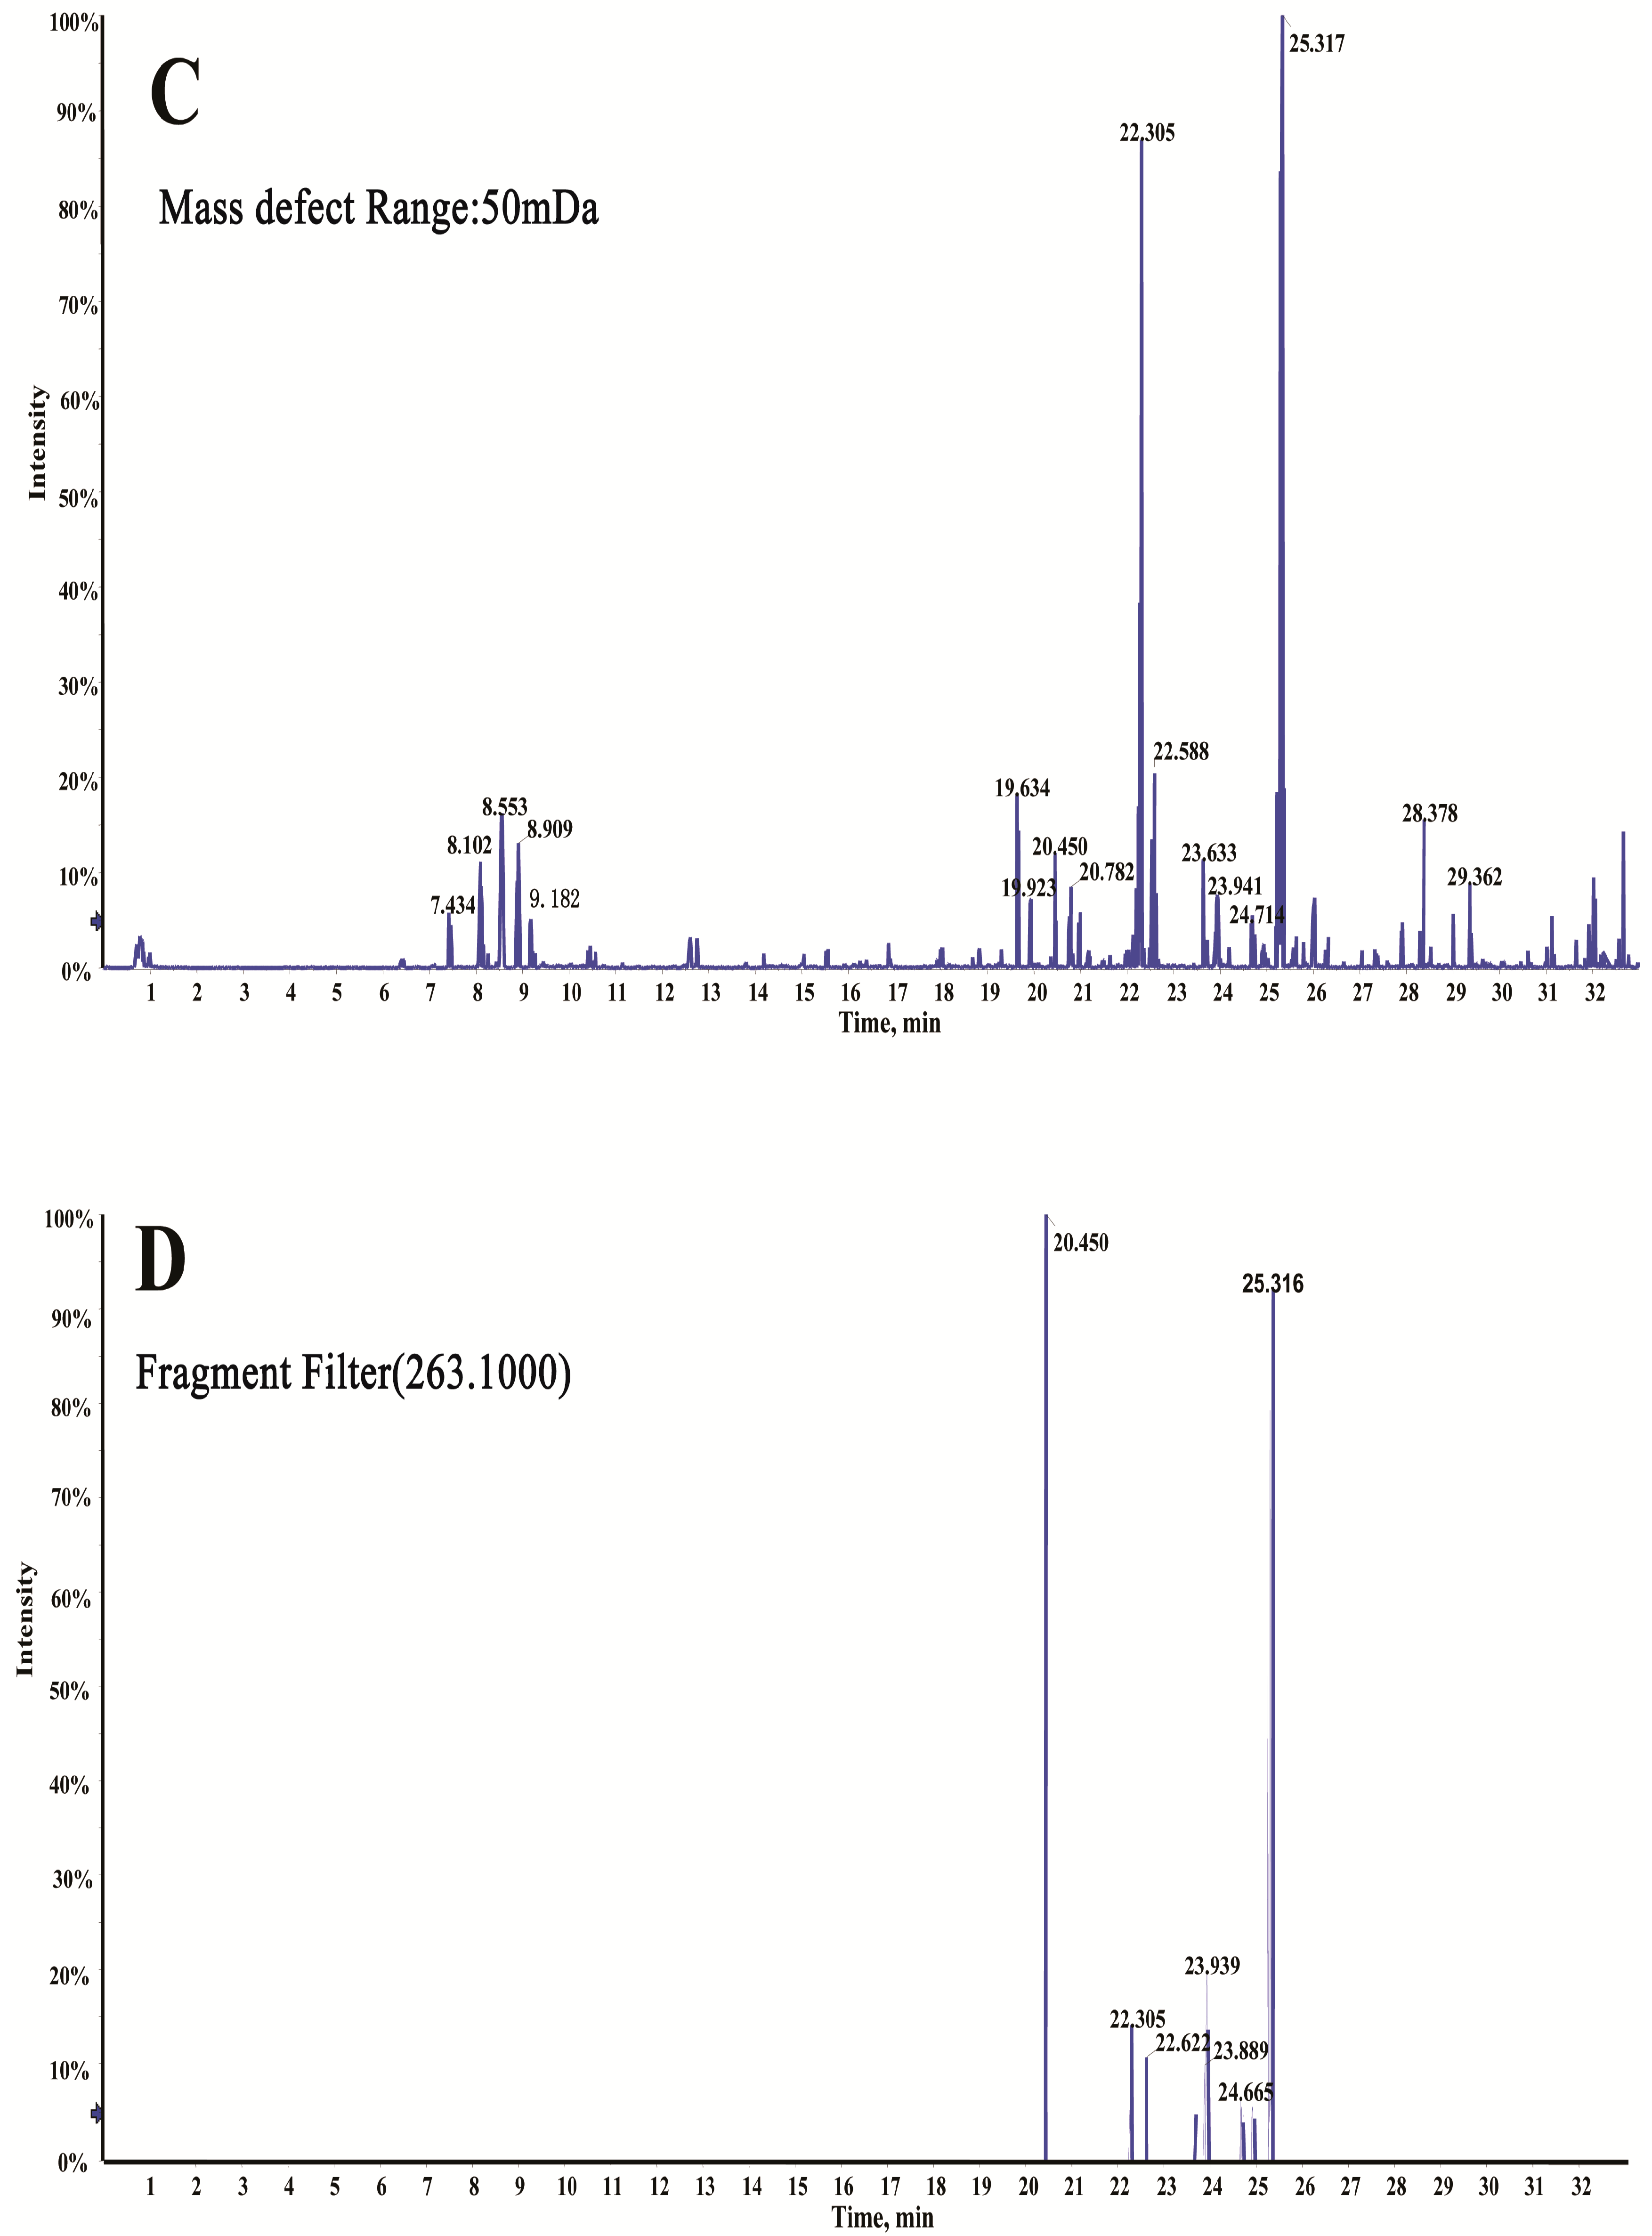
Figure 1.
Base peak chromatograms (BPCs) of GXSTC in positive mode (A) and in negative mode (B) by liquid chromatography quadrupole-time-of-flight mass spectrometry (LC-Q-TOF/MS), and total ion chromatograms after MDF (C) and FF (D) in positive mode.

Table 1.
Identification of compoundsin Guan-Xin-Shu-Tong capsule (GXSTC) based on mass defect filtering (MDF) and fragment filtering (FF) by liquid chromatography quadrupole-time-of-flight mass spectrometry (LC-Q-TOF/MS).
Table 2.
Identification of compounds in GXSTC by LC-Q-TOF/MS in positive and negative ion modes.
2.2.1. MDF Approach Profiling
The efficient and reliable MDF has a powerful data processing capability. For example, the theoretical mass defect of 0.1557 Da of tanshinone IIA was adopted as the mass defect filtering reference or preliminary screening of diterpenoids. The defect tolerance and the filtering mass range were set at 50 mDa and 200–400 Da, respectively. Following this, a new chromatogram via MDF was generated and shown in Figure 1C, which possessed fewer peaks for target and systematical analysis.
2.2.2. Fragment Filtering Approach Profiling
After unambiguous identification of cryptotanshinone, tanshinone I, dihydrotanshinone I, tanshinone IIA and miltirone by comparing the retention time and MS/MS data with the corresponding reference standard, the fragment ions of theoretical values for mass-to-charge ratio (m/z) 279.1, 265.1, 263.1, 261.1 and 233.1 were found to be the typical fragment ions for diterpenoids, which were selected as the referencesin the FF. The predicted compound of dehydrotanshinone was used to demonstrate the method of identifying the compound with the filter. When the fragment of m/z 263.1000 was taken into the fragment filter and employed in Experiment 2, a filtered chromatogram was generated (Figure 1D). The peaks with retention times of 22.31 min and 25.32 min were already identified preliminarily as cryptotanshinone and tanshinone IIA by target screening, while the peaks with retention times of 20.45 min, 23.94 min and 24.67 min were listed as unknown compounds to be identified. The collision-induced dissociation information from the quadrupole shown only a rough precursor ion m/z of 293.1 and an accurate mean m/z of 293.1181 was obtained from the TOF/MS in accordance with the retention time. The formula was predicted as C19H16O3 with the aid of the formula finder function, provided by PeakView® software (version 2.2, Sciex, Redwood City, CA, USA). After screening the identified diterpenoids, tanshinone IIA was found to have fragments of m/z 178.0771, 219.1169 and 235.0750 similar to the unknown compound. Consequently, the compound was predicted as 1-dehydrotanshinone with the aid of the literature [41]. The other two compounds were predicted as 1-dehydromiltirone and danshexinkun D by a similar FF approach.
2.2.3. Identification of Flavonoids and Their Glycosides
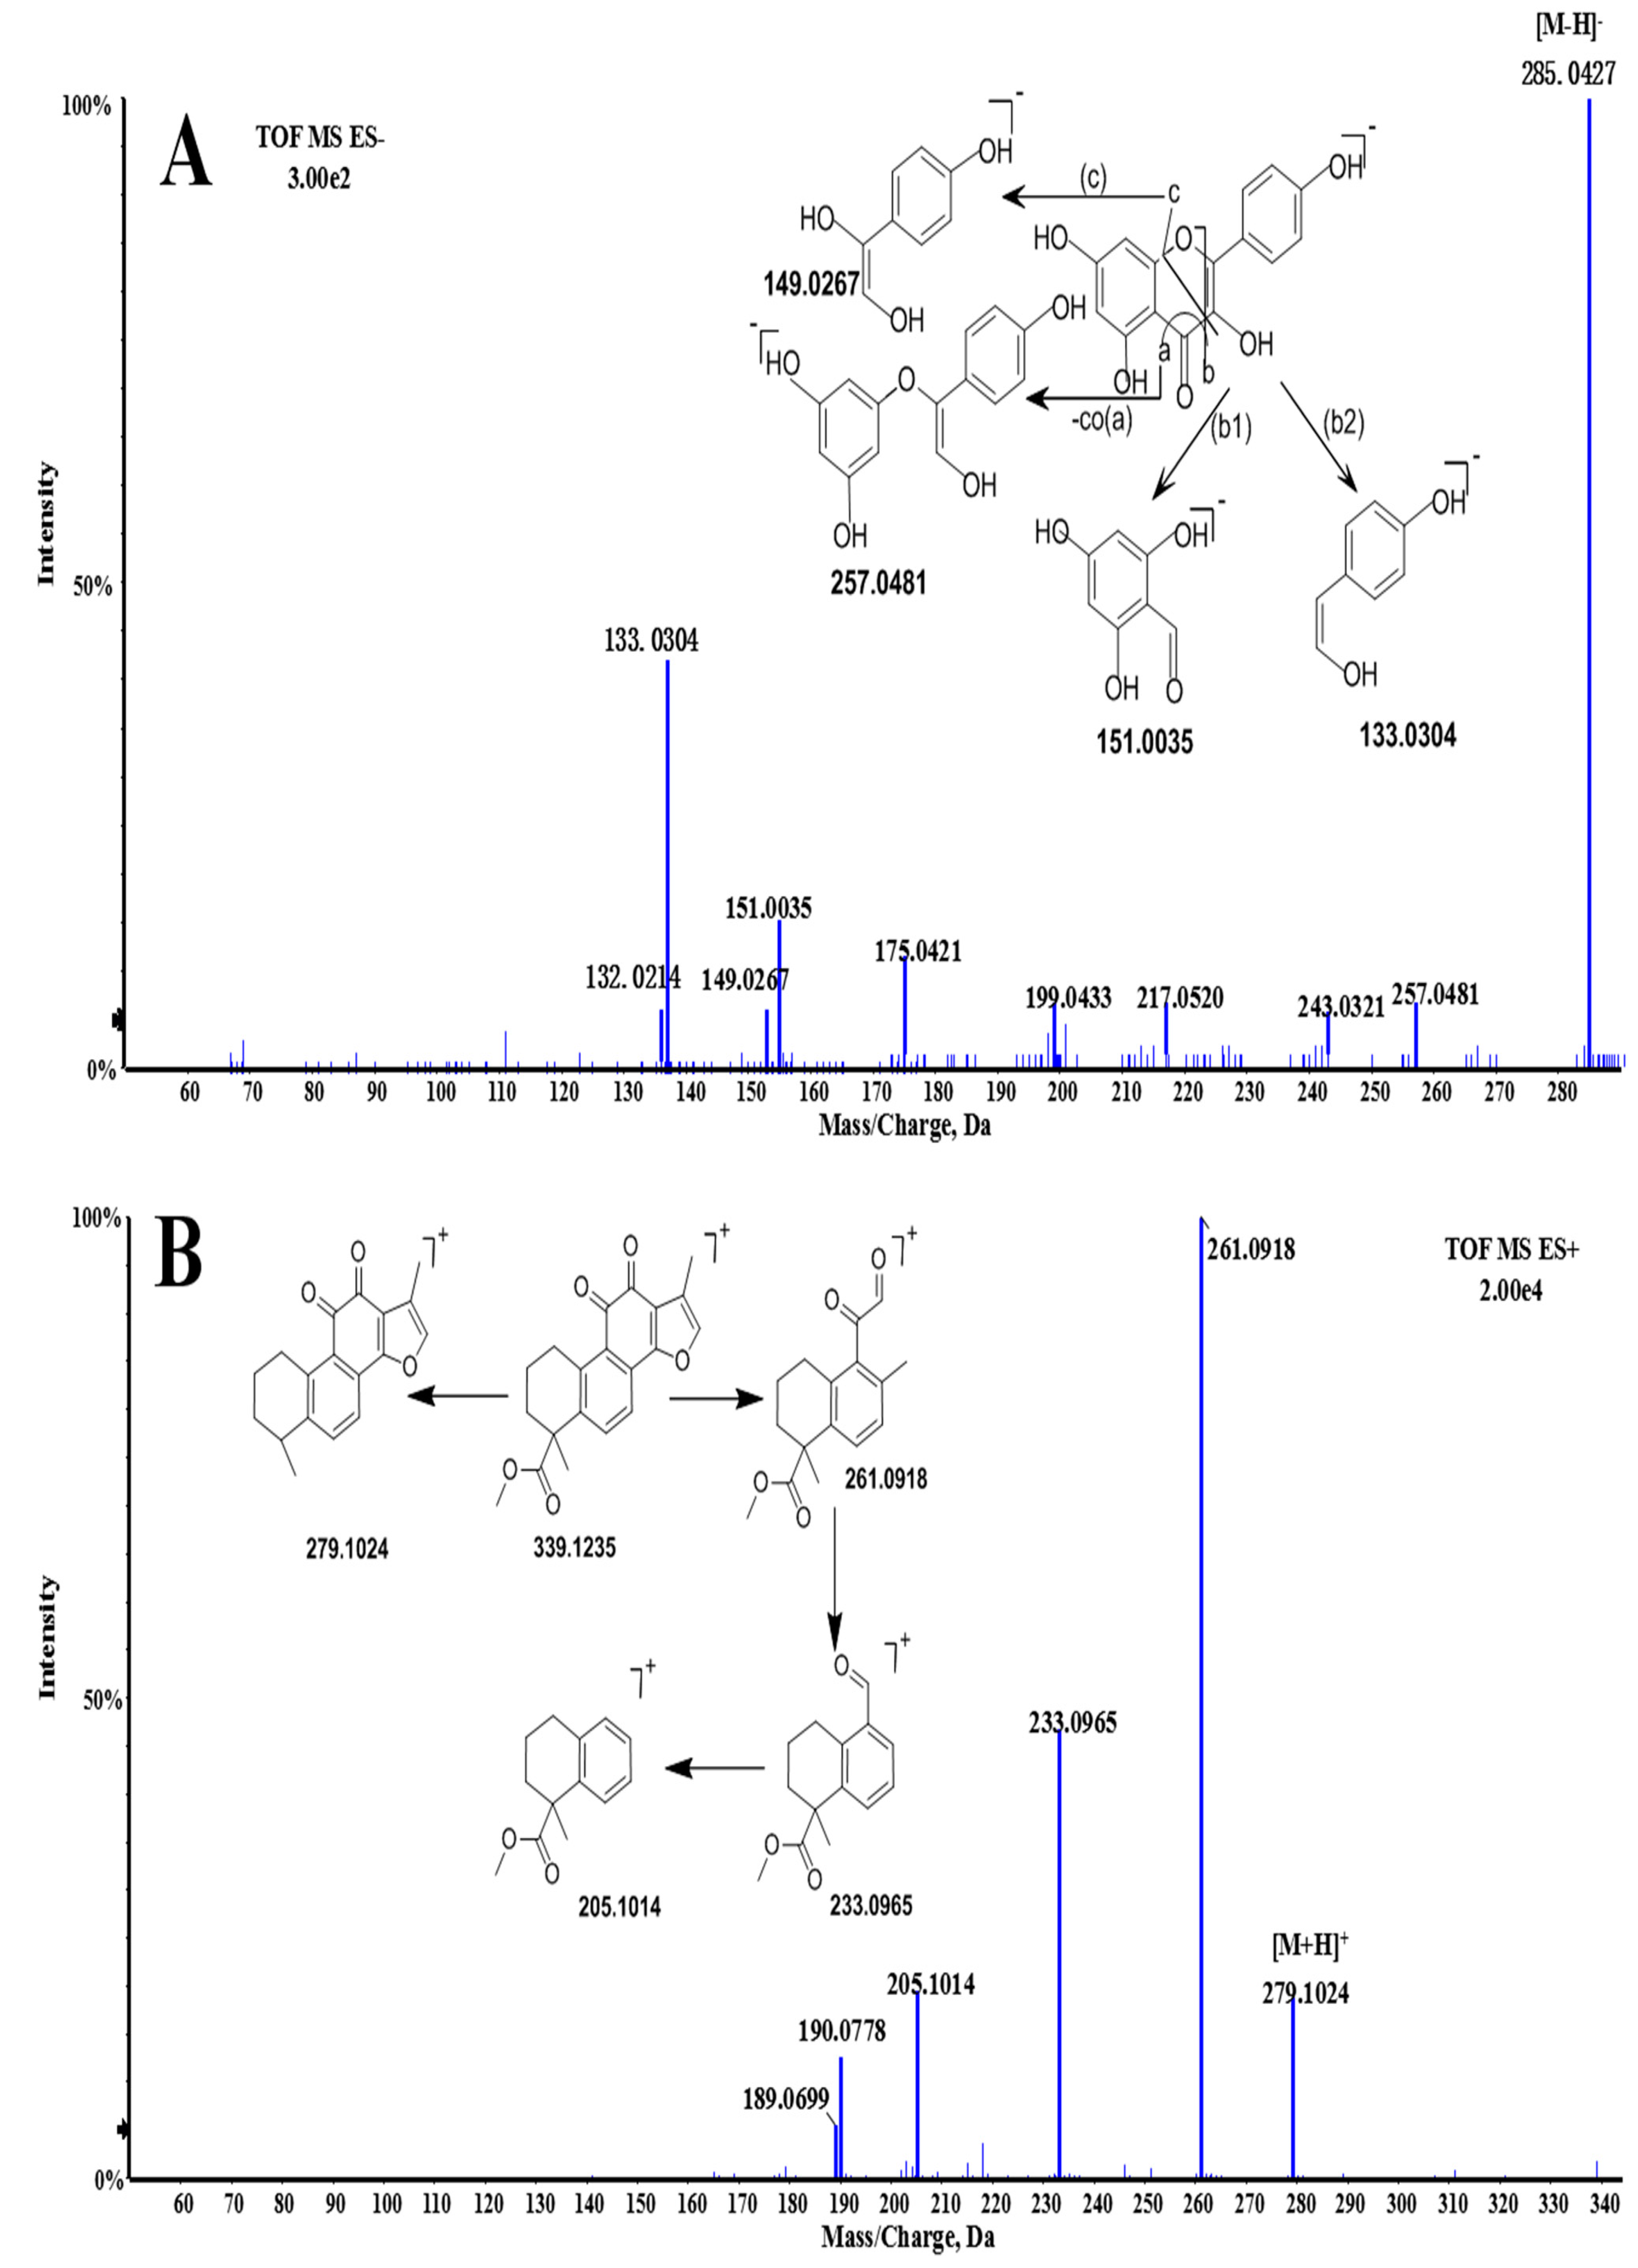
The total flavonoids in the raw Choerospondias axillaris were reported to be the most significant compounds that might be associated with the pharmacological effects in the treatment of cardiovascular diseases [42,43,44]. A total of 7 types of flavonoids and their glycosides were identified in vitro. Among them, compound 31 was unambiguously identified as quercetin by comparison of the retention time and TOF/MS data with its reference standards. The MDF and FF approaches were applied in the flavonoid identification. The mass defect of 0.1137 Da (kaempferol) was selected as the MDF reference along with the defect tolerance of 50 mDa and the filtering mass range of 200–600 Da. Through the analysis of flavonoid fragmentation, the fragments of m/z 133.0 and m/z 151.0 in the negative ion mode in addition to m/z 301.0 in the positive ion mode were adopted as FF references. Compound 30 (kaempferol) was selected as the example to demonstrate the fragmentation pathways (Figure 2A). It showed a molecular ion [M − H]− at m/z 285.0427, which may further lose CO (28Da) to form the fragment with an m/z 257.0481. The ions at m/z of 151.0035 and 133.0304 were due to the loss of C8H6O2 and C7H4O4 group from the parent ion. In addition, compound 16 (hyperin) showed a molecular ion [M + H]+ at an m/z of 465.1133 in the positive mode and product ion at an m/z of 301.0438, indicating the loss of galactopyranose from the precursor ion sequentially, which was the same as compound 19 (kaempferol-7-O-glucopyranoside).
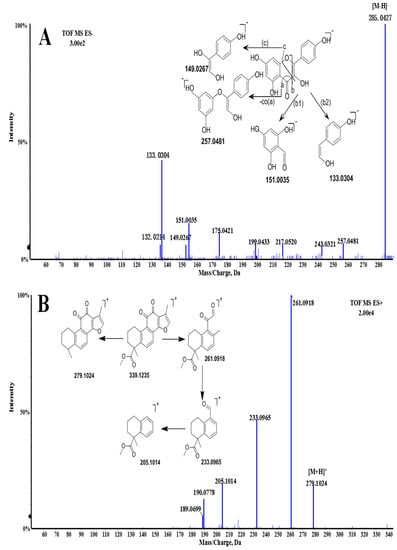
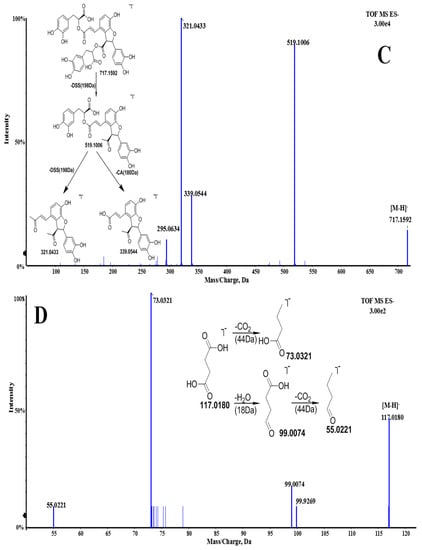
Figure 2.
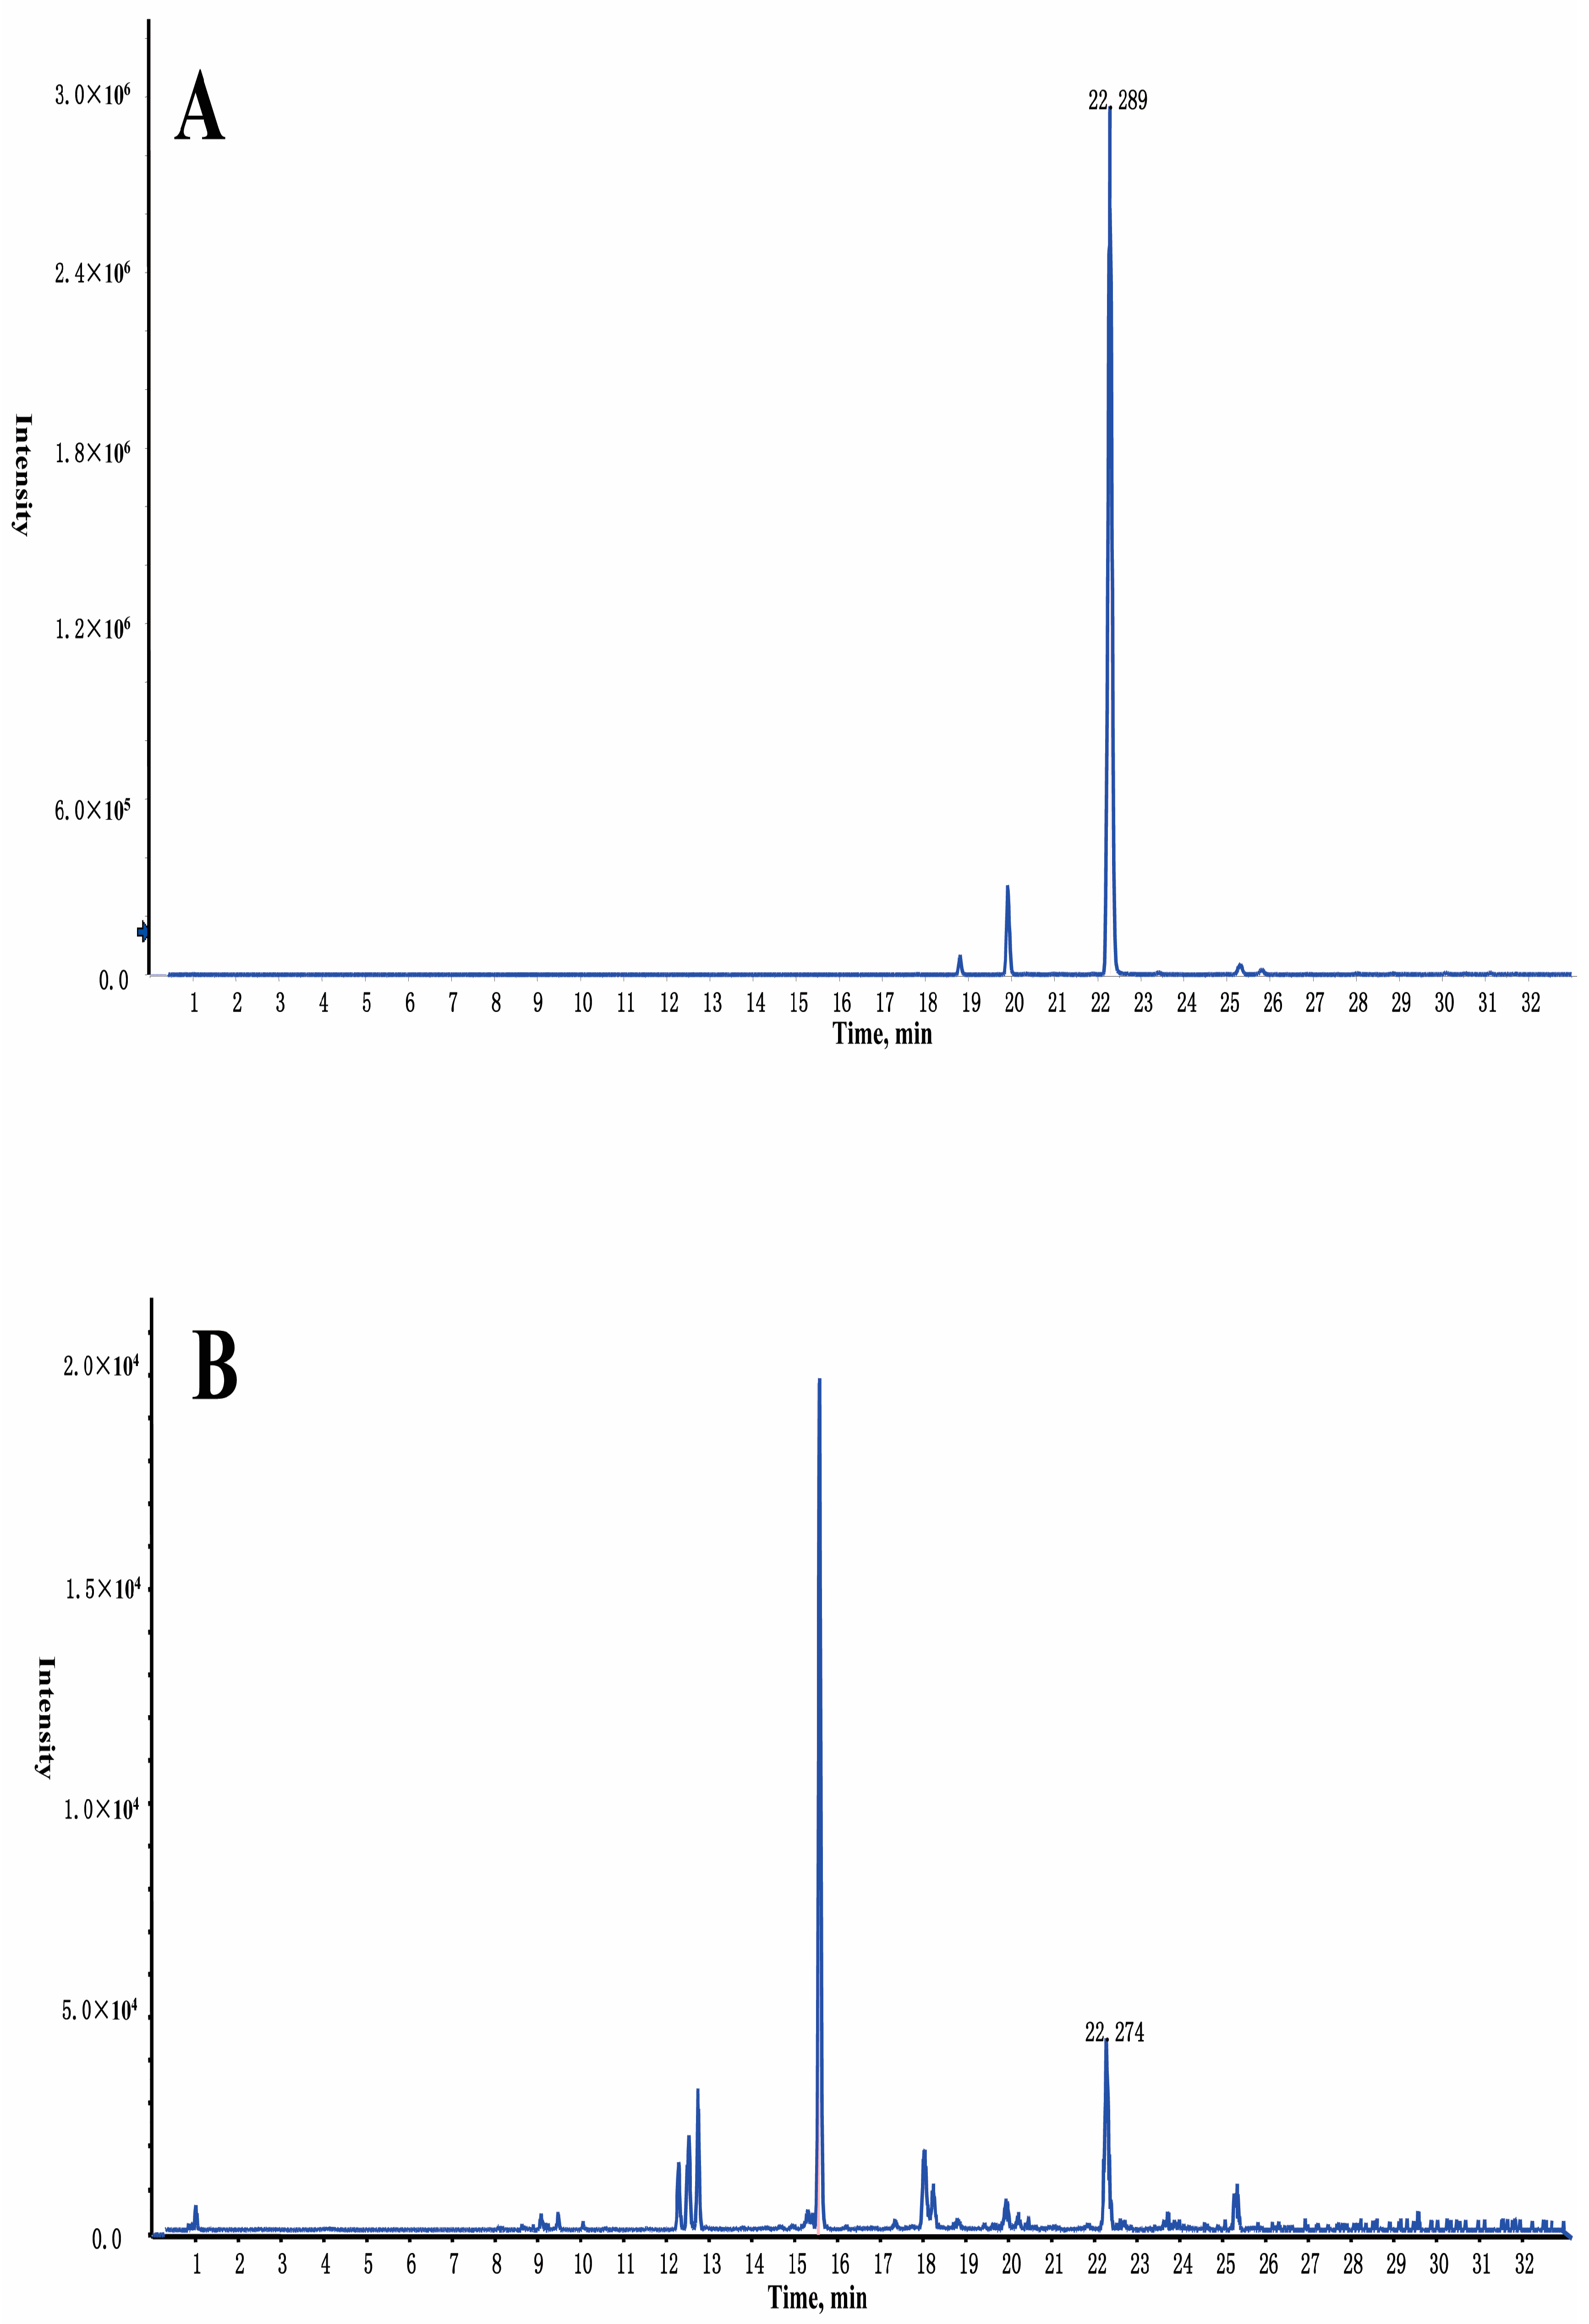
The MS/MS spectra and proposed fragmentation pathways of kaempferol (A); methyltanshinonate (B); salvianolic acid B (C); and succinic acid (D).
2.2.4. Identification of Diterpenoids
Diterpenoids may be the most important lipid-soluble bioactive constituents and reference standards in the quality control of Salvia miltiorrhiza Bunge [45,46]. They generally produce abundant molecular ions of [M + H]+ in the positive mode and generate the fragmentations with the loss of the methyl group, hydroxy group, carbon monoxide or carbon dioxide radical. In this study, 25 types of diterpenoids [10,41,47] were detected in GXSTC. Taking compound 55 (methyl tanshinonate) as an example (Figure 2B), a molecular ion [M + H]+ at an m/z of 339.1236 has been observed in the positive mode. The ion spectrum at an m/z of 279.1024 (MS/MS) suggested the loss of one methyl group and one carboxyl, which may be due to the loss of H2O, CO and 2CO, resulting in the fragments at m/z of 261.0918, 233.0965 and 205.1014, respectively.
2.2.5. Identification of Phenolic Acids
The phenolic acid may be the most important hydrophilic bioactive constituents and reference standards in the quality control of Salvia miltiorrhiza Bunge [46,48].
In vitro, a total of 23 phenolic acids [49,50,51] were detected in GXSTC and twelve of them were further confirmed by MS/MS data against their reference standards, including gallic acid, danshensu, protocatechuic acid, procatechuic aldehyde, caffeic acid, ellagic acid, salvianolic acid B, salvianolic acid A, salvianolic acid C, chlorogenic acid, rosmarinic acid and eugenol. They usually contain two or more phenyls in their structures, which result in the fragmentations of danshensu (DSS), caffeic acid (CA) and caffeoyl due to the loss of C9H10O5, C9H8O4, and C9H6O3, respectively [49]. As shown in Figure 2C, salvianolic acid B was selected to investigate the fragmentation pathways. It exhibited fragment ions at m/z of 717.1592 [M − H]−, 519.1006[M-C9H10O5(DSS)-H]−, 339.0544 [M-C9H10O5(DSS)-C9H8O4(CA)-H]− and 321.0433[M-C18H20O10(2DSS)-H]−. The MDF and FF approacheswere applied in the phenolic acid identification. The mass defect of 0.2328 Da (lithospermic acid) was selected as the MDF reference along with the defect tolerance of 50 mDa and the filtering mass range of 400–600 Da. The fragments of m/z 313.0 and m/z 367.0 in the negative ion mode were adopted as FF references.
2.2.6. Identification of Organic Acid
In this study, 6 organic acids derived from Choerospondias axillaris were detected in vitro. Compound 9 (Figure 2D) showed a molecular ion [M − H]− at an m/z of 117.0180 in the negative mode. The ions at m/z of 99.0074 and 73.0321 by MS/MS spectrum suggested the loss of one H2O group (18Da) and carbon dioxide (44 Da). By comparing exact molecular mass and MS/MS spectra with the published data [20], it was tentatively identified as succinic acid. Following this, the MDF parameters were set as follows: 0.0672 Da (succinic acid) for mass defect, 50 mD for the defect tolerance and 100–300 Da for the filtering mass range. The fragments of m/z151.0, m/z 99.0and m/z 73.0 in the negative ion mode were adopted as the FF references.
2.2.7. Others
Other compounds originating from GXSTC in vitro were tentatively identified as amino acids, alkaloids, steroidal saponins and coumarins based on the MDF and FF approaches (Table 1).
With the developed rapid method and according to the following screening principles thatwere suggested: (1) the compounds should be closely related to the clinical efficacy and may be sensitive to the production procedure; (2) the unique compound belonging to each single raw material has no interference from the other materials in the identification; (3) the compound account for a comparatively high or low ratio level in the formulation; (4) the reference standard of the ingredients should be easy to access. A total of 40 compounds (7 flavonoids and their glycosides, 15 diterpenoids, 12 phenolic acids, 2 organic acids and 1 steroidal saponin as well as eugenol and its derivatives) were proved to exist in GXSTC and were considered to be the potential candidates of the marker compounds for the quality control in future specification or chromatographic fingerprint common peak attribution of GXSTC.
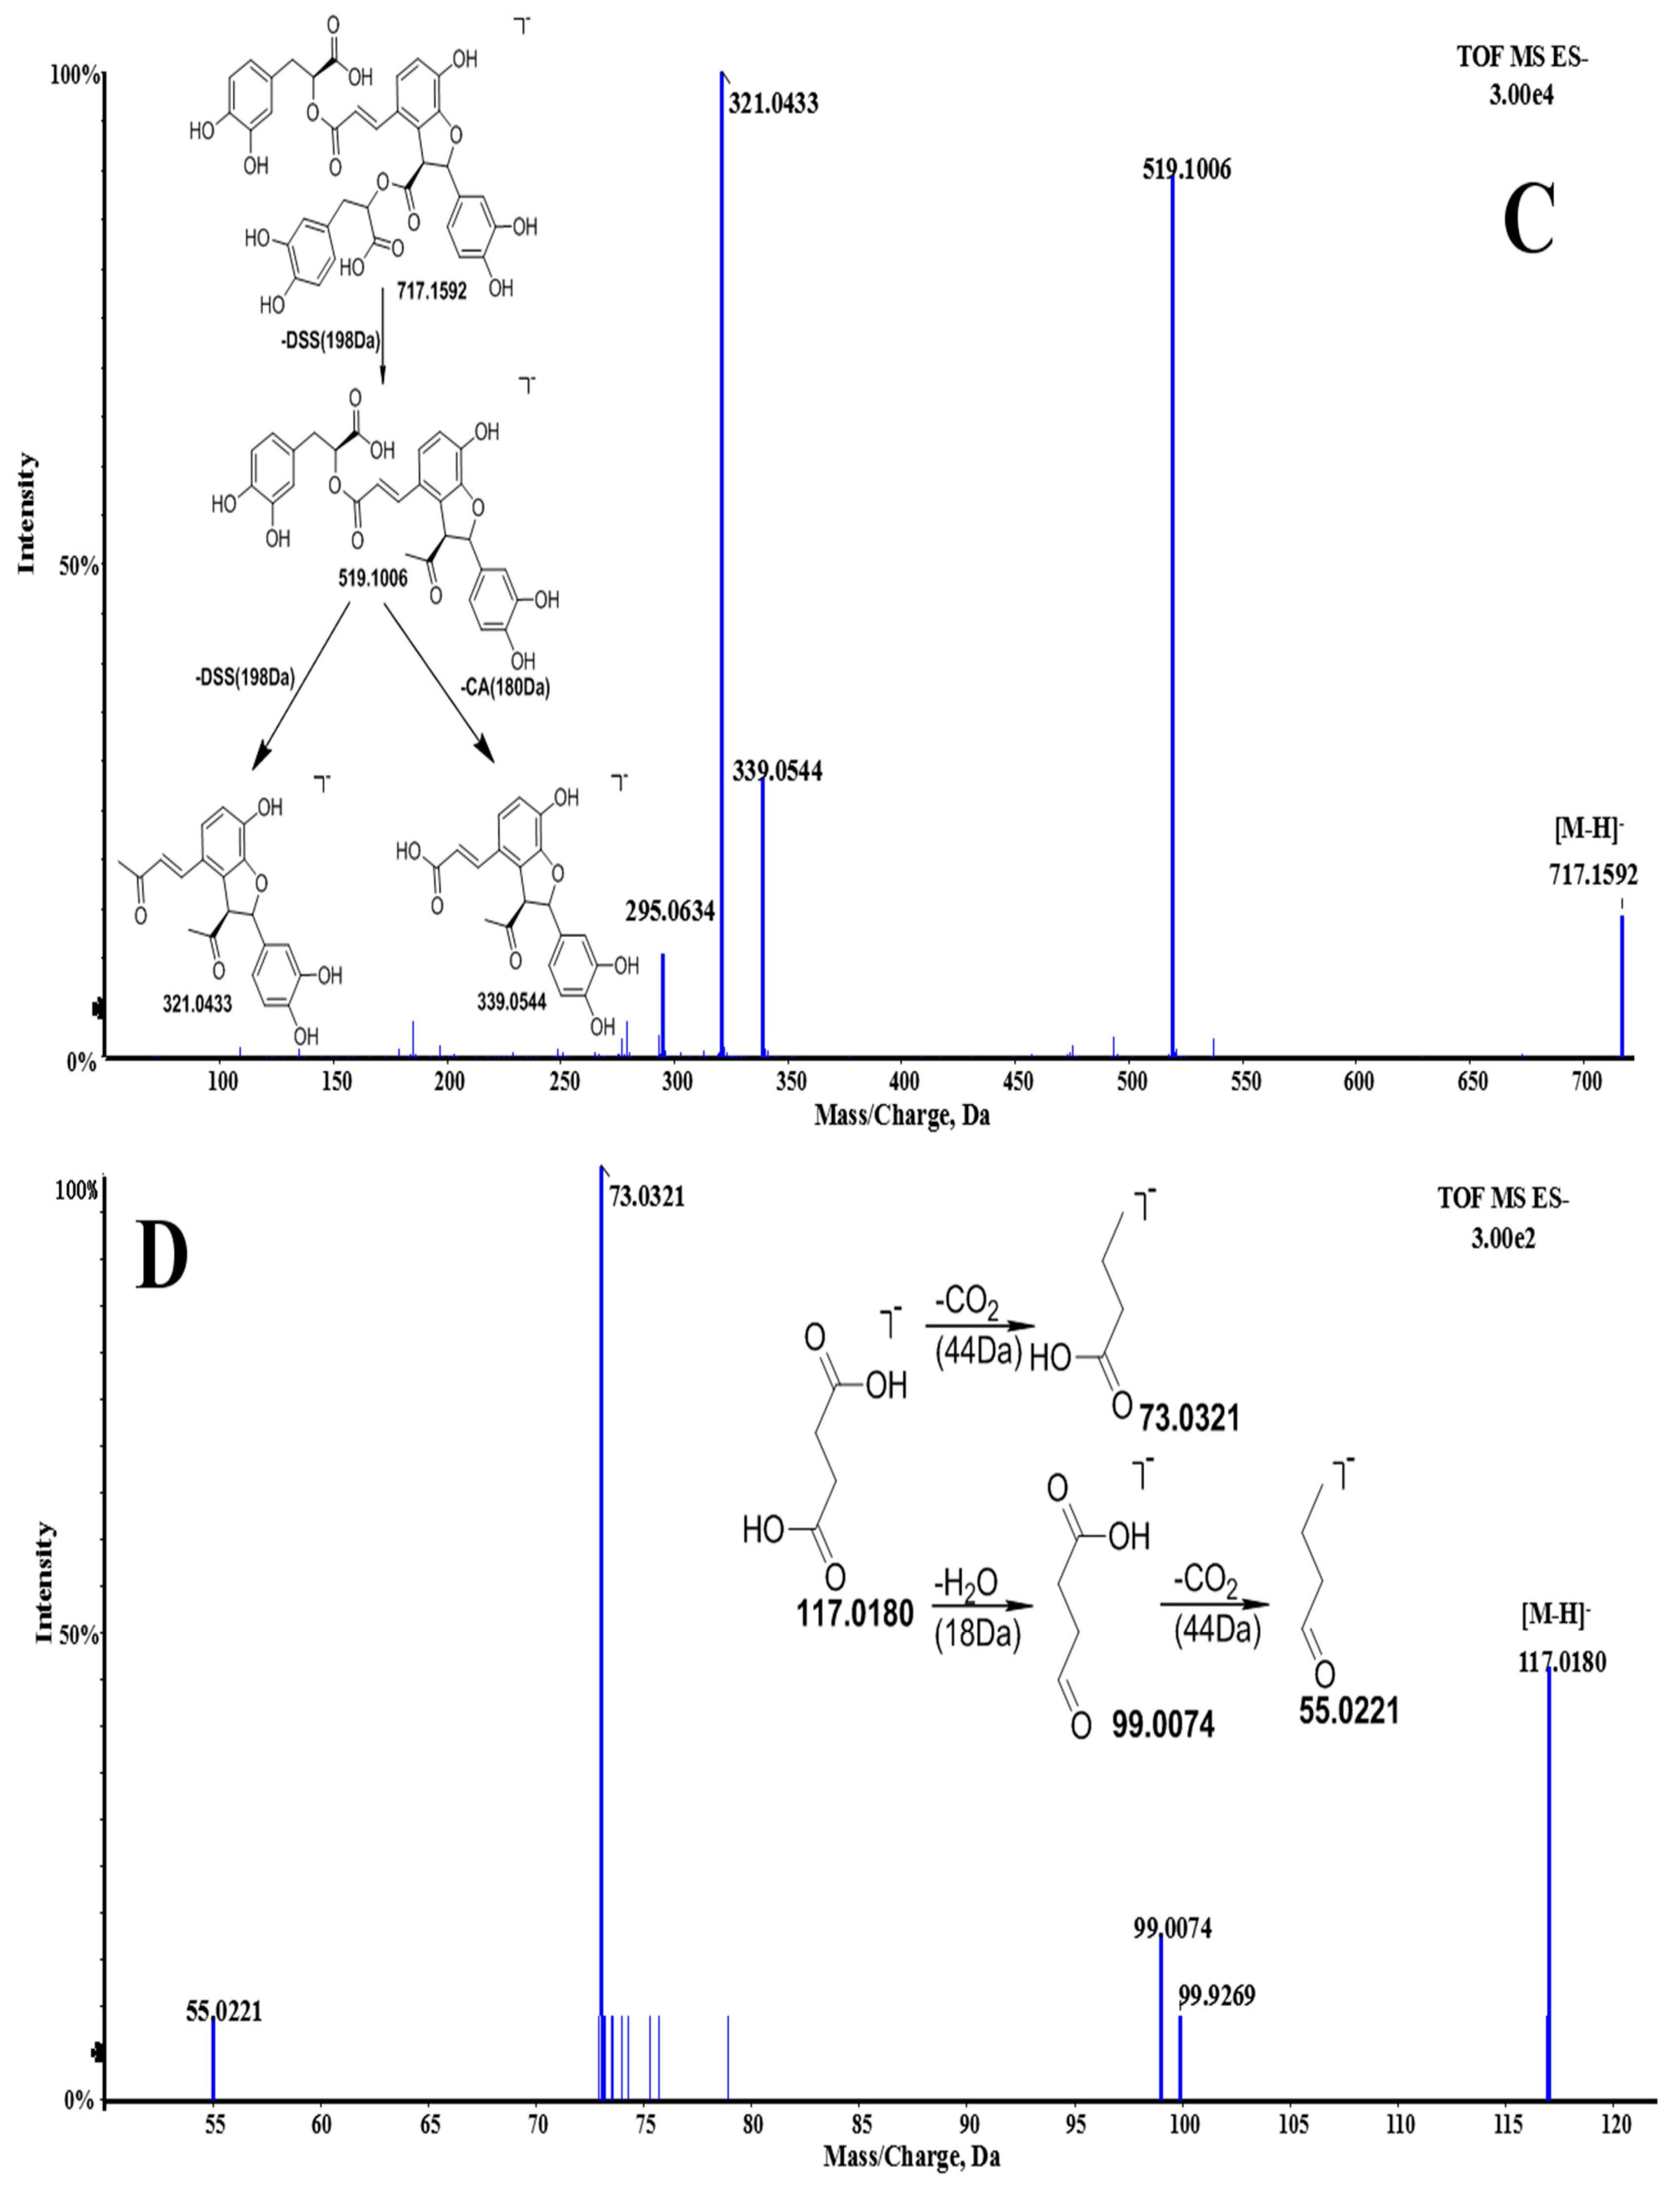
In addition, the five materials (Choerospondias axillaris, Salvia miltiorrhiza Bunge, Syzigium aromaticum, Dryobalanops and Tabaschir) in GXSTC were analyzed individually to identify the source of the compounds in Table 2. Interestingly, some compounds were found in the capsule compared with a single herb. Taking cryptotanshinone as an example, its intensity significantly increased (p < 0.05) in GXSTC samples (Intensity = 2968052)compared to the data obtained from the individual Salvia miltiorrhiza Bunge (Intensity = 19815), which is shown in Figure 3.
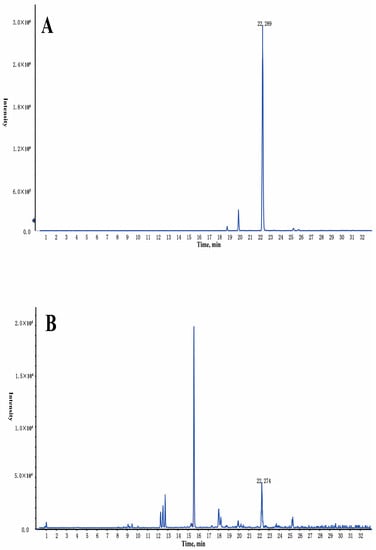
Figure 3.
The LC-Q-TOF/MS extracted ion chromatographs (EIC) of cryptotanshinone in GXSTC (A) and Salvia miltiorrhiza Bunge (B) in the positive ion mode.
2.3. Analysis of the Active Component of GXSTC In Vivo
2.3.1. Analysis of the Prototype Components of GXSTC In Vivo
HL is an important cause of coronary heart disease and the HL rat model is the classical model of early coronary heart disease [52]. The ABS is closely related to coronary heart disease [53,54]. In this paper, there were normal, HL, and ABS groups used to investigate the difference in serum pharmaceutical chemistry at different stages of coronary heart disease. According to the literature [12,13,55], the Tmax of diterpenoids and phenolic acids in Salvia miltiorrhiza Bunge ranged from 1 h to 2 h, so the blood samples at 1 h and 2 h time points were collected in this paper. However, there was no significant difference between the 1 h and 2 h for active components in healthy and heart disease model rats after oral administration of GXSTC.
The BPC of normal groups, ABS groups and HL groups in both modes are presented in Figures S2–S4. In vivo, 44 peaks were detected in dosed plasma but not in control plasma. Among these peaks, 20 peaks also appeared in the MS spectra of GXSTC, indicating that these components were absorbed into the rat plasma in the original form. Based on the retention times and the accurate MS/MS fragment data, 24 compounds as prototype compounds were identified both in vitro and in vivo (Table 3) with their chemical structures in Figure S1,including dihydroquercetin and 9 diterpenoids (tanshindiol A/C, tanshinone IIB/hydroxytanshinone IIA, cryptotanshinone, tanshinone I, dihydrotanshinone I, tanshinone IIA and miltirone), 8 phenolic acids (gallic acid, danshensu, protocatechuic acid, caffeic acid, rosmarinic acid, salvianolic acid B, chlorogenic acid and 3,3′-di-O-methylellagic acid), 5 organic acids (malic acid, citric acid, stearic acid, linoleic acid and palmic acid) and betaine.
Table 3.
Identification of the prototype components in rat plasma after oral administration of GXSTC in both positive and negative modes.
2.3.2. Analysis of the Metabolites of GXSTC In Vivo
The analysis of the prototype components and their metabolites in the plasma could be the fundamental data for the identification of the active compounds in TCM [12,13].
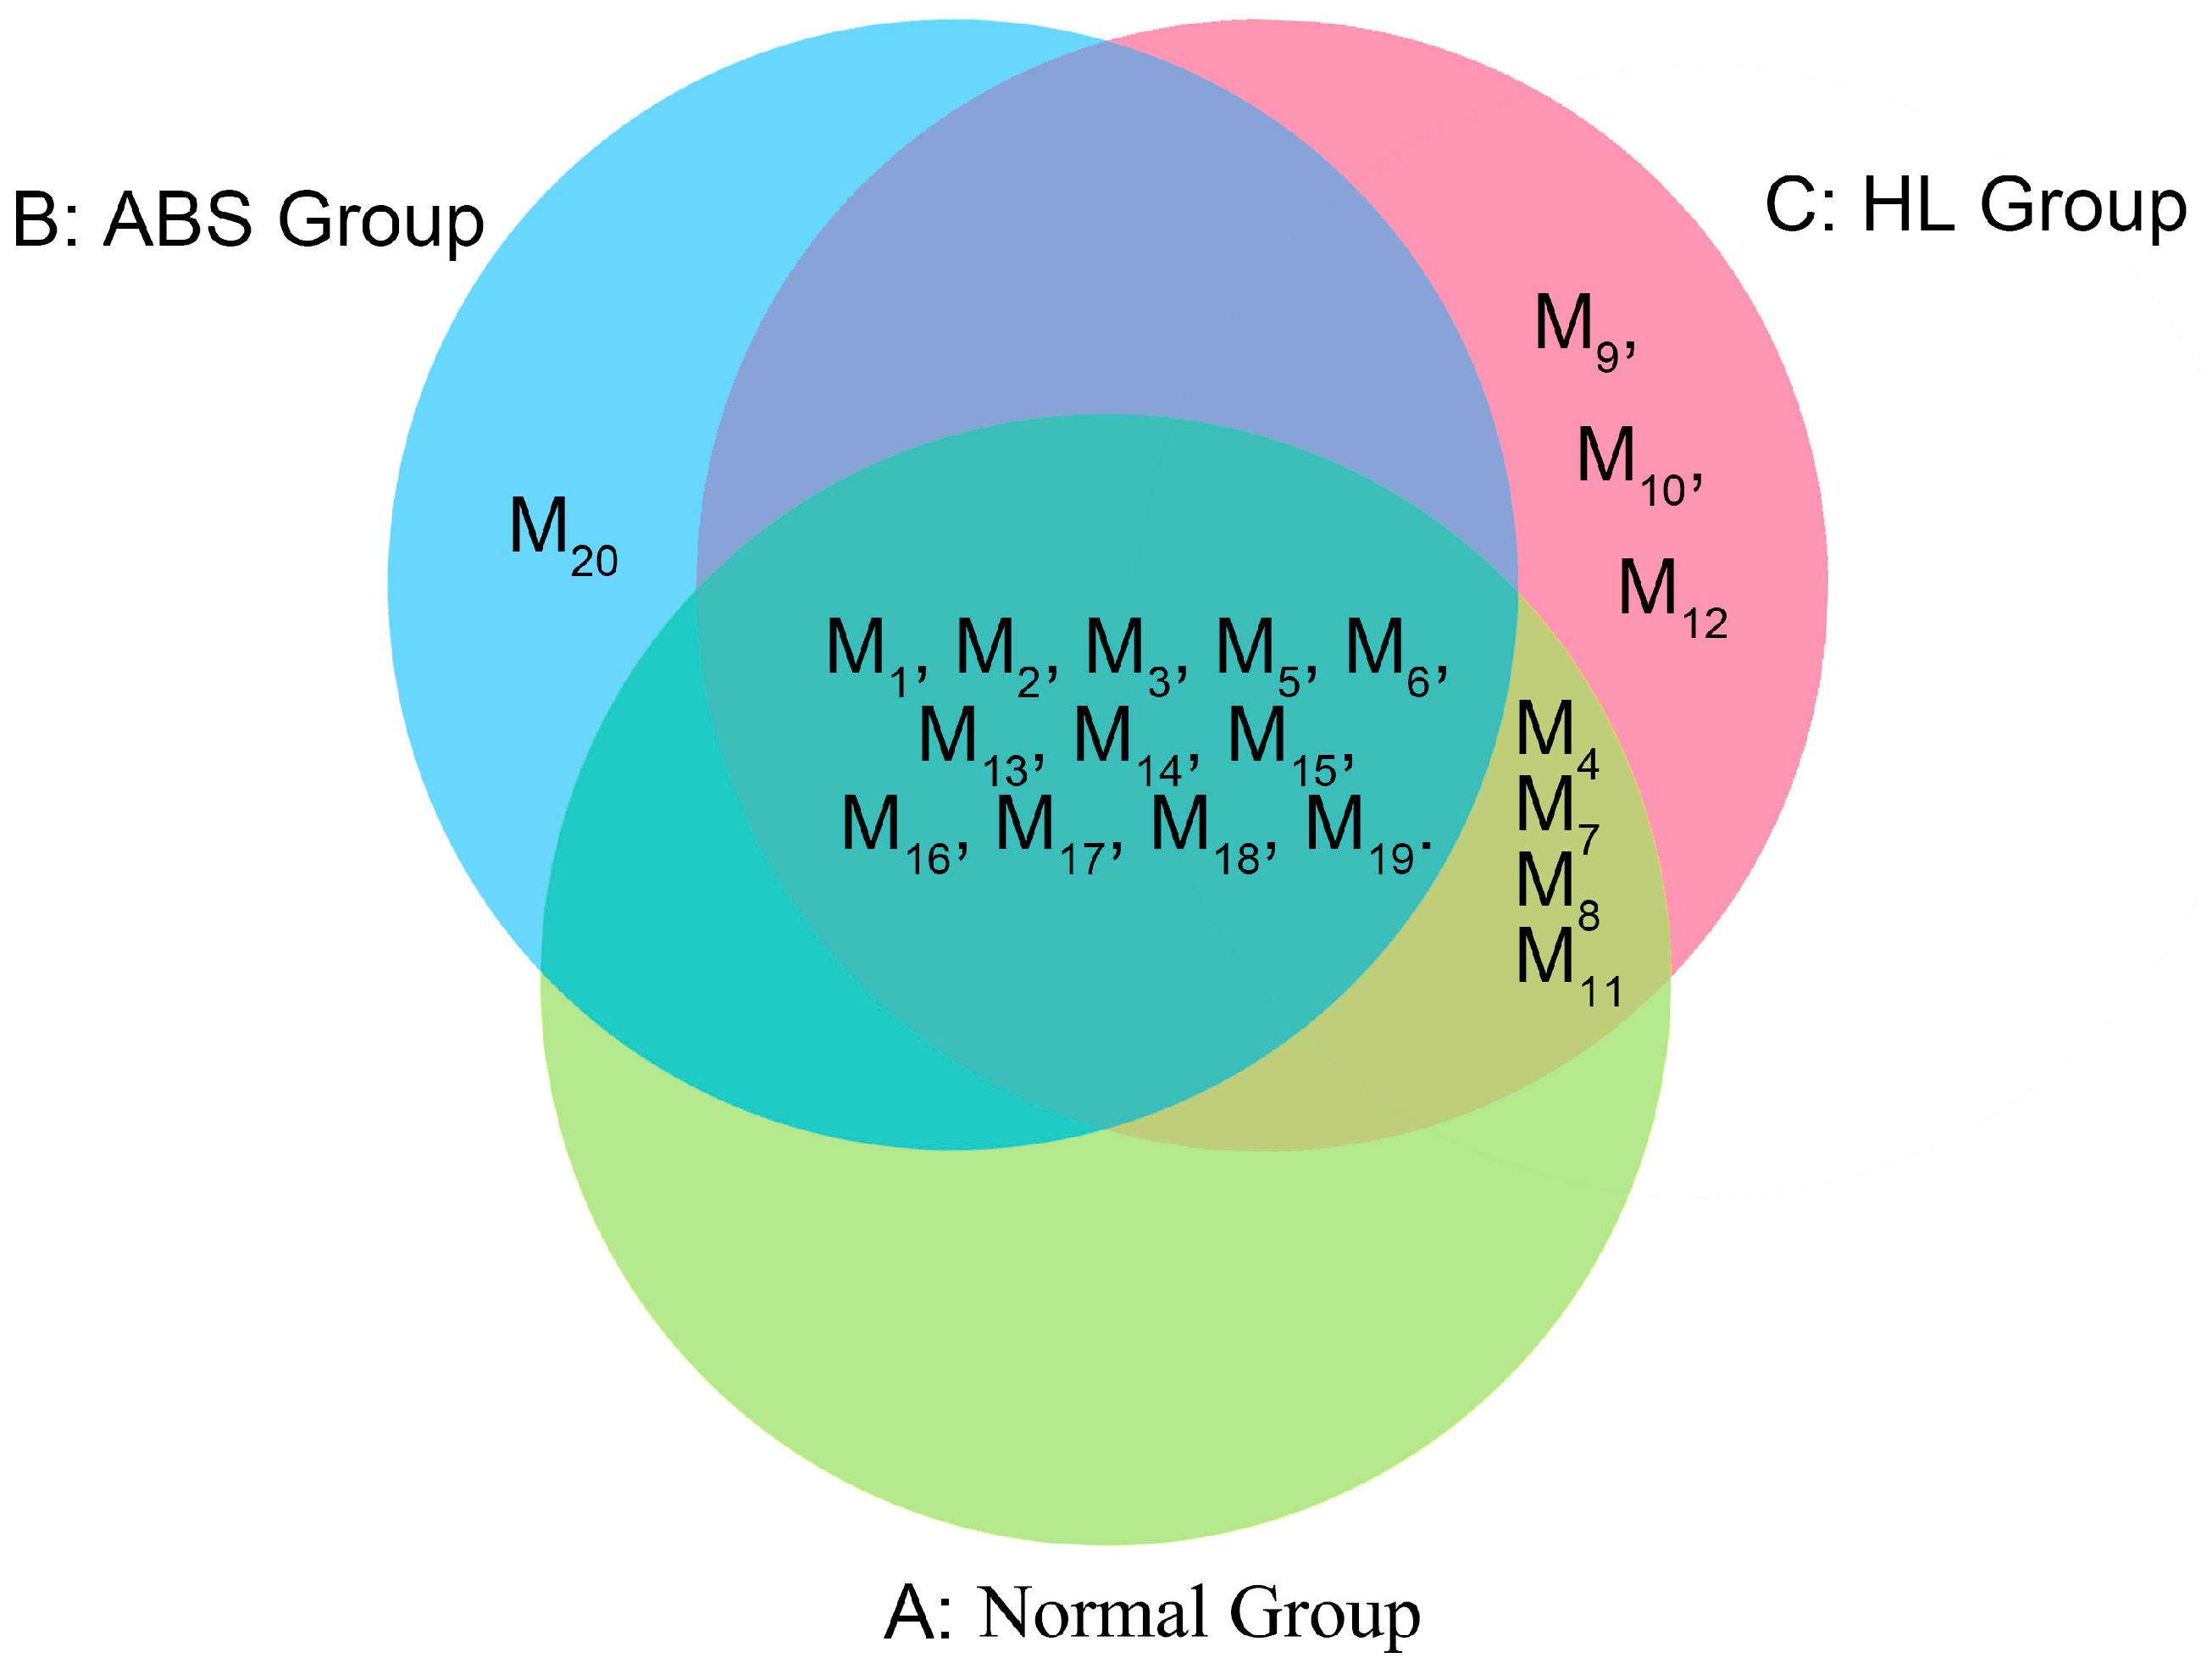
Compounds detected only in the rat plasma after oral administration of GXSTC may be the degraded substances or endogenous metabolites. Based on the MDF and FF approach, 20 metabolites were tentatively identified in rat plasma after oral administration (Table 4) with the proposed metabolic pathways in Figure 4 .In order to make a thorough comparison of their derivatives or metabolites in the normal group, HL group and ABS group, each of the above-mentioned chemical categories was fully discussed. Furthermore, a Venn diagram of all metabolites was clarified for all groups as shown in Figure 5. Among them, M1, M2, M3, M5, M6, M13, M14, M15, M16, M17, M18 and M19 were detected in the normal group, while the pathological model groups. M4, M7, M8 and M11 were detected in normal and HL groups. However, M9, M10 and M12 were only detected in HL group, while M20 was only detected in ABS group.
Table 4.
Identification of metabolites in rat plasma after oral administration of GXSTC in both positive and negative modes.

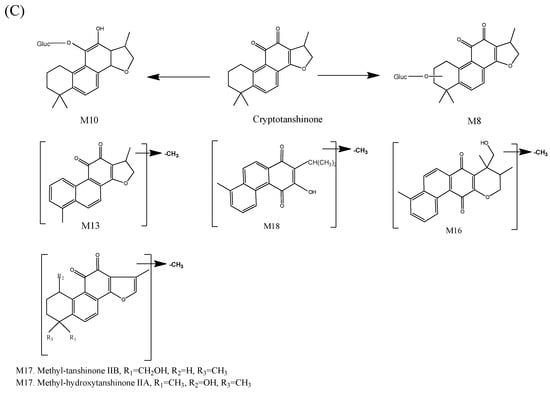
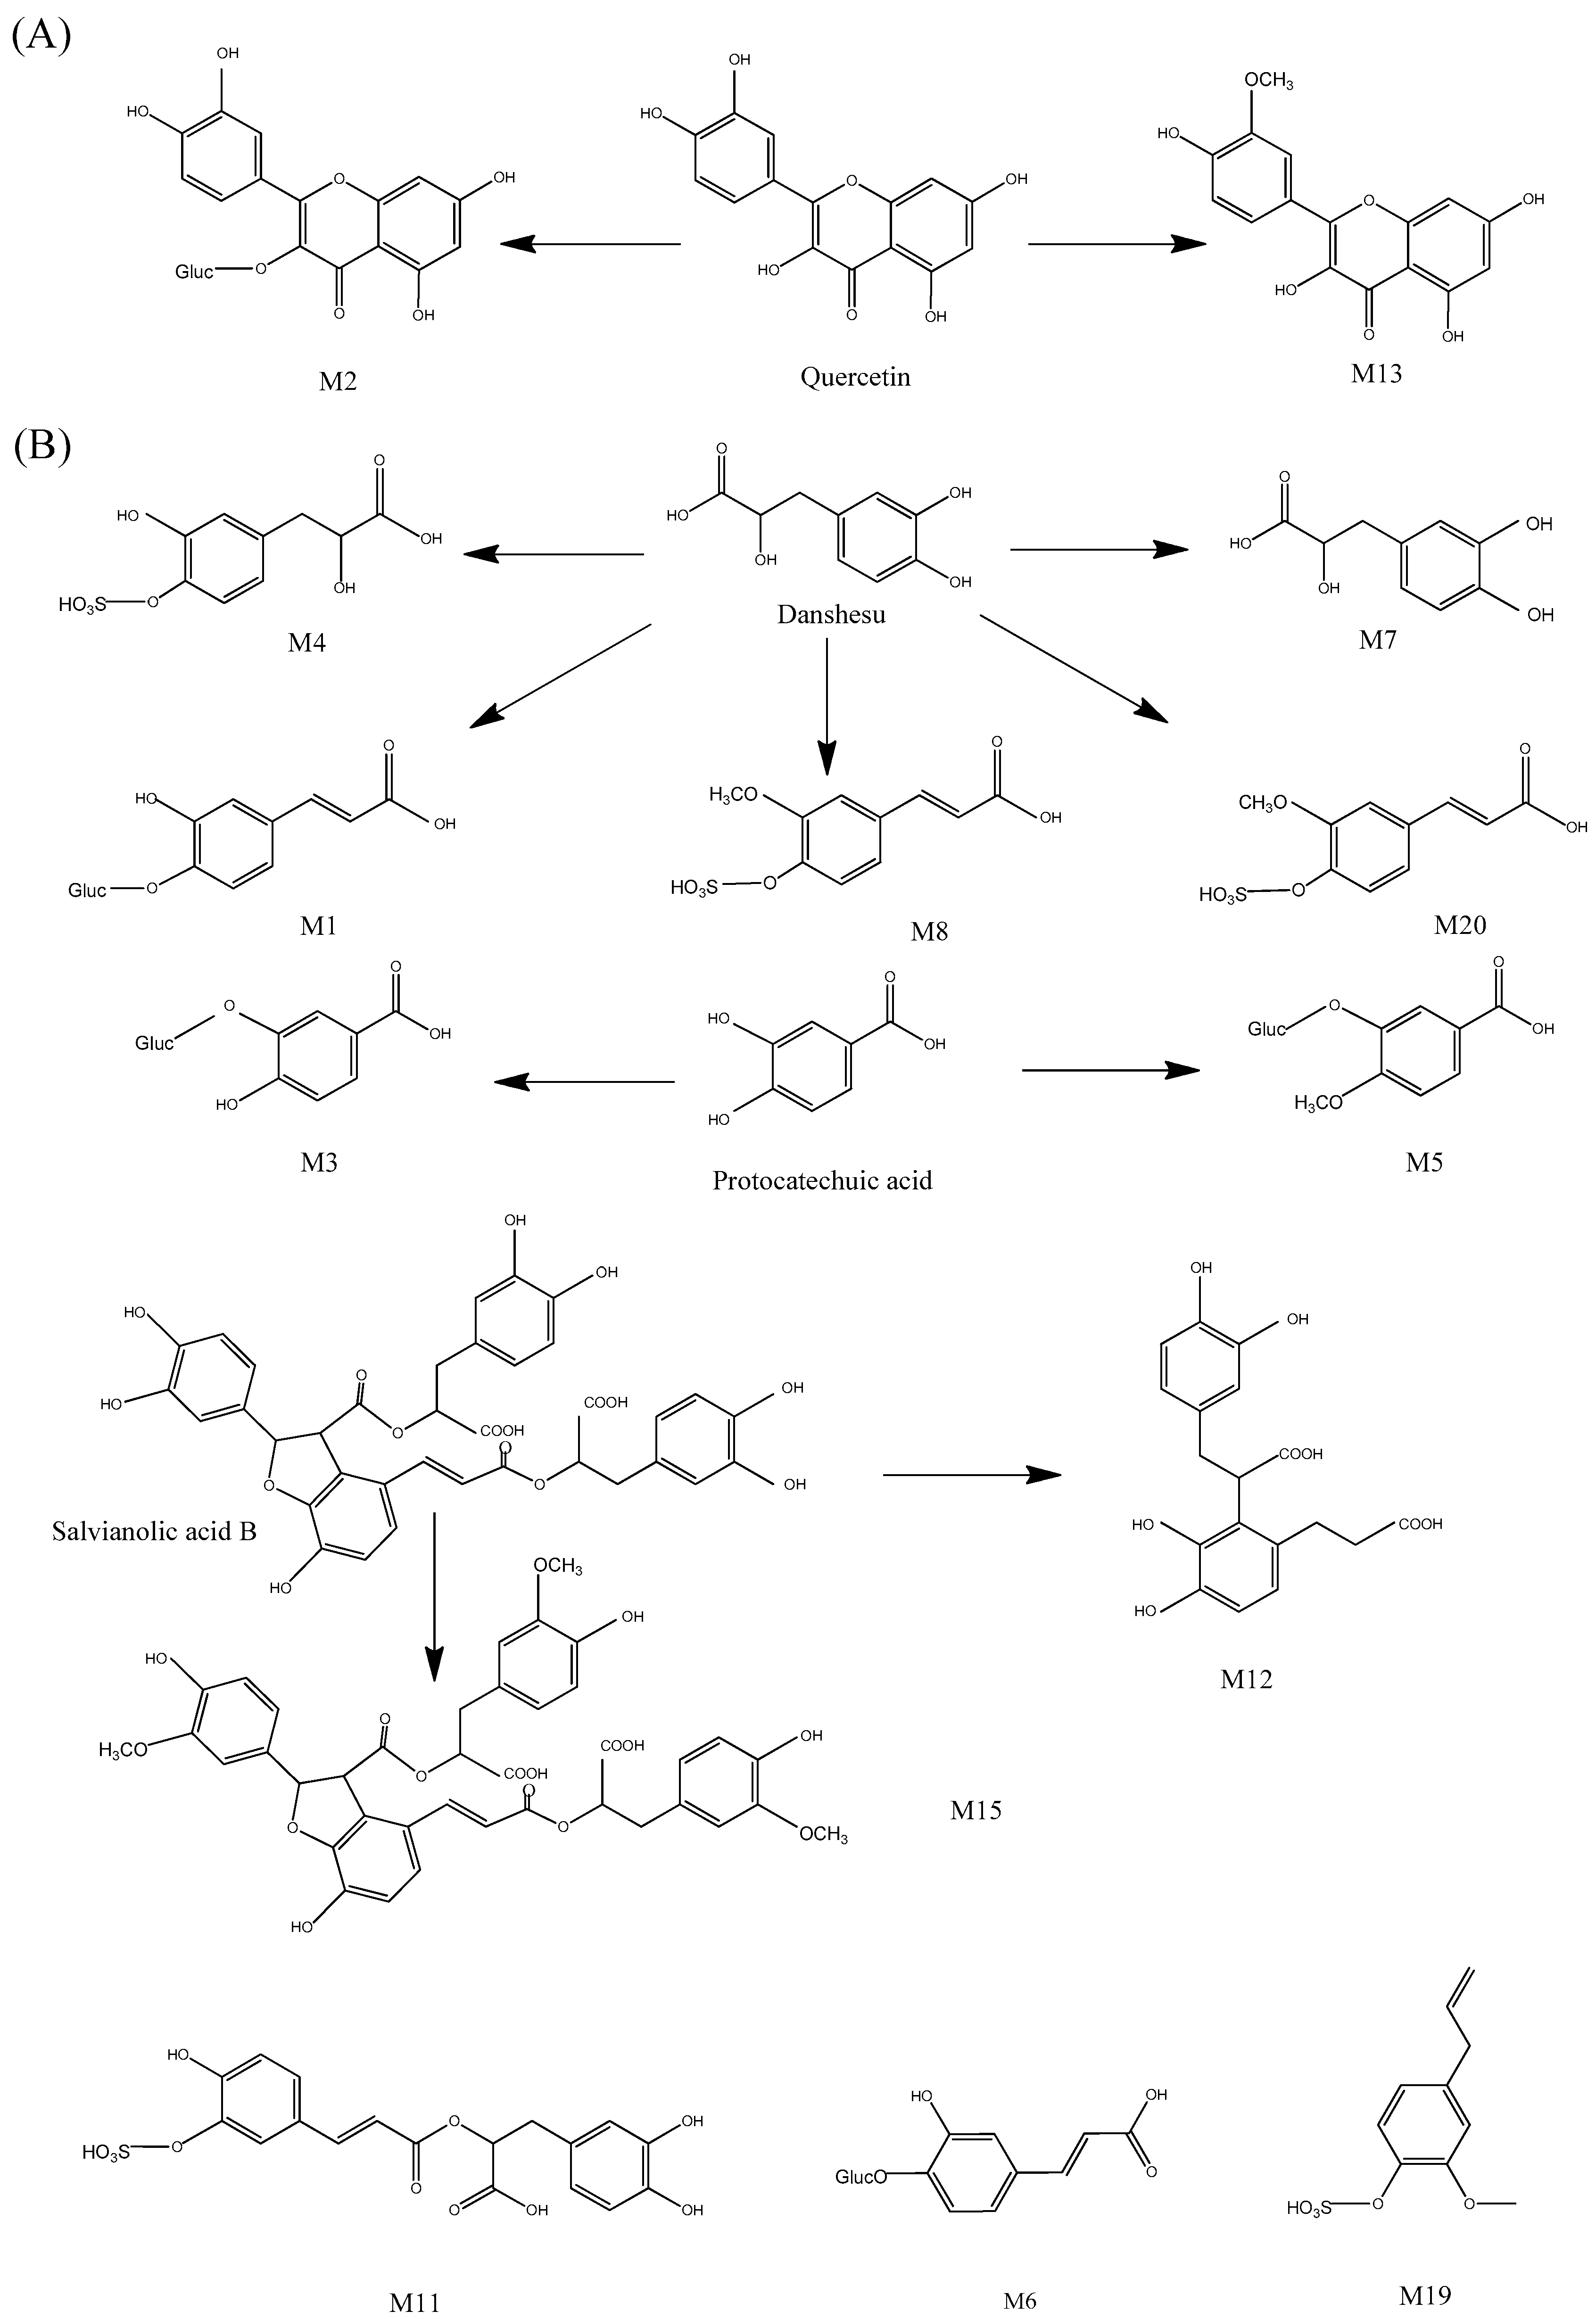
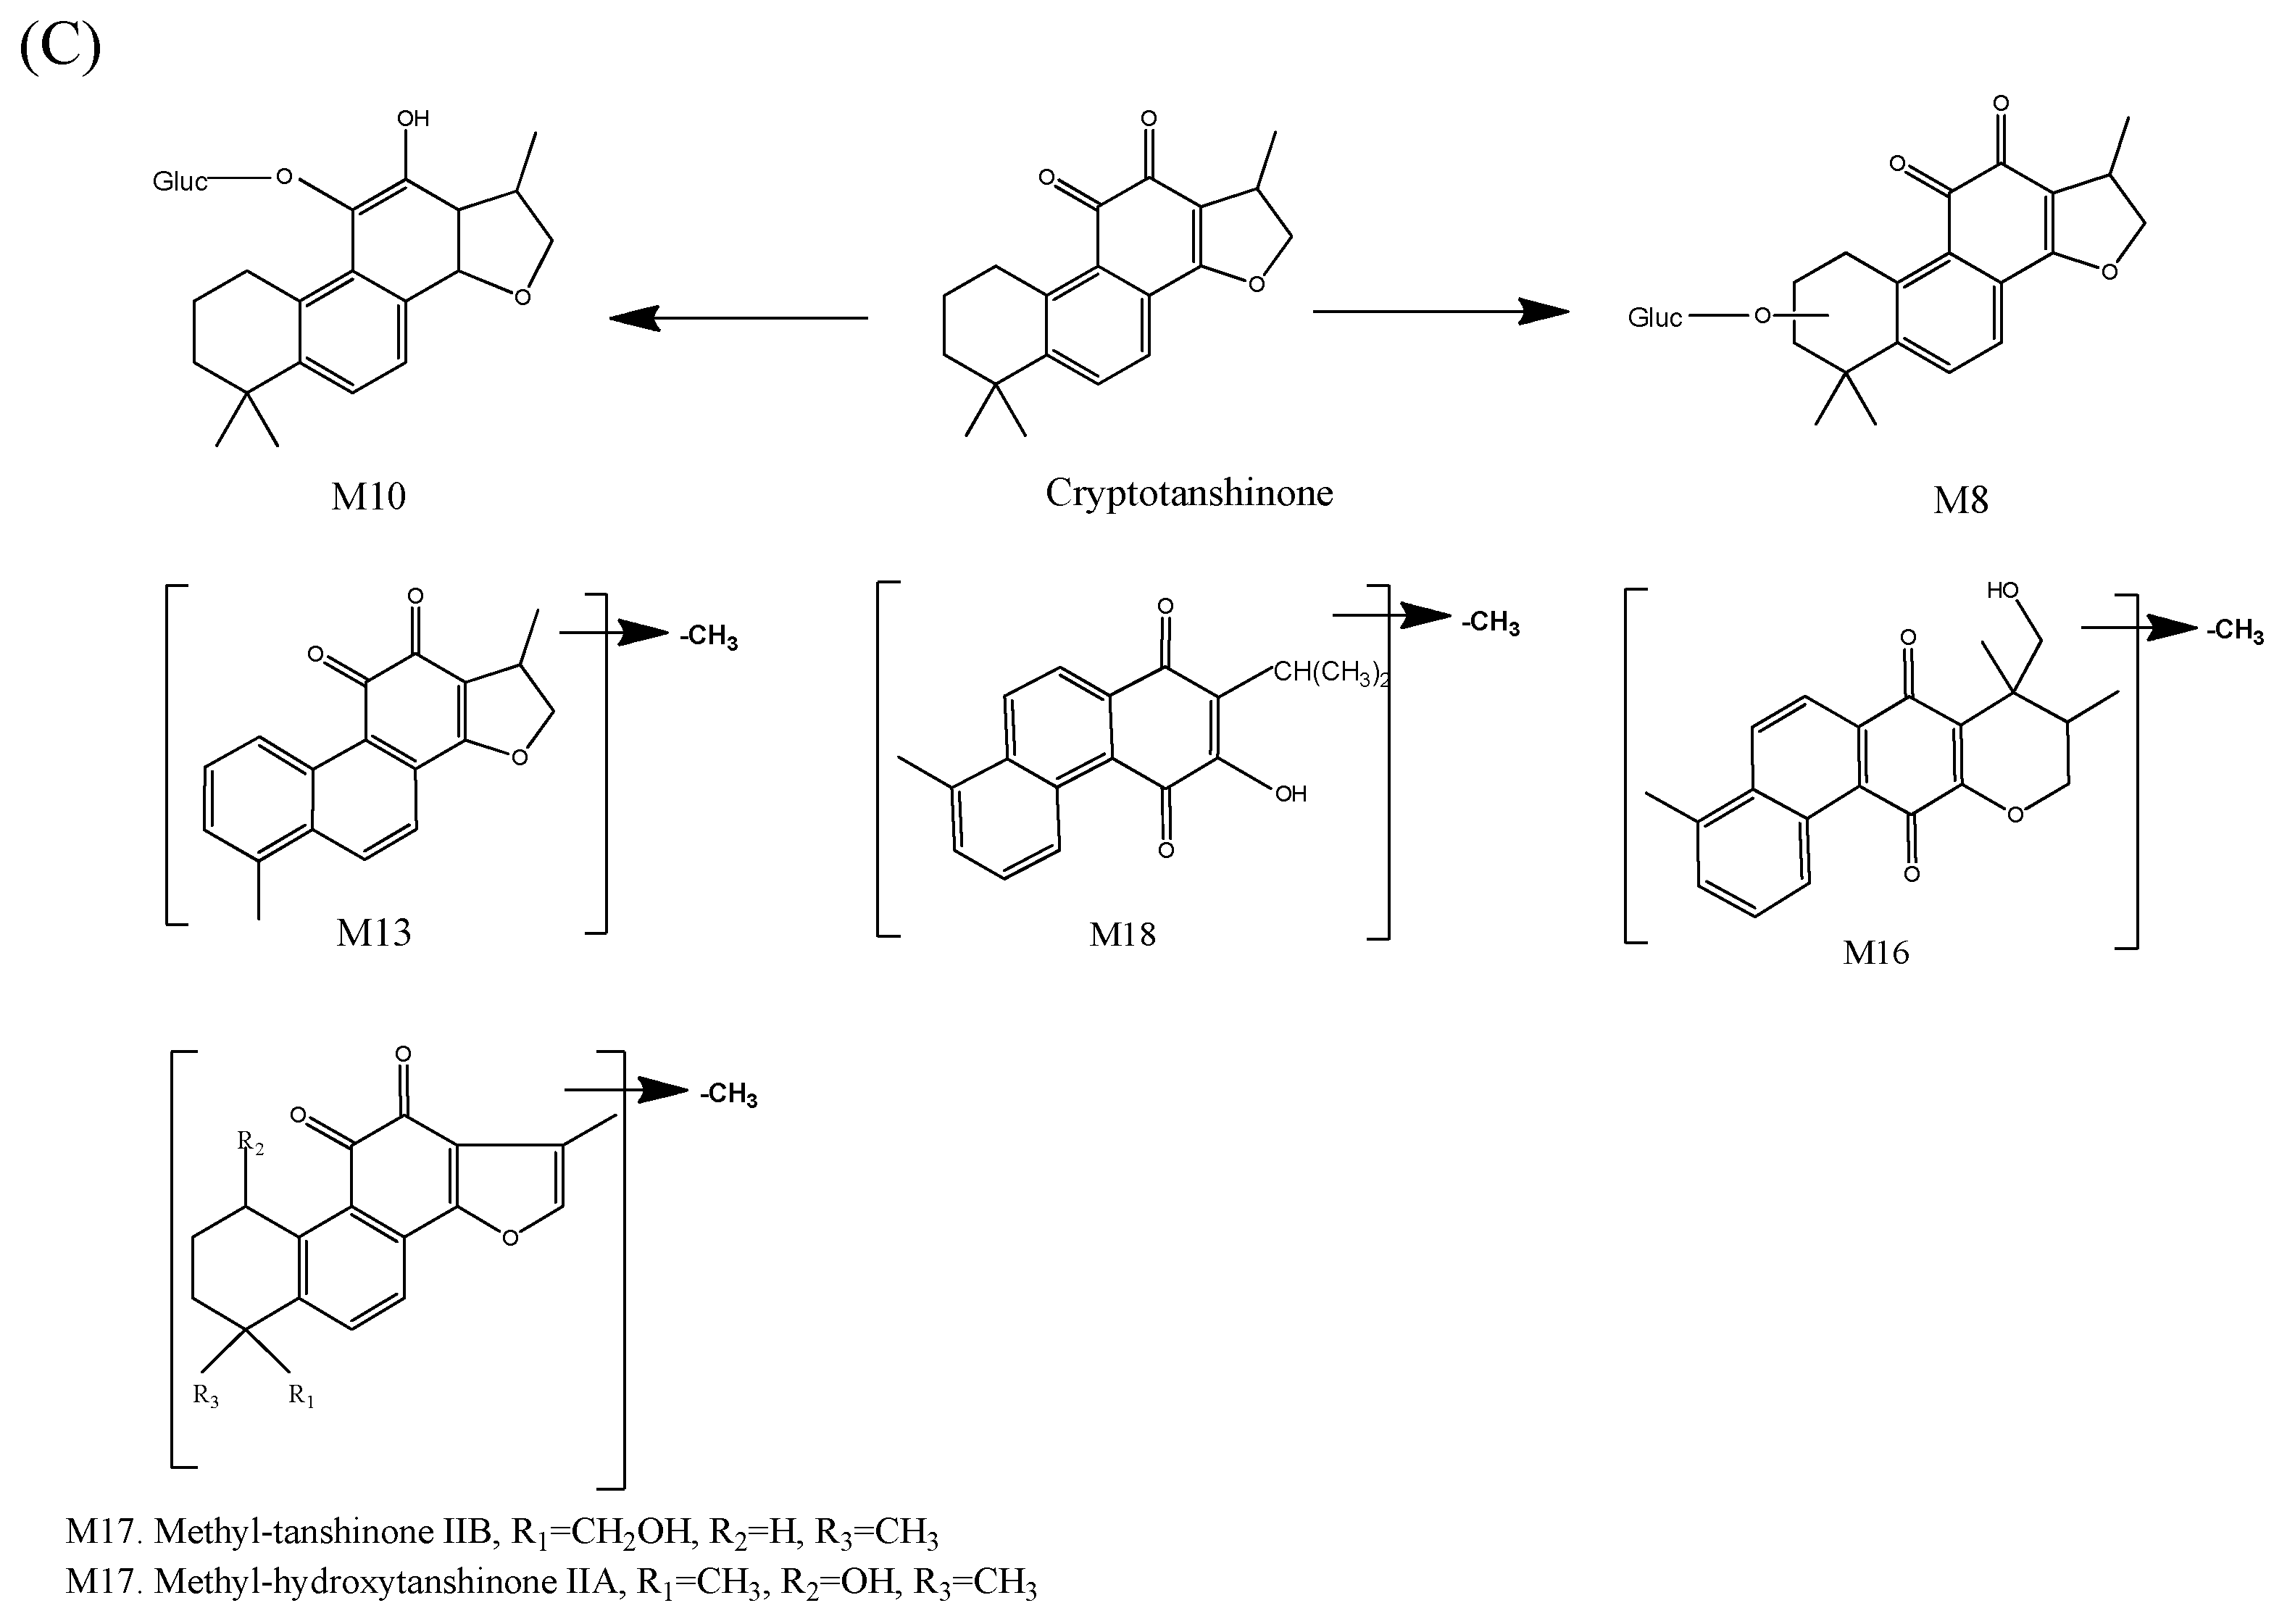
Figure 4.
The proposed metabolic pathways of flavonoid-related metabolites (A); phenolic acid-related metabolites (B); and diterpenoid-related metabolites (C) in rat plasma.

Figure 5.
The Venn diagram of all metabolites in the Normal group (A); the ABS group (B); and the HL group (C).
Identification of Flavonoid-Related Metabolites
M2 and M13 were detected in rat plasma as the flavonoid-related metabolites after oral administration of GXSTC. M2 and M13 exhibited an accurate molecular ion of [M − H]− at an m/z of 477.0665 and 315.0524, respectively. After screening the identified flavonoids, quercetin was found to have similar fragments of m/z of 275.0561, 177.0193 and163.0037 to the unknown compounds. Consequently, this produced fragments of 176 Da and 14 Da higher than that of quercetin, respectively. M2 and M13 were tentatively identified as quercetin-3-O-glucoside and quercetin-3′-methyl ether, respectively. The results showed that the flavonoids experienced methylation and glucuronidation (Phase II) by various drug metabolizing enzymes in the rat after oral administration of GXSTC. Furthermore, the content of the methylated product in the ABS group (M13) increased obviously compared with the other two groups. However, the rats and humans processed food in different ways, so the results proven in rats would be different from those experienced by patients in clinical practice.
Identification of Phenolic Acid-Related Metabolites
M1, M3–M8, M11, M12, M15, M19 and M20 are phenolic acid-related metabolites from processes, including dehydrogenate, methylation, glucuronidation and sulfating. M3 showed a molecular ion [M − H]− at an m/z of 329.0514, which was calculated as being C13H14O10 and being 176 Da (C6H8O6) more than that of protocatechuic acid. The ion at an m/z of 153.0207 in the negative ion mode indicated a diagnostic neutral loss fragment of glucuronide. In addition, the fragment ion at the m/z of 109.0369 in the negative ion mode was similar to protocatechuic acid. Therefore, M3 was tentatively identified as protocatechuic acid-glucuronide and similarly, M6 was tentatively identified as CA-glucoside. M5, with an accurate molecular ion [M − H]− at an m/z of 343.0670, was 14 Damore than that of M3, revealing astructure of methyl protocatechuic acid-glucuronide. M15, with a molecular ion [M − H]− at an m/z of 759.1925, was 42 Da more than that of salvianolic acid B. M12 (molecular ion [M − H]− at an m/z of 361.0925),was inferred to be the product of salvianolic acid B with two ester bonds and the furan ring cleavage. Based on the MDF approach and MS/MS spectra fragmentation, they were tentatively identified as trimethyl-salvianolic acid B and salvianolic acid R.
M11 showed a molecular ion of [M − H]− at an m/z of 439.0340 (80 Da more than rosmarinic acid). By comparing MS and MS/MS spectra, they were tentatively identified as rosmarinic acid-sulfate. In the same methodology, M4, M19 and M20 were tentatively identified as DSS-sulfate, eugenol-sulfate and methyl DSS-sulfate, respectively. M1 showed an accurate molecular ion of [M − H]− at an m/z of 355.0666, which is 176 Da more than an m/z of 179.0347. This was produced by the neutral loss of oxygenate and hydrogenation from DSS. M7 showed an accurate molecular ion of [M − H]− at an m/z of 165.0565 and its formula was calculated as C9H10O3, which was produced by the neutral loss of oxygenate from DSS. With the data of the MS/MS spectra fragmentation and literature [55], M1, M7 and M8 were tentatively identified as dehydrogenate and dehydroxylate DSS-glucuronide, deoxygenate-DSS and dehydroxylate methyl DSS-sulfate.
Interestingly, M4, M7, M8 and M11 were not detected in the ABS group and our pharmacokinetic study (data not shown) showed that the elimination rate for phenolic acid was significantly reduced in this group. This may be due to the ABS-induced decrease in drug elimination [56,57]. Therefore, the absence of the above phase II metabolites of phenolic acid at 1 h and 2 h after administration may be due to the reduced drug elimination rate, weakened re-absorption or alteration of sulfotransferase, which is responsible for the hydroxylation and sulfation [58]. In addition, the content of M5 (methyl protocatechuic acid-glucuronide) in the ABS group was two times higher than the normal and HL groups. Combined with the different contents of M13 in each group mentioned above, it is inferred that the activity of methyltransferase is up regulated in the ABS pathological state for the first time.
Both M11 and M19 are sulfated metabolites of phenolic acids, which are closely related to the activities of sulfotransferase. The content of M11 in the HL group was nearly 4 times higher than that of the healthy group, which was inferred to be caused by the up-regulation of sulfotransferase activity. However, the content of M19 in the HL group was far less than that of the healthy group. Therefore, the specific mechanism is worthy of further study.
Identification of Diterpenoid-Related Metabolites
M16 presented an accurate molecular ion of [M + H]+ at an m/z of 351.1601 with 14 Da more than that of danshenxinkun D. The MS/MS fragmentation in the positive ion mode revealed a fragment ion at an m/z of 291.1016 and 199.0965 as the characteristic ion of danshenxinkun D. Consequently, M16 was tentatively identified as methyl-danshenxinkun D. In the same methodology, M14, M17 and M18 were tentatively identified as methyl-dihydrotanshinone, methyl-tanshinone IIB/methyl-hydroxytanshinone IIA and methyl-danshexinkun B. The above results indicated that the diterpenoid from GXSTC may be methylated by the hepatic microsomal enzyme system and re-absorbed into the bloodstream.
M10 showed a molecular ion of [M − H]− at an m/z of 473.1837 and the production at an m/z of 297.1555 in the MS/MS spectra, which was a diagnostic neutral loss fragment from glucuronide-conjugated compounds. According to a previous study [59], M9 and M10 were tentatively identified as hydroxylated cryptotanshinone-glucoronide and cryptotanshinone catechol-glucuronide. In addition, M9, M10 and M13 were only observed in the HL group. This may be caused by the disorder of the lipid metabolism, absorption pathways [60,61], hydroxylation (Phase I) and glucuronidation (Phase II), which leads to the re-absorption of the metabolites.
Statistical Analysis
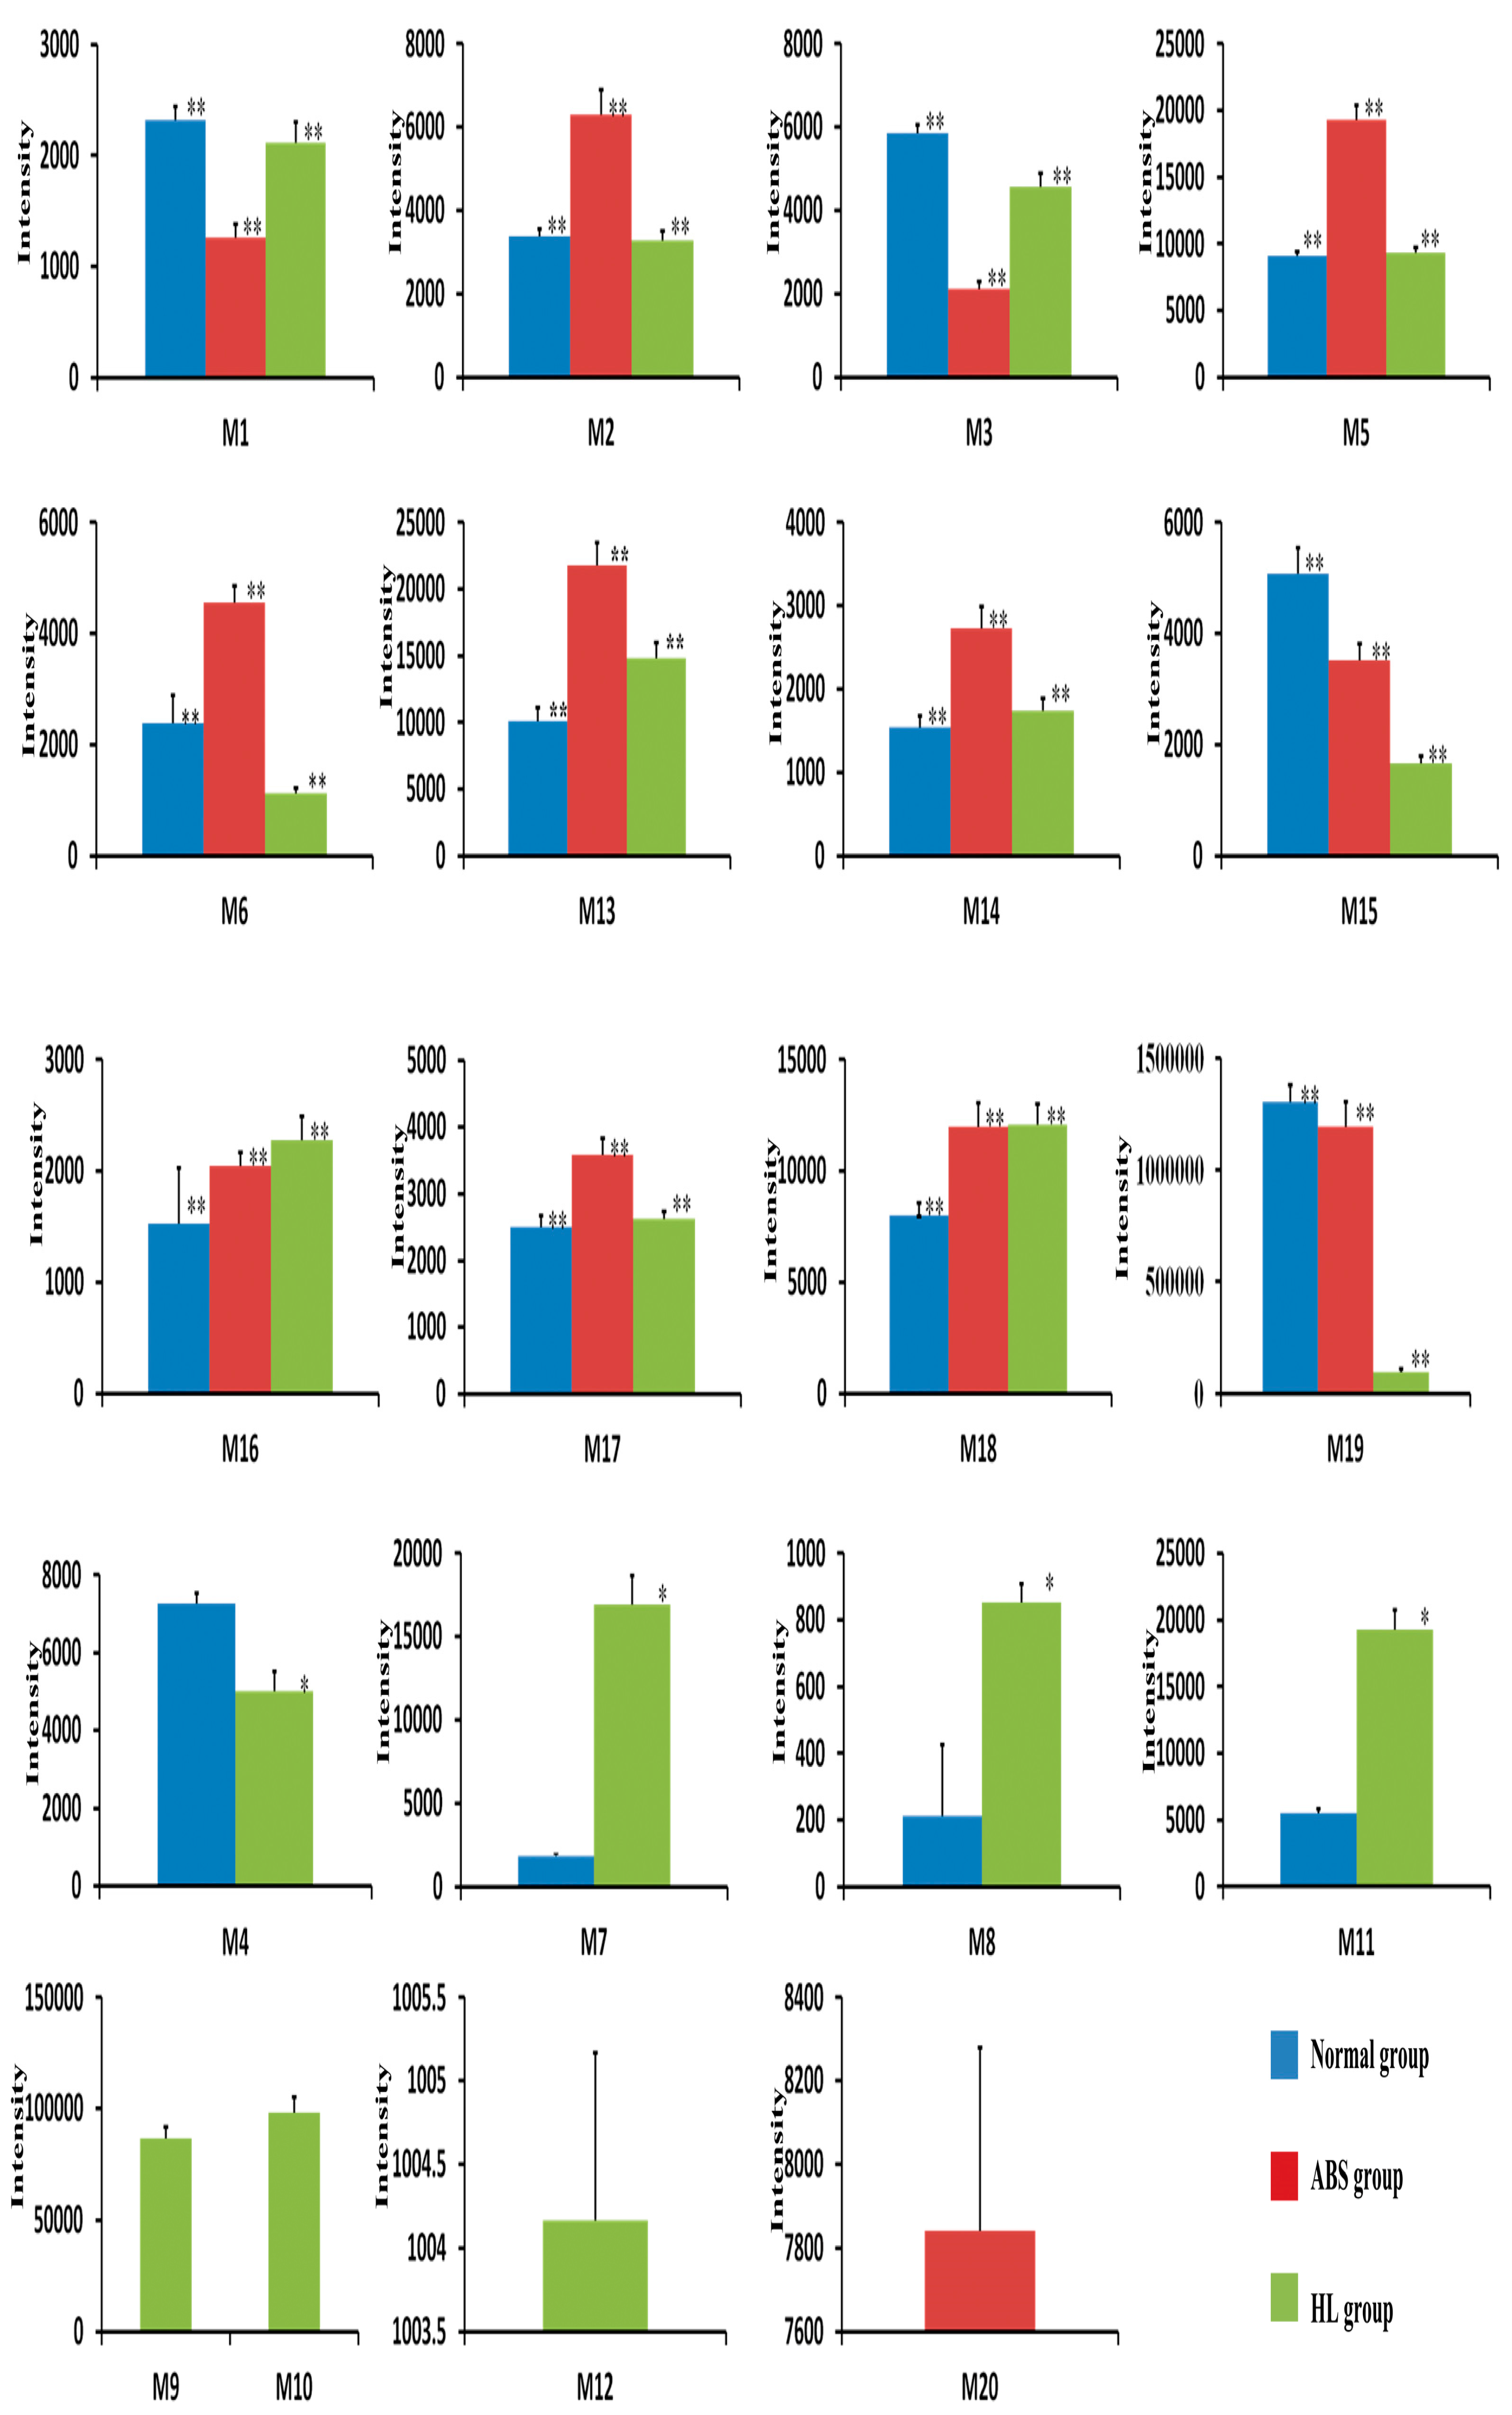
The results of the statistical analysis of all metabolites from different groups are illustrated in Figure 6. For M4, M7, M8 and M11 in the normal group and HL group, a t-test of independent samples was employed to show significant differences (p < 0.05). One-way ANOVA was applied to analyze the differences between the normal group, ABS and HL groups. There were significant differences in the metabolites of M1, M2, M3, M5, M13, M14, M15, M16, M17, M18, and M19 in the above groups (p < 0.05). The results indicated that the physiological state played a critical role in this process. In addition, for M6, there was no significant difference between ABS and HL groups. However, the significance was observed when comparing the ABS and HL groups to normal group.
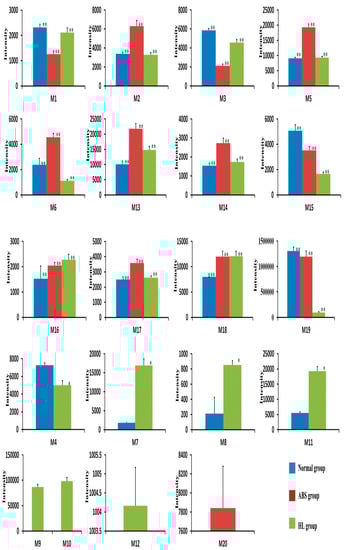
Figure 6.
Mean level of 20 metabolites in normal, ABS, and HL groups. The t-test was used to investigate the significant difference for each metabolite between two groups (* p < 0.05). One-way ANOVA was applied to analyze the significant difference among three groups (** p < 0.05).
3. Materials and Methods
3.1. Chemicals and Reagents
The GXSTC, Choerospondias axillaris, Salvia miltiorrhiza Bunge, Syzigium aromaticum, Dryobalanops and Tabaschir were kindly provided by Buchang Pharmaceutical Co. Ltd. (Xi’an, China). The reference standards of gallic acid, danshensu, protocatechuic acid, protocatechuic aldehyde, ellagic acid, rosmarinic acid, salvianolic acid A/B/C, chlorogenic acid, eugenol, dihydrotanshinone I, cryptotanshinone, tanshinone I/IIA, caffeic acid, quercetin and miltionone were purchased from Nantong Feiyu Biotechnology Co. Ltd (Nantong, China). Their mass analysis was performed on the Triple TOFTM 5600 spectrometer (AB SCIEX, Foster City, CA, USA) according to previous literature [18,19,20,21,22,23]. Meanwhile, the purity of all standards was determined to be above 98% by LC analysis based on a peak area normalization method.
Acetonitrile and methanol (HPLC-grade) were purchased from Fisher Scientific (Fair Lawn, NJ, USA). Formic acid (HPLC grade) and phosphoric acid (analytical grade) were supplied by Kemiou Chemical Reagent Co. Ltd. (Tianjin, China). Deionized water was purified by the Milli-Q water purification system from Millipore (Bedford, MA, USA). All other chemicals and reagents were analytical-grade and commercially available.
3.2. Animal Experiment
A total of thirty-six male Sprague-Dawley rats (220–250 g) obtained from the Experimental Animal Center of Shenyang Pharmaceutical University (Shenyang, China) were kept in communal plastic cages for an adaptation period of 7 days with the temperature ranging from 22 °C to 24 °C and a relative humidity of 50–60% before the oral administration. All rats were fasted for 12 h with free access to water prior to the experiment, followed by random separation into six different groups. These groups were normal control, normal dosed, HL control, HL dosed, ABS control and ABS dosed, with six rats in each group. Rats in the HL groups were fed with a high-fat diet (15% lard, 5% custard powder, 2% cholesterol, 1% sodium cholate, 0.2% propylthiouracil and 76.8% standard chow) for 6 weeks. Rats in the ABS groups were induced by left anterior descending branch ligation. The GXSTC powder was dissolved in a 0.5% carboxymethyl cellulose sodium salt (CMC-Na) buffer solution followed by single oral administration at a dose of 5.0 g/kg. For the control group, placebo samples (0.5% CMC-Na solution) were used. Blood samples were collected from the ophthalmic vein at 1 h and 2 h after administration and then centrifuged immediately at 4000 rpm for 10 min at 4 °C to obtain the plasma (TGL-16, Changsha Xiangyi Centrifuge Instrument Co., Ltd., Changsha, China), which was frozen at −80° C until analysis. The animal experimental protocol was approved by the University Ethics Committee for the use of rats. The guidelines for the care and use of laboratory animals were followed for all the animal-related experiments.
3.3. Sample Preparation
3.3.1. Sample Preparation for In Vitro Analysis
The GXSTC powder (0.5 g) was extracted with 25 mL of ethanol/water (70:30 v/v) under sonication for 30 min before centrifugation at 12,000 rpm for 10 min at 4 °C. The supernatant was collected and filtered through a syringe filter (0.22 μm) prior to analysis.
Choerospondias axillaris, Salvia miltiorrhiza Bunge, Syzigium aromaticum, Dryobalanops and Tabaschir were processed using the same sample preparation.
3.3.2. Preparation of Plasma Sample and Quality Control Sample
An aliquot of 0.5 mL of plasma was diluted with 50 mL of 4.5% hydrochloride acid and 5 mL of isopropanol, followed by the vortex for 5 min and centrifuged at 12,000 rpm for 10 min at 4 °C. The supernatant was dried under a nitrogen stream and the dryness was re-dissolved with methanol/water (80:20 v/v) and the above procedure was repeated twice. A volume of 10 μL was injected into the LC-Q-TOF/MS system for analysis.
The appropriate mixed solution containing 18 standards were piped into 100 μL of blank plasmafrom six random rats to generate a pooled quality control (QC) sample using the same manner as described above.
3.4. Instrumentation and Conditions
The LC analysis was performed on an Agilent 1260 LC system equipped with a quaternary pump, an on-line degasser, a column temperature controller and a diode array detector. Chromatographic separation was carried out on a Shimpack XR-ODS C18 column (75 mm × 3.0 mm, 2.2 μm) (Shimadzu, Kyoto, Japan), which was kept at 30 °C. The mobile phase consisted of 0.1% formic acid water (A) and 0.1% formic acid acetonitrile (B). The gradient program (B%) for analysis was as follows: 0–28 min, 10–95%; 28–30 min, 95–95%; 30–30.01 min, 95–10%; 30.01–33 min, 10–10%. The flow rate was kept at 0.4 mL/min and the injection volume was set at 5 μL.
Mass spectrometry analysis was carried out on the Triple TOFTM 5600 (AB SCIEX, Foster City, CA, USA), a hybrid triple quadrupole time-of-flight mass spectrometer equipped with ESI source operating in both positive and negative ion modes. For the MS conditions, such as the ion source temperature, ion spray voltage, nebulizer gas (gas 1), heater gas (gas 2), curtain gas and collision energy were optimized to obtain maximum sensitivity and higher resolution. The optimal conditions of the MS analysis were as follows: ion spray voltage for ESI+ and ESI− were set at 5000 V and −4500 V with an ion source temperature of 500 °C, respectively. The ion source gas1 and gas2 were both set at 50 psi with curtain gas at 30 psi. Declustering potential was set at 90 V, while nitrogen was used as nebulizer and auxiliary gas. The accurate mass and composition for the precursor ions and fragment ions were controlled by the Peak View SoftwareTM V.2.2 (version 2.2, Sciex, Redwood City, CA, USA). The TOF/MS full scan was operated with the mass range of an m/z of 100–1500.
3.5. Analytical Method Assessment
The QC samples were continuously injected to evaluate the stability and repeatability of the mass spectrometry. The relative standard deviation (RSDs) of the retention times and intensities of 18standards were less than 15% in both positive and negative modes. The results indicated that the established method is highly stable and repeatable, which is suitable for analysis.
In vitro, six replicates of the GXSTC samples were measured for technical replicates measured. In vivo, six replicates plasma samples spiked with a mixed solution containing 18 standards were used for the biological replicates measured.
3.6. MS Data Processing
In order to screen and identify the compounds in vitro, the prototype components and their metabolites in vivo, the TOF/MS data files were processed with the multiple data processing approach using AB Sciex PeakView® and MasterView™ software (version 2.2, Sciex, Redwood City, CA, USA).
The identification process and strategy was consisted of on-line data acquisition and the subsequent post-acquisition data processing. There are mainly three steps for the identification strategy. The first step is to obtain a full mass scan spectral and accurate MS/MS data sets. The batch was set up in random with 5% QC samples. Following this, for the subsequent post-acquisition data processing, PeakView® and MasterView™ software provide multiple data processing techniques, including extracted ion chromatography (EIC), MDF, and FF. Mass defect is the difference between the exact mass of the compound and the nearest integral mass. The similar phytocompounds in the same family share similar mother nucleus structures combined with different substituents (such as hydroxyl, formyl, methyl, methoxy and glycosyl). As a matter of fact, the mass defect between the phytocompounds with different substituents and the mother nucleus structure compounds in the same family changed within a narrow range. For the metabolites identification, the mass defect of metabolites is usually only ±50 mDa compared with that of the original drugs. Therefore, the procedure of the MDF approach is to set a filtering reference in the first place based on all the structures of the mother nucleus structure compounds and original drugs reported [31]. Furthermore, due to the interference of endogenous substances and the low concentration level in the plasma, the MDF and EICs approach were especially suitable for the identification of unknown metabolites of certain drugs. Meanwhile, the same fragment ions and the similar fragmentation patterns can be observed in the same family with neutral loss found in glycosides by losing saccharide residuals. The last step is to elucidate the structures of the compounds and metabolites based on the accurate quasi-molecular ion, isotopic pattern, MS/MS fragmentation pattern, relevant drug biotransformation knowledge and RSC Chemspider Database.
The samples in vitro and in vivo were all determined in six replicates with a minimum intensity of 500 and accurate mass measurements within 5 ppm. In vitro, samples were separately compared against five plant extracts to further identify their sources. In vivo, dosed group samples were compared to corresponding control groups to identify prototype components and their metabolites more accurately and reliably. The ions that were present in plasma samples and absent in the correspondent control samples were extracted and identified as the active component in vivo.
4. Conclusions
In this paper, a powerful data mining tool, the MDF and FF approaches combined with high resolution mass spectrometry was employed for rapid identification and characterization of the compounds in GXSTC both in vitro and in vivo. A total of 74 compounds (in vitro), 24 prototype components, and 20 metabolites (in vivo) were elucidated and identified by an accurate mass of the quasi-molecular ion, MS/MS fragmentation patterns were based on MDF and FF approaches and related literature. The identification of the active components and the comparison of their metabolites in different modeled rats are reported here for the first time. The compounds in vitro and active components in vivo may be valuable for the further investigation for pharmacodynamics of the formula and new drug development. The strategy presented in this study also provided a reference for the improvement of the quality control, which might offer insights and technical support for investigating the integrative mechanism of GXSTC.
Supplementary Materials
The following are available online: Figures S1 and S2 and Tables S1 and S2.
Acknowledgments
This work was supported by a grant from the National Natural Science Foundation of China (No. 81303197).
Author Contributions
X.G., H.Z. and K.B. conceived and designed the experiments; J.M. and S.G. performed the experiments; Q.L., R.L. and Y.D. analyzed the data; X.G. wrote the paper.
Conflicts of Interest
The authors declare no conflict of interest.
Abbreviations
| ABS | acute blood stasis |
| BPC | base peak chromatogram |
| EIC | extracted ion chromatogram |
| FF | fragment filtering |
| GXSTC | Guan-Xin-Shu-Tong capsules |
| HL | hyperlipidemic |
| IDA | information-dependent acquisition |
| LC-Q-TOF/MS | liquid chromatography quadrupole-time-of-flight mass spectrometry |
| m/z | mass-to-charge ratio |
| MDF | mass defect filtering |
| MS/MS | Tandem mass spectrometry |
| Q-TOF/MS | quadrupole-time-of-flight mass spectrometry |
| QC | quality control |
| RSD | relative standard deviation |
| TCM | traditional Chinese medicine |
References
- Shang, E.; Su, S.; Zeng, H.; Zhu, Z.; Duan, J. A novel modeling method to evaluate the bioactive contributions of compositions in traditional chinese medicine. Chemom. Intell. Lab. 2016, 159, 151–154. [Google Scholar] [CrossRef]
- Wang, W.; Zhang, T. Integration of traditional chinese medicine and western medicine in the era of precision medicine. J. Integr. Med. 2017, 15, 1–7. [Google Scholar] [CrossRef]
- Li, L.C.; Kan, L.D. Traditional chinese medicine for pulmonary fibrosis therapy: Progress and future prospects. J. Ethnopharmacol. 2017, 198, 45–63. [Google Scholar] [CrossRef] [PubMed]
- Wang, Y.; Xu, J.; Guo, R.; Xu, C.; Hao, Y.; Chen, C.; Hong, Y.; Lei, Z. Therapeutic effect in patients with coronary heart disease based on information analysis from traditional chinese medicine four diagnostic methods. J. Tradit. Chin. Med. 2014, 34, 34–41. [Google Scholar] [CrossRef]
- Lee, K.H.; Natschke, S.M.; Qian, K.; Dong, Y.; Yang, X.; Zhou, T.; Belding, E.; Akiyama, T. Recent progress of research on herbal products used in traditional chinese medicine: The herbs belonging to the divine husbandman’s herbal foundation canon. J. Tradit. Complement. Med. 2011, 2, 6–26. [Google Scholar] [CrossRef]
- Yang, S.; Zhang, K.; Lin, X.; Miao, Y.; Meng, L.; Chen, W.; Tang, X. Pharmacokinetic comparisons of single herb extract of fufang danshen preparation with different combinations of its constituent herbs in rats. J. Pharm. Biomed. Anal. 2012, 68, 77–85. [Google Scholar] [CrossRef] [PubMed]
- Hu, T.; Zhou, X.; Wang, L.; Or, P.M.Y.; Yeung, J.H.K.; Kwan, Y.W.; Cho, C.H. Effects of tanshinones from salvia miltiorrhiza on cyp2c19 activity in human liver microsomes: Enzyme kinetic and molecular docking studies. Chem.-Biol. Interact. 2015, 230, 1–8. [Google Scholar] [CrossRef] [PubMed]
- Wang, H.; Gao, X.D.; Zhou, G.C.; Cai, L.; Yao, W.B. In vitro and in vivo antioxidant activity of aqueous extract from choerospondias axillaris fruit. Food Chem. 2008, 106, 888–895. [Google Scholar] [CrossRef]
- Tu, L.Y.; Pi, J.; Jin, H.; Cai, J.Y.; Deng, S.P. Synthesis, characterization and anticancer activity of kaempferol-zinc(ii) complex. Bioorg. Med. Chem. Lett. 2016, 26, 2730–2734. [Google Scholar] [CrossRef] [PubMed]
- Cao, J.L.; Wei, J.C.; Hu, Y.J.; He, C.W.; Chen, M.W.; Wan, J.B.; Li, P. Qualitative and quantitative characterization of phenolic andditerpenoid constituents in danshen (salvia miltiorrhiza) bycomprehensive two-dimensional liquid chromatography coupledwith hybrid linear ion trap orbitrap mass. J. Chromatogr. A 2016, 1427, 79–89. [Google Scholar] [CrossRef] [PubMed]
- Wang, X.; Sun, W.; Sun, H.; Lv, H.; Wu, Z.; Wang, P.; Liu, L.; Cao, H. Analysis of the constituents in the rat plasma after oral administration of yin chen hao tang by UPLC/Q-TOF-MS/MS. J. Pharm. Biomed. Anal. 2008, 46, 477–490. [Google Scholar] [CrossRef] [PubMed]
- Wang, P.; Liang, Y.; Zhou, N.; Chen, B.; Yi, L.; Yu, Y.; Yi, Z. Screening and analysis of the multiple absorbed bioactive components and metabolites of dang-guibuxue decoction by the metabolic fingerprinting technique and liquid chromatography/diode-array detection mass spectrometry. Rapid Commun. Mass Spectrom. 2007, 21, 99–106. [Google Scholar] [CrossRef] [PubMed]
- Lv, Y.H.; Zhang, X.; Liang, X.; Liu, X.R.; Dai, W.X.; Yan, S.K.; Zhang, W.D. Characterization of the constituents in rat biological fluids after oral administration of fufang danshen tablets by ultra-performance liquid chromatography/quadrupole time-of-flight mass spectrometry. J. Pharm. Biomed. Anal. 2010, 52, 155–159. [Google Scholar] [CrossRef] [PubMed]
- Qiu, X.; Li, G.; Zheng, G. Effect of guanxin shutong capsule for coronary heart disease patients with cardiovascular events after coronary stent implantation. J. Inn. Mong. Univ. Natl. 2009, 24, 683–686. [Google Scholar]
- Ao, W.L.J.; Sun, Z.; Zhang, T.L.G.; Bai, M.; Wang, L.; Liu, J. Effect of guanxin shutong capsule on experimental myocardial ischemia, cardiac infarction and hemorrheology in dogs. Chin. J. Integr. Tradit. West. Med. 1998, 18, 9–11. [Google Scholar]
- Sun, Z.; Qiu, X.; Chen, G.; Yu, Y.; Zhao, M.; Ao, W.L.J. Protective effect of guanxin shutong capsule on experimental arrhythmia in rats. J. Inn. Mong. Univ. Natl. 2009, 24, 681–682. [Google Scholar]
- Guo, H.; Liu, T.; Zhang, C.; Zhang, A.; Zhou, Z. Effect of guanxin shutong capsule on serum high-sensitive c-reactive protein, interleukin-6 and superoxide dismutase in patients with alzheimer’s disease. Chin. Genet. Pract. 2012, 15, 860–862. [Google Scholar]
- Yan, K.; Chu, Y.; Huang, J.H.; Jiang, M.M.; Li, W.; Wang, Y.F.; Huang, H.Y.; Wang, W. Qualitative and quantitative analyses of compound danshen extract based on 1h nmr method and its application for quality control. J. Pharm. Biomed. Anal. 2016, 131, 183–187. [Google Scholar] [CrossRef] [PubMed]
- Li, W.; Qu, H. Rapid quantification of phenolic acids in radix salvia miltrorrhiza extract solutions by ft-nir spectroscopy in transflective mode. J. Pharm. Biomed. Anal. 2010, 52, 425–431. [Google Scholar] [CrossRef] [PubMed]
- Shen, X.J.; Ge, R.; Wang, J.H. Chemical constituents from choerospondias axillaris(roxb)burtt et hill. J. Henan Univ. (Med. Sci.) 2009, 28, 195–199. [Google Scholar]
- Jia, L.; Yang, Y.M.; Zhu, D.L.; Gao, X.H.; Wang, X.L.; Xing, H.H.; Bao, J.P.; Shu, L. Anti-proliferative effect of the extract of guangzao (fructus choerospondiatis) on cultured rat cardiac fibroblasts. J. Tradit. Chin. Med. 2015, 35, 685–689. [Google Scholar] [PubMed]
- Wang, X.Q.; Wang, L.W.; Zhao, Y.; Ma, C.M. Advance in chemical constituents and pharmacological activity of choerospondias axillaris fruit. Food Sci. 2014, 35, 281–285. [Google Scholar]
- Li, Q.Y.; Liu, Y.; Bao, H.Y. Progress on pharmaceutical effects and chemical constituents of salvia miltiorrhiza in recent five years. Food Drug 2014, 6, 145–147. [Google Scholar]
- Zhu, L.; Zhang, C.Z.; Li, C.; Zhou, W.Y. Studies on chemical constituents of choerospondias axillaris. J. Chin. Med. Mater. 2003, 26, 21–24. [Google Scholar]
- Zhang, H.N.; Yang, Y.M.; Wu, G.D. Separation of antiarrhythmic constituents of choerospondias axillaries (roxb) burtt et hill. J. Baotou Med. Coll. 2013, 29, 1–4. [Google Scholar]
- Ma, L.J.; Zhang, X.Z.; Zhang, H.P.; Gan, Y.R. Development of a fingerprint of salvia miltiorrhiza bunge by high-performance liquid chromatography with a coulometric electrode array system. J. Chromatogr. B. 2007, 846, 139–146. [Google Scholar]
- Zhang, J.L.; Cui, M.; He, Y.; Yu, H.L.; Guo, D.A. Chemical fingerprint and metabolic fingerprint analysis of danshen injection by hplc–uv and hplc–ms methods. J. Pharm. Biomed. Anal. 2005, 36, 1029–1035. [Google Scholar] [CrossRef] [PubMed]
- Liu, A.H.; Lin, Y.H.; Yang, M.; Guo, H.; Guan, S.H.; Sun, J.H.; Guo, D.A. Development of the fingerprints for the quality of the roots of salvia miltiorrhiza and its related preparations by HPLC-DAD and LC-MS(n). J. Chromatogr. B. 2007, 846, 32–41. [Google Scholar] [CrossRef] [PubMed]
- National Pharmacopoeia Committee. Pharmacopoeia of People’s Republic of China; Chinese Medicine science and Technology Press: Beijing, China, 2005; pp. 67–85.
- Xu, H.R.; Niu, H.B.; He, B.S.; Cui, C.; Li, Q.; Bi, K.S. Comprehensive qualitative ingredient profiling of chinese herbal formula wu-zhu-yu decoction via a mass defect and fragment filtering approach using high resolution mass spectrometry. Molecules 2016, 21, 664. [Google Scholar] [CrossRef] [PubMed]
- Ma, J.T.; Shan, N.; Lu, X.Y.; Wang, X.M.; Liu, F.; Nan, J.Y. Determination of gallic acid in guanxin shutong capsule by hplc method. World Chin. Med. 2011, 6, 354–355. [Google Scholar]
- Zhou, F.F.; Zhang, L.H.; Gu, L.Q.; Zhang, Y.Y.; Zhao, S.M.; Bi, K.S.; Chen, X.H.; Zhang, H.F. Simultaneous quantification of 13 components in guanxin shutong capsule by hplc method. J. Chromatogr. Sci. 2016, 54, 971–976. [Google Scholar] [CrossRef] [PubMed]
- Liu, F.; Ma, J.T.; Shan, N.; Lu, X.Y.; Dang, Y.N. Determination eugenol, borneol and isoborneol of guanxin shutong capsule by gas chromatography. Chin. J. Exp. Tradit. Med. 2011, 17, 56–59. [Google Scholar]
- Liu, L.; Leng, J.; Yang, X.; Liao, L.; Cen, Y.; Xiao, A.; Ma, L. Rapid screening and identification of bsa bound ligands from radix astragali using bsa immobilized magnetic nanoparticles coupled with HPLC-MS. Molecules 2016, 21, 1471. [Google Scholar] [CrossRef] [PubMed]
- Liang, Y.; Wu, J.L.; Zhou, H.; Liu, Z.; Yan, G.; Liu, Y.; Liu, L.; Li, N. Identification of oxygenated fatty acid as a side chain of lipo-alkaloids in aconitum carmichaelii by uhplc-q-tof-ms and a database. Molecules 2016, 21, 437. [Google Scholar] [CrossRef] [PubMed]
- Zhu, H.; Bi, K.; Hana, F.; Guan, J.; Tang, Z.; Zhao, L.; Yin, R.; Hou, X. Simultaneous determination of two iridoid glycosides, twoanthraquinones and four flavonoid glycosides of zhi-zi-da-huangdecoction in rat plasma by UFLC-MS/MS: Application to a comparativepharmacokinetic study in healthy and cholestatic liver injury rats. J. Chromatogr. B 2014, 960, 116–125. [Google Scholar] [CrossRef] [PubMed]
- Zhang, Q.Q.; Dong, X.; Liu, X.G.; Gao, W.; Li, P.; Yang, H. Rapid separation and identification of multiple constituents in danhong injection by ultra-high performance liquid chromatography coupled to electrospray ionization quadrupole time-of-flight tandem mass spectrometry. Chin. J. Nat. Med. 2016, 14, 147–160. [Google Scholar] [CrossRef]
- Liu, M.; Zhao, S.; Wang, Z.; Wang, Y.; Liu, T.; Wang, H.; Tu, P. Identification of metabolites of deoxyschizandrin in rats by UPLC-Q-TOF-MS/MS based on multiple mass defect filter dataacquisition and multiple data processing techniques. J. Chromatogr. B 2014, 949–950, 115–126. [Google Scholar] [CrossRef] [PubMed]
- Liu, S.; Che, Y.; Wang, F.; Shang, Z.; Lu, J.; Dai, S.; Zhang, J.; Cai, W. Identification of metabolites of 6′-hydroxy-3,4,5,2′,4′-pentamethoxychalcone in rats by a combination of ultra-high-performance liquid chromatography with linear ion trap-orbitrap mass spectrometry based on multiple data processing techniques. Molecules 2016, 21, 1266. [Google Scholar]
- Shi, Y.; Xia, Y.; Wang, J.; He, J.; Feng, F.; Liu, W. Metabolic profile of 5-hydroxy-4-methoxycanthin-6-one, a typical canthinone alkaloid, in rats determined by liquid chromatography-quadrupole time-of-flight tandem mass spectrometry together with multiple data processing techniques. J. Pharm. Biomed. Anal. 2016, 129, 60–69. [Google Scholar] [CrossRef] [PubMed]
- Zhou, Y.; Xu, G.; Choi, F.F.K.; Ding, L.S.; Han, Q.B.; Qiao, C.F.; Zhao, Q.S.; Xu, H.X. Qualitative and quantitative analysis of diterpenoids in salvia species by liquid chromatography coupled with electrospray ionization quadrupole time-of-flight tandem mass spectrometry. J. Chromatogr. A 2009, 1216, 4847–4858. [Google Scholar] [CrossRef] [PubMed]
- Qi, Z.; Yuting, Y.; Fengming, L.; Yiting, S. Effects of total flavonoids from fructus jujube on protein expression in ischemic myocardium of rats. Chin. Pharm. Bull. 2006, 1, 22. [Google Scholar]
- Liu, T.; Zhu, D.L.; Yang, Y.M. Effects of total flavonoids from fructus jujube on myocardial fibrosis induced by angii. Chin. J. Nat. Med. 2014, 12, 56–59. [Google Scholar]
- Zhang, S.; Wang, Y.; Ai, M. Effects of total flavonoids from fructus date on right ventricular papillary muscles of guinea pig. Chin. Pharm. Bull. 2002, 18, 266–269. [Google Scholar]
- Sun, A.; Zhang, Y.; Li, A.; Meng, Z.; Liu, R. Extraction and preparative purification of tanshinones from salvia miltiorrhiza bunge by high-speed counter-current chromatography. J. Chromatogr. B 2011, 879, 1899–1904. [Google Scholar] [CrossRef] [PubMed]
- Su, C.; Liang, M.; Khalid, R.; Ting, H.; Ping, Q. Salvia miltiorrhiza: Traditional medicinal uses, chemistry, and pharmacology. Chin. J. Nat. Med. 2015, 13, 163–182. [Google Scholar] [CrossRef]
- Park, O.K.; Choi, J.H.; Park, J.H.; Kim, I.H.; Yan, B.C.; Yan, B.C.; Kwon, S.H.; Won, M.-H. Comparison of neuroprotective effects of five major lipophilic diterpenoids from danshen extract against experimentally induced transient cerebral ischemic damage. Fitoterapia 2012, 83, 1666–1674. [Google Scholar] [CrossRef] [PubMed]
- Sun, W.; Tong, L.; Miao, J.; Huang, J.; Li, Y.; Xiao, H.; Sun, H.; Bi, K. Separation and analysis of phenolic acids from salvia miltiorrhiza and its related preparations by off-line two-dimensional hydrophilic interaction chromatography × reversed-phase liquid chromatography coupled with ion trap time-of-flight mass spectrometry. J. Chromatogr. A 2016, 1431, 79–88. [Google Scholar] [CrossRef] [PubMed]
- Liu, A.H.; Guo, H.; Ye, M.; Lin, Y.H.; Sun, J.H.; Xu, M.; Guo, D.-A. Detection, characterization and identification of phenolic acids in danshen using highperformance liquid chromatography with diode array detection and electrospray ionization mass spectrometry. J. Chromatogr. A 2007, 1161, 170–182. [Google Scholar] [CrossRef] [PubMed]
- Zeng, G.; Xiao, H.; Liu, J.; Liang, X. Identification of phenolic constituents in radix salvia miltiorrhizae by liquid chromatography/electrospray ionization mass spectrometry. Rapid Commun. Mass Spectrom. 2006, 20, 499–506. [Google Scholar] [CrossRef] [PubMed]
- Chen, W.; Wang, D.; Wang, L.S.; Bei, D.; Wang, J.; See, W.A.; Mallery, S.R.; Stoner, G.D.; Liu, Z.F. Pharmacokinetics of protocatechuic acid in mouse and its quantification in human plasma using lc tandem mass spectrometry. J. Chromatogr. B 2012, 39–44. [Google Scholar] [CrossRef] [PubMed]
- Roumeguère, T.; Wespes, E.; Carpentier, Y.; Hoffmann, P.; Schulman, C.C. Erectile dysfunction is associated with a high prevalence of hyperlipidemia and coronary heart disease risk. Eur. Urol. 2003, 44, 355–359. [Google Scholar] [CrossRef]
- Wang, S.H.; Wang, J.; Ji, L. Relationship between the gensini score of blood-stasis syndrome in coronary heart disease and vegf. World Sci. Technol. 2010, 12, 355–357. [Google Scholar]
- Zhang, H.; Wang, W.R.; Lin, R.; Zhang, J.Y.; Ji, Q.L.; Lin, Q.Q.; Yang, L.N. Buyang huanwu decoction ameliorates coronary heart disease with qi deficiency and blood stasis syndrome by reducing crp and cd40 in rats. J. Ethnopharmacol. 2010, 130, 98–102. [Google Scholar] [CrossRef] [PubMed]
- Gu, J.; Feng, L.; Zhang, M.; Qin, D.; Jiang, J.; Cheng, X.; Yang, S.; Jia, X. New metabolite profiles of danshensu in rats by ultraperformance liquid chromatography/quadrupole-time-of-flight mass spectrometry. J. Chromatogr. B 2014, 955, 20–25. [Google Scholar] [CrossRef] [PubMed]
- Dai, X.; Yan, Y.; Wu, Q.; Yu, C.; Liu, X.; Jiang, Y. Comparative pharmacokinetics of rhein and chrysophanol after oral administration of quyuqingregranules in healthy and acute blood stasis rabbits. J. Ethnopharmacol. 2014, 154, 338–343. [Google Scholar] [CrossRef] [PubMed]
- Tiana, Y.; Yang, Z.; Li, Y.; Qiao, Y.; Yang, J.; Jia, Y.; Wen, A. Pharmacokinetic comparisons of hydroxysafflower yellow a in healthy and blood stasis syndrome rats. J. Ethnopharmacol. 2010, 129, 1–4. [Google Scholar] [CrossRef] [PubMed]
- Liu, Y.; Lehmlerc, H.-J.; Robertsonc, L.W.; Duffela, M.W. Physicochemical properties of hydroxylated polychlorinated biphenyls aid in predicting their interactions with rat sulfotransferase 1A1 (rSULT1A1). Chem. Biol. Interact. 2011, 189, 153–160. [Google Scholar] [CrossRef] [PubMed]
- Dai, H.; Wang, M.; Li, X.; Wang, L.; Li, Y.; Xue, M. Structural elucidation of in vitro and in vivo metabolites of cryptotanshinone by HPLC-DAD-ESI-MSn. J. Pharm. Biomed. Anal. 2008, 48, 885–896. [Google Scholar] [CrossRef] [PubMed]
- Zhou, C.; Li, G.; Li, Y.; Gong, L.; Huang, Y.; Shi, Z.; Du, S.; Sun, C. A high-throughput metabolomic approach to explore the regulatory effect of mangiferin on metabolic network disturbances of hyperlipidemia rats. Mol. Biosyst. 2015, 11, 418–433. [Google Scholar] [CrossRef] [PubMed]
- Miao, H.; Chen, H.; Pei, S.; Bai, X.; Nosratola, D.; Vaziri; Zhao, Y.Y. Plasma lipidomics reveal profound perturbation of glycerophospholipids, fatty acids, and sphingolipids in diet-induced hyperlipidemia. Chem. Biol. Interact. 2015, 228, 79–87. [Google Scholar] [CrossRef] [PubMed]
Sample Availability: Samples of the compounds 9, 10, 11, 12, 13, 17, 24, 27 are available from the authors. |

© 2017 by the authors. Licensee MDPI, Basel, Switzerland. This article is an open access article distributed under the terms and conditions of the Creative Commons Attribution (CC BY) license (http://creativecommons.org/licenses/by/4.0/).