Abstract
A series of caffeic acid amides D1-D17 bearing 2,3,4,5-tetrahydrobenzo-[b][1,4]dioxocine units has been synthesized and their biological activities evaluated for potential antiproliferative and EGFR inhibitory activity. Of all the compounds studied, compound D9 showed the most potent inhibitory activity (IC50 = 0.79 μM for HepG2 and IC50 = 0.36 μM for EGFR). The structures of compounds were confirmed by 1H-NMR, ESI-MS and elemental analysis. Among all, the structure of compound D9 ((E)-N-(4-ethoxyphenyl)-3-(2,3,4,5-tetrahydrobenzo[b][1,4]dioxocin-8-yl)acrylamide) was also determined by single-crystal X-ray diffraction analysis. Compound D9 was found to be a potential antitumor agent according to biological activity, molecular docking, apoptosis assay and inhibition of HepG2.
1. Introduction
Cancer is a major cause of death in the World. In the United States one in four deaths is due to cancer [1]. Though we spend a lot of effort and money on research, control of advanced cancer has not been achieved, so it is crucial to find novel cancer agents with new mode of action for saving lives. EGFR (epidermal growth factor receptor) is a growth-factor-receptor tyrosine kinase which plays a vital role in proliferation, survival, migration, differentiation and metastasis of many tumors such as lung-cancer [2,3], head and neck cancer [4,5], breast cancer [6,7], gastric cancer [8], ovarian cancer [9]. In addition, many researchers have demonstrated that the EGFR can be seen as a rational target for anticancer [10,11]. For example, erlotinilb which could inhibit EGFR was approved as an antitumor agent a decade ago [12].
Caffeic acid is a natural phenolic compound found in plants. Caffeic acid and its derivatives possess a wide range of biological activities such as antimicrobial [13], anti-inflammatory [14], antioxidant [15], antimutagenic [16] and anti-HIV [17]. Besides, it also displays potential antitumor activities. Chen et al. synthesized caffeic acid phenethyl ester from caffeic acid and found that it could arrest the growth of human leukemia H460 cells [18]. Liao et al. have also reported caffeic acid phenethyl ester as a potential antimetastatic agent [19].
Some compounds containing 1,4-benzodioxan units and possessing potent biological activity were reported in previous studies. For example, Lv et al. have synthesized a series of luteolin derivatives containing 1,4-benzodioxan which showed better antibacterial activity than luteolin [20]. Sun et al. have reported a series of 1,3,4-thiadiazole derivatives containing 1,4-benzodioxan. Among all these compounds, (E)-N-(5-(2,3-dihydrobenzo[b][1,4]dioxin-6-yl)-1,3,4-thiadiazol-2-yl)-4-phenylbut-3-enamide showed potent biological activity against HepG2 [21].
However, to our knowledge, few reports were dedicated to synthesizing and evaluating biological activities of caffeic acid derivatives that contain 2,3,4,5-tetrahydrobenzo[b][1,4]dioxocine structures. Thus, herein we described the synthesis and the structure-activity relationship (SAR) of some caffeic acid derivatives with screening for inhibition of cell proliferation activity. In addition, according to EGFR inhibitory activity, molecular docking, apoptosis assay, cytotoxicity and inhibition to cancer cell migration assay, compound D9 was found to be a potential antitumor agent. The results could be helpful to find more potential antitumor agents.
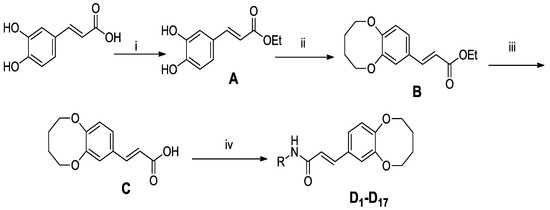
Scheme 1.
General synthesis of compounds (D1-D17).
2. Results and Discussion
2.1. Chemistry
In order to study the antitumor activities of (E)-3-(2,3,4,5-tetrahydrobenzo[b][1,4]dioxocin-8-yl)acrylic acid amides, compounds D1-D17 were synthesized from caffeic acid. The synthetic routes are shown in Scheme 1. All caffeic acid derivatives gave satisfactory analyses. 1H-NMR and ESI-MS spectra showed no differences with the designed structures. Besides, the structure of compound D9 was confirmed by X-ray diffraction analysis. The crystal data of D9 is presented in Table 1 and Figure 1, giving perspective views of this compound together with the atomic labeling system.

Table 1.
Crystal data for compound D9.
| Crystal parameters | Compound D9 |
|---|---|
| Empirical formula | C21H23NO4 |
| Molecular weight | 353.41 |
| Crystalsize (mm3) | 0.11 × 0.15 × 0.30 |
| Temperature (K) | 273(2) |
| Radiation | Mo-Kα (0.7103 Å) |
| Crystalsystem | Monoclinic |
| Space group | C 2/ c |
| a (Å) | 26.835(5) |
| b (Å) | 9.9597(16) |
| c (Å) | 18.698(3) |
| α (°) | 90.00 |
| β (°) | 133.339(4) |
| γ (°) | 90.00 |
| V (Å3) | 3635.0(10) |
| Z | 72 |
| Dc (g cm–3) | 1.415 |
| μ (mm–1) absort.coeff | 0.127 |
| F(000) | 1584 |
| θ rang (deg) | 2.09–25.97 |
| Reflectionscollected | 17808(Rint = 0.1279) |
| Indep. reflns | 3512 |
| Refns obs. [I > 2σ(I)] | 1499 |
| Data/restr./paras | 3512/0/236 |
| Goodness-of-fit on F2 | 0.984 |
| R1, wR2 (all data) | 0.1310/0.1965 |
| R1, wR2 [I > 2σ(I)] | 0.0575/0.0984 |
| Larg. peak/hole (e. Å) | 0.181/−0.202 |
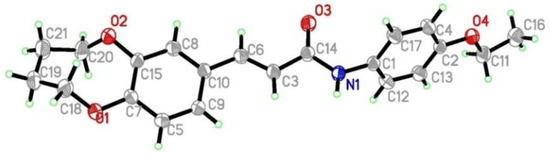
Figure 1.
Crystal structure diagram of compound D9.
2.2. Anti-Proliferative Activity
Compound C ((E)-3-(2,3,4,5-tetrahydrobenzo[b][1,4]dioxocin-8-yl)acrylic acid), caffeic acid and caffeic acid derivatives D1-D17 were evaluated for their anti-proliferation activity against Hela, HepG2 and A431. Erlotinib as standard drug was also tested under the same conditions for comparison. The results were summarized in Table 2.
Table 2.
Inhibition (IC50) of Hela, HepG2 and A431cells proliferation by compounds D1-D17 (After cells incubation with compounds for 24 h). 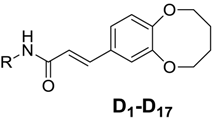
| Compounds | R | IC50 (μM) | |||
|---|---|---|---|---|---|
| Hela | HepG2 | A431 | |||
| D1 |  | 13.64 | 3.47 | 16.58 | |
| D2 |  | 28.17 | 9.40 | 24.65 | |
| D3 |  | 19.62 | 10.21 | 8.96 | |
| D4 |  | 23.72 | 11.05 | 10.02 | |
| D5 |  | 21.40 | 10.50 | 9.31 | |
| D6 | 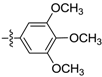 | 25.68 | 13.18 | 11.68 | |
| D7 |  | 8.71 | 3.16 | 12.56 | |
| D8 |  | 7.04 | 0.95 | 7.42 | |
| D9 |  | 6.75 | 0.79 | 7.03 | |
| D10 |  | 18.54 | 6.87 | 20.00 | |
| D11 |  | 16.70 | 4.94 | 18.95 | |
| D12 |  | 10.77 | 6.28 | 14.22 | |
| D13 |  | 24.30 | 15.23 | 14.05 | |
| D14 |  | 30.75 | 9.03 | 22.63 | |
| D15 |  | 5.15 | 1.48 | 17.80 | |
| D16 |  | 9.04 | 2.38 | 7.96 | |
| D17 |  | 19.52 | 7.90 | 21.56 | |
| C | - | 105 | 56 | 41 | |
| Caffeic acid | - | 544 | 225 | 93.5 | |
| Erlotinib | - | 0.08 | 0.04 | ||
As shown in Table 2, caffeic acid derivatives D1-D17 showed excellent to moderate activity against HepG2 cell lines displaying IC50 values between 0.79 to 15.23 μM. Among them, compound D9 showed the most potent inhibitory activity (IC50 = 0.79 µM).
Structure-activity relationships (SAR) of the caffeic derivatives were analyzed. The data of Table 2 showed that compound C possessed stronger cell anti-proliferation activity than caffeic acid, suggesting the the 2,3,4,5-tetrahydrobenzo[b][1,4]dioxocine structure could enhance the biological activity. That all caffeic amides derivatives showed better cells proliferation activity than compound C also indicated that amide groups could enhance the biological activity.
From Table 2, we found that the compounds bearing different amide groups correspondingly possess diverse anti-proliferation activities, which indicated that the anti-proliferative activity of compounds was related to the structure of amides group. For instance, compound D1 bearing one ‑NO2 at the p-position of the benzene ring showed better anti-proliferation activity as compared to D2 which bears one m-NO2 on its benzene ring. The same rule also applies to D8 and D7. The result meant that the p-position was important to enhance the anti-proliferative activity of compounds.
Compound D3 bearing -OCH3 at the m-position possessed lower biological activity as compared to D8 bearing -OCH3 at the p-position of the benzene ring, making it reasonable to say that the position of the ‑OCH3 on the benzene ring also has a distinct impact on anti-proliferation activity. Compound D16 has a -Br at the p-position of the benzene ring, and the addition of one -F at the o-position led to D14 along with a decrease in the biological activity. From the above fact, one rule could be found: amide groups with one substituent at the p-position of the benzene ring tend to display potent cell anti-proliferation activity. Meanwhile, we found that the compounds possessed different biological activities with single diverse p-position substituent groups. The inhibitory activity of the derivatives with single different substituents could be arrange in the following order: -OCH2CH3 > -OCH3 > -Br > -NO2, indicating that compounds with electron-donating groups at the p-position showed better inhibitory activity than those with electron-withdrawing groups.
2.3. EGFR Inhibitory Activity
In addition, we selected the top nine compounds having better antiproliferation activity against HepG2 cells to test their EGFR inhibitory activity. The results were summarized in Table 3. Of the compounds studied, most showed good EGFR inhibitory activity. Among all compounds, D9 showed the most potent inhibitory activity with an IC50 value of 0.36 μM. The result indicated that D9 has high binding affinity with EGFR which supported the potent anti-proliferation activity.
Table 3.
EGFR inhibitory activity of synthetic compounds (after enzyme incubation with compounds for 70 min).
| Compounds | EGFR (IC50 (µM)) |
|---|---|
| D1 | 7.25 |
| D7 | 6.78 |
| D8 | 0.85 |
| D9 | 0.36 |
| D10 | 12.42 |
| D11 | 8.97 |
| D12 | 12.04 |
| D15 | 2.18 |
| D16 | 3.52 |
| Erlotinib | 0.03 |
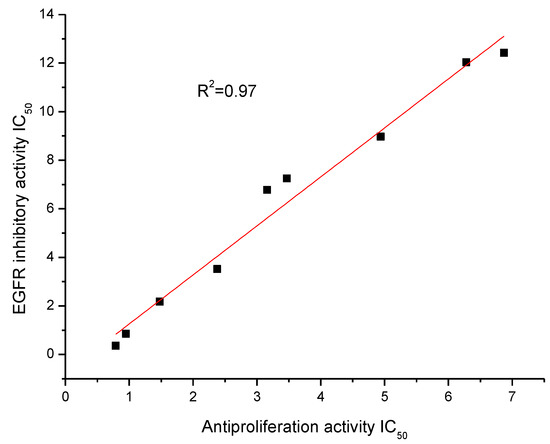
Figure 2.
Correlation between the anti-proliferation against HepG2 cell line and EGFR inhibitory activity, R2 = 0.97.
An analysis comparing the anti-proliferation activity against the HepG2 cell line and EGFR inhibitory activity of the top nine compounds suggested that there was a moderate correlation between anti-proliferation and EGFR inhibitory (Figure 2, R square value was 0.97). This demonstrated that the potent anti-proliferation activities of the synthesized compounds were probably correlated to their EGFR inhibitory activities.
2.4. Apoptosis Assay
To confirm the inhibition of cell growth HepG2, apoptosis study of compound D9 was induced using flow cytometry. As shown in Figure 3, the percentages of cell apoptosis 17.99%, 26.83%, 41.1% were responding to the concentrations of compound D9 4, 6, 8 μM. The results displayed that compound D9 induced apoptosis of the HepG2 cell line.
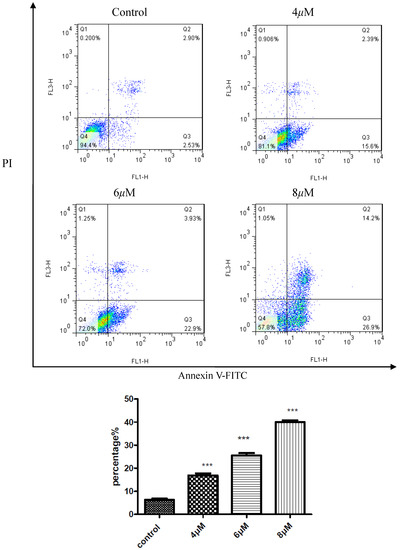
Figure 3.
Compound D9 induced apoptosis in HepG2 cell with the density of 4, 6, 8 μM. Data are plotted as the mean ± SD (* P < 0.0005 vs. control).
2.5. Inhibition to HepG2 Cell Migration of D9
Though inhibiting cell proliferation could decrease the damage to humans, however many cancer cells can migrate from primary tumors to a distant organ. Metastasis often causes death in patients with cancer. Therefore, the inhibition of cancer cell migration is an effective way for curing cancer. Compound D9 was evaluated for inhibitory ability toward HepG2 cell migration by a Trans well assay. Before testing the inhibition of cell migration, we applied the CCK8 assay to analyze the relationship between concentrations of compound D9 with HepG2 cell survival ratios. The result showed that D9 has no effect to HepG2 cell survival ratios at concentrations lower than 0.1 μM, so we chose D9 concentrations as 0.06, 0.08, 0.1 μM and evaluated their inhibitory activity against HepG2 cell migration. The results were summarized in Figure 4. As shown in Figure 4, the amount of migrating cells was less than control group at a certain concentration of compound D9, indicating that compound D9 is a potential drug for anti-metastasis therapy.
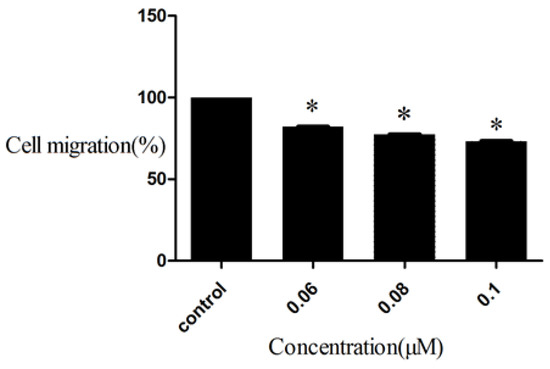
Figure 4.
Inhibition to HepG2 Cell migration of compound D9. Values are expressed as a percentage of the control, which was defined as 100%. Data are plotted as the mean ± SD (* P < 0.05 vs. control).
2.6. Molecular Docking
To gain better understanding of the interaction binding mode between the target protein and small molecules, the molecular docking of compound D9 and EGFR was performed on the binding model based on the EGFR complex structure (PDB code: 2J6M) [22] by using Discovery studio 3.5. The 2D and 3D optimal conformation diagrams were depicted as Figure 5 and Figure 6, respectively. In the binding mode, D9 was mixed with amino acid MET 793 (angle N-H-O = 134.33°, distance = 2.11 Å) and LEU1001 (angle O-H-N = 150.6°, distance = 2.44 Å) formed two H-bonds which could enhance the binding affinity resulted in the enhancement in the antitumor activity. The result of molecular docking along with the biological assay data suggested that compound D9 was a potential inhibitor of EGFR.
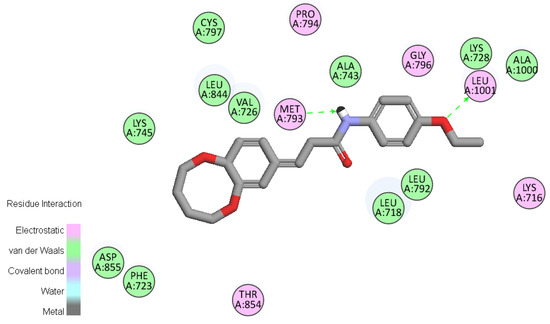
Figure 5.
2D molecular docking of compound D9 with 2J6M. The two H-bonds (green lines) are displayed.
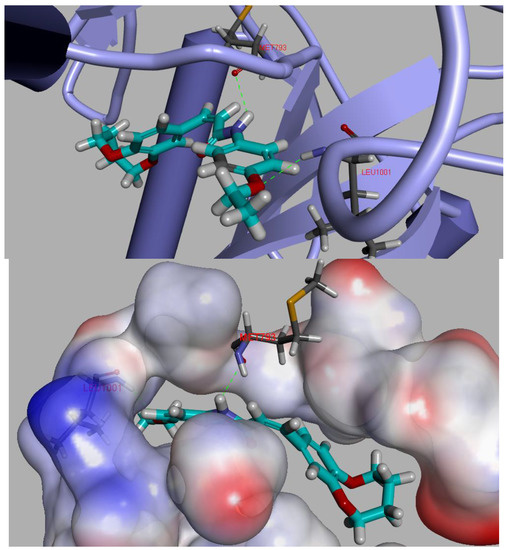
Figure 6.
3D model of the interaction between compound D9 and 2J6M bonding site.
3. Experimental Section
3.1. Chemistry
3.1.1. Chemistry General Information
Caffeic acid (>98%, m.p. 222–224 °C) provided by Hubei Yuancheng Pharmaceutical Co., Ltd. was used without purification. The other chemicals and reagents used in our study were made in China with AR grade. 1H-NMR spectra were recorded at 300 MHz on a Bruker DPX300 spectrometer (Fällanden, Switzerland), ESI-MS were recorded by a Mariner System 5304 mass spectrometer (Manchester, UK). Elementary analyses were performed on a CHN-O-Rapid instrument (Hanau, Germany). Melting points (uncorrected) were detected on a SPSIC WRS-1B digita1 melting-point apparatus (Shanghai, China). Column chromatography and silica gel (200–300 mesh) were used to separate the compounds. TLC used gel-coated glass slides (silica gel 60 Å GF254) and visualized in UV light (254 nm).
3.1.2. Experimental Procedure for the Synthesis of (E)-ethyl 3-(3,4-dihydroxyphenyl)acrylate (A)
To a solution of caffeic acid (18 g, 100 mmol) in ethyl alcohol (50 mL), concentrated hydrochloric acid (5 mL) was added. After 2 h of reflux at 70 °C, the solution was evaporated and the solid was washed with water (3 × 100 mL) to give A as a yellow power (yield 99%), m.p.: 377–378 °C, 1H-NMR (DMSO-d6, δ ppm): 7.56(d, J = 16.2 Hz, 1H, CH); 7.18(d, J = 1.5 Hz, 1H, ArH); 7.06 (d, J = 1.5 Hz, 1H, ArH); 6.90 (m, 1H, ArH); 6.33 (d, J = 15.6 Hz, CH), 4.17 (m, 1H, CH2); 1.30 (m, 3H, CH3); MS (ESI) 199 [M + H]+.Anal. calcd. for C10H14O4: C, 60.59; H, 7.12; O, 32.29 Found: C, 60.62; H, 7.10; O, 32.27.
3.1.3. Experimental Procedure for the Synthesis of (E)-ethyl 3-(2,3,4,5-tetrahydrobenzo[b][1,4]-dioxocin-8-yl)acrylate (B)
To a solution of A (10.4 g, 50 mmol) and potassium carbonate (3.45 g, 25 mmol) in anhydrous DMF (25 mL) at 0 °C, the solution of 1,4-dibromobutane (12 g, 60 mmol) in anhydrous DMF (10 mL) was added dropwise. Then the reaction mixture was heated at 70 °C for 6 h. To the mixture was added water (180 mL) and the solution was extracted by ethyl acetate (3 × 50 mL). The organic solution was evaporated and the residue was purified by a silica gel column eluted with VEtOAc/VPE = 1:10 gave B as a yellow solid (39%).
3.1.4. Experimental Procedure for the Synthesis of (E)-3-(2,3,4,5-tetrahydrobenzo[b][1,4]dioxocin-8-yl)acrylic acid (C)
Compound B (6.55 g, 25mmol) and potassium carbonate (3.45 g, 25 mmol) were added to 50% EtOH/H2O solution (30 mL) followed by heating at 70 °C for 2 h. Then water (100 mL) was added and the solution was extracted with ethyl acetate. The water layer was decanted and then acidified using dilute hydrochloric acid to pH 1–2 to get C as a yellow solid (95%). m.p.: 127–128 °C, 1H-NMR (DMSO-d6, δ ppm): 7.64 (d, J = 9.54 Hz, 1H, CH); 7.15 (m, 2H, ArH); 6.97 (d, J = 9.51 Hz, 1H, CH); 4.2 (m, 4H, CH2); 1.89 (m, 4H, CH2); MS (ESI) 235 [M + H]+. Anal. calcd. for C13H14O4: C, 66.66; H, 6.02; O, 27.32. Found: C, 66.67; H, 6.05; O, 27.33.
3.1.5. General Experimental Procedure for the Synthesis of Compounds D1-D17
To a mixture of C (2.34 g, 10 mmol), HOBT (1.35g, 10 mmol) and EDCI (1.91 g, 10 mmol) dissolved in CH2Cl2 (30 mL), amine (10 mmol) was added. The solution was refluxed for 8 h. Upon evaporation of CH2Cl2 and column chromatography (eluent: EtOAc and PE) D1-D17 were isolated.
(E)-N-(4-nitrophenyl)-3-(2,3,4,5-tetrahydrobenzo[b][1,4]dioxocin-8-yl)acrylamide (D1). Yellow solid, yield 31%, m.p.: 125–126 °C, 1H-NMR (CDCl3, δ ppm): 8.13 (d, J = 8.4 Hz, 1H, ArH); 7.97 (d, J = 16.1 Hz, CH); 7.51 (m, 3H, ArH); 7.29 (d, J = 9.8 Hz, 2H ArH); 7.02 (d, J = 8.0 Hz, 1H, ArH); 6.60 (d, J = 15.9 Hz, 1H, CH); 4.53–4.57 (m, 2H, CH2); 4.31–4.34 (m, 2H, CH2); 1.87–1.92 (m, 4H, CH2); MS (ESI) 355 [M + H]+. Anal. calcd. for C19H18N2O5: C, 64.40; H, 5.12; N, 7.91. Found: C, 64.45; H, 5.08; N, 7.98.
(E)-N-(2-nitrophenyl)-3-(2,3,4,5-tetrahydrobenzo[b][1,4]dioxocin-8-yl)acrylamide (D2). Yellow solid yield 32%, m.p.: 119–120 °C, 1H-NMR (DMSO-d6, δ ppm): 9.97 (s, 1H, NH); 8.19 (d, J = 8.4 Hz, 1H, ArH); 7.85 (m, 3H, ArH); 7.7 (d, J = 8.4 Hz, 1H, ArH); 7.31 (m, 2H, ArH NH); 6.95 (d, J = 15.9 Hz, 1H, CH); 6.42 (d, J = 15.9 Hz,1H, CH); 4.22–4.41 (m, 4H, CH2); 1.87–1.96 (m, 4H,CH2); MS (ESI) 355 [M + H]+. Anal. calcd. for C19H18N2O5: C, 64.40; H, 5.12; N, 7.91. Found: C, 64.43; H, 5.09; N, 7.93.
(E)-N-(3,4-dimethoxyphenyl)-3-(2,3,4,5-tetrahydrobenzo[b][1,4]dioxocin-8-yl)acrylamide (D3). Yellow solid, yield 31%, m.p.: 171–172 °C, 1H-NMR (DMSO-d6, δ ppm): 9.97 (s, 1H, NH); 7.44 (d, J = 15.0 Hz, 2H, CH, ArH); 7.2 (m, 3H, ArH); 6.99 (d, J = 6.0 Hz, 1H, ArH); 6.91 (d, J = 9.0 Hz, 1H, ArH); 6.64 (d, J = 18.0 Hz, 1H, CH); 4.25–4.35 (m, 4H, CH2); 3.72–3.74 (m, 6H, OCH3); 1.92–1.95 (m, 4H, CH2); MS (ESI) 370 [M + H]+. Anal. calcd. for C21H23NO5: C, 68.28; H, 6.28; N, 3.79. Found: C, 69.01; H, 6.32; N, 3.77.
(E)-N-(3,5-dimethoxyphenyl)-3-(2,3,4,5–tetrahydrobenzo[b][1,4]dioxocin-8-yl)acrylamide (D4). Yellow amorphous solid, yield 34%, m.p.: 115–116 °C, 1H-NMR (DMSO-d6, δ ppm): 10.07 (s, 1H, NH); 7.48–7.43 (d, J = 15.72 Hz, 1H, CH); 7.39 (s, 1H); 7.19 (m, 4H, ArH); 6.97 (d, J = 8.5 Hz, 1H, ArH); 6.68 (d, J = 15.5 Hz, 1H, CH); 4.23–4.34 (m, 4H, CH2); 3.37 (s, 3H, OCH3); 3.3 (s, 3H, OCH3); 1.82 (m, 4H, CH2); MS (ESI) 370 [M + H]+. Anal. calcd. for C21H23NO5: C, 68.28; H, 6.28; N, 3.79. Found: C, 68.29; H, 6.26; N, 3.81.
(E)-N-(2,5-dimethoxyphenyl)-3-(2,3,4,5-tetrahydrobenzo[b][1,4]dioxocin-8-yl)acrylamide (D5). Yellow amorphous solid, yield 28%, m.p.: 110–111 °C, 1H-NMR (DMSO-d6, δ ppm): 9.19 (s, 1H, NH); 7.93 (s, 1H, ArH); 7.45 (d, J = 15.3 Hz, 1H, CH); 7.25 (d, J = 8.7 Hz, 2H, ArH); 7.1 (d, J = 15.5 Hz, 1H CH); 6.97 (m, 2H, ArH); 6.63 (m, 1H, ArH); 4.2–4.3 (m, 4H, CH2); 3.81 (s, 3H, OCH3); 3.70 (s, 3H, OCH3); 1.84 (m, 4H, CH2); MS (ESI) 370 [M + H]+. Anal. calcd. for C21H23NO5: C, 68.28; H, 6.28; N, 3.79. Found: C, 68.25; H, 6.29; N, 3.78.
(E)-3-(2,3,4,5-tetrahydrobenzo[b][1,4]dioxocin-8-yl)-N-(3,4,5-trimethoxyphenyl)acrylamide (D6). Yellow solid, yield 30%, m.p.: 145–146 °C, 1H-NMR (DMSO-d6, δ ppm): 9.82 (s, 1H, NH); 8.1 (d, J = 15.1 Hz, 2H, CH, ArH); 7.8 (d, J = 15.1 Hz, 1H, CH); 7.53 (m, 2H, ArH); 7.10 (d, J = 4.9 Hz, 1H, ArH); 6.48 (d, J = 9.5 Hz, 1H, ArH) 4.22–4.23 (m, 4H, CH2); 4.16 (m, 9H, OCH3); 1.92 (m, 4H, CH2); MS (ESI) 400 [M + H]+. Anal. calcd. for C22H25NO6: C, 66.15; H, 6.31; N, 3.51. Found: C, 66.08; H, 6.28; N, 3.49.
(E)-N-(3-methoxyphenyl)-3-(2,3,4,5-tetrahydrobenzo[b][1,4]dioxocin-8-yl)acrylamide (D7). Yellow amorphous solid, yield 31%, m.p.: 104–105 °C, 1H-NMR (DMSO-d6, δ ppm): 9.93 (s, 1H, NH); 7.45 (d, J = 15.7 Hz, 1H, CH); 7.3 (m, 4H, ArH); 7.24 (d, J = 7.8 Hz, 2H, ArH); 7.0 (d, J = 7.68 Hz, 1H, ArH); 6.65 (d, J = 15.9 Hz,1H, CH); 4.24–4.35 (m, 4H, CH2); 3.65 (s, 3H, OCH3); 1.84 (m, 4H, CH2); MS (ESI) 340 [M + H]+. Anal. calcd. for C20H21NO4: C, 70.78; H, 6.24; N, 4.13. Found: C, 70.80; H, 6.27; N, 4.16.
(E)-N-(4-methoxyphenyl)-3-(2,3,4,5-tetrahydrobenzo[b][1,4]dioxocin-8-yl)acrylamide (D8). Yellow solid, yield 30%, m.p.: 112–113 °C, 1H-NMR (DMSO-d6, δ ppm): 9.96 (s, 1H, NH); 7.60 (d, J = 9.0 Hz, 2H, ArH); 7.44 (d, J = 15.0 Hz, 1H, CH); 7.23 (d, J = 6.0 Hz, 2H, ArH); 6.99 (d, J = 9.0 Hz, 1H, ArH); 6.90 (d, J = 6.0 Hz, 2H, ArH); 6.65 (d, J = 15.0 Hz, 1H, CH); 4.31–4.25 (m, 4H, CH2); 3.73 (s, 3H, OCH3); 1.80–1.85 (m, 4H, CH2); MS (ESI) 340 [M + H]+. Anal. calcd. for C20H21NO4: C, 70.78; H, 6.24; N, 4.13. Found: C, 70.75; H, 6.25; N, 4.17.
(E)-N-(4-ethoxyphenyl)-3-(2,3,4,5-tetrahydrobenzo[b][1,4]dioxocin-8-yl)acrylamide (D9). Yellow solid, yield 30%, m.p. :137–139 °C, 1H-NMR (DMSO-d6, δ ppm): 9.93 (s, 1H, NH); 7.58 (d, J = 5.3 Hz, 2H, ArH); 7.44 (d, J = 9.4 Hz, 1H, CH); 7.22 (d, J = 5.8 Hz, 2H ArH); 6.99 (d, J = 4.9 Hz, 1H, ArH); 6.89 (d, J = 5.3 Hz, 2H, ArH); 6.66 (d, J = 9.33 Hz, 1H, CH); 3.9–4.1 (m, 4H, CH2); 3.46 (m, 2H, CH2); 1.85 (m, 4H, CH2); 1.32 (m, 3H, CH3); MS (ESI) 354 [M + H]+. Anal. calcd. for C21H23NO4: C, 71.37; H, 6.56; N, 3.96. Found: C, 71.35; H, 6.52; N, 3.97.
(E)-N-(3-chlorophenyl)-3-(2,3,4,5-tetrahydrobenzo[b][1,4]dioxocin-8-yl)acrylamide (D10). Yellow amorphous solid, yield 34%, m.p.: 109–110 °C, 1H-NMR (DMSO-d6, δ ppm): 10.28 (s, 1H, NH); 7.92 (s, 1H, ArH); 7.50 (d, J = 2.7 Hz, 1H, ArH); 7.48 (d, J = 4.5 Hz, 1H, ArH); 7.35 (d, J = 14.7 Hz, 1H, CH); 7.24 (m, 2H, ArH); 7.11 (d, J = 4.7 Hz, 1H, ArH); 6.99 (d, J = 4.7 Hz, 1H, ArH); 6.64 (d, J = 15.0 Hz, 1H, CH); 4.23–4.37 (m, 4H); 1.84–1.95 (m, 4H); MS (ESI) 344 [M + H]+. Anal. calcd. for C19H18ClNO3: C, 66.38; H, 5.28; N, 4.07. Found: C, 66.35; H, 5.30; N, 4.07.
(E)-N-(2-chlorophenyl)-3-(2,3,4,5-tetrahydrobenzo[b][1,4]dioxocin-8-yl)acrylamide (D11). Yellow solid, yield 30%, m.p.: 127–128 °C, 1H-NMR (DMSO-d6, δ ppm): 10.26 (s, 1H, NH); 7.98 (d, J = 4.9 Hz, 1H, ArH); 7.70 (d, J = 4.9 Hz, 1H, ArH); 7.54 (m, 1H, ArH); 7.49 (d, J = 9.48 Hz, 1H, CH); 7.42 (m, 1H, ArH); 7.28 (m, 2H, ArH); 6.95 (d, J = 4.7 Hz, 1H, CH); 6.38 (d, J = 9.72 Hz, 1H, CH); 4.5–4.7 (m, 4H, CH2); 1.8–1.9 (m, 4H, CH2); MS (ESI) 345 [M + H]+. Anal. calcd. for C19H18ClNO3: C, 66.38; H, 5.28; N, 4.07. Found: C, 66.41; H, 5.26; N, 4.12.
(E)-3-(2,3,4,5-tetrahydrobenzo[b][1,4]dioxocin-8-yl)-N-m-tolylacrylamide (D12). Yellow amorphous solid, yield 31%,m.p:112–113 °C, 1H-NMR (300 MHz, DMSO-d6, δ ppm): 10.0 (s, 1H, NH); 7.47 (m, 3H, CH, ArH); 7.21 (m, 3H, ArH); 6.99 (m, 1H, ArH); 6.87 (m, 1H, ArH); 6.64 (d, J = 15.66 Hz, 1H, CH); 4.21–4.36 (m, 4H, CH2); 2.27 (s, 3H, CH3); 1.82–1.84 (m, 4H, CH2); MS (ESI) 324 [M + H]+. Anal. calcd. for C20H21NO3: C, 74.28; H, 6.55; N, 4.33. Found: C, 74.30; H, 6.56; N, 4.22.
(E)-N-(5-chloro-2-methylphenyl)-3-(2,3,4,5-tetrahydrobenzo[b][1,4]dioxocin-8-yl)acrylamide (D13). Yellow solid, yield 31%, m.p.: 107–108 °C, 1H-NMR (DMSO-d6, δ ppm): 9.55 (s, 1H, NH); 7.84 (d, J = 2.1 Hz, 1H, ArH); 7.50 (d, J = 15.5 Hz, 1H, CH); 7.24–7.23 (m, 4H, ArH); 7.12 (m, 1H, ArH); 6.65 (d, J = 15.7 Hz, 1H, CH); 4.18–4.32 (m, 4H, CH2); 2.24 (s, 3H, CH3); 1.82–1.86 (m, 4H, CH2); MS (ESI) 358 [M + H]+. Anal. calcd. for C20H20ClNO3: C, 67.13; H, 5.63; N, 3.91. Found: C, 67.18; H, 5.59; N, 3.87.
(E)-N-(4-bromo-2-fluorophenyl)-3-(2,3,4,5-tetrahydrobenzo[b][1,4]dioxocin-8-yl)acrylamide (D14). Yellow solid, yield 0.32%, m.p.: 110–111 °C, 1H-NMR (DMSO-d6, δ ppm): 9.96 (s, 1H, NH); 7.75 (m, 3H, ArH, CH); 7.53 (m, 2H, ArH); 7.45 (m, 1H, ArH); 7.02 (m, 1H, ArH); 6.37 (d, J = 15.9 Hz, 1H, CH); 4.31–4.39 (m, 4H, CH2); 1.86–1.92 (m, 4H, CH2); MS (ESI) 407 [M + H]+. Anal. calcd. for C19H17BrFNO3: C, 56.17; H, 4.22; N, 3.45. Found: C, 56.21; H, 4.20; N, 3.42.
(E)-N-(2-fluorobenzyl)-3-(2,3,4,5-tetrahydrobenzo[b][1,4]dioxocin-8-yl)acrylamide (D15). Yellow solid, yield 30%, m.p.: 86–87 °C, 1H-NMR (DMSO-d6, δ ppm): 8.51 (s, 1H, NH); 7.40–7.46 (m, 1H, ArH); 7.20–7.30 (m, 4H, ArH, CH); 6.97 (d, J = 8.7 Hz, 2H, ArH); 6.85 (d, J = 8.2 Hz, 1H, ArH); 6.60 (d, J = 15.1 Hz, 1H, CH); 4.47 (m, 2H, CH2); 4.17–4.43 (m, 4H, CH2); 1.79–1.82 (m, 4H, CH2); MS (ESI) 342 [M + H]+. Anal. calcd. for C20H22FNO3: C, 70.37; H, 5.91; N, 4.10. Found: C, 70.40; H, 5.87; N, 4.11.
(E)-N-(4-bromophenyl)-3-(2,3,4,5-tetrahydrobenzo[b][1,4]dioxocin-8-yl)acrylamide (D16). Yellow amorphous solid, yield 33%, m.p.: 107–108 °C, 1H-NMR (DMSO-d6, δ ppm): 10.2 (s, 1H, NH); 7.66 (d, J = 9.0 Hz, 2H, ArH); 7.53 (m, 3H, ArH, CH); 7.24 (d, J = 6.0 Hz, 2H, ArH); 6.99 (d, J = 9.0 Hz, 1H, ArH); 6.66 (d, J = 15.0 Hz, 1H, CH); 4.32–4.37 (m, 4H, CH2); 1.82–1.85 (m, 4H, CH2); MS (ESI) 389 [M + H]+. Anal. calcd. for C19H18BrNO3: C, 58.78; H, 4.67; N, 3.61. Found: C, 58.72; H, 4.69; N, 3.68.
(E)-N-(3-fluorophenyl)-3-(2,3,4,5-tetrahydrobenzo[b][1,4]dioxocin-8-yl)acrylamide (D17). Yellow solid, yield 30%, m.p.: 116–117 °C, 1H-NMR (DMSO-d6, δ ppm): 10.2 (s, 1H, NH); 7.72 (d, J = 7.1 Hz, 1H, ArH); 7.49 (d, J = 9.3 Hz, 1H, CH); 7.34–7.36 (m, 2H, ArH); 7.23–7.26 (m, 2H, ArH); 7.0 (d, J = 4.7 Hz, 1H, ArH); 6.95 (m, 1H, ArH); 6.66 (d, J = 9.33 Hz, 1H, CH); 4.23–4.37 (m, 4H, CH2); 1.79–1.86 (m, 4H, CH2); MS (ESI) 328 [M + H]+. Anal. calcd. for C19H18FNO3: C, 69.71; H, 5.54; N, 4.28. Found: C, 69.67; H, 5.56; N, 4.24.
3.2. Cell Proliferation Assay
CCK8 is much more convenient and helpful than MTT for analyzing cell proliferation, because it can be reduced to soluble formazan by dehydrogenase in mitochondria and has little toxicity to cells. Cell proliferation was determined using CCK8 dye (Beyotime Inst. Biotech., Nanjing, China) according to the manufacturer's instructions. Briefly, 1–5 × 10³ cells per well were seeded on a 96-well plate, and grown at 37 °C for 12 h. Subsequently, cells were treated with all synthesized compounds at increasing concentrations in the presence of 10% FBS for 24 h. After addition of 10 μL CCK8 dyeto each well, cells were incubated at 37 °C for 2 h and plates were read on a Victor-V multilabel counter (Perkin-Elmer, Männedorf, Switzerland) using the default europium detection protocol. Percent inhibition or IC50 values of compounds were calculated by comparison with DMSO-treated control wells. The results are shown in Table 2.
3.3. Apotosis Assay
Approximately 105 cells/well were plated in a 24 well plate and allowed to adhere. After 24 h, the medium was replaced with fresh culture medium containing compounds D9 at final concentrations of 4, 6, 8 μM. Nontreated wells received an equivalent volume of ethanol (<0.1%). They were trypsinized, washed in PBS and centrifuged at 2,000 rpm for 5 min. The pellet was then resuspended in 500 μL of staining solution (containing 5 μL AnnexinV-FITC and 5 μL PI in Binding Buffer), mixed gently and incubated for 15 min at room temperature (15–25 °C) in dark. The sample were then read in FACScalibur flow cytometer (BD Company, New Jersey, USA) at 488 nm excitation.
3.4. General Procedure for Preparation, Purification EGFR, and Inhibitory Assay
A 1.6 kb cDNA encoded for the EGFR cytoplasmic domain (EGFR-CD, amino acids 645–1186) were cloned into baculoviral expression vectors pBlueBacHis2B and pFASTBacHTc, separately. A sequence that encodes (His)6 was located at the 5' upstream to the EGFR sequences. Sf-9 cells were infected for 3 days for protein expression. Sf-9 cell pellets were solubilized at 0 °C in a buffer at pH 7.4 containing 50 mM HEPES, 10 mM NaCl, 1% Triton, 10 μM ammonium molybdate, 100 μM sodium vanadate, 10 μg/mL aprotinin, 10 μg/mL leupeptin, 10 μg/mL pepstatin, and 16 μg/mL benzamidine HCl for 20 min followed by 20 min centrifugation. Crude extract supernatant was passed through an equilibrated Ni-NTA superflow packed column and washed with 10 mM and then 100 mM imidazole to remove nonspecifically bound material. Histidine tagged proteins were eluted with 250 and 500 mM imidazole and dialyzed against 50 mM NaCl, 20 mM HEPES, 10% glycerol, and 1 μg/mL each of aprotinin, leupeptin, and pepstatin for 2 h. The entire purification procedure was performed at 4 °C or on ice.
EGFR kinase assays was set up to assess the level of autophosphorylation based on DELFIA/Time Resolved Fluorometry. Compounds (D1, D7-D12, D15-D16) were dissolved in 100% DMSO and diluted to the appropriate concentrations with 25 mM HEPES at pH 7.4. In each well, 10 μL compound was incubated with 10 μL (5 ng for EGFR) recombinant enzyme (1:80 dilution in 100 mM HEPES) for 10 min at room temperature. Then, 10 μL of 5× buffer (containing 20 mM HEPES, 2 mM MnCl2, 100 μM Na3VO4, and 1 mM DTT) and 20 μL of 0.1 mM ATP-50 mM MgCl2 were added for 1 h. Positive and negative controls were included in each plate by incubation of enzyme with or without ATP-MgCl2.
At the end of incubation, liquid was aspirated, and plates were washed three times with wash buffer. A 75 μL (400 ng) sample of europium labeled anti-phosphotyrosine antibody was added to each well for another 1 h of incubation. After washing, enhancement solution was added and the signal was detected by Victor (Wallac Inc., Männedorf, Switzerland) with excitation at 340 nm and emission at 615 nm. The percentage of autophosphorylation inhibition by the compounds was calculated using the following equation:
100% − [(negative control)/(positive control-negative control)]
The IC50 was obtained from curves of percentage inhibition with eight concentrations of compound. As the contaminants in the enzyme preparation are fairly low, the majority of the signal detected by the anti-phosphotyrosine antibody is from EGFR.
3.5. Cell Migration Assay
A cell migration assay was conducted as described previously (Qian et al. [23]), with a slight modification. In brief, the cells were serum-starved overnight, and the transwells were coated with enhanced chemiluminescence (ECL) cell attachment matrix (Upstate Biotechnology, Lake Placid, NY, USA) at 20 μg/mL. The top chambers of transwells were loaded with 0.2 mL of cells (4 × 10⁵ cells/mL) in serum-free media, and the bottom chambers were loaded with 0.6 mL of MEM media containing 0.5% FBS. The cells were incubated in the transwells at 37 °C in 5% CO2 for 24 h. A microplate reader was used to measure the optical density of the eluted solutions in order to determine their migration values. Mean values were obtained from three individual experiments.
3.6. Crystal Structure Determination
Crystal structure determination of compound D9 was carried out on a Nonius CAD4 diffractometer equipped with graphite-monochromated Mo-Kα (0.7103 Å) radiation. The structure was solved by direct methods and refined on F2 by full-matrix least squares methods using SHELX-97 [24]. All the hydrogen atoms were placed in calculated position and were assigned fixed isotropic thermal parameters at 1.2 times the equivalent isotropic U of the atoms to which they are attached and allowed to ride on their respective parent atoms. The contributions of these hydrogen atoms were included in the structure-factors calculations. The crystal data, data collection, and refinement parameter for the compound D9 are listed in Table 1.
CCDC-1005565 contains the supplementary crystallographic data for this paper. These data can be obtained free of charge at www.ccdc.cam.ac.uk/conts/retrieving.html (or from the Cambridge Crystallographic Data Centre (CCDC), 12 Union Road, Cambridge CB2 1EZ, UK; Fax: +44(0)1222-336033; E-Mail: deposit@ccdc.cam.ac.uk).
3.7. Molecular Docking Study
Molecular docking of compound D9 into the three dimensional X-ray structure of EGFR (PDB code: 2J6M) was carried out using the Discovery Studio (version 3.5) as implemented through the graphical user interface DS- CDOCKER protocol.
The three-dimensional structures of the aforementioned compounds were constructed using Chem 3D ultra 12.0 software (Cambridge Soft Corporation, Massachusetts, USA), then they were energetically minimized by using MMFF94 with 5000 iterations and minimum RMS gradient of 0.10. The crystal structures of EGFR (PDB code: 2J6M) complex were retrieved from the RCSB Protein Data Bank. All bound waters and ligands were eliminated from the protein and the polar hydrogen was added to the proteins.
4. Conclusions
A series of caffeic acid amides D1-D17 bearing 2,3,4,5-tetrahydrobenzo[b] [1,4] dioxocin moieties has been synthesized and their biological activities were also evaluated for potential antiproliferative and EGFR inhibitory activity. Among them, the structure of compound D9 was determined by X-ray crystallography. SAR analysis showed that the anti-proliferative activity was affected by 2,3,4,5-tetrahydrobenzo[b][1,4] dioxocine structure and p-position substituents (-OCH2CH3 > -OCH3 > -Br > -NO2) of the benzene ring. Compound D9 displayed the most potent inhibitory activity (IC50 = 0.79 μM for HepG2 and IC50 = 0.36 μM for EGFR). Docking simulation of compound D9 into the EGFR active site showed that naphthalene ring of D9 with MET 793 formed two H-bonds which enhanced antitumor potency. Therefore, compound D9 may be developed as a potential antitumor agent.
Supplementary Materials
Supplementary materials can be accessed at: http://www.mdpi.com/1420-3049/19/6/7269/s1.
Acknowledgments
This work was supported by Natural Science Foundation of Jiangsu Province (No. BK20130554) and supported by Major Projects on Control and Rectification of Water Body Pollution (No. 2011ZX07204-001-2214 004).
Author Contributions
JiWen Yuan and HaiLiang Zhu designed research; HanYue Qiu,PengFei Wang, YongAn Yang, Fei Zhang, Yong Yin, Jie Lin, Zhong-Chang Wang performed research and analyzed the data; JiWen Yuan and Jigar A. Makawana wrote the paper. All authors read and approved the final manuscript.
Conflicts of Interest
The authors declare no conflict of interest
References
- Siegel, R.; Naishadham, D.; Jemal, A. Cancer statistics, 2013. CA: Cancer J. Clin. 2013, 63, 11–30. [Google Scholar] [CrossRef]
- Kobayashi, S.; Boggon, T.J.; Dayaram, T.; Jänne, P.A.; Kocher, O.; Meyerson, M.; Johnson, B.E.; Eck, M.J.; Tenen, D.G.; Halmos, B. EGFR mutation and resistance of non-small-cell lung cancer to gefitinib. N. Engl. J. Med. 2005, 352, 786–792. [Google Scholar] [CrossRef]
- Paez, J.G.; Jänne, P.A.; Lee, J.C.; Tracy, S.; Greulich, H.; Gabriel, S.; Herman, P.; Kaye, F.J.; Lindeman, N.; Boggon, T.J. EGFR mutations in lung cancer: Correlation with clinical response to gefitinib therapy. Science 2004, 304, 1497–1500. [Google Scholar] [CrossRef]
- Harari, P.M.; Huang, S. Head and neck cancer as a clinical model for molecular targeting of therapy: Combining EGFR blockade with radiation. Intern. J. Rad. Oncol. Biol. Phys. 2001, 49, 427–433. [Google Scholar] [CrossRef]
- Song, J.I.; Grandis, J.R. STAT signaling in head and neck cancer. Oncogene 2000, 19, 2489–2495. [Google Scholar] [CrossRef]
- Leek, R.D.; Hunt, N.C.; Landers, R.J.; Lewis, C.E.; Royds, J.A.; Harris, A.L. Macrophage infiltration is associated with VEGF and EGFR expression in breast cancer. J. Pathol. 2000, 190, 430–436. [Google Scholar] [CrossRef]
- Richard, J.; Sainsbury, C.; Needham, G.; Farndon, J.; Malcolm, A.; Harris, A. Epidermal-growth-factor receptor status as predictor of early recurrence of and death from breast cancer. Lancet 1987, 329, 1398–1402. [Google Scholar] [CrossRef]
- Sanz Ortega, J.; Steinberg, S.M.; Moro, E.; Saez, M.; Lopez, J.A.; Sierra, E.; Sanz Esponera, J.; Merino, M.J. Comparative study of tumor angiogenesis and immunohistochemistry for p53, c-ErbB2, c-myc and EGFr as prognostic factors in gastric cancer. Histol. Histopathol. 2000, 15, 455–462. [Google Scholar]
- Ferrandina, G.; Ranelletti, F.O.; Lauriola, L.; Fanfani, F.; Legge, F.; Mottolese, M.; Nicotra, M.R.; Natali, P.G.; Zakut, V.H.; Scambia, G. Cyclooxygenase-2 (COX-2), epidermal growth factor receptor (EGFR), and Her-2/neu expression in ovarian cancer. Gynecol. Oncol. 2002, 85, 305–310. [Google Scholar] [CrossRef]
- Yarden, Y. The EGFR family and its ligands in human cancer: Signalling mechanisms and therapeutic opportunities. Eur. J. Cancer 2001, 37, 3–8. [Google Scholar] [CrossRef]
- Nicholson, R.I.; Gee, J.; Harper, M.E. EGFR and cancer prognosis. Eur. J. Cancer 2001, 37, 9–15. [Google Scholar] [CrossRef]
- Cohen, R.B. Epidermal growth factor receptor as a therapeutic target in colorectal cancer. Clin. Color. Cancer 2003, 2, 246–251. [Google Scholar] [CrossRef]
- Ravn, H.; Brimer, L. Structure and antibacterial activity of plantamajoside, a caffeic acid sugar ester from Plantago major subs major. Phytochemistry 1988, 27, 3433–3437. [Google Scholar] [CrossRef]
- Shin, K.; Kim, I.; Park, Y.; Ha, J.; Choi, J.; Park, H.; Lee, Y.S.; Lee, K. Anti-inflammatory effect of caffeic acid methyl ester and its mode of action through the inhibition of prostaglandin E2, nitric oxide and tumor necrosis factor-α production. Biochem. Pharmacol. 2004, 68, 2327–2336. [Google Scholar] [CrossRef]
- Chen, J.H.; Ho, C. Antioxidant activities of caffeic acid and its related hydroxycinnamic acid compounds. J. Agric. Food Chem. 1997, 45, 2374–2378. [Google Scholar] [CrossRef]
- Yamada, J.; Tomita, Y. Antimutagenic activity of caffeic acid and related compounds. Biosci. Biotechnol. Biochem. 1996, 60, 328–329. [Google Scholar] [CrossRef]
- Kashiwada, Y.; Nishizawa, M.; Yamagishi, T.; Tanaka, T.; Nonaka, G.; Cosentino, L.M.; Snider, J.V.; Lee, K. Anti-AIDS agents, 18. Sodium and potassium salts of caffeic acid tetramers from Arnebia euchroma as anti-HIV agents. J. Nat. Prod. 1995, 58, 392–400. [Google Scholar] [CrossRef]
- Chen, J.; Shao, Y.; Huang, M.; Chin, C.; Ho, C. Inhibitory effect of caffeic acid phenethyl ester on human leukemia HL-60 cells. Cancer Lett. 1996, 108, 211–214. [Google Scholar] [CrossRef]
- Liao, H.; Chen, Y.; Liu, J.; Hsu, M.; Shieh, H.; Liao, H.; Shieh, C.; Shiao, M.; Chen, Y. Inhibitory effect of caffeic acid phenethyl ester on angiogenesis, tumor invasion, and metastasis. J. Agric. Food Chem. 2003, 51, 7907–7912. [Google Scholar] [CrossRef]
- Lv, P.; Li, H.; Xue, J.; Shi, L.; Zhu, H. Synthesis and biological evaluation of novel luteolin derivatives as antibacterial agents. Eur. J. Med. Chem. 2009, 44, 908–914. [Google Scholar] [CrossRef]
- Sun, J.; Yang, Y.; Li, W.; Zhang, Y.; Wang, X.; Tang, J.; Zhu, H. Synthesis, biological evaluation and molecular docking studies of 1,3,4-thiadiazole derivatives containing 1,4-benzodioxan as potential antitumor agents. Bioorg. Med. Chem. Lett. 2011, 21, 6116–6121. [Google Scholar] [CrossRef]
- Yun, C.; Boggon, T.J.; Li, Y.; Woo, M.S.; Greulich, H.; Meyerson, M.; Eck, M.J. Structures of lung cancer-derived EGFR mutants and inhibitor complexes: Mechanism of activation and insights into differential inhibitor sensitivity. Cancer Cell. 2007, 11, 217–227. [Google Scholar] [CrossRef]
- Qian, Y.; Corum, L.; Meng, Q.; Blenis, J.; Zheng, J.Z.; Shi, X.; Flynn, D.C.; Jiang, B. PI3K induced actin filament remodeling through Akt and p70S6K1: implication of essential role in cell migration. Am. J. Physiol.-Cell. Ph. 2004, 286, C153–C163. [Google Scholar]
- Qiu, X.; Janson, C.A.; Smith, W.W.; Head, M.; Lonsdale, J.; Konstantinidis, A.K. Refined structures of β-ketoacyl-acyl carrier protein synthase III. J. Mol. Biol. 2001, 307, 341–356. [Google Scholar] [CrossRef]
- Sample Availability: Samples of the seventeen compounds are available from the authors.
© 2014 by the authors. licensee MDPI, Basel, Switzerland. This article is an open access article distributed under the terms and conditions of the Creative Commons Attribution license ( http://creativecommons.org/licenses/by/3.0/).