Abstract
Background: Black kidney transplant recipients have worse allograft outcomes compared to White recipients. The feature importance and feature interaction network analysis framework of machine learning random forest (RF) analysis may provide an understanding of RF structures to design strategies to prevent acute rejection among Black recipients. Methods: We conducted tree-based RF feature importance of Black kidney transplant recipients in United States from 2015 to 2019 in the UNOS database using the number of nodes, accuracy decrease, gini decrease, times_a_root, p value, and mean minimal depth. Feature interaction analysis was also performed to evaluate the most frequent occurrences in the RF classification run between correlated and uncorrelated pairs. Results: A total of 22,687 Black kidney transplant recipients were eligible for analysis. Of these, 1330 (6%) had acute rejection within 1 year after kidney transplant. Important variables in the RF models for acute rejection among Black kidney transplant recipients included recipient age, ESKD etiology, PRA, cold ischemia time, donor age, HLA DR mismatch, BMI, serum albumin, degree of HLA mismatch, education level, and dialysis duration. The three most frequent interactions consisted of two numerical variables, including recipient age:donor age, recipient age:serum albumin, and recipient age:BMI, respectively. Conclusions: The application of tree-based RF feature importance and feature interaction network analysis framework identified recipient age, ESKD etiology, PRA, cold ischemia time, donor age, HLA DR mismatch, BMI, serum albumin, degree of HLA mismatch, education level, and dialysis duration as important variables in the RF models for acute rejection among Black kidney transplant recipients in the United States.
1. Introduction
Black kidney transplant recipients have worse allograft outcomes compared to White recipients [,,,,,,]. Previously identified factors possibly responsible for these disparities have include lower living donor rates [], longer dialysis vintage [], longer cold ischemia times [], delays in listing and time on transplant waiting list [,], greater rates of marginal donor kidneys [,,], higher rates of delayed graft function (DGF) [], less favorable human leucocyte antigen (HLA) matching [,,,], variability in the pharmacokinetics of immunosuppressive drugs and immunologic responsiveness [,], and more comorbidities, such as hypertension [] and diabetes mellitus []. Such discrepancies have been thought to contribute to a higher rate of acute rejection in Black recipients, resulting in increased allograft loss [,,,,]. Despite advancements in modern-era immunosuppressive agents, the beneficial effects of immunosuppression specific to acute rejection remain less apparent in Black recipients compared to White recipients [,,,]. Furthermore, acute rejection in Black kidney transplant recipients is more likely to be steroid-resistant [].
Recent investigations have demonstrated that machine learning approaches are superior to traditional statistical methods in various clinical scenarios [,]. Random forest (RF) is a widely used machine learning approach that effectively predicts outcomes [] by utilizing a combination of tree predictors []. The RF algorithm randomly generates bootstrapped datasets that can be used to train an ensemble of decision trees, which determine an outcome by a majority “vote” []. As a type of robust nonparametric model, RF can simulate complex relationships and does not depend on the data distribution as is the case in logistic regression []. Whereas most traditional statistical approaches, such as linear regression and logistic regression, indicate which variables are significant with measures such as p-value and t-statistics, variable importance by RF is determined by how much each variable decreases the node impurity (gini decrease), number of nodes, accuracy, mean minimal depth, and times_a_root (total number of trees in which Xj is used for splitting the root node) [,]. Recently, RF has increasingly been applied to medicine, including solid organ transplantation [,,], and there is great potential to use the RF approach to improve outcomes among Black kidney transplant recipients. Furthermore, the feature interaction network analysis framework of RF may also provide an understanding of the interaction among multiple features in order to design strategies to prevent acute rejection and explore the mechanisms of variable interactions influencing acute rejection among Black kidney transplant recipients [].
In this study of the UNOS/OPTN database from 2015 through 2019, we aimed to assess the risk factors and feature importance of acute rejection among Black kidney transplant recipients by utilizing RF vs. traditional multivariable logistic regression analysis.
2. Materials and Methods
2.1. Data Source and Study Population
The Organ Procurement and Transplantation Network (OPTN)/United Network for Organ Sharing database (UNOS) database was used for analysis of this study. The OPTN/UNOS database contains patient-level data of all transplant events in the United States. All adult (age ≥18 years) end-stage kidney disease patients who received kidney-only kidney transplants from 2015 to 2019 were screened. Only Black patients were included in this study. If patients had multiple kidney transplants during the study period, the first kidney transplant was selected for analysis. This study was approved by the Mayo Clinic Institutional Review Board (#21-007698) and the UNOS/OPTN data is publicly available and de-identified.
2.2. Data Collection
Comprehensive recipient-, donor-, and transplant-related variables in the OPTN/UNOS database were extracted. All the extracted variables had less than 10% of missing data. Missing data was imputed through multivariable imputation by the chained equation (MICE) method [].
The primary outcome was acute rejection reported by transplant centers to the OPTN/UNOS within 1 year after kidney transplant. The UPTN/UNOS database did not specify the date of acute rejection occurrence.
2.3. Machine Learning Variable Importance Analysis
Variable importance was performed using the “randomForest” package and interpreted and visualized by the “randomForestExplainer” [] packages in R 4.0.2. Random forests are ensemble classifiers that aggregate the results of many individual decision trees. We used the ‘randomForest’ R package [] with two hyperparameters: the number of training trees (nTree) and the number of predictors to consider at each split point (mTry). The default settings of nTree = 500 and mTry as the square root of the number of predictor variables were used in this study. To avoid the bias of analysis of variable importance, various indicators (number of nodes, accuracy decrease, Gini decrease, times_a_root (total number of trees in which Xj is used for splitting the root node), p value, and mean minimal depth) were selected to represent different perspectives and to comprehensively evaluate the importance of features [,]. The Gini impurity measures the frequency at which any element of the dataset will be mislabeled when it is randomly labeled. The minimum value of the Gini Index is 0. This happens when the node is pure, indicating that all the contained elements in the node are of one unique class. “Gini_decrease” indicates the decrease in the Gini impurity index, and “accuracy_decrease” refers to the mean decrease of prediction accuracy after the corresponding predictor was permuted [].
The importance of each variable can be expressed using other metrics, such as mean minimal depth, times_a_root, accuracy decrease, and Gini decrease.
2.4. Statistical Analysis
Continuous variables were presented as mean ± standard deviation (SD) for normally distributed data, or median with interquartile range (IQR) for non-normally distributed data. Categorical variables were presented as number with percentage. The difference in clinical characteristics between patients with and without rejection were tested using the student’s t-test or Wilcoxon’s rank sum test as appropriate for continuous variables, and Chi-squared test for categorical variables. For traditional analysis to identify independent predictors for rejection, backward stepwise multivariable logistic regression with inclusion of variables whose p-value in univariable analysis <0.05 was performed.
All analyses were performed using R, version 4.0.3 (RStudio, Inc., Boston, MA, USA; http://www.rstudio.com/ (accessed on 15 January 2021)). We used the “randomForest” and “randomForestExplainer” packages in R 4.0.2. for machine learning analysis [], and the MICE command in R for multivariable imputation by chained equation [].
3. Results
A total of 22,687 black kidney transplant recipients were eligible for analysis. Of these, 1330 (6%) had acute rejection within 1 year after kidney transplant. Table 1 compared the recipient-, donor-, and transplant-related characteristics between patients with and without rejection. Patients with rejection were younger, more likely to have a glomerular kidney disease etiology, have longer dialysis duration, and be HIV-seropositive. They were less likely to be diabetic or receive a living donor kidney transplant and more likely to have delayed graft function. They were also more likely to be kidney retransplants, have a higher PRA, have a higher total number of HLA mismatches, and carry public insurance. With regard to immunosuppression, patients with rejection were less likely to receive depleting induction (e.g., thymoglobulin, alemtuzumab) and were more likely to receive basiliximab. They were also more likely to be on cyclosporine, mycophenolate, azathioprine, and mTOR inhibitors for maintenance immunosuppression.

Table 1.
Clinical characteristics between kidney transplant recipients with and without rejection.
3.1. Traditional Analysis
The multi-collinearity of continuous variables was assessed by a correlation matrix, which demonstrated no significant multi-collinearity (Figure 1).
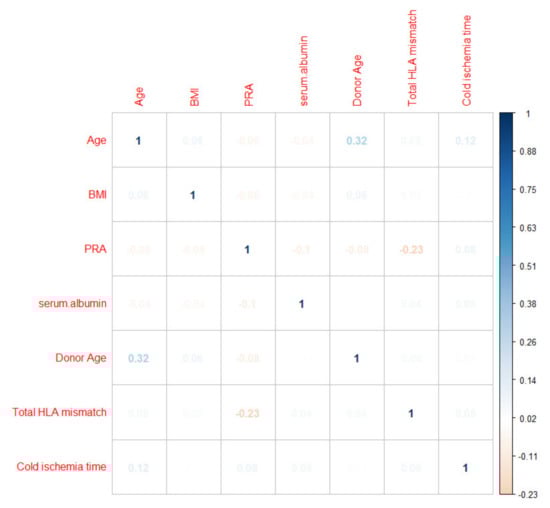
Figure 1.
Correlation matrix assessing the pair-wise correlation between the continuous variables.
Using traditional analysis with backward stepwise multivariable logistic regression (Table 2), the independent predictors for increased acute rejection risk included kidney retransplantion, dialysis duration ≥1 years, a PRA of 81–100, HIV infection, ECD deceased donor utilization, a higher total number of HLA mismatches, delayed graft function, basiliximab induction, and the use of cyclosporine, azathioprine, and mTOR inhibitors for maintenance immunosuppression. In contrast, the independent predictors for decreased rejection risk included older recipient age and the use of thymoglobulin and alemtuzumab for induction.
Table 2.
Univariable and multivariable logistic regression analysis for acute rejection.
3.2. Machine Learning Variable Importance
3.2.1. Distribution of Minimal Depth
Figure 2 demonstrates variables based on the minimum depth locations between the tree and the number of trees. The minimal depth for a variable in a tree is equal to the depth of the node which splits on that variable and is the closest to the root of the tree. If it is low, then a number of observations are divided into groups on the basis of this variable. From the top 10 variables with the smallest mean value of minimal depth plotted in Figure 2, recipient age, cold ischemia time, BMI, PRA, and serum albumin are the top 5 variables used to split trees at the root. The RF model built 500 trees with no limit to the maximum number of terminal nodes in a tree. It is evident that trees were split until a depth of 11.
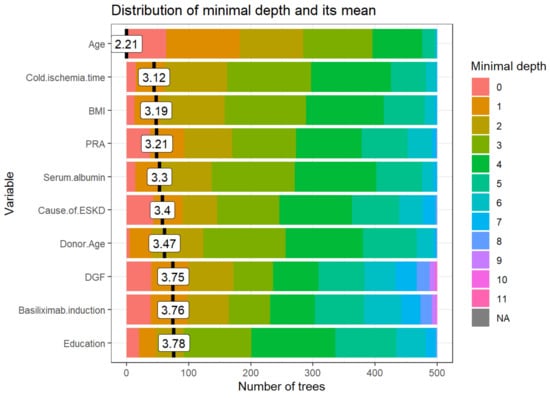
Figure 2.
The distribution of the minimal depth among the trees of the forest for the important variables is presented in distinctive colors for the individual level of minimal depth. The mean of the distribution is demonstrated by a vertical black bar with a value label on it, and the scale of the X-axis ranges from 0 to the maximum number of trees in which any variable was utilized for splitting. Abbreviations: BMI- Body mass index; DGF—Delayed graft function; ESKD—End-stage kidney disease; HLA—Human leukocyte antigen; PRA—Panel reactive antibody.
3.2.2. Importance Measures
Table 3 demonstrates the measures of importance (mean minimal depth, number of nodes, accuracy decrease, gini decrease, number of trees, times_a_root, and p value) for all variables in the forest. The following variables are the top five variables based on different important measures:
Table 3.
Measures of importance for all variables in the forest (The order of these listed variables based on mean decrease in Gini).
- Mean minimal depth: recipient age, cold ischemia time, BMI, PRA, and serum albumin are the top five variables used to split trees at the root.
- Number of nodes: cold ischemia time, BMI, donor age, recipient age, and serum albumin.
- Decrease in accuracy: cold ischemia time, age, donor age, KDPI group, and number of transplants.
- Decrease in Gini: BMI, cold ischemia time, recipient age, donor age, and serum albumin.
- Number of trees: BMI, cold ischemia time, recipient age, donor age, and serum albumin.
- Times_a_root: recipient age, retransplant, cause of ESKD, DGF, and basiliximab induction.
3.2.3. Multi-way Importance Plot
The multi-way importance plot reveals the relation between the 3 measures of importance and labels 10 variables that scored best when it comes to these 3 measures.
The first multi-way importance plot (Figure 3) centers on three important measures acquired from the structure of trees in the forest, including (1) mean depth of the first split on the variable, (2) number of trees in which the root is split on the variable, and (3) the total number of nodes in the forest that split on that variable. These top 10 relative variables of importance in the RF models for acute rejection are based on the minimum average depth and the number of nodes, and the times to root include age, cause of ESKD, PRA, education level, cold ischemia time, HLA DR mismatch, BMI, serum albumin, degree of HLA mismatch, and donor age.
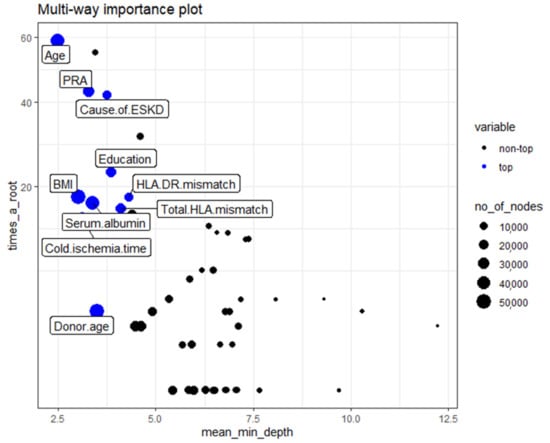
Figure 3.
Classification of the top and not top variables based on the minimum average depth, number of nodes, and times to root. The 10 top variables are highlighted in blue. The size of points reflects the number of nodes split on the variable. Times_a_root: total number of trees in which the variable is used for splitting the root node. Mean_minimal_depth: mean minimal depth. Abbreviations: BMI—Body mass index; ESKD—Endstage kidney disease; HLA—Human Leukocyte antigen; PRA—Panel reactive antibody.
The second multi-way importance plot (Figure 4) reveals the important measures that emerge from the role of the variables in the prediction of acute rejection, including a decrease in accuracy and a decrease in Gini, with additional information on the p-value based binomial distribution of the number of nodes split on the variable implying that the variables are randomly drawn to form splits. After combining the mean decrease in Gini, decrease in accuracy, and p values of these features, the top variables for acute rejection include cold ischemia time, recipient age, donor age, BMI, serum albumin, PRA, degree of HLA mismatch, causes of ESKD, dialysis duration, and HLA-DR mismatch.
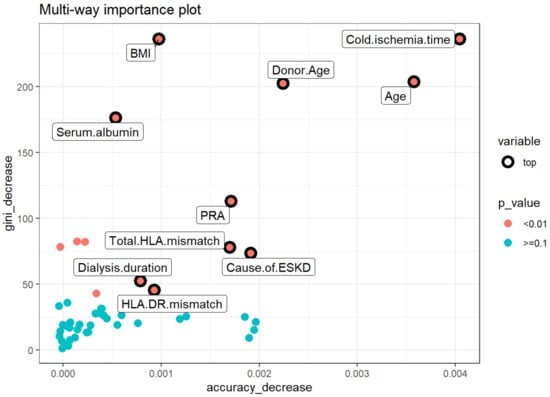
Figure 4.
Multiway feature importance analysis of the acute rejection combining the mean decrease in Gini, decrease in accuracy, and p values of the features (pink circle; p < 0.01). Abbreviations: BMI—Body mass index; ESKD—End-stage kidney disease; HLA—Human leukocyte antigen; PRA—Panel reactive antibody.
3.2.4. Compare Rankings of Variables
Figure 5 exhibits the bilateral relations between the rankings of variables according to the selected importance measures. It demonstrates that the RF parameters of importance are ascertained to have correlations among each other, thereby implying the reliability of each of these parameters to rank the variable importance. The top correlations among themeasures of importance include decrease in gini:number of nodes, decrease in gini:mean minimal depth, and mean minimal depth: number of nodes.
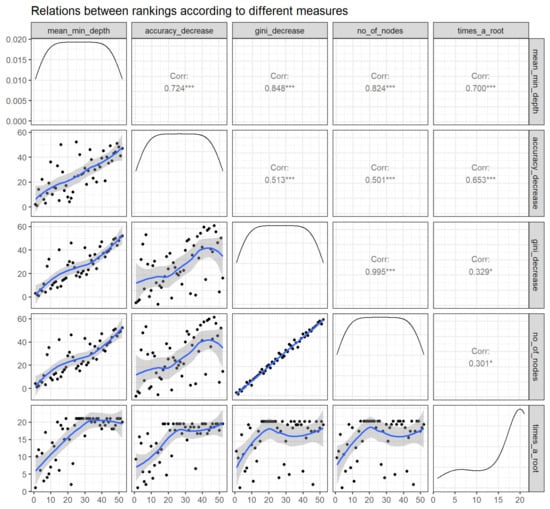
Figure 5.
Relations between rankings according to different measures (panels in the lower triangle of the grid displaying distribution of rankings of all predictor variables with black dots accompanying a blue trend line) as well as correlation coefficient over rankings of any 2 parameters (panels in the upper triangle of the grid). Abbreviations: No—Number; min—Minimum; Corr—correlation. * p < 0.05, *** p < 0.001.
3.2.5. Variable Interactions
Feature interactions with the most frequent occurrences in the RF classification run between correlated and uncorrelated pairs. Figure 6 outlines the 30 top interactions of the variables according to the mean of conditional minimal depth, a generalization of minimal depth that measures the depth of the second variable in a tree of which the first variable is a root (a subtree of a tree from the forest).
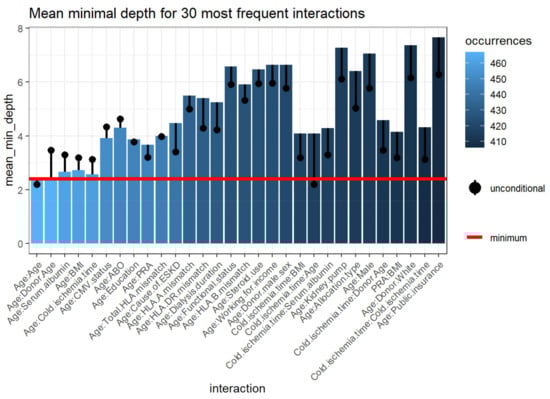
Figure 6.
Mean minimum depth for the 30 most prevalent interactions variables. The bar displaying the mean conditional minimal depth and the line the unconditional mean minimal depth. The horizontal line presents the minimal value of the depicted statistic among interactions for which it was calculated. Abbreviations: BMI—Body mass index; CMV—Cytomegalovirus; ESKD—End-stage kidney disease; HLA—Human leukocyte antigen; PRA—Panel reactive antibody.
To be comparable to the normal minimal depth, 1 is subtracted so that 0 is the minimum. Smaller values of the mean conditional depth with associated higher unconditional depth, as well as increased occurrences, indicate interaction effects (Table 4). The interactions considered are those with the following variables as first (root variables): cold ischemia time, recipient age, donor age, BMI, PRA, cause of ESKD, serum albumin, total number of HLA mismatches, dialysis duration, HLA-DR mismatches, allocation type, education level, CMV status, HLA-B mismatch, HLA-A mismatch, and all plausible values of the second variable. The three most frequent interactions consist of two variables, including recipient age:donor age, recipient age:serum albumin, and recipient age:BMI, respectively.
Table 4.
Top 30 interactions that appeared most frequently.
4. Discussion
In this study, using tree-based RF feature importance and the feature interaction network analysis framework, we were able to demonstrate important variables in the RF models for acute rejection among Black kidney transplant recipients using the number of nodes, accuracy decrease, gini decrease, times_a_root, p value, and mean minimal depth. These identified risk factors for rejection included recipient age, cause of ESKD, PRA, cold ischemia time, donor age, HLA DR mismatch, BMI, serum albumin, degree of HLA mismatch, education level, and dialysis duration.
By comparison, traditional multivariable logistic regression analysis showed that younger recipient age; kidney retransplantation; ECD deceased donor utilization; dialysis duration; PRA; recipient HIV seropositivity; degree of HLA mismatch; DGF; basiliximab induction; and cyclosporine, azathioprine, and mTOR inhibitor-based immunosuppression were independent risk factors for acute rejection among Black kidney transplant recipients. Whereas some important variables from traditional logistic regression analysis are not listed as important variables in the RF approach, these factors are still variables that were used to predict acute rejection outcomes among Black kidney transplant recipients (as shown in Figure 7).
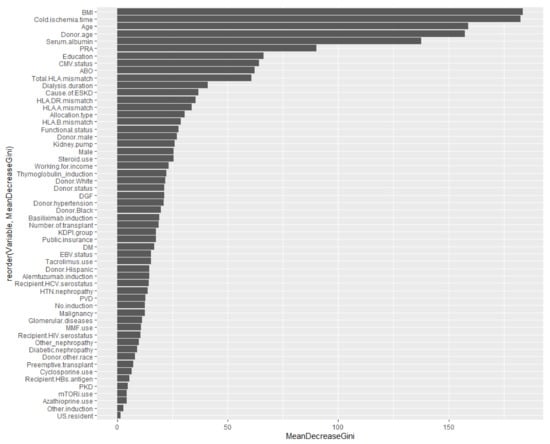
Figure 7.
Variable importance summarized from Table 1 (The order of these listed variables based on mean decrease in Gini). Abbreviation: BMI—Body mass index; CMV—Cytomegalovirus; DGF—Delayed graft function; DM—Diabetes mellitus; EBV—Epstein-Barr virus; ESKD—End-stage kidney disease; HBs—Hepatitis B surface; HCV—Hepatitis C virus; HIV—Human immunodeficiency virus; HTN—Hypertension; KDPI—Kidney donor profile index; MMF—Mycophenolate, mTORi—Mammalian target of rapamycin inhibitor; PKD—Polycystic kidney disease; PRA—Panel reactive antibody; PVD—Peripheral vascular disease.
RF is an ensemble of decision trees. Many trees produced in a particular “random” way build a RF []. Each tree is constructed from a diverse sample of rows, and at individual nodes, a different sample of features is chosen for splitting. Each of the trees produces its own individual prediction. These predictions are subsequently averaged to generate a single result. Averaging strengthens a RF to be better than a single decision tree and thereby increases its accuracy and lessens overfitting. The average of these models evens out the variance, resulting in an error reduction that is both low in bias and low in variance. This nonparametric and nonlinear machine learning RF method can resist noise and is expected to build accurate prediction models using aggregated data. In addition, RF works well on large datasets, especially when there are many categorical independent variables and unbalanced data [], as in our OPTN/UNOS dataset. Conversely, a logistic regression analysis approach, which uses a generalized linear equation and the stepwise variable selection method, is based on the likelihood ratio test to describe the directed dependencies among a set of variables. To do so, a number of statistical assumptions must be met. Common concerns include overfitting (rule of 10) as well as outliers. As a result, logistic regression inherently has bias and low variance due to the rigid nature of the shape of the line.
Previous studies have demonstrated higher PRA, longer cold ischemia time, increased HLA mismatches, HLA DR mismatches, and longer dialysis duration as important generalizable risk factors for acute rejection among kidney transplant recipients. From our current study using RF, we demonstrate that some of these established variables, such as cold ischemia time and HLA DR mismatch, are not listed as independent predictors for acute rejection among Black kidney transplant recipients in traditional logistic regression analysis. Furthermore, we also found that BMI, cause of ESKD, serum albumin, donor age, and education level are important variables in RF, but not in traditional analysis. Given that the RF algorithm has increasingly been applied in medicine and transplantation [,,], it is important to recognize these unique RF model variables for acute rejection among Black kidney transplant recipients. A good prediction model begins with a great feature selection process. Understanding these variables in our study using a national database will help each transplant center to develop their individualized RF model, prognosticate the risk of rejection among Black kidney transplant recipients, and develop strategies to prevent these serious events.
In addition to the identification of feature importance for acute rejection in Black kidney transplant recipients in the RF model, we also conducted feature interaction network analysis. A great benefit of the tree structure is the understanding of the interaction between variables. For example, if the split in a parent is by one variable and by another variable in the daughter node, it can be concluded that there is an interaction between these two variables [,,]. Interactions also become apparent as common occurrences of variable combinations. Thus, both the pair frequency and the associated distances are informative with regard to the interaction effects. From the findings of our study, the three most frequent interactions consist of two numerical variables, including recipient age:donor age, recipient age:serum albumin, and recipient age:BMI, respectively. These findings from the feature interaction network analysis may help to determine the important effect modifiers of acute rejection risk among Black kidney transplant recipients.
Our study has several limitations. Given the nature of the UNOS database, we do not have details on the factors leading to acute rejection such as immunosuppression levels, medication non-adherence, donor-specific antibodies, or infection prior to episodes of acute rejection. Thus, we aimed to investigate RF feature importance with feature interaction network analysis as an initial step to create an RF prediction model. Additional investigations are needed to incorporate the findings of our study into other important variables such as crossmatch results, the presence of DSA, and follow-up data to construct a RF prediction model with a high predictive performance for acute rejection among Black kidney transplant recipients. In addition, future studies assessing tree-based RF feature importance and the feature interaction network analysis framework for acute rejection among the general kidney transplant recipient populations are needed.
5. Conclusions
In conclusion, the application of tree-based RF feature importance and the feature interaction network analysis framework identified the recipient age, ESKD etiology, PRA, cold ischemia time, donor age, HLA DR mismatch, BMI, serum albumin, degree of HLA mismatch, education level, and dialysis duration as important variables in the RF models for acute rejection among Black kidney transplant recipients in the United States.
Author Contributions
Conceptualization, C.T., C.C.J., N.L., J.B., P.C.A., C.A., P.P., W.K., B.B. and W.C.; Data curation, C.T.; Formal analysis, C.T. and W.C.; Investigation, C.T., P.P. and W.C.; Methodology, C.T., C.C.J., J.B., P.C.A., P.P., W.K. and W.C.; Project administration, N.L., C.A. and B.B.; Resources, C.T. and N.L.; Software, C.T. and W.C.; Supervision, C.C.J., J.B. and W.C.; Validation, C.T., P.P. and W.C.; Visualization, C.T. and W.C.; Writing—original draft, C.T. and W.C.; Writing—review & editing, C.T., C.C.J., N.L., J.B., P.C.A., C.A., P.P., W.K., B.B. and W.C. All authors have read and agreed to the published version of the manuscript.
Funding
This research received no specific grant from any funding agency in the public, commercial, or not-for-profit sectors.
Institutional Review Board Statement
This study was approved by the Mayo Clinic Institutional Review Board (#21-007698) and the UNOS/OPTN data is publicly available and de-identified.
Informed Consent Statement
Patient consent was waived due to the minimal risk nature of observational study design.
Data Availability Statement
Data is available upon reasonable request to corresponding author.
Acknowledgments
The interpretation and reporting of this data are the responsibility of the authors and in no way should be seen as an official policy of or interpretation by the OPTN or the United States government.
Conflicts of Interest
The authors declare no conflict of interest.
References
- Isaacs, R.B.; Nock, S.L.; Spencer, C.E.; Connors, A.F., Jr.; Wang, X.-Q.; Sawyer, R.; Lobo, P.I. Racial disparities in renal transplant outcomes. Am. J. Kidney Dis. 1999, 34, 706–712. [Google Scholar] [CrossRef]
- Foster, C.E., III; Philosophe, B.; Schweitzer, E.J.; Colonna, J.O.; Farney, A.C.; Jarrell, B.; Anderson, L.; Bartlett, S.T. A Decade of Experience with Renal Transplantation in African-Americans. Ann. Surg. 2002, 236, 794–805. [Google Scholar] [CrossRef]
- Hariharan, S.; Mcbride, M.A.; Cherikh, W.S.; Tolleris, C.B.; Bresnahan, B.A.; Johnson, C.P. Post-transplant renal function in the first year predicts long-term kidney transplant survival. Kidney Int. 2002, 62, 311–318. [Google Scholar] [CrossRef] [PubMed] [Green Version]
- Goldfarb-Rumyantzev, A.S.; Scandling, J.D.; Pappas, L.; Smout, R.J.; Horn, S. Prediction of 3-yr cadaveric graft survival based on pre-transplant variables in a large national dataset. Clin. Transplant. 2003, 17, 485–497. [Google Scholar] [CrossRef]
- Mandal, A.K.; Snyder, J.J.; Gilbertson, D.T.; Collins, A.J.; Silkensen, J.R. Does cadaveric donor renal transplantation ever provide better outcomes than live-donor renal transplantation? Transplantation 2003, 75, 494–500. [Google Scholar] [CrossRef] [PubMed]
- Moore, D.E.; Feurer, I.D.; Rodgers, S., Jr.; Shaffer, D.; Nylander, W.; Gorden, D.L.; Chari, R.S.; Wright, J.K.; Pinson, C.W. Is there racial disparity in outcomes after solid organ transplantation? Am. J. Surg. 2004, 188, 571–574. [Google Scholar] [CrossRef]
- Eckhoff, D.E.; Young, C.J.; Gaston, R.S.; Fineman, S.W.; Deierhoi, M.H.; Foushee, M.T.; Brown, R.N.; Diethelm, A.G. Racial Disparities in Renal Allograft Survival: A Public Health Issue? J. Am. Coll. Surg. 2007, 204, 894–902. [Google Scholar] [CrossRef]
- Joshi, S.; Gaynor, J.J.; Ciancio, G. Review of ethnic disparities in access to renal transplantation. Clin. Transplant. 2012, 26, E337–E343. [Google Scholar] [CrossRef]
- Morris, P.J.; Johnson, R.J.; Fuggle, S.V.; Belger, M.A.; Briggs, J.D. Analysis of factors that affect outcome of primary cadaveric renal transplantation in the UK. HLA Task Force of the Kidney Advisory Group of the United Kingdom Transplant Support Service Authority (UKTSSA). Lancet 1999, 354, 1147–1152. [Google Scholar] [CrossRef]
- Meier-Kriesche, H.-U.; Kaplan, B. Waiting time on dialysis as the strongest modifiable risk factor for renal transplant outcomes: A paired donor kidney analysis. Transplantation 2002, 74, 1377–1381. [Google Scholar] [CrossRef]
- Johansen, K.L.; Zhang, R.; Huang, Y.; Patzer, R.E.; Kutner, N.G. Association of Race and Insurance Type with Delayed Assessment for Kidney Transplantation among Patients Initiating Dialysis in the United States. Clin. J. Am. Soc. Nephrol. 2012, 7, 1490–1497. [Google Scholar] [CrossRef] [PubMed] [Green Version]
- Tankersley, M.; Gaston, R.; Curtis, J.; Julian, B.; Deierhoi, M.; Rhynes, V.; Zeigler, S.; Diethelm, A. The living donor process in kidney transplantation: Influence of race and comorbidity. Transplant. Proc. 1997, 29, 3722–3723. [Google Scholar] [CrossRef]
- Chavalitdhamrong, D.; Gill, J.; Takemoto, S.; Madhira, B.R.; Cho, Y.W.; Shah, T.; Bunnapradist, S. Patient and Graft Outcomes from Deceased Kidney Donors Age 70 Years and Older: An Analysis of the Organ Procurement Transplant Network/United Network of Organ Sharing Database. Transplantation 2008, 85, 1573–1579. [Google Scholar] [CrossRef] [PubMed] [Green Version]
- Taber, D.J.; Egede, L.E.; Baliga, P.K. Outcome disparities between African Americans and Caucasians in contemporary kidney transplant recipients. Am. J. Surg. 2017, 213, 666–672. [Google Scholar] [CrossRef] [Green Version]
- Rebellato, L.M.; Arnold, A.N.; Bozik, K.M.; Haisch, C.E. HLA matching and the united network for organ sharing allocation system: Impact of HLA matching on african-american recipients of cadaveric kidney transplants. Transplantation 2002, 74, 1634–1636. [Google Scholar] [CrossRef]
- Ng, F.L.; Holt, D.W.; Chang, R.W.S.; MacPhee, I.A.M. Black renal transplant recipients have poorer long-term graft survival than CYP3A5 expressers from other ethnic groups. Nephrol. Dial. Transplant. 2010, 25, 628–634. [Google Scholar] [CrossRef] [PubMed] [Green Version]
- Martins, L.S.; Fonseca, I.; Sousa, S.; Matos, C.; Santos, J.; Dias, L.; Henriques, A.; Sarmento, A.; Cabrita, A. The Influence of HLA Mismatches and Immunosuppression on Kidney Graft Survival: An Analysis of More Than 1300 Patients. Transplant. Proc. 2007, 39, 2489–2493. [Google Scholar] [CrossRef]
- Roberts, J.P.; Wolfe, R.A.; Bragg-Gresham, J.L.; Rush, S.H.; Wynn, J.; Distant, D.A.; Ashby, V.B.; Held, P.J.; Port, F.K. Effect of Changing the Priority for HLA Matching on the Rates and Outcomes of Kidney Transplantation in Minority Groups. N. Engl. J. Med. 2004, 350, 545–551. [Google Scholar] [CrossRef] [Green Version]
- Malek, S.K.; Keys, B.J.; Kumar, S.; Milford, E.; Tullius, S.G. Racial and ethnic disparities in kidney transplantation. Transpl. Int. 2010, 24, 419–424. [Google Scholar] [CrossRef] [PubMed]
- Kasiske, B.L.; Anjum, S.; Shah, R.; Skogen, J.; Kandaswamy, C.; Danielson, B.; O’Shaughnessy, E.A.; Dahl, D.C.; Silkensen, J.R.; Sahadevan, M.; et al. Hypertension after kidney transplantation. Am. J. Kidney Dis. 2004, 43, 1071–1081. [Google Scholar] [CrossRef] [PubMed]
- Kasiske, B.L.; Snyder, J.J.; Gilbertson, D.; Matas, A.J. Diabetes Mellitus after Kidney Transplantation in the United States. Arab. Archaeol. Epigr. 2003, 3, 178–185. [Google Scholar] [CrossRef]
- Gralla, J.; Le, C.N.; Cooper, J.E.; Wiseman, A.C. The risk of acute rejection and the influence of induction agents in lower-risk African American kidney transplant recipients receiving modern immunosuppression. Clin. Transplant. 2014, 28, 292–298. [Google Scholar] [CrossRef]
- Padiyar, A.; Hricik, D.E. Immune factors influencing ethnic disparities in kidney transplantation outcomes. Expert Rev. Clin. Immunol. 2011, 7, 769–778. [Google Scholar] [CrossRef] [PubMed]
- Siedlecki, A.; Irish, W.; Brennan, D.C. Delayed Graft Function in the Kidney Transplant. Arab. Archaeol. Epigr. 2011, 11, 2279–2296. [Google Scholar] [CrossRef] [Green Version]
- Taber, D.J.; Hunt, K.J.; Gebregziabher, M.; Srinivas, T.; Chavin, K.D.; Baliga, P.K.; Egede, L.E. A Comparative Effectiveness Analysis of Early Steroid Withdrawal in Black Kidney Transplant Recipients. Clin. J. Am. Soc. Nephrol. 2017, 12, 131–139. [Google Scholar] [CrossRef] [Green Version]
- Liu, A.; Woodside, K.J.; Augustine, J.J.; Sarabu, N. Racial disparity in kidney transplant survival relates to late rejection and is independent of steroid withdrawal. Clin. Transplant. 2018, 32, e13381. [Google Scholar] [CrossRef] [PubMed]
- Gordon, E.J.; Ladner, D.P.; Caicedo, J.C.; Franklin, J. Disparities in Kidney Transplant Outcomes: A Review. Semin. Nephrol. 2010, 30, 81–89. [Google Scholar] [CrossRef] [Green Version]
- Vasquez, E.M.; Benedetti, E.; Pollak, R. Ethnic differences in clinical response to corticosteroid treatment of acute renal allograft rejection. Transplantation 2001, 71, 229–233. [Google Scholar] [CrossRef]
- Weng, S.F.; Vaz, L.; Qureshi, N.; Kai, J. Prediction of premature all-cause mortality: A prospective general population cohort study comparing machine-learning and standard epidemiological approaches. PLoS ONE 2019, 14, e0214365. [Google Scholar] [CrossRef]
- Song, X.; Mitnitski, A.; Cox, J.; Rockwood, K. Comparison of Machine Learning Techniques with Classical Statistical Models in Predicting Health Outcomes. Stud. Health Technol. Inform. 2004, 107, 736–740. [Google Scholar] [PubMed]
- Breiman, L. Random forests. Mach. Learn. 2001, 45, 5–32. [Google Scholar] [CrossRef] [Green Version]
- Rashidi, H.H.; Tran, N.K.; Betts, E.V.; Howell, L.P.; Green, R. Artificial Intelligence and Machine Learning in Pathology: The Present Landscape of Supervised Methods. Acad. Pathol. 2019, 6, 2374289519873088. [Google Scholar] [CrossRef] [PubMed]
- Wasserman, L.; Roeder, K. High-dimensional variable selection. Ann. Stat. 2009, 37, 2178–2201. [Google Scholar] [CrossRef] [Green Version]
- Ayers, B.; Sandholm, T.; Gosev, I.; Prasad, S.; Kilic, A. Using machine learning to improve survival prediction after heart transplantation. J. Card. Surg. 2021, 36, 4113–4120. [Google Scholar] [CrossRef]
- Zhang, Y.; Yang, D.; Liu, Z.; Chen, C.; Ge, M.; Li, X.; Luo, T.; Wu, Z.; Shi, C.; Wang, B.; et al. An explainable supervised machine learning predictor of acute kidney injury after adult deceased donor liver transplantation. J. Transl. Med. 2021, 19, 1–15. [Google Scholar] [CrossRef]
- Senanayake, S.; Kularatna, S.; Healy, H.; Graves, N.; Baboolal, K.; Sypek, M.P.; Barnett, A. Development and validation of a risk index to predict kidney graft survival: The kidney transplant risk index. BMC Med. Res. Methodol. 2021, 21, 127. [Google Scholar] [CrossRef] [PubMed]
- Walker, S.W.C.; Anwar, A.; Psutka, J.M.; Crouse, J.; Liu, C.; Le Blanc, J.C.Y.; Montgomery, J.; Goetz, G.H.; Janiszewski, J.S.; Campbell, J.L.; et al. Determining molecular properties with differential mobility spectrometry and machine learning. Nat. Commun. 2018, 9, 5096. [Google Scholar] [CrossRef] [PubMed] [Green Version]
- Van Buuren, S.; Groothuis-Oudshoorn, K. Mice: Multivariate imputation by chained equations in R. J. Stat. Softw. 2011, 45, 1–67. [Google Scholar] [CrossRef] [Green Version]
- Paluszynska, A.; Biecek, P.; Jiang, Y. Random Forest Explainer: Explaining and visualizing random forests in terms of variable importance. R package Version 0.9 2017. Available online: https://github.com/ModelOriented/randomForestExplainer (accessed on 15 July 2021).
- Liaw, A.; Wiener, M. Classification and regression by random forest. R News 2002, 2, 18–22. [Google Scholar]
- Muchlinski, D.; Siroky, D.; He, J.; Kocher, M. Comparing Random Forest with Logistic Regression for Predicting Class-Imbalanced Civil War Onset Data. Political Anal. 2016, 24, 87–103. [Google Scholar] [CrossRef]
Publisher’s Note: MDPI stays neutral with regard to jurisdictional claims in published maps and institutional affiliations. |
© 2021 by the authors. Licensee MDPI, Basel, Switzerland. This article is an open access article distributed under the terms and conditions of the Creative Commons Attribution (CC BY) license (https://creativecommons.org/licenses/by/4.0/).