
Forecasting with a Bivariate Hysteretic Time Series Model Incorporating Asymmetric Volatility and Dynamic Correlations

Abstract
1. Introduction
2. Multivariate Hysteretic Autoregressive Model with Asymmetry Structures in Volatility and Time-Varying Correlation
3. Bayesian Inference
4. Forecasting the Marginal Expected Shortfall and Value at Risk
5. Simulation Study
6. Emperical Study
7. Conclusions
Funding
Institutional Review Board Statement
Data Availability Statement
Conflicts of Interest
References
- Chen, C.W.S.; So, M.K.P. On a threshold heteroscedastic model. Int. J. Forecast. 2006, 22, 73–89. [Google Scholar] [CrossRef]
- Chen, C.W.S.; Truong, B.C. On double hysteretic heteroskedastic model. J. Stat. Comput. Simul. 2016, 86, 2684–2705. [Google Scholar] [CrossRef]
- Li, G.D.; Guan, B.; Li, W.K.; Yu, P.L.H. Hysteretic autoregressive time series models. Biometrika 2015, 102, 717–723. [Google Scholar] [CrossRef]
- Lo, P.H.; Li, W.K.; Yu, P.L.H.; Li, G.D. On buffered threshold GARCH models. Stat. Sin. 2016, 26, 1555–1567. [Google Scholar] [CrossRef]
- Truong, B.C.; Chen, C.W.; Sriboonchitta, S. Hysteretic Poisson INGARCH model for integer-valued time series. Stat. Model. 2017, 17, 401–422. [Google Scholar] [CrossRef]
- Zhu, K.; Yu, P.L.H.; Li, W.K. Testing for the buffered autoregressive processes. Stat. Sin. 2014, 24, 971–984. [Google Scholar] [CrossRef]
- Zhu, K.; Li, W.K.; Yu, P.L.H. Buffered autoregressive models with conditional heteroskedasticity: An application to exchange rates. J. Bus. Econ. Stat. 2017, 35, 528–542. [Google Scholar] [CrossRef]
- Bollerslev, T. On the correlation structure for the generalized autoregressive conditional heteroskedastic process. J. Time Ser. Anal. 1988, 9, 121–131. [Google Scholar] [CrossRef]
- Engle, R. Dynamic conditional correlation: A simple class of multivariate generalized autoregressive conditional heteroskedasticity models. J. Bus. Econ. Stat. 2002, 20, 339–350. [Google Scholar] [CrossRef]
- Tse, Y.K.; Tsui, A.K.C. A multivariate generalized autoregressive conditional heteroscedasticity model with time-varying correlations. J. Bus. Econ. Stat. 2002, 20, 351–362. [Google Scholar] [CrossRef]
- Cappiello, L.; Engle, R.F.; Sheppard, K. Asymmetric dynamics in the correlations of global equity and bond returns. J. Financ. Econom. 2006, 4, 537–572. [Google Scholar] [CrossRef]
- Tsay, R.S. Multivariate Time Series Analysis; John Wiley & Sons: Hoboken, NJ, USA, 2014. [Google Scholar]
- Choy, S.T.B.; Chen, C.W.S.; Lin, E.M.H. Bivariate asymmetric GARCH models with heavy tails and dynamic conditional correlations. Quant. Financ. 2014, 14, 1297–1313. [Google Scholar] [CrossRef]
- Chen, C.W.S.; Than-Thi, H.; So, M.K.P. On hysteretic vector autoregressive model with applications. J. Stat. Comput. Simul. 2019, 89, 191–210. [Google Scholar] [CrossRef]
- Chen, C.W.S.; Than-Thi, H.; So, M.K.P.; Sriboonchitta, S. Quantile forecasting based on a bivariate hysteretic autoregressive model with GARCH errors and time-varying correlations. Appl. Stoch. Model. Bus. Ind. 2019, 6, 1301–1321. [Google Scholar] [CrossRef]
- Glosten, L.R.; Jagannathan, R.; Runkle, D.E. On the Relation between the Expected Value and the Volatility of the Nominal Excess Return on Stocks. J. Financ. 1993, 48, 1779–1801. [Google Scholar] [CrossRef]
- Sentana, E. Quadratic ARCH models. Rev. Econ. Stud. 1995, 62, 639–661. [Google Scholar] [CrossRef]
- Andrews, D.F.; Mallows, C.L. Scale mixtures of normality. J. R. Stat. Soc. Ser. B 1974, 36, 99–102. [Google Scholar] [CrossRef]
- Acharya, V.V.; Pedersen, L.H.; Philippon, T.; Richardson, M. Measuring Systemic Risk. Rev. Financ. Stud. 2017, 30, 2–47. [Google Scholar] [CrossRef]
- Brownlees, T.C.; Engle, R.F. SRISK: A conditional capital shortfall index for systemic risk measurement. Rev. Financ. Stud. 2017, 30, 48–79. [Google Scholar] [CrossRef]
- Christoffersen, P.F. Evaluating interval forecasts. Int. Econ. Rev. 1998, 39, 841–862. [Google Scholar] [CrossRef]
- Kupiec, P. Techniques for verifying the accuracy of risk measurement models. J. Deriv. 1995, 3, 73–84. [Google Scholar] [CrossRef]
- Henze, N.; Zirkler, B. A class of invariant consistent tests for multivariate normality. Commun. Stat. Theory Methods 1990, 19, 3595–3617. [Google Scholar] [CrossRef]
- Mardia, K.V. Measures of multivariate skewness and kurtosis with applications. Biometrika 1970, 57, 519–530. [Google Scholar] [CrossRef]
- Geweke, J. Evaluating the accuracy of sampling-based approaches to calculating posterior moments. In Bayesian Statistics 4: Proceedings of the Fourth Valencia International Meeting, Dedicated to the memory of Morris H. DeGroot, 1931–1989; Oxford University Press: Oxford, UK, 1992. [Google Scholar]
- Embrechts, P.; Kaufmann, R.; Patie, P. Strategic long-term financial risks: Single risk factors. Comput. Optim. Appl. 2005, 32, 61–90. [Google Scholar] [CrossRef]
- Sheraz, M.; Nasir, I. Information-theoretic measures and modeling stock market volatility: A Comparative Approach. Risk 2021, 9, 89. [Google Scholar] [CrossRef]
- Drzazga-Szczęśniak, E.A.; Sierpińska-Sawicz, A.; Łukaszuk, P. Entropy of financial time series due to the shock of war. Entropy 2023, 25, 823. [Google Scholar] [CrossRef]


| Parameter | True | Mean | Med | Std | 2.5% | 97.5% | Coverage |
|---|---|---|---|---|---|---|---|
| −0.10 | −0.1022 | −0.1023 | 0.0280 | −0.1573 | −0.0472 | 94.00 | |
| −0.10 | −0.1014 | −0.1015 | 0.0185 | −0.1375 | −0.0650 | 98.00 | |
| 0.20 | 0.1992 | 0.1992 | 0.0482 | 0.1048 | 0.2936 | 95.50 | |
| 0.25 | 0.2465 | 0.2465 | 0.0440 | 0.1602 | 0.3330 | 95.50 | |
| 0.25 | 0.2510 | 0.2511 | 0.0215 | 0.2089 | 0.2932 | 96.00 | |
| 0.30 | 0.2959 | 0.2960 | 0.0328 | 0.2312 | 0.3601 | 97.00 | |
| −0.08 | −0.0811 | −0.0811 | 0.0119 | −0.1045 | −0.0579 | 94.50 | |
| −0.15 | −0.1512 | −0.1512 | 0.0081 | −0.1671 | −0.1354 | 92.00 | |
| 0.30 | 0.3005 | 0.3005 | 0.0347 | 0.2323 | 0.3688 | 95.50 | |
| 0.35 | 0.3472 | 0.3472 | 0.0344 | 0.2797 | 0.4149 | 95.00 | |
| 0.35 | 0.3514 | 0.3514 | 0.0162 | 0.3197 | 0.3832 | 94.00 | |
| 0.30 | 0.2972 | 0.2972 | 0.0234 | 0.2513 | 0.3432 | 95.00 | |
| −0.50 | −0.4989 | −0.4988 | 0.0184 | −0.5334 | −0.4640 | 94.50 | |
| 0.10 | 0.0885 | 0.0890 | 0.0324 | 0.0266 | 0.1503 | 92.50 | |
| 8.00 | 9.1324 | 8.9642 | 1.4995 | 6.6907 | 12.5705 | 97.50 | |
| 10.00 | 10.1588 | 9.9447 | 1.7664 | 7.3307 | 14.2193 | 98.50 | |
| 0.65 | 0.6460 | 0.6483 | 0.0323 | 0.5758 | 0.7021 | 97.50 | |
| 0.80 | 0.7990 | 0.7990 | 0.0295 | 0.7414 | 0.8572 | 95.50 | |
| d | 1.00 | 1.0000 | 1.0000 | 0.0204 | 1.0000 | 1.0000 | 100.00 |
| 0.07 | 0.0782 | 0.0775 | 0.0144 | 0.0521 | 0.1088 | 89.50 | |
| 0.20 | 0.2139 | 0.2091 | 0.1148 | 0.0218 | 0.4385 | 100.00 | |
| 0.20 | 0.2191 | 0.2167 | 0.1143 | 0.0243 | 0.4388 | 100.00 | |
| 0.40 | 0.3821 | 0.3819 | 0.0613 | 0.2620 | 0.5020 | 91.00 | |
| 0.03 | 0.0349 | 0.0345 | 0.0073 | 0.0217 | 0.0506 | 91.00 | |
| 0.20 | 0.2147 | 0.2131 | 0.0356 | 0.1502 | 0.2899 | 96.50 | |
| 0.25 | 0.2792 | 0.2754 | 0.1150 | 0.0721 | 0.5080 | 97.00 | |
| 0.55 | 0.5240 | 0.5248 | 0.0492 | 0.4245 | 0.6184 | 93.00 | |
| 0.04 | 0.0382 | 0.0379 | 0.0068 | 0.0259 | 0.0524 | 93.00 | |
| 0.25 | 0.2458 | 0.2439 | 0.0682 | 0.1190 | 0.3837 | 97.00 | |
| 0.10 | 0.1262 | 0.1196 | 0.0694 | 0.0163 | 0.2754 | 97.50 | |
| 0.40 | 0.3781 | 0.3781 | 0.0677 | 0.2450 | 0.5107 | 96.00 | |
| 0.02 | 0.0218 | 0.0216 | 0.0039 | 0.0147 | 0.0298 | 94.00 | |
| 0.30 | 0.3063 | 0.3044 | 0.0441 | 0.2253 | 0.3971 | 97.00 | |
| 0.15 | 0.1830 | 0.1769 | 0.0830 | 0.0430 | 0.3542 | 95.00 | |
| 0.40 | 0.3808 | 0.3809 | 0.0525 | 0.2781 | 0.4824 | 94.00 | |
| 0.40 | 0.3915 | 0.3986 | 0.1819 | 0.0710 | 0.7004 | 97.00 | |
| 0.10 | 0.1011 | 0.0968 | 0.0476 | 0.0258 | 0.1938 | 96.50 | |
| 0.50 | 0.4615 | 0.4672 | 0.1083 | 0.2370 | 0.6571 | 96.50 | |
| 0.20 | 0.2092 | 0.2065 | 0.0412 | 0.1364 | 0.2969 | 95.50 |
| Parameter | True | Mean | Med | Std | 2.5% | 97.5% | Coverage |
|---|---|---|---|---|---|---|---|
| −0.10 | −0.1003 | −0.1002 | 0.0203 | −0.1404 | −0.0606 | 94.00 | |
| −0.08 | −0.0792 | −0.0792 | 0.0153 | −0.1093 | −0.0493 | 93.50 | |
| 0.32 | 0.3185 | 0.3186 | 0.0351 | 0.2494 | 0.3871 | 94.00 | |
| 0.30 | 0.2973 | 0.2972 | 0.0292 | 0.2401 | 0.3548 | 97.00 | |
| 0.37 | 0.3717 | 0.3717 | 0.0217 | 0.3290 | 0.4143 | 94.50 | |
| 0.35 | 0.3467 | 0.3467 | 0.0250 | 0.2976 | 0.3958 | 95.00 | |
| −0.08 | −0.0808 | −0.0808 | 0.0108 | −0.1021 | −0.0595 | 96.50 | |
| −0.08 | −0.0802 | −0.0802 | 0.0070 | −0.0940 | −0.0665 | 95.50 | |
| 0.35 | 0.3427 | 0.3427 | 0.0394 | 0.2652 | 0.4197 | 94.00 | |
| 0.30 | 0.3027 | 0.3027 | 0.0372 | 0.2295 | 0.3759 | 95.00 | |
| 0.33 | 0.3290 | 0.3290 | 0.0183 | 0.2930 | 0.3647 | 94.00 | |
| 0.37 | 0.3666 | 0.3667 | 0.0235 | 0.3204 | 0.4127 | 95.00 | |
| −0.45 | −0.4501 | −0.4503 | 0.0069 | −0.4626 | −0.4370 | 93.00 | |
| 0.10 | 0.0970 | 0.0973 | 0.0113 | 0.0750 | 0.1170 | 93.00 | |
| 8.00 | 9.2129 | 9.0257 | 1.5569 | 6.7229 | 12.8309 | 93.50 | |
| 10.00 | 10.2736 | 10.0551 | 1.8017 | 7.3914 | 14.4714 | 99.50 | |
| 0.50 | 0.4951 | 0.4994 | 0.0563 | 0.3723 | 0.5928 | 92.50 | |
| 0.85 | 0.8472 | 0.8479 | 0.0257 | 0.7948 | 0.8958 | 94.50 | |
| d | 1.00 | 1.0000 | 1.0000 | 0.0152 | 1.0000 | 1.0000 | 100.00 |
| 0.07 | 0.0784 | 0.0778 | 0.0124 | 0.0557 | 0.1040 | 91.50 | |
| 0.20 | 0.2235 | 0.2213 | 0.0467 | 0.1386 | 0.3220 | 95.00 | |
| 0.10 | 0.1107 | 0.1098 | 0.0289 | 0.0566 | 0.1704 | 96.00 | |
| 0.40 | 0.3613 | 0.3628 | 0.0832 | 0.1955 | 0.5205 | 95.50 | |
| 0.03 | 0.0343 | 0.0340 | 0.0060 | 0.0234 | 0.0470 | 92.00 | |
| 0.30 | 0.3306 | 0.3282 | 0.0558 | 0.2291 | 0.4473 | 94.00 | |
| 0.10 | 0.1030 | 0.1032 | 0.0236 | 0.0555 | 0.1490 | 96.50 | |
| 0.35 | 0.3289 | 0.3285 | 0.0527 | 0.2268 | 0.4339 | 94.00 | |
| 0.04 | 0.0371 | 0.0369 | 0.0051 | 0.0276 | 0.0478 | 95.00 | |
| 0.40 | 0.4115 | 0.4095 | 0.0555 | 0.3089 | 0.5284 | 94.50 | |
| 0.05 | 0.0533 | 0.0525 | 0.0192 | 0.0180 | 0.0932 | 95.00 | |
| 0.30 | 0.2855 | 0.2850 | 0.0618 | 0.1664 | 0.4087 | 95.00 | |
| 0.02 | 0.0212 | 0.0211 | 0.0026 | 0.0163 | 0.0267 | 94.50 | |
| 0.30 | 0.3212 | 0.3197 | 0.0449 | 0.2387 | 0.4122 | 95.50 | |
| 0.10 | 0.1032 | 0.1031 | 0.0138 | 0.0767 | 0.1308 | 93.00 | |
| 0.20 | 0.1904 | 0.1892 | 0.0410 | 0.1129 | 0.2733 | 96.00 | |
| 0.40 | 0.3810 | 0.3847 | 0.1001 | 0.1753 | 0.5660 | 94.00 | |
| 0.35 | 0.3582 | 0.3561 | 0.0563 | 0.2543 | 0.4744 | 96.00 | |
| 0.55 | 0.5157 | 0.5244 | 0.0928 | 0.3104 | 0.6746 | 96.50 | |
| 0.15 | 0.1573 | 0.1531 | 0.0427 | 0.0850 | 0.2535 | 98.00 |
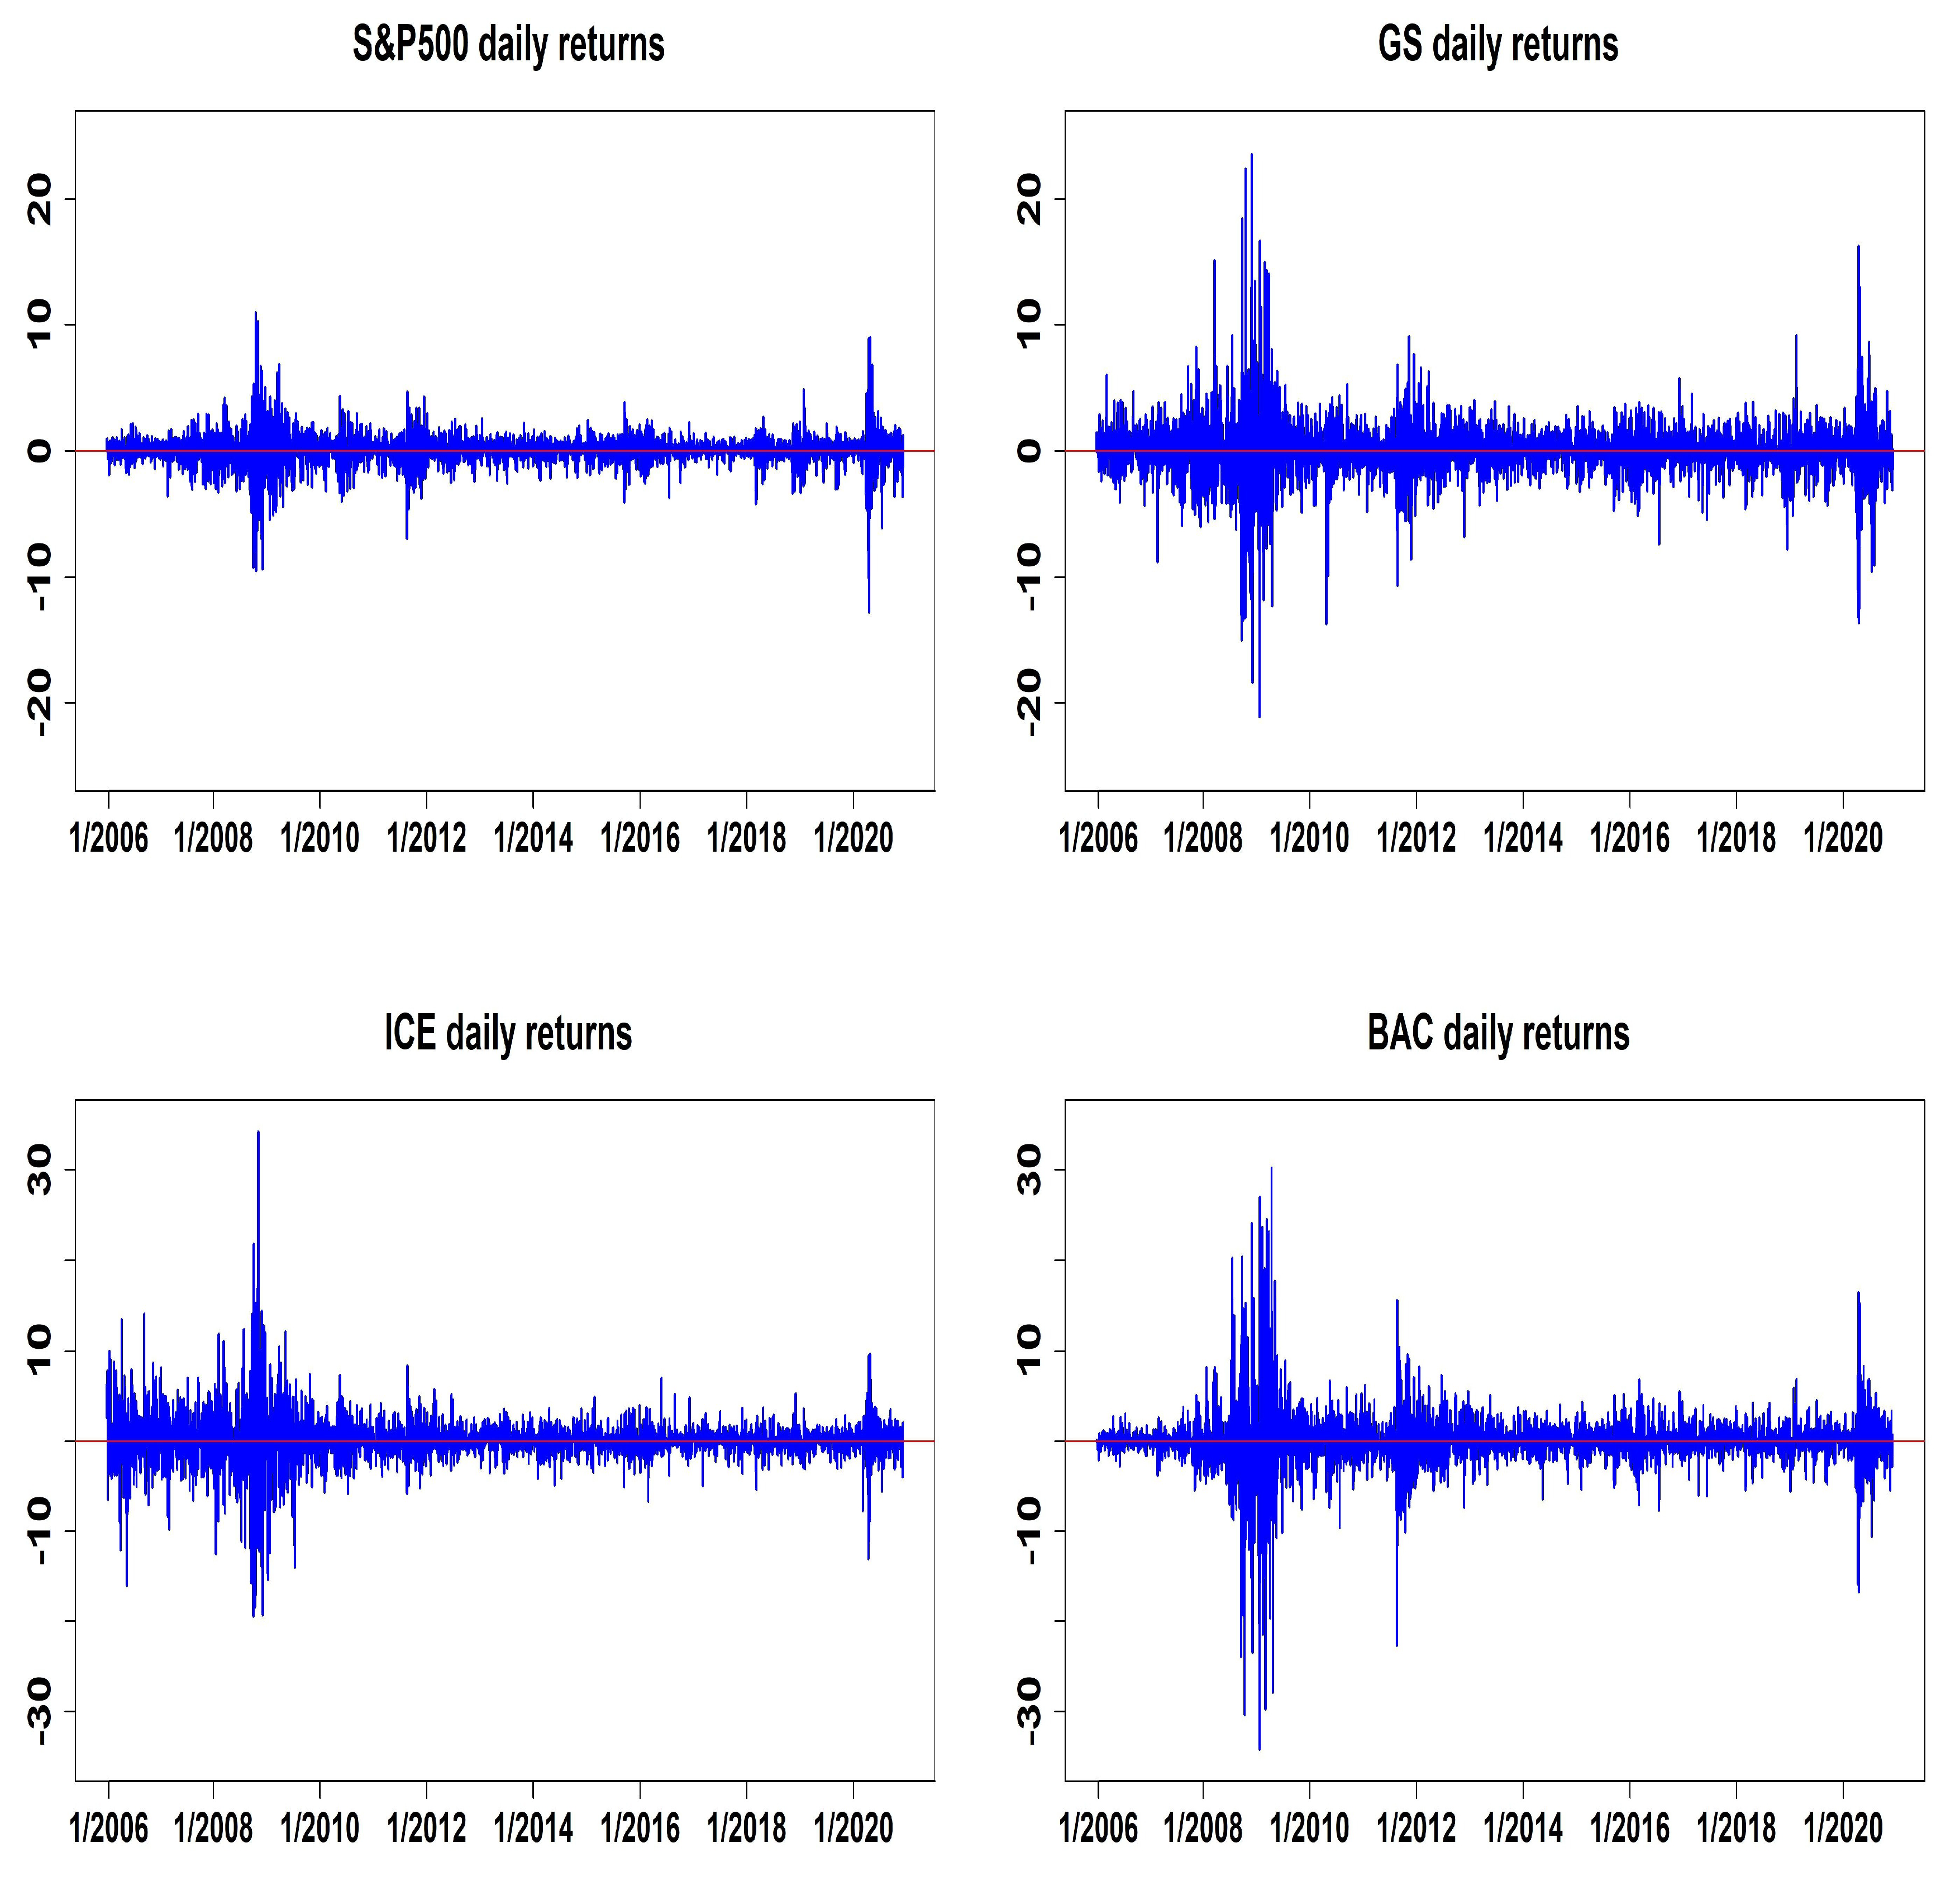
| Data | Mean | Std | Min | Max | Skewness | Kurtosis | MVN Tests * | |
|---|---|---|---|---|---|---|---|---|
| (p-Value) | ||||||||
| Mardia | Henze–Zirkler | |||||||
| S&P500 | 0.033 | 1.256 | −12.765 | 10.957 | −0.568 | 16.737 | ||
| GS | 0.033 | 2.320 | −21.022 | 23.482 | 0.188 | 18.086 | ||
| ICE | 0.075 | 2.578 | −19.501 | 34.217 | 0.205 | 20.699 | ||
| BAC | 0.007 | 3.165 | −34.206 | 30.210 | −0.319 | 26.645 | ||
| S&P500 vs. GS | <0.001 | <0.001 | ||||||
| S&P 500 vs. ICE | <0.001 | <0.001 | ||||||
| S&P 500 vs. BAC | <0.001 | <0.001 | ||||||
| Parameter | Mean | Med | Std | 2.5% | 97.5% |
|---|---|---|---|---|---|
| 0.0453 | 0.0454 | 0.0255 | −0.0043 | 0.0967 | |
| 0.0525 | 0.0538 | 0.0520 | −0.0580 | 0.1502 | |
| −0.0914 | −0.0921 | 0.0375 | −0.1624 | −0.0205 | |
| −0.0023 | −0.0017 | 0.0178 | −0.0371 | 0.0323 | |
| −0.0274 | −0.0284 | 0.0649 | −0.1506 | 0.0972 | |
| −0.0198 | −0.0204 | 0.0353 | −0.0880 | 0.0516 | |
| 0.0408 | 0.0405 | 0.0137 | 0.0147 | 0.0680 | |
| 0.0010 | −0.0005 | 0.0340 | −0.0648 | 0.0717 | |
| 0.0054 | 0.0050 | 0.0283 | −0.0500 | 0.0608 | |
| −0.0265 | −0.0267 | 0.0124 | −0.0499 | −0.0024 | |
| 0.0339 | 0.0321 | 0.0575 | −0.0792 | 0.1423 | |
| −0.0421 | −0.0411 | 0.0287 | −0.1000 | 0.0111 | |
| −0.4935 | −0.4744 | 0.0386 | −0.5667 | −0.4502 | |
| 0.6388 | 0.6497 | 0.0295 | 0.5541 | 0.6814 | |
| 8.8291 | 8.7186 | 0.9056 | 7.2395 | 10.9435 | |
| 7.4454 | 7.4002 | 0.7572 | 6.1675 | 9.1533 | |
| 0.8766 | 0.8765 | 0.0192 | 0.8393 | 0.9150 | |
| 0.6681 | 0.6699 | 0.0318 | 0.6014 | 0.7265 | |
| d | 1.0000 | 1.0000 | 0.0318 | 1.0000 | 1.0000 |
| 0.0247 | 0.0243 | 0.0042 | 0.0170 | 0.0341 | |
| 0.0085 | 0.0082 | 0.0049 | 0.0009 | 0.0188 | |
| 0.1155 | 0.1153 | 0.0078 | 0.1007 | 0.1299 | |
| 0.9285 | 0.9296 | 0.0073 | 0.9115 | 0.9389 | |
| 0.0179 | 0.0178 | 0.0024 | 0.0135 | 0.0228 | |
| 0.0223 | 0.0222 | 0.0053 | 0.0117 | 0.0328 | |
| 0.2750 | 0.2747 | 0.0137 | 0.2483 | 0.3006 | |
| 0.8189 | 0.8195 | 0.0114 | 0.7959 | 0.8404 | |
| 0.0804 | 0.0796 | 0.0158 | 0.0525 | 0.1140 | |
| 0.0268 | 0.0266 | 0.0086 | 0.0101 | 0.0435 | |
| 0.0532 | 0.0528 | 0.0082 | 0.0370 | 0.0699 | |
| 0.9353 | 0.9363 | 0.0112 | 0.9108 | 0.9549 | |
| 0.0852 | 0.0850 | 0.0154 | 0.0565 | 0.1159 | |
| 0.0397 | 0.0396 | 0.0052 | 0.0298 | 0.0503 | |
| 0.0449 | 0.0452 | 0.0107 | 0.0240 | 0.0654 | |
| 0.8482 | 0.8483 | 0.0139 | 0.8207 | 0.8737 | |
| 0.8058 | 0.8060 | 0.0200 | 0.7676 | 0.8446 | |
| 0.0325 | 0.0325 | 0.0030 | 0.0266 | 0.0383 | |
| 0.8742 | 0.8744 | 0.0162 | 0.8428 | 0.9056 | |
| 0.0428 | 0.0427 | 0.0032 | 0.0366 | 0.0491 |
| Parameter | DS2 | DS3 | |||||
|---|---|---|---|---|---|---|---|
| Mean | 2.5% | 97.5% | Mean | 2.5% | 97.5% | ||
| 0.0871 | 0.0325 | 0.1398 | 0.0598 | 0.0081 | 0.1094 | ||
| 0.0742 | −0.0073 | 0.1589 | 0.0017 | −0.0931 | 0.0911 | ||
| −0.0331 | −0.0915 | 0.0291 | −0.1103 | −0.1858 | −0.0376 | ||
| −0.0299 | −0.0563 | −0.0035 | 0.0115 | −0.0181 | 0.0395 | ||
| −0.1255 | −0.2212 | −0.0305 | −0.2095 | −0.3419 | −0.0754 | ||
| −0.0393 | −0.0947 | 0.0168 | 0.0721 | 0.0058 | 0.1372 | ||
| 0.0514 | 0.0218 | 0.0787 | 0.0471 | 0.0203 | 0.0728 | ||
| 0.0270 | −0.0346 | 0.0860 | 0.0342 | −0.0222 | 0.0882 | ||
| −0.0372 | −0.0857 | 0.0130 | −0.0299 | −0.0829 | 0.0255 | ||
| −0.0094 | −0.0241 | 0.0043 | −0.0155 | −0.0336 | 0.0018 | ||
| −0.0181 | −0.1160 | 0.0778 | −0.1706 | −0.2781 | −0.0684 | ||
| −0.0553 | −0.1000 | −0.0091 | 0.0213 | −0.0304 | 0.0708 | ||
| −0.5351 | −0.5778 | −0.4536 | −0.5601 | −0.5769 | −0.5315 | ||
| 0.6238 | 0.5814 | 0.6569 | 0.6208 | 0.5852 | 0.6668 | ||
| 6.8541 | 5.6768 | 8.3212 | 8.9290 | 7.2431 | 10.8435 | ||
| 5.1780 | 4.4976 | 6.0264 | 6.1178 | 5.2628 | 7.0598 | ||
| 0.8877 | 0.8006 | 0.9790 | 0.8202 | 0.7953 | 0.8431 | ||
| 0.2767 | 0.1298 | 0.3908 | 0.5443 | 0.4328 | 0.6347 | ||
| d | 1.0000 | 1.0000 | 1.0000 | 1.0000 | 1.0000 | 1.0000 | |
| 0.0210 | 0.0145 | 0.0312 | 0.0276 | 0.0174 | 0.0395 | ||
| 0.0115 | 0.0018 | 0.0233 | 0.0148 | 0.0017 | 0.0302 | ||
| 0.0989 | 0.0840 | 0.1132 | 0.1115 | 0.0978 | 0.1253 | ||
| 0.9337 | 0.9178 | 0.9441 | 0.9221 | 0.9013 | 0.9384 | ||
| 0.0142 | 0.0100 | 0.0188 | 0.0169 | 0.0125 | 0.0216 | ||
| 0.0164 | 0.0040 | 0.0305 | 0.0224 | 0.0124 | 0.0336 | ||
| 0.2234 | 0.1814 | 0.2657 | 0.2727 | 0.2426 | 0.2999 | ||
| 0.8368 | 0.8118 | 0.8592 | 0.8261 | 0.8047 | 0.8456 | ||
| 0.0424 | 0.0202 | 0.0703 | 0.1096 | 0.0734 | 0.1484 | ||
| 0.0313 | 0.0118 | 0.0512 | 0.0653 | 0.0401 | 0.0927 | ||
| 0.0481 | 0.0309 | 0.0654 | 0.0472 | 0.0247 | 0.0692 | ||
| 0.9356 | 0.9073 | 0.9562 | 0.8704 | 0.8372 | 0.8974 | ||
| 0.0366 | 0.0206 | 0.0550 | 0.0165 | 0.0020 | 0.0358 | ||
| 0.0533 | 0.0424 | 0.0653 | 0.0540 | 0.0423 | 0.0667 | ||
| 0.0381 | 0.0242 | 0.0525 | 0.0996 | 0.0756 | 0.1234 | ||
| 0.8506 | 0.8217 | 0.8776 | 0.8644 | 0.8381 | 0.8857 | ||
| 0.8311 | 0.7798 | 0.8711 | 0.3327 | 0.2778 | 0.3865 | ||
| 0.0599 | 0.0521 | 0.0683 | 0.1297 | 0.1155 | 0.1438 | ||
| 0.9266 | 0.9114 | 0.9419 | 0.9137 | 0.8977 | 0.9292 | ||
| 0.0254 | 0.0211 | 0.0297 | 0.0340 | 0.0294 | 0.0384 | ||
| Parameter | Mean | Med | Std | 2.5% | 97.5% |
|---|---|---|---|---|---|
| 0.0139 | 0.0128 | 0.0328 | −0.0493 | 0.0796 | |
| −0.0248 | −0.0279 | 0.0584 | −0.1333 | 0.0933 | |
| −0.0638 | −0.0663 | 0.0454 | −0.1448 | 0.0290 | |
| −0.0370 | −0.0370 | 0.0170 | −0.0699 | −0.0039 | |
| −0.0100 | −0.0138 | 0.0797 | −0.1648 | 0.1542 | |
| −0.0657 | −0.0651 | 0.0375 | −0.1386 | 0.0053 | |
| 0.0338 | 0.0336 | 0.0153 | 0.0052 | 0.0658 | |
| 0.0179 | 0.0191 | 0.0347 | −0.0535 | 0.0869 | |
| −0.0217 | −0.0224 | 0.0298 | −0.0792 | 0.0379 | |
| −0.0050 | −0.0048 | 0.0122 | −0.0290 | 0.0201 | |
| −0.0261 | −0.0244 | 0.0592 | −0.1475 | 0.0836 | |
| −0.0072 | −0.0071 | 0.0274 | −0.0617 | 0.0481 | |
| −0.1680 | −0.1595 | 0.0222 | −0.2108 | −0.1405 | |
| 0.0179 | −0.0013 | 0.0449 | −0.0329 | 0.1243 | |
| 8.7278 | 8.6580 | 0.9039 | 7.0614 | 10.6549 | |
| 7.3638 | 7.3355 | 0.6199 | 6.1993 | 8.6153 | |
| 0.8502 | 0.8501 | 0.0134 | 0.8239 | 0.8759 | |
| 0.2581 | 0.3011 | 0.2326 | −0.3197 | 0.5698 | |
| d | 1.0000 | 1.0000 | 0.2326 | 1.0000 | 1.0000 |
| 0.0817 | 0.0813 | 0.0043 | 0.0742 | 0.0902 | |
| 0.1243 | 0.1244 | 0.0087 | 0.1066 | 0.1415 | |
| 0.0092 | 0.0093 | 0.0032 | 0.0026 | 0.0153 | |
| 0.8724 | 0.8728 | 0.0096 | 0.8534 | 0.8916 | |
| 0.0036 | 0.0035 | 0.0014 | 0.0009 | 0.0065 | |
| 0.0201 | 0.0202 | 0.0050 | 0.0106 | 0.0300 | |
| 0.0037 | 0.0033 | 0.0025 | 0.0002 | 0.0093 | |
| 0.8448 | 0.8448 | 0.0102 | 0.8237 | 0.8635 | |
| 0.1986 | 0.1975 | 0.0243 | 0.1490 | 0.2492 | |
| 0.0886 | 0.0880 | 0.0086 | 0.0732 | 0.1066 | |
| 0.0310 | 0.0309 | 0.0124 | 0.0083 | 0.0555 | |
| 0.9002 | 0.9015 | 0.0140 | 0.8686 | 0.9248 | |
| 0.0435 | 0.0425 | 0.0146 | 0.0150 | 0.0726 | |
| 0.0422 | 0.0420 | 0.0058 | 0.0314 | 0.0536 | |
| 0.0123 | 0.0123 | 0.0052 | 0.0029 | 0.0232 | |
| 0.8589 | 0.8595 | 0.0133 | 0.8316 | 0.8816 | |
| 0.6106 | 0.6104 | 0.0155 | 0.5806 | 0.6422 | |
| 0.0407 | 0.0407 | 0.0036 | 0.0338 | 0.0477 | |
| 0.9163 | 0.9179 | 0.0158 | 0.8818 | 0.9403 | |
| 0.0503 | 0.0504 | 0.0046 | 0.0425 | 0.0584 |
| Parameter | DS1 | DS2 | DS3 | ||||||||
|---|---|---|---|---|---|---|---|---|---|---|---|
| Mean | 2.5% | 97.5% | Mean | 2.5% | 97.5% | Mean | 2.5% | 97.5% | |||
| 0.0139 | 0.0328 | −0.0493 | 0.0476 | −0.0161 | 0.1136 | 0.0753 | 0.0219 | 0.1301 | |||
| −0.0248 | 0.0584 | −0.1333 | 0.0654 | −0.0425 | 0.1699 | 0.0267 | −0.0725 | 0.1215 | |||
| −0.0638 | 0.0454 | 0.0454 | −0.0579 | −0.1326 | 0.0212 | −0.1049 | −0.1784 | −0.0299 | |||
| −0.0370 | 0.0170 | 0.0170 | −0.0376 | −0.0600 | −0.0135 | 0.0060 | −0.0227 | 0.0332 | |||
| −0.0100 | 0.0797 | 0.0797 | −0.1247 | −0.2361 | −0.0108 | −0.1902 | −0.3188 | −0.0611 | |||
| −0.0657 | 0.0375 | 0.0375 | −0.0581 | −0.1167 | 0.0016 | 0.0550 | −0.0102 | 0.1181 | |||
| 0.0338 | 0.0153 | 0.0153 | 0.0413 | 0.0084 | 0.0738 | 0.0418 | 0.0107 | 0.0692 | |||
| 0.0179 | 0.0347 | 0.0347 | 0.0046 | −0.0635 | 0.0696 | 0.0309 | −0.0239 | 0.0867 | |||
| −0.0217 | 0.0298 | 0.0298 | −0.0236 | −0.0837 | 0.0270 | −0.0236 | −0.0732 | 0.0309 | |||
| −0.0050 | 0.0122 | 0.0122 | −0.0063 | −0.0226 | 0.0099 | −0.0117 | −0.0292 | 0.0059 | |||
| −0.0261 | 0.0592 | 0.0592 | 0.0158 | −0.0893 | 0.1169 | −0.1659 | −0.2692 | −0.0598 | |||
| −0.0072 | 0.0274 | 0.0274 | −0.0475 | −0.0951 | −0.0029 | 0.0314 | −0.0202 | 0.0814 | |||
| −0.1680 | 0.0222 | 0.0222 | −0.2019 | −0.2123 | −0.1811 | −0.5473 | −0.5747 | −0.4611 | |||
| 0.0179 | 0.0449 | 0.0449 | 0.0524 | −0.0385 | 0.1507 | 0.6111 | 0.5527 | 0.6559 | |||
| 8.7278 | 0.9039 | 0.9039 | 6.8073 | 5.5809 | 8.3232 | 8.9350 | 7.3051 | 10.8176 | |||
| 7.3638 | 0.6199 | 0.6199 | 5.2143 | 4.5484 | 5.9952 | 6.0211 | 5.1460 | 7.0315 | |||
| 0.8502 | 0.0134 | 0.0134 | 0.9172 | 0.8269 | 0.9912 | 0.8109 | 0.7864 | 0.8350 | |||
| 0.2581 | 0.2326 | 0.2326 | −0.4946 | −0.9541 | 0.0104 | 0.4795 | 0.0228 | 0.6653 | |||
| d | 1.0000 | 0.2326 | 0.2326 | 1.0000 | 1.0000 | 1.0000 | 1.0000 | 1.0000 | 1.0000 | ||
| 0.0817 | 0.0043 | 0.0043 | 0.0604 | 0.0510 | 0.0712 | 0.0486 | 0.0357 | 0.0637 | |||
| 0.1243 | 0.0087 | 0.0087 | 0.1046 | 0.0899 | 0.1219 | 0.1214 | 0.1067 | 0.1380 | |||
| 0.0092 | 0.0032 | 0.0032 | 0.0077 | 0.0006 | 0.0159 | 0.0077 | 0.0003 | 0.0228 | |||
| 0.8724 | 0.0096 | 0.0096 | 0.8916 | 0.8704 | 0.9085 | 0.8748 | 0.8573 | 0.8916 | |||
| 0.0036 | 0.0014 | 0.0014 | 0.0033 | 0.0007 | 0.0067 | 0.0194 | 0.0144 | 0.0249 | |||
| 0.0201 | 0.0050 | 0.0050 | 0.0159 | 0.0050 | 0.0275 | 0.0318 | 0.0186 | 0.0472 | |||
| 0.0037 | 0.0025 | 0.0025 | 0.0035 | 0.0005 | 0.0066 | 0.0025 | 0.0003 | 0.0049 | |||
| 0.8448 | 0.0102 | 0.0102 | 0.8628 | 0.8411 | 0.8832 | 0.8427 | 0.8174 | 0.8655 | |||
| 0.1986 | 0.0243 | 0.0243 | 0.0685 | 0.0457 | 0.0938 | 0.1229 | 0.0857 | 0.1593 | |||
| 0.0886 | 0.0086 | 0.0086 | 0.0742 | 0.0578 | 0.0945 | 0.1115 | 0.0883 | 0.1343 | |||
| 0.0310 | 0.0124 | 0.0124 | 0.0127 | 0.0032 | 0.0231 | 0.0149 | 0.0031 | 0.0279 | |||
| 0.9002 | 0.0140 | 0.0140 | 0.9164 | 0.8854 | 0.9391 | 0.8462 | 0.8143 | 0.8775 | |||
| 0.0435 | 0.0146 | 0.0146 | 0.0214 | 0.0037 | 0.0417 | 0.0176 | 0.0025 | 0.0381 | |||
| 0.0422 | 0.0058 | 0.0058 | 0.0539 | 0.0424 | 0.0664 | 0.0650 | 0.0549 | 0.0769 | |||
| 0.0123 | 0.0052 | 0.0052 | 0.0058 | 0.0006 | 0.0122 | 0.0061 | 0.0012 | 0.0119 | |||
| 0.8589 | 0.0133 | 0.0133 | 0.8709 | 0.8462 | 0.8923 | 0.8766 | 0.8514 | 0.8970 | |||
| 0.6106 | 0.0155 | 0.0155 | 0.8121 | 0.7590 | 0.8588 | 0.3322 | 0.2221 | 0.4398 | |||
| 0.0407 | 0.0036 | 0.0036 | 0.0636 | 0.0492 | 0.0774 | 0.1214 | 0.0944 | 0.1499 | |||
| 0.9163 | 0.0158 | 0.0158 | 0.9664 | 0.9447 | 0.9801 | 0.9279 | 0.8839 | 0.9620 | |||
| 0.0503 | 0.0046 | 0.0046 | 0.0124 | 0.0037 | 0.0221 | 0.0340 | 0.0226 | 0.0447 | |||
| Parameter | DS1 | DS2 | DS3 | |||||
|---|---|---|---|---|---|---|---|---|
| Statistic | p-Value | Statistic | p-Value | Statistic | p-Value | |||
| −0.0597 | 0.9524 | −0.8079 | 0.4192 | −0.0636 | 0.9493 | |||
| −0.1791 | 0.8579 | −0.3346 | 0.7379 | −0.0162 | 0.9870 | |||
| 1.3573 | 0.1747 | −1.5891 | 0.1120 | −0.2181 | 0.8274 | |||
| 0.7764 | 0.4375 | 1.7514 | 0.0799 | −0.4235 | 0.6720 | |||
| 0.5771 | 0.5639 | −2.2308 | 0.0257 | −0.0380 | 0.9697 | |||
| 0.6501 | 0.5156 | 1.8316 | 0.0670 | −0.7052 | 0.4807 | |||
| 1.8243 | 0.0681 | 0.4597 | 0.6457 | −0.7424 | 0.4579 | |||
| 1.5591 | 0.1190 | 1.8774 | 0.0605 | −0.6209 | 0.5346 | |||
| 0.1958 | 0.8448 | −0.6016 | 0.5474 | −0.9727 | 0.3307 | |||
| −1.1547 | 0.2482 | 1.5224 | 0.1279 | 0.3103 | 0.7564 | |||
| 1.0562 | 0.2909 | −1.2477 | 0.2121 | −0.5624 | 0.5738 | |||
| −1.9255 | 0.0542 | −0.6378 | 0.5236 | −0.0487 | 0.9611 | |||
| −1.1629 | 0.2449 | −2.8326 | 0.0046 | 1.8200 | 0.0688 | |||
| −0.2210 | 0.8251 | 0.2319 | 0.8166 | 1.0950 | 0.2735 | |||
| −1.1139 | 0.2653 | −0.9501 | 0.3421 | 0.9806 | 0.3268 | |||
| −1.6291 | 0.1033 | 0.0019 | 0.9985 | 0.1521 | 0.8791 | |||
| −0.7965 | 0.4258 | 1.1421 | 0.2534 | −1.6976 | 0.0896 | |||
| 1.2195 | 0.2227 | −0.9170 | 0.3591 | 1.2624 | 0.2068 | |||
| −0.9039 | 0.3660 | −0.3661 | 0.7143 | 0.0221 | 0.9824 | |||
| 0.9563 | 0.3389 | −1.2333 | 0.2174 | 0.1894 | 0.8498 | |||
| −1.3752 | 0.1691 | 1.0816 | 0.2794 | 1.2501 | 0.2113 | |||
| −0.0239 | 0.9809 | −0.4108 | 0.6813 | −0.8739 | 0.3822 | |||
| 0.2948 | 0.7682 | −0.4945 | 0.6209 | 0.4263 | 0.6699 | |||
| 0.0896 | 0.9286 | −2.0540 | 0.0400 | −0.2839 | 0.7765 | |||
| −0.0769 | 0.9387 | 0.9074 | 0.3642 | 1.8353 | 0.0665 | |||
| −0.4204 | 0.6742 | −0.8867 | 0.3753 | 0.3284 | 0.7426 | |||
| 1.6858 | 0.0918 | 0.6269 | 0.5307 | −1.2515 | 0.2107 | |||
| −0.8687 | 0.3850 | 1.4275 | 0.1534 | −1.1246 | 0.2608 | |||
| 1.2312 | 0.2182 | −0.6642 | 0.5066 | 0.7641 | 0.4448 | |||
| −1.3606 | 0.1736 | −0.5054 | 0.6133 | 0.5095 | 0.6104 | |||
| 0.0002 | 0.9999 | 0.4037 | 0.6864 | −0.1893 | 0.8499 | |||
| −1.6979 | 0.0895 | 0.6527 | 0.5139 | −0.6733 | 0.5008 | |||
| 1.2623 | 0.2068 | 1.0262 | 0.3048 | −0.4108 | 0.6812 | |||
| 0.0031 | 0.9975 | −1.2335 | 0.2174 | 1.0696 | 0.2848 | |||
| −1.0077 | 0.3136 | 0.2864 | 0.7746 | −0.2729 | 0.7850 | |||
| 0.2581 | 0.7963 | −0.6037 | 0.5460 | 0.1467 | 0.8834 | |||
| 0.6031 | 0.5465 | 0.4883 | 0.6253 | −1.0627 | 0.2879 | |||
| 0.4767 | 0.6336 | −1.0663 | 0.2863 | 1.9815 | 0.0475 | |||
| Parameter | DS1 | DS2 | DS3 | |||||
|---|---|---|---|---|---|---|---|---|
| Statistic | p-Value | Statistic | p-Value | Statistic | p-Value | |||
| −0.2382 | 0.8117 | 0.8946 | 0.3710 | 0.4246 | 0.6711 | |||
| −0.5397 | 0.5894 | 0.4807 | 0.6308 | 0.2105 | 0.8332 | |||
| −0.3970 | 0.6914 | 1.0016 | 0.3165 | 0.4172 | 0.6765 | |||
| 0.3031 | 0.7618 | −0.4317 | 0.6659 | −0.0186 | 0.9852 | |||
| −0.9387 | 0.3479 | 0.0066 | 0.9947 | 0.6520 | 0.5144 | |||
| 0.6678 | 0.5043 | 0.3082 | 0.7579 | −0.0690 | 0.9450 | |||
| −0.8183 | 0.4132 | −1.0205 | 0.3075 | 1.2391 | 0.2153 | |||
| −1.3403 | 0.1802 | −0.6150 | 0.5386 | 0.8368 | 0.4027 | |||
| 0.9480 | 0.3431 | 0.5433 | 0.5869 | −0.8564 | 0.3918 | |||
| 0.3792 | 0.7045 | 0.1913 | 0.8483 | −0.3520 | 0.7248 | |||
| 1.0261 | 0.3048 | −0.1062 | 0.9154 | 0.2221 | 0.8242 | |||
| −0.1441 | 0.8854 | 0.2735 | 0.7845 | −0.6287 | 0.5295 | |||
| 0.1648 | 0.8691 | −2.0563 | 0.0398 | 0.5816 | 0.5608 | |||
| −0.6512 | 0.5149 | 0.4157 | 0.6777 | −0.8724 | 0.3830 | |||
| −0.0228 | 0.9818 | −0.6572 | 0.5110 | −0.1623 | 0.8711 | |||
| 0.2329 | 0.8159 | −0.3896 | 0.6969 | −0.7089 | 0.4784 | |||
| −0.6398 | 0.5223 | 0.4073 | 0.6838 | −0.3435 | 0.7312 | |||
| 0.5406 | 0.5888 | 0.3116 | 0.7554 | 0.3015 | 0.7630 | |||
| −0.2259 | 0.8213 | 0.5642 | 0.5726 | −1.3067 | 0.1913 | |||
| 0.1495 | 0.8811 | 0.8659 | 0.3866 | 0.5879 | 0.5566 | |||
| 0.9298 | 0.3525 | −0.2060 | 0.8368 | −1.9950 | 0.0460 | |||
| −0.1064 | 0.9153 | −0.6188 | 0.5360 | −0.2741 | 0.7840 | |||
| −0.2187 | 0.8269 | 0.0908 | 0.9277 | 0.6828 | 0.4947 | |||
| −0.6417 | 0.5211 | 0.0376 | 0.9700 | 0.8227 | 0.4107 | |||
| 0.2499 | 0.8027 | 1.5369 | 0.1243 | 0.7921 | 0.4283 | |||
| 0.5778 | 0.5634 | −0.9276 | 0.3536 | −1.1088 | 0.2675 | |||
| 0.0092 | 0.9927 | −0.4402 | 0.6598 | 0.2285 | 0.8193 | |||
| 0.8557 | 0.3922 | −1.3612 | 0.1734 | 0.3195 | 0.7494 | |||
| −1.1870 | 0.2352 | −0.9613 | 0.3364 | 0.8448 | 0.3982 | |||
| −0.7819 | 0.4343 | 1.3219 | 0.1862 | −0.0380 | 0.9697 | |||
| −0.9052 | 0.3654 | −0.1715 | 0.8638 | 1.4796 | 0.1390 | |||
| −0.8971 | 0.3697 | 0.0572 | 0.9544 | 0.3983 | 0.6904 | |||
| 1.0325 | 0.3018 | −0.1454 | 0.8844 | −0.6278 | 0.5301 | |||
| 0.7220 | 0.4703 | 0.1081 | 0.9139 | −0.9705 | 0.3318 | |||
| −0.1814 | 0.8561 | 0.5558 | 0.5783 | 0.3816 | 0.7028 | |||
| 2.2145 | 0.0268 | −0.3652 | 0.7150 | −1.0568 | 0.2906 | |||
| −0.9347 | 0.3500 | −0.4136 | 0.6792 | −0.0394 | 0.9686 | |||
| 0.6555 | 0.5121 | 1.1169 | 0.2640 | −1.2179 | 0.2233 | |||
| BHAR(1)–GJR–GARCH(1,1) | BHAR(1)–QGARCH(1,1) | BHAR(1)–GARCH(1,1) | |||||||||||||||
|---|---|---|---|---|---|---|---|---|---|---|---|---|---|---|---|---|---|
| 1% | p-Value | 1% | p-Value | 1% | p-Value | ||||||||||||
| No | VRate | UC | CC | No | VRate | UC | CC | No | VRate | UC | CC | ||||||
| DS1 | |||||||||||||||||
| S&P500 | 6 | 2.00% | 0.125 | 0.273 | 8 | 2.67% | 0.016 | 0.044 | 8 | 2.67% | 0.016 | 0.045 | |||||
| GS | 1 | 0.33% | 0.178 | 0.402 | 1 | 0.33% | 0.178 | 0.401 | 4 | 1.33% | 0.016 | 0.045 | |||||
| DS2 | |||||||||||||||||
| S&P500 | 6 | 2.00% | 0.125 | 0.273 | 8 | 2.67% | 0.016 | 0.045 | 8 | 2.67% | 0.016 | 0.044 | |||||
| ICE | 1 | 0.33% | 0.178 | 0.401 | 1 | 0.33% | 0.178 | 0.402 | 4 | 1.33% | 0.581 | 0.813 | |||||
| DS3 | |||||||||||||||||
| S&P500 | 7 | 2.33% | 0.048 | 0.119 | 6 | 2.00% | 0.125 | 0.273 | 9 | 3.00% | 0.005 | 0.015 | |||||
| BAC | 2 | 0.67% | 0.537 | 0.815 | 2 | 0.67% | 0.537 | 0.815 | 2 | 0.67% | 0.537 | 0.815 | |||||
| BHAR(1)–GJR–GARCH(1,1) | BHAR(1)–QGARCH(1,1) | BHAR(1)–GARCH(1,1) | |||||||||||||||
|---|---|---|---|---|---|---|---|---|---|---|---|---|---|---|---|---|---|
| 5% | p-Value | 5% | p-Value | 5% | p-Value | ||||||||||||
| No | VRate | UC | CC | No | VRate | UC | CC | No | VRate | UC | CC | ||||||
| DS1 | |||||||||||||||||
| S&P500 | 17 | 5.67% | 0.604 | 0.313 | 17 | 5.67% | 0.604 | 0.313 | 17 | 5.67% | 0.604 | 0.873 | |||||
| GS | 16 | 5.33% | 0.793 | 0.507 | 14 | 4.67% | 0.789 | 0.344 | 16 | 5.33% | 0.793 | 0.507 | |||||
| DS2 | |||||||||||||||||
| S&P500 | 17 | 5.67% | 0.604 | 0.313 | 17 | 5.67% | 0.604 | 0.313 | 17 | 5.67% | 0.604 | 0.873 | |||||
| ICE | 16 | 5.33% | 0.793 | 0.507 | 14 | 4.67% | 0.789 | 0.344 | 16 | 5.33% | 0.793 | 0.507 | |||||
| DS3 | |||||||||||||||||
| S&P500 | 18 | 6.00% | 0.44 | 0.739 | 17 | 5.67% | 0.604 | 0.313 | 16 | 5.33% | 0.793 | 0.391 | |||||
| BAC | 13 | 4.33% | 0.588 | 0.478 | 13 | 4.33% | 0.588 | 0.478 | 11 | 3.67% | 0.267 | 0.355 | |||||
| DS1 | DS2 | DS3 | ||||
|---|---|---|---|---|---|---|
| At 1% | ||||||
| BHAR(1)–GJR–GARCH(1,1) | 1.855 | 1.855 | 2.953 | |||
| BHAR(1)–QGARCH(1,1) | 1.870 | 1.870 | 2.941 | |||
| BHAR(1)–GARCH(1,1) | 2.055 | 2.055 | 2.960 | |||
| At 5% | ||||||
| BHAR(1)–GJR–GARCH(1,1) | 1.195 | 1.195 | 1.693 | |||
| BHAR(1)–QGARCH(1,1) | 1.253 | 1.253 | 1.664 | |||
| BHAR(1)–GARCH(1,1) | 1.401 | 1.401 | 1.830 |
Disclaimer/Publisher’s Note: The statements, opinions and data contained in all publications are solely those of the individual author(s) and contributor(s) and not of MDPI and/or the editor(s). MDPI and/or the editor(s) disclaim responsibility for any injury to people or property resulting from any ideas, methods, instructions or products referred to in the content. |
© 2025 by the author. Licensee MDPI, Basel, Switzerland. This article is an open access article distributed under the terms and conditions of the Creative Commons Attribution (CC BY) license (https://creativecommons.org/licenses/by/4.0/).
Share and Cite
Than, H.T. Forecasting with a Bivariate Hysteretic Time Series Model Incorporating Asymmetric Volatility and Dynamic Correlations. Entropy 2025, 27, 771. https://doi.org/10.3390/e27070771
Than HT. Forecasting with a Bivariate Hysteretic Time Series Model Incorporating Asymmetric Volatility and Dynamic Correlations. Entropy. 2025; 27(7):771. https://doi.org/10.3390/e27070771
Chicago/Turabian StyleThan, Hong Thi. 2025. "Forecasting with a Bivariate Hysteretic Time Series Model Incorporating Asymmetric Volatility and Dynamic Correlations" Entropy 27, no. 7: 771. https://doi.org/10.3390/e27070771
APA StyleThan, H. T. (2025). Forecasting with a Bivariate Hysteretic Time Series Model Incorporating Asymmetric Volatility and Dynamic Correlations. Entropy, 27(7), 771. https://doi.org/10.3390/e27070771