Abstract
The perception in pair trading is to recognize that when two stocks move together, their prices will converge to a mean value in the future. However, finding the mean-reverted point at which the value of the pair will converge as well as the optimal boundaries of the trade is not easy, as uncertainty and model misspecifications may lead to losses. To cater to these problems, this study employed a novel entropic approach that utilizes entropy as a penalty function for the misspecification of the model. The use of entropy as a measure of risk in pair trading is a nascent idea, and this study utilized daily data for 64 companies listed on the PSX for the years 2017, 2018, and 2019 to compute their returns based on the entropic approach. The returns to these stocks were then evaluated and compared with the buy and hold strategy. The results show positive and significant returns from pair trading using an entropic approach. The entropic approach seems to have an edge to buy and hold, distance-based, and machine learning approaches in the context of the Pakistani market.
1. Introduction
According to quantitative models, pair trading involves a driving mechanism for mean reversions using a statistical arbitrage strategy. The perception is to recognize that when two stocks move together, their prices will converge to a mean value in the future [1]. Mean reversion allows traders to make a profit by matching a long position in one stock with an offsetting position in another stock [2]. Pair trading is an efficient method for the formation of portfolios or pair trading [3,4]; however, finding the accurate pairs and boundary points is not an easy task.
The profitability of pair trading decreased due to an increasing share of non-converging pairs [5]. To resolve the issue of non-converging pairs, several researchers contributed to the literature [6,7,8,9] and proposed cointegration as the most efficient solution for structuring pair trading [10].
After settling on how to find accurate pairs, the problem arose of how to find the mean-reverted point between them and how to identify the boundaries for when exactly the investors can buy or sell any asset. Yoshikawa [11] derived the entropy-based optimal boundary points for pair trading using Tokyo Stock Exchange 2015 data. The proposed approach for the optimal stopping problem is motivated by the work of Ekström et al. [12] and Suzuki [13]. This method is based on maximizing profit via pair trading and minimizing the relative entropy (risk). This is a robust method, as it directly tackles model misspecification [14] and provides a more persuasive solution. The choice of pairs is made through cointegration, the most effective way to identify stocks that move together [15]. Entropy has a wide application in finance as well [16,17,18].
In the context of Pakistan, there was a handful of studies conducted on pair trading [19,20], and interestingly, no one has yet considered the optimal stopping problem using stocks listed on the Pakistan Stock Exchange (PSX). This study employs the novel entropic approach proposed by Yoshikawa [11] to explore the optimal boundary points that yield the maximum profit for 64 companies listed on PSX for the period 2017–2019. The concept of maximizing the profit in pair trading based on relative entropy is a nascent idea in the literature, and this study is the first attempt in the context of Pakistan. The performance of this entropic approach is compared with the buy and hold strategy in terms of returns.
2. Data & Methodology
As mentioned in the last section, this study utilized the daily data for 64 companies listed on PSX for the years 2017, 2018, and 2019. These companies cover the major sectors, including cement, chemical, automobile assembler, food and personal care products, oil and gas marketing companies, oil and gas exploration companies, power generation and distribution, refinery, and pharmaceuticals. The firms’ selection criterion was based on year-wise price earnings ratios (PER); a firm with a PER lower than the sample median value was selected in the sample. The underlying idea is that the stock below the median PER is undervalued and signifies potential for higher returns [21,22]. The choice of pairs was made through Johansen cointegration, which is the most effective way to identify stocks that move together [15]. In each year, we formulated all pairs of the selected stocks and assessed each pair for cointegration.
Keeping in view the potential jumps/structural breaks in high-frequency financial data [23], the following breakpoint unit root test proposed by Bai and Perron [24] was employed.
where is white noise.
3. Ornstein–Uhlenbeck (OU) Process
Pair trading utilizes the mean reversion of the composite process of two stocks. Following Yoshikawa [11], we considered the Ornstein-Uhlenbeck (OU) process such that
where and are the positive constants, is the mean-reversion point, and is the p-Brownian motion. Let . Then, Equation (2) implies:
The optimal stopping problem at time t for the process is defined as follows:
where is the set of all stopping points of B, and is the discount rate. The solution of Equation (4) gives us the trading strategy: we short pair X when it attains the highest value and liquidate it when X attains zero value. These values are specified by the above equation. Alternatively, we take the long position for X for zero value and liquidate it for the highest value. The superscript S in Equation (4) is the solution to the following:
where is a positive constant and H(.) is a relative entropy defined as follows:
Thus, the optimal boundary b(t) for Equation (4) is given as:
where . Any investor holding pair X should liquidate when X touches b(t) and, if not holding X, should short their position when X touches b(t) and liquidate it when it reverts to mean zero.
4. Results and Discussion
From the eight selected sectors, we found 64 active firms listed on PSX for the years 2017, 2018, and 2019. After applying the PER benchmark, we got 33, 34, and 40 companies, respectively. Having selected the companies, the unit root test was applied to the time series data of these stocks to find the order of integration. All the time series are integrated of order one. This led us to find the cointegrated pairs using the Johansen cointegration test at 0.05 level of significance. We found 79 = (28 + 29 + 23 = 80 − 1) unique cointegrated pairs (one pair was repeated) out of 1869 = (528 + 561 + 780) pairs of the selected stocks in the 3-year period.
Having found the pairs, we applied the maximum likelihood method to find the parameters of the Ornstein–Uhlenbeck processes, and , as given in Equation (2). MATLAB R2021b was used for the coding and estimation of these parameters. However, to compute the optimal boundary points, we needed to find the parameters and as well. The parameter is the discount rate, and the parameter represents the level of confidence. The lower the value of the lower the confidence of the agent on the reference measure as a true probability measure among the class of all probability measures and vice versa. We used as per the annual report of State Bank of Pakistan for 2017, 2018, and 2019, respectively, and by following Yoshikawa [11], four cases for the parameter, and were considered. Table 1 and Table 2 present the results for only five pairs of stocks in each year involving the top listed companies (see Appendix A, Table A1, Table A2, Table A3, Table A4, Table A5, Table A6 and Table A7 for the results of other companies). After computing the values of and as furnished in Table 1, we estimated the rate of returns for different values of for the selected companies (Table 2). On balance, pair trading yielded optimal returns for lower values of , which is understandable, as the parameter lambda is linked with the penalty function. All the estimated parameter values are presented in Figure 1, Figure 2 and Figure 3 and in Table 2 for their respective years. From these figures, it Is evident that the values of the mean reversion parameter differ when the stocks in the pair are selected within the sector in comparison to when the stocks are selected across the sectors.

Table 1.
Ornstein–Uhlenbeck Process parameter estimation.
Table 2.
Rate of returns for different values of λ.
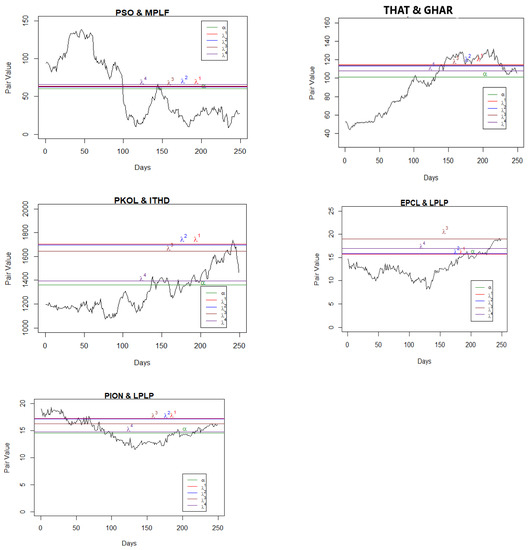
Figure 1.
Pair values, boundaries, and mean values for the pairs (2017). Note:λ1, λ2, λ3, & λ4 are the estimated paired stock values for the given confidence levels of the agent (see Table 2).
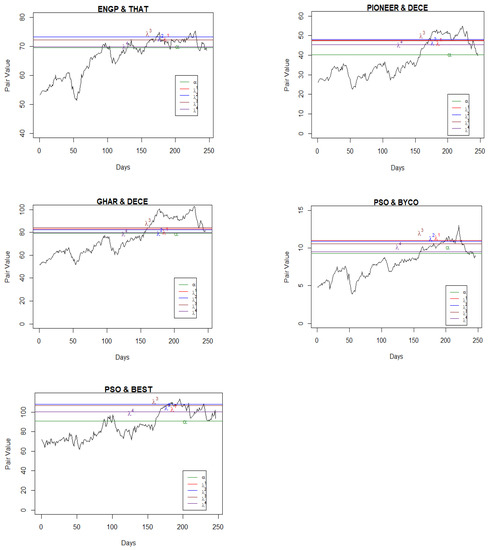
Figure 2.
Pair values, boundaries, and mean values for the pairs (2018).
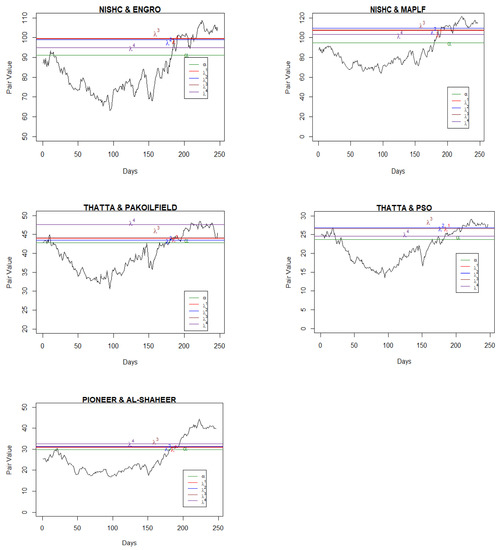
Figure 3.
Pair values, boundaries, and mean values for the pairs (2019).
For the real data sets, the pair trading strategy was to set the position when the pair value touches either the mean reverted point or the boundary. For example, in Figure 1 (pair: PSO and MPLF), the mean reversion point was 60.29 where we set the position, and we liquidated the position when the pair value touched the boundary b(t). If the position was set when the pair value touches the boundary, then it was liquidated when it touched the mean reversion point . In Figure 2 (pair: PSO and BYCO), if we set our position when the pair value touched the boundary then we would liquidate at the mean reversion point, α = 9.26. The next position was set when the pair value touched either the boundary b(t) or the mean reversion point and liquidated following the same rule.
Following this trading strategy, we estimated the rate of returns for the 80 unique pairs of the companies for the years 2017, 2018, and 2019. Gatev et al. [6] highlighted the transaction fee as an obstacle in trading. Because the transaction cost in the Pakistan Stock Exchange is 0.15 percent and we are dealing with pair trading, we discounted our return values by 0.3 percent. Table 2 provides these return values for five pairs from each year. The return values ranged from 0.2 to 25.2 percent for the year 2017, 0.4 to 19.5 percent for the year 2018, and 1.5 to 15.7 percent for the year 2019. All positive returns confirm profitable trades, which is line with the findings in the literature [1,11]. For all cointegrated pairs (Appendix A), average return values ranged from 2.9% to 18.5% which are much higher than the return values estimated in [25], which ranged from 0.1% to 1.71% using the distance-based approach for the stocks listed on the PSX during the period 2009–2016. Shaukat et al. (2021) employed the distance-based method to select the pairs and compute returns to pair trading for financial (banks) and non-financial (cement industries) sectors with a formation period of 12 months. Cement industries yielded higher returns, whereas the banks yielded lower returns. Sohail et al. [20] estimated the return on pair trading using 80 stocks from five different sectors: banking, chemicals, cement, textile, and food and care products, all of which were listed on the PSX from 2011 to 2019. Trading periods of two and one year were used for the machine learning algorithm (clustering algorithm) and distance-based methods, respectively. The study found a maximum return of 2.07 percent for the textile sector using the distance-based approach, whereas the clustering algorithm yielded a maximum return of 2.55 percent.
The distance-based approach relies on the average squared differences between the normalized prices of stocks, and principal component analysis (PCA) is used to generate the indices of the stocks that represent the weighted average prices of the stocks to be used in the machine algorithm. By construct, PCA indices resemble those generated with the cointegration technique; we found parameters such that the linear combination of the two stock prices, , yielded a stationary process, whereas the weights in PCA may not yield stationary indices. Further, both the studies [20,25] did not allow cross-sector pairing that might have caused their low returns in comparison with our study. The profitability of pair trading decreases due to non-convergence of the pairs [5], and cointegration is the most efficient method to explore converging pairs [10]. Thus, the entropic approach seems to have an edge over the distance-based and machine learning approaches in the context of the Pakistani market.
Further, to evaluate our results, we contrasted our results against the buy and hold strategy with trading periods of one quarter, annually, 2 years, and 3 years (Table 3). A trading period of one year is in line with the literature [20,25]. The rate of returns for the alternative strategy is summarized in Table 3. In general, except for 2019-Q4, the top-performing stocks made a loss for this strategy, whereas Table 2 shows pair trading provided stable profits. The buy and hold strategy has a considerable risk of human error considering the pressure of all the wrong choices one can make [26]. The optimization of the boundaries backed by the Ornstein–Uhlenbeck process allowed us to incorporate all risks, improve the profitability of pair trading, and receive maximum positive returns [27]. Therefore, we suggest the pair trading strategy while taking model uncertainty into account.
Table 3.
Rate of returns from the buy and hold strategy.
5. Conclusions
This study employed a novel entropic approach to explore the optimal boundary points that yield maximum profit for 64 companies listed on the Pakistan Stock Exchange (PSX) for the period 2017–2019. The concept of maximizing the profit in pair trading based on relative entropy is a nascent idea in literature, and this study is the first attempt to implement it in the context of Pakistan. The performance of this entropic approach is contrasted with the buy and hold strategy in terms of returns. The following are the key findings of the study.
- The values of the mean reversion parameter differ when the stocks in the pair are selected within the sector in comparison to when the stocks are selected across the sectors.
- On balance, optimal returns are associated with lower values of ; approximately, 84 percent pairs yielded optimal returns for low values of lambda ( .
- The return values based on entropic pair trading approached ranges from 0.2 to 25.2 percent for the year 2017, 0.4 to 19.5 percent for the year 2018, and 1.5 to 15.7 percent for the year 2019. These values are much higher than the returns estimated in [20,25].
- Based on the buy and hold strategy, all the top performing stocks make a loss.
- The entropic approach seems to have an edge over the buy and hold, distance-based, and machine learning approaches in the context of the Pakistani market.
Pair trading is an efficient method that allows maximization of profitability by eliminating short-term price deviations in favor of long-term historical pricing relationships. The entropy-based pair trading method yielded positive returns for all the cointegrated pairs tested and confirmed their profits, which is line with the findings in literature [1,11]. According to the efficient market hypothesis (EMH), an active investor cannot be more effective than the one who buys and holds. Therefore, the returns estimated from the entropic approach were contrasted against the returns estimated through the buy and hold strategy. The buy and hold strategy yielded negative returns, except for a few cases implying losses. Consequently, we suggest the pair trading strategy while taking model uncertainty into account.
Author Contributions
Methodology, T.U.I.; Software, T.U.I.; Validation, T.U.I.; Formal analysis, L.A.; Data curation, L.A.; Writing–original draft, L.A.; Writing–review & editing, T.U.I. All authors have read and agreed to the published version of the manuscript.
Funding
This research received no external funding.
Data Availability Statement
Data is available publicly at https://www.investing.com/.
Conflicts of Interest
The authors declare no conflict of interest.
Appendix A
Table A1.
2017 Ornstein–Uhlenbeck process parameters.
Table A1.
2017 Ornstein–Uhlenbeck process parameters.
| Pair Name | µ | α | σ |
|---|---|---|---|
| Fauji Food (FAUJ) and Pak State Oil (PSO) | 3.7 | 32.48 | 15.19 |
| Fauji Food (FAUJ) and Gharibwal Cement (GHAR) | 3.84 | 33.94 | 15.34 |
| Fauji Food (FAUJ) and National Refinery (NATR) | 3.11 | 24.63 | 14.63 |
| Fauji Food (FAUJ) and Engro Power Qadirpur LTD (ENGP) | 3.5 | 4.31 | 13.72 |
| Fauji Food (FAUJ) and Bestway Cement (BEST) | 3.29 | 41.38 | 15.74 |
| Fauji Food (FAUJ) and Dewan Cement LTD(DECE) | 3.8 | 36.58 | 15.89 |
| Fauji Food (FAUJ) and Ghani Automobile Industries LTD (GAIL) | 3.21 | 21.26 | 14.4 |
| Fauji Food (FAUJ) and Ittehad Chemicals LTD (ITHD) | 10.9 | 6.27 | 16.69 |
| Fauji Food (FAUJ) and Ghandhara Industries LTD (GHAN) | 4.06 | 32.23 | 15.1 |
| Fauji Food (FAUJ) and Power Cement LTD (POWE) | 3.99 | 30.8 | 14.84 |
| Fauji Food (FAUJ) and Pakistan Petroleum LTD (PPL) | 0.056 | 61.45 | 18.81 |
| Fauji Food (FAUJ) and Lalpir Power LTD (LPLP) | 3.6 | 56.36 | 18.76 |
| Pak State Oil (PSO) and Maple Leaf Cement LTD (MPLF) | 0.04 | 60.29 | 84.91 |
| Thata Cement (THAT) and Gharibwal Cement (GHAR) | 0.02 | 101.34 | 39.25 |
| Pak Oil Fields (PKOL) and Ittehad Chemicals LTD (ITHD) | 3.74 | 1361.72 | 474.89 |
| Gharibwal Cement and Ghandhara Industries LTD(GHAN) | 0.19 | 35.94 | 21.6 |
| Gharibwal Cement and Power Cement LTD (POWE) | 2.99 | 34.93 | 13.56 |
| National Refinery (NATR)and Dewan Cement LTD(DECE) | 3.22 | 72.22 | 24.43 |
| National Refinery (NATR) and Ittehad Chemicals LTD (ITHD) | 0.05 | 42.95 | 16.08 |
| National Refinery (NATR) and Lalipir Power LTD (LPLP) | 9.37 | 9.4 | 8.3 |
| Pioneer Cement (PION) and Lalipir Power LTD (LPLP) | 10.52 | 14.54 | 7.7 |
| Dewan Cement LTD (DECE) and Ittehad Chemicals LTD (ITHD) | 0.88 | 152.64 | 34.55 |
| Dewan Cement LTD (DECE) and Power Cement LTD (POWE) | 0 | 13.77 | 12.48 |
| Ittehad Chemicals LTD (ITHD) and Ghandhara Industries (GHAN) | 0.04 | 43.54 | 16.8 |
| Ittehad Chemicals LTD(ITHD) and Power Cement LTD (POWE) | 2.82 | 39.49 | 19.11 |
| Ittehad Chemicals LTD (ITHD) and Pakistan Petroleum (PPL) | 0.02 | 313.08 | 95.34 |
| Ittehad Chemicals LTD (ITHD) and Lalipir Power LTD (LPLP) | 0.01 | 55.73 | 18.22 |
| Engro Polymer and Chemical (EPCL) and Lalipir Power (LPLP) | 2.29 | 15.71 | 8.47 |
Table A2.
2017 rates of return at different λ.
Table A2.
2017 rates of return at different λ.
| Pair Name | λ = 0.001 | λ = 0.01 | λ= 0.1 | λ= +∞ |
|---|---|---|---|---|
| FAUJ and PSO | 0.060 | 0.059 | 0.048 | 0.007 |
| FAUJ and GHAR | 0.061 | 0.059 | 0.05 | 0.006 |
| FAUJ and NATR | 0.080 | 0.075 | 0.068 | 0.010 |
| FAUJ and ENGP | 1.522 | 1.525 | 1.294 | 0.358 |
| FAUJ and BEST | 0.001 | 0.001 | 0.000 | 0.010 |
| FAUJ and DECE | 0.055 | 0.055 | 0.043 | 0.004 |
| FAUJ and GAIL | 0.120 | 0.125 | 0.101 | 0.022 |
| FAUJ and ITHD | 1.046 | 0.910 | 0.630 | 0.075 |
| FAUJ and GHAN | 0.085 | 0.078 | 0.064 | 0.010 |
| FAUJ and POWE | 0.083 | 0.082 | 0.066 | 0.011 |
| FAUJ and PPL | 0.059 | 0.060 | 0.060 | 0.030 |
| FAUJ and LPLP | 0.051 | 0.047 | 0.041 | 0.006 |
| PSO and MPLF | 0.042 | 0.037 | 0.051 | 0.087 |
| THAT and GHAR | 0.132 | 0.12 | 0.122 | 0.065 |
| PKOL and ITHD | 0.252 | 0.246 | 0.206 | 0.023 |
| GHAR and GHAN | 0.044 | 0.045 | 0.031 | 0.048 |
| GHAR and POWE | 0.041 | 0.036 | 0.031 | 0.003 |
| NATR and DECE | 0.029 | 0.027 | 0.023 | 1.650 |
| NATR and ITHD | 0.216 | 0.218 | 0.201 | 0.172 |
| NATR and LPLP | 0.327 | 0.317 | 0.214 | 0.028 |
| PION and LPLP | 0.186 | 0.18 | 0.114 | 0.013 |
| DECE and ITHD | 0.041 | 0.04 | 0.043 | 0.011 |
| DECE and POWE | 0.077 | 0.086 | 0.081 | 0.020 |
| ITHD and GHAN | 0.216 | 0.234 | 0.232 | 0.191 |
| ITHD and POWE | 0.220 | 0.216 | 0.191 | 0.060 |
| ITHD and PPL | 0.051 | 0.044 | 0.034 | 0.032 |
| ITHD and LPLP | 0.079 | 0.095 | 0.077 | 0.065 |
| EPCL and LPLP | 0.002 | 0.006 | 0.208 | 0.080 |
Table A3.
2018 Ornstein–Uhlenbeck process parameters.
Table A3.
2018 Ornstein–Uhlenbeck process parameters.
| Pair Name | µ | α | σ |
|---|---|---|---|
| Nishat Chunnian Power LTD (NCPL) and Nishat Power LTD (NISH) | 0.060 | 62.870 | 19.110 |
| Nishat Chunnian Power LTD and Lotte Chemicals Pak LTD | 14.340 | 38.550 | 13.150 |
| Nishat Chunnian Power LTD and Dewan Cement LTD | 0.045 | 71.740 | 24.950 |
| Nishat Chunnian Power LTD and Byco Petroleum Pak LTD | 4.080 | 36.460 | 10.500 |
| Nishat Power LTD and Dewan Cement LTD | 0.020 | 67.290 | 53.350 |
| Nishat Power LTD and Byco Petroleum Pak LTD | 38.400 | 31.070 | 21.260 |
| Engro Power Generation QadirPur LTD (ENGP) and Thata Cement LTD | 6.590 | 69.440 | 16.430 |
| Engro Power Generation QadirPur LTD and Dewan Cement LTD | 0.020 | 60.270 | 18.600 |
| Attock Cement Pak LTD and Dewan Cement LTD | 3.620 | 45.500 | 17.340 |
| Honda Atlas Cars Pak LTD and Fauji Cement Company LTD | 1.950 | 827.500 | 312.410 |
| KOT Addu Power Company LTD and Bestway Cement LTD | 7.920 | 100.470 | 26.610 |
| KOT Addu Power Company LTD and Dewan Cement LTD | 11.980 | 33.310 | 17.050 |
| KOT Addu Power Company LTD and Byco Petroleum Pak LTD | 6.850 | 22.350 | 7.080 |
| Gharibwal Cement LTD and Dewan Cement LTD | 0.040 | 79.300 | 31.870 |
| Gharibwal Cement LTD and Fauji Cement Company LTD | 0.010 | 66.230 | 24.540 |
| Gharibwal Cement LTD and Byco Petroleum Pak LTD | 5.030 | 26.280 | 8.920 |
| Gharibwal Cement LTD and Quice Food Industries LTD | 5.700 | 16.540 | 6.240 |
| Ghandhara Nissan LTD (GHIN) and FAUJI Food LTD | 0.010 | 60.720 | 30.090 |
| Ghandhara Nissan LTD and Byco Petroleum Pak LTD | 5.720 | 16.810 | 6.670 |
| Pakistan State Oil Company LTD and Bestway Cement LTD | 0.020 | 90.700 | 50.780 |
| Pakistan State Oil Company LTD and Dewan Cement LTD | 2.950 | 24.090 | 14.430 |
| Pakistan State Oil Company LTD and Byco Petroleum Pak LTD | 5.370 | 9.260 | 5.250 |
| DYNEA Pak LTD and Dewan Cement LTD | 14.920 | 39.560 | 53.730 |
| Lotte Chemicals Pak LTD and Dewan Cement LTD | 5.910 | 21.390 | 11.330 |
| Lotte Chemicals Pak LTD and Byco Petroleum Pak LTD | 0.120 | 32.490 | 13.350 |
| Pioneer Cement LTD and Dewan Cement LTD | 0.130 | 40.140 | 19.140 |
| Millat Tractors LTD and Byco Petroleum Pak LTD | 6.190 | 29.740 | 9.060 |
| Dewan Cement LTD and Ghandhara Industries LTD | 6.360 | 14.350 | 17.310 |
| Ghandhara Industries LTD and Byco Petroleum Pak LTD | 6.360 | 19.660 | 7.390 |
Table A4.
2018 rates of return at different λ.
Table A4.
2018 rates of return at different λ.
| Pair Name | λ = 0.001 | λ = 0.01 | λ = 0.1 | λ = +∞ |
|---|---|---|---|---|
| NCPL and NISH | 0.058 | 0.049 | 0.062 | 0.028 |
| NCPL and LOTTE | 0.161 | 0.153 | 0.085 | 0.008 |
| NCPL and DECE | 0.128 | 0.128 | 0.125 | 0.097 |
| NCPL and BYCO | 0.014 | 0.013 | 0.010 | 0.006 |
| NISH and DECE | 0.090 | 0.094 | 0.080 | 0.065 |
| NISH and BYCO | 0.228 | 0.193 | 0.057 | 0.004 |
| ENGP and THAT | 0.055 | 0.054 | 0.040 | 0.004 |
| ENGP and DECE | 0.016 | 0.007 | 0.005 | 0.033 |
| ATTOC and DECE | 0.024 | 0.020 | 0.015 | 0.008 |
| HONDA and FAUJ | 0.273 | 0.274 | 0.244 | 0.051 |
| KOT and BEST | 0.077 | 0.074 | 0.052 | 0.005 |
| KOT and DECE | 0.177 | 0.167 | 0.102 | 0.009 |
| KOT and BYCO | 0.092 | 0.087 | 0.065 | 0.008 |
| GHAR and DECE | 0.050 | 0.038 | 0.064 | 0.006 |
| GHAR and FAUJ | 0.095 | 0.055 | 0.048 | 0.013 |
| GHAR and BYCO | 0.068 | 0.065 | 0.051 | 0.006 |
| GHAR and QUICE | 0.103 | 0.098 | 0.075 | 0.010 |
| GHIN and FAUJ | 0.010 | 0.109 | 0.010 | 0.036 |
| GHIN and BYCO | 0.111 | 0.106 | 0.079 | 0.011 |
| PSO and BEST | 0.177 | 0.192 | 0.175 | 0.103 |
| PSO and DECE | 0.072 | 0.064 | 0.057 | 0.003 |
| PSO and BYCO | 0.187 | 0.177 | 0.140 | 0.022 |
| DYNEA and DECE | 0.477 | 0.446 | 0.245 | 0.020 |
| LOTTE and DECE | 0.347 | 0.341 | 0.264 | 0.049 |
| LOTTE and BYCO | 0.084 | 0.055 | 0.059 | 0.027 |
| PION and DECE | 0.187 | 0.195 | 0.178 | 0.131 |
| MILLAT and BYCO | 0.078 | 0.074 | 0.055 | 0.007 |
| DECE and GHAN | 0.454 | 0.438 | 0.335 | 0.049 |
| GHAN and BYCO | 0.110 | 0.105 | 0.079 | 0.010 |
Table A5.
2019 Ornstein–Uhlenbeck process parameters.
Table A5.
2019 Ornstein–Uhlenbeck process parameters.
| Pair Name | µ | α | σ |
|---|---|---|---|
| Pakistan Refinery LTD and Oil & Gas Development CO LTD | 0.020 | 96.400 | 42.740 |
| Pakistan Refinery LTD and Ghani Automobile Industries LTD | 6.840 | 41.610 | 39.760 |
| National Refinery LTD and Pakistan Oilfields LTD | 0.040 | 670.990 | 208.610 |
| Nishat Chunnian Power LTD and Engro Polymer and Chemical LTD | 0.010 | 91.050 | 35.110 |
| Nishat Chunnian Power LTD and Pioneer Cement LTD | 0.780 | 26.860 | 11.540 |
| Nishat Chunnian Power LTD and Maple Leaf Cement Factory | 0.004 | 94.760 | 39.290 |
| Attock Refinery LTD and Attock Petroleum LTD | 0.030 | 644.640 | 233.200 |
| Dewan Farooque LTD and Descon Oxychem LTD | 0.001 | 36.770 | 21.570 |
| Dewan Farooque LTD and Cherat Cement Company LTD | 0.040 | 100.360 | 61.410 |
| Ittehad Chemicals LTD and Pak Suzuki Motors Company LTD | 0.110 | 40.210 | 19.010 |
| Thata Cement LTD and Pakistan State Oil Company LTD | 1.850 | 23.690 | 10.380 |
| Thata Cement LTD and Pakistan Oilfields LTD | 0.010 | 42.820 | 14.440 |
| Thata Cement LTD and Ghani Automobile Industries LTD | 0.006 | 24.430 | 8.140 |
| Descon Oxychem LTD and Pakistan Oilfields LTD | 0.010 | 588.420 | 191.100 |
| Cherat Cement Company LTD and Hi-Tech Lubricants LTD | 0.008 | 68.540 | 29.140 |
| Mari Petroleum Company LTD and Fauji Cement Company LTD | 0.240 | 29.100 | 10.630 |
| K Electric LTD and Fauji Cement Company LTD | 1.320 | 15.310 | 5.080 |
| Pakistan State Oil Company LTD and Pakistan Oilfields LTD | 0.009 | 580.660 | 192.900 |
| Pakistan Oilfields LTD and Honda Atlas Cars Pak LTD | 4.310 | 787.640 | 261.200 |
| Pakistan Oilfields LTD and Ghani Automobile Industries LTD | 0.070 | 629.090 | 165.800 |
| Fauji Cement Company LTD and Ghani Automobile Industries LTD | 0.260 | 28.410 | 10.400 |
| Pioneer Cement LTD and Al Shaheer Corporation LTD | 0.060 | 29.870 | 13.360 |
| Maple Leaf Cement Factory and Al Shaheer Corporation LTD | 0.050 | 29.550 | 13.300 |
Table A6.
2019 rates of return at different λ.
Table A6.
2019 rates of return at different λ.
| Pair Name | λ = 0.001 | λ = 0.01 | λ = 0.1 | λ = +∞ |
|---|---|---|---|---|
| PAKR and OG | 0.082 | 0.087 | 0.095 | 0.025 |
| PAKR and GAIL | 0.343 | 0.333 | 0.241 | 0.029 |
| NATR and PKOIL | 0.084 | 0.077 | 0.096 | 0.065 |
| NCPL and ENGRO | 0.094 | 0.087 | 0.091 | 0.041 |
| NCPL and PION | 0.207 | 0.202 | 0.199 | 0.115 |
| NCPL and MPLF | 0.131 | 0.157 | 0.135 | 0.089 |
| ATTOCR and ATTOCP | 0.211 | 0.187 | 0.202 | 0.027 |
| DEWAN and DESCON | 0.186 | 0.192 | 0.197 | 0.124 |
| DEWAN and CHERAT | 0.257 | 0.232 | 0.222 | 0.117 |
| ITHD and PAK SUZUKI | 0.147 | 0.155 | 0.135 | 0.097 |
| THAT and PSO | 0.131 | 0.132 | 0.121 | 0.039 |
| THAT and PKOIL | 0.024 | 0.015 | 0.03 | 0.111 |
| THAT and GAIL | 0.037 | 0.045 | 0.041 | 0.071 |
| DESCON and PKOIL | 0.023 | 0.01 | 0.016 | 0.064 |
| CHERAT and HITECH | 0.068 | 0.031 | 0.041 | 0.008 |
| MARI and FAUJ | 0.027 | 0.029 | 0.015 | 0.123 |
| KELEC and FAUJ | 0.009 | 0.007 | 0.007 | 0.009 |
| PSO and PKOIL | 0.103 | 0.025 | 0.037 | 0.103 |
| PKOIL and HONDA | 0.073 | 0.072 | 0.056 | 0.002 |
| PKOIL and GAIL | 0.086 | 0.087 | 0.1 | 0.009 |
| FAUJ and GAIL | 0.194 | 0.189 | 0.193 | 0.147 |
| PION and ALSHAHEER | 0.034 | 0.049 | 0.038 | 0.089 |
| MPLF and ALSHAHEER | 0.042 | 0.036 | 0.035 | 0.104 |
Table A7.
Returns based on buy and hold strategy.
Table A7.
Returns based on buy and hold strategy.
| 2017 | 2018 | 2019 | |||
|---|---|---|---|---|---|
| Company Names | Returns | Company Names | Returns | Company Names | Returns |
| Attock Cement | −44.90 | Attock Cement Pak LTD | −26.50 | Al Shaheer Corporation LTD | −40.43 |
| Attock Petroleum LTD | −24.60 | Attock Petroleum LTD | −1.74 | Attock Cement Pak LTD | −9.49 |
| Attock Refinery LTD | −45.33 | BestWay Cement LTD | −17.93 | Attock Petroleum LTD | −16.85 |
| Bestway cement | −52.19 | Byco Petroleum Pak LTD | −33.59 | Attock Refinery LTD | −23.76 |
| Cherat Cement Company LTD | −40.97 | Cherat Cement Company LTD | −35.48 | BestWay Cement LTD | −3.36 |
| Dera Ghazi khan Cement | −39.93 | Dera Ghazi Khan Cement LTD | −41.21 | Cherat Cement Company LTD | −20.13 |
| Descon Oxychem LTD | −24.34 | Descon Oxychem LTD | 119.92 | Descon Oxychem LTD | −21.96 |
| Dewan Cement LTD | −56.42 | Dewan Cement LTD | −35.56 | Dewan Farooque LTD | −56.18 |
| DYNEA Pak LTD | 65.35 | DYNEA Pak LTD | −12.50 | DYNEA Pak LTD | 20.03 |
| Engro Polymer and Chemical | 54.77 | Engro Polymer and Chemical LTD | 48.95 | Engro Polymer and Chemical LTD | −14.18 |
| Engro Power Qadirpur | −5.91 | Engro Power Generation QadirPur LTD | −15.31 | Engro Power Generation QadirPur LTD | −11.56 |
| Fauji Food LTD | −47.45 | Fauji Cement Company LTD | −16.35 | Fauji Cement Company LTD | −27.47 |
| Ghandhara Industries LTD | −27.15 | FAUJI Food LTD | 83.63 | FAUJI Food LTD | −54.14 |
| Ghani Automobile Industries | 7.79 | Ghadhara Nissan LTD | −32.34 | Ghani Automobile Industries LTD | −34.46 |
| Gharibwal Cement | −53.49 | Ghandhara Industries LTD | 0.33 | Gharibwal Cement LTD | −14.02 |
| Indus Motor Company LTD | 2.60 | Gharibwal Cement LTD | −36.16 | Hi Tech Lubricants LTD | −52.84 |
| Ittehad Chemicals LTD | −31.67 | Honda Atlas Cars Pak LTD | −64.27 | Honda Atlas Cars Pak LTD | 19.05 |
| Kohat cement | −52.29 | Indus Motor Comapany LTD | −29.46 | Indus Motor Company LTD | −4.61 |
| KOT ADDU Power | −31.49 | Ittehad Chemicals LTD | 15.57 | Ittehad Chemicals LTD | −16.52 |
| Lalipir Power LTD | −5.82 | Kohat Cement LTD | −25.78 | K Electric LTD | −27.48 |
| Maple Leaf Cement Factory | −52.16 | KOT Addu Power Company LTD | −11.16 | Kohat Cement LTD | −7.11 |
| National Refinery | −24.81 | Lalipur Power LTD | −22.73 | KOT Addu Power Company LTD | −36.57 |
| Nishat Chunnian Power | −43.19 | Lotte Chemicals Pak LTD | 129.48 | Lalipir Power LTD | −9.66 |
| Nishat Power LTD | −45.95 | Maple Leaf Cement Factory | −40.21 | Lotte Chemicals Pak LTD | −20.80 |
| Pak Oilfields | 12.81 | Mari Petroleum Company LTD | −5.47 | Maple Leaf Cement Factory | −35.88 |
| Pak State Oil | −20.88 | Millat Tractors LTD | −28.84 | Mari Petroleum Company LTD | 13.55 |
| Pakistan Petroleum LTD | 10.17 | Nishat Chunnian Power LTD | −28.53 | Millat Tractors LTD | −4.01 |
| Pakistan Refinery LTD | −9.83 | Nishat Power LTD | −19.11 | National Refinery LTD | −49.66 |
| Pioneer Cement | −55.61 | Oil & Gas Development CO LTD | −21.11 | Nishat Chunnian Power LTD | −19.02 |
| Power Cement LTD | −22.03 | Pakistan Petroleum LTD | −16.89 | Nishat Power LTD | 3.42 |
| Shell Pakistan LTD | −41.53 | Pakistan State Oil Company LTD | −8.56 | Oil & Gas Development CO LTD | 5.80 |
| Sitara Peroxide LTD | −55.80 | Pioneer Cement LTD | −33.67 | Pak Suzuki Motors Company LTD | 27.62 |
| Thata Cement LTD | −44.89 | Quice Food Industries LTD | −8.66 | Pakistan Oilfields LTD | 0.13 |
| Thata Cement LTD | −37.78 | Pakistan Petroleum LTD | 5.57 | ||
| Pakistan Refinery LTD | −9.83 | ||||
| Pakistan State Oil Company LTD | −2.38 | ||||
| Pioneer Cement LTD | −30.80 | ||||
| Quice Food Industries LTD | −19.56 | ||||
| Sitara Peroxide LTD | −29.36 | ||||
| Thata Cement LTD | −17.75 | ||||
References
- Ramos-Requena, J.P.; Trinidad-Segovia, J.E.; Sánchez-Granero, M.A. Introducing Hurst exponent in pair trading. Phys. A Stat. Mech. Its Appl. 2017, 488, 39–45. [Google Scholar] [CrossRef]
- Narayan, P.K.; Smyth, R. Mean reversion versus random walk in G7 stock prices evidence from multiple trend break unit root tests. J. Int. Financ. Mark. Inst. Money 2007, 17, 152–166. [Google Scholar] [CrossRef]
- Guerra Cavalcanti, R.S.; dos Santos, J.F.; dos Santos, R.R.; da Cunha, A.G.M. Composition of portfolios by pairs trading with volatility criteria in the Brazilian market. Rev. Contab. E Financ. 2021, 32, 273–284. [Google Scholar] [CrossRef]
- Keshavarz Haddad, G.; Talebi, H. The profitability of pair trading strategy in stock markets: Evidence from Toronto stock exchange. Int. J. Financ. Econ. 2023, 28, 193–207. [Google Scholar] [CrossRef]
- Do, B.; Faff, R. Are pairs trading profits robust to trading costs? J. Financ. Res. 2012, 35, 261–287. [Google Scholar] [CrossRef]
- Gatev, E.; Goetzmann, W.N.; Rouwenhorst, K.G. Pairs trading: Performance of a relative-value arbitrage rule. In Review of Financial Studies; 2006; Volume 19, Available online: https://academic.oup.com/rfs/article-abstract/19/3/797/1646694?redirectedFrom=fulltext (accessed on 13 February 2023).
- Habibi, S.; Pakizeh, K. Profitability of the Pair Trading Strategy across Different Asset Classes. Int. Res. J. Financ. Econ. 2017, 161, 1–17. [Google Scholar]
- Krauss, C. Statistical arbitrage pairs trading strategies: Review and outlook. J. Econ. Surv. 2017, 31, 513–545. [Google Scholar] [CrossRef]
- Vidyamurthy, G. Pairs Trading: Quantitative Methods and Analysis; John Wiley & Sons: Hoboken, NJ, USA, 2004; Volume 217. [Google Scholar]
- Blázquez, M.C.; Román, C.P. Pairs trading techniques: An empirical contrast. Eur. Res. Manag. Bus. Econ. 2018, 24, 160–167. [Google Scholar] [CrossRef]
- Yoshikawa, D. An entropic approach for pair trading. Entropy 2017, 19, 320. [Google Scholar] [CrossRef]
- Ekström, E.; Lindberg, C.; Tysk, J. Optimal Liquidation of a Pairs Trade. In Advanced Mathematical Methods for Finance; Springer: Berlin/Heidelberg, Germany, 2011. [Google Scholar] [CrossRef]
- Suzuki, K. Optimal switching strategy of a mean-reverting asset over multiple regimes. Automatica 2016, 67, 33–45. [Google Scholar] [CrossRef]
- Krätschmer, V.; Ladkau, M.; Laeven, R.J.A.; Schoenmakers, J.G.M.; Stadje, M. Optimal stopping under uncertainty in drift and jump intensity. Math. Oper. Res. 2018, 43, 1177–1209. [Google Scholar] [CrossRef]
- Tokat, E.; Hayrullahoğlu, A.C. Pairs trading: Is it applicable to exchange-traded funds? Borsa Istanb. Rev. 2022, 22, 743–751. [Google Scholar] [CrossRef]
- Bekiros, S.D. Timescale Analysis with an Entropy-Based Shift-Invariant Discrete Wavelet Transform. Comput. Econ. 2014, 44, 231–251. [Google Scholar] [CrossRef]
- Bowden, R.J. Directional entropy and tail uncertainty, with applications to financial hazard. Quant. Financ. 2011, 11, 437–446. [Google Scholar] [CrossRef]
- Yin, D. Investment Decision Based on Entropy Theory. Mod. Econ. 2019, 10, 1211. [Google Scholar] [CrossRef]
- Qazi, L.T.; Rahman, A.U.; Gul, S. Which pairs of stocks should we trade? Selection of pairs for statistical arbitrage and pairs trading in Karachi stock exchange. Pak. Dev. Rev. 2015, 54, 215–244. [Google Scholar] [CrossRef]
- Sohail, M.; Rehman, A.; Adil, I.; Rizwan, M.; Khan, S. Pair Trading Strategies Using Machine Learning: A Case of PSX Firms. Pak. Bus. Rev. 2020, 22, 340–351. [Google Scholar]
- Chutka, J.; Kramarova, K. Usage of P/E earning models as a tool for valuation of shares in condition of global market. SHS Web Conf. 2020, 74, 01007. [Google Scholar] [CrossRef]
- de Lima Amorim, D.P.; de Camargos, M.A. Mean reversion in a price-earnings ratio and under/overvaluation in the Brazilian stock market. Rev. Contab. E Financ. 2021, 32, 301–313. [Google Scholar] [CrossRef]
- Laurent, S.; Shi, S. Unit root test with high-frequency data. Econom. Theory 2022, 38, 113–171. [Google Scholar] [CrossRef]
- Bai, J.; Perron, P. Estimating and Testing Linear Models with Multiple Structural Changes. Econometrica 1998, 66, 47–78. [Google Scholar] [CrossRef]
- Shaukat, U.; Rehman, A.; ul Haq, A. Pairs Trading and Stock Returns: An Evidence from Pakistan Stock Exchange. City Univ. Res. J. 2021, 11. Available online: http://cusitjournals.com/index.php/CURJ (accessed on 13 February 2023).
- Ling, F.C.H.; Yat, D.N.C.; binti Muhamad, R. An empirical re-investigation on the “buy-and-hold strategy” in four Asian markets: A 20 years’ study. World Appl. Sci. J. 2014, 30, 226–237. [Google Scholar] [CrossRef]
- Lee, D.; Leung, T. On the efficacy of optimized exit rule for mean reversion trading. Int. J. Financ. Eng. 2020, 7, 2050024. [Google Scholar] [CrossRef]
Disclaimer/Publisher’s Note: The statements, opinions and data contained in all publications are solely those of the individual author(s) and contributor(s) and not of MDPI and/or the editor(s). MDPI and/or the editor(s) disclaim responsibility for any injury to people or property resulting from any ideas, methods, instructions or products referred to in the content. |
© 2023 by the authors. Licensee MDPI, Basel, Switzerland. This article is an open access article distributed under the terms and conditions of the Creative Commons Attribution (CC BY) license (https://creativecommons.org/licenses/by/4.0/).