
Research on the Robustness of the Chinese Input–Output Network Based on Relative Entropy Theory

Abstract
:1. Introduction
2. Relative Entropy Model
2.1. Relative Entropy Theory
2.2. Relative Entropy Model on the Network Robustness
3. Relevant Indicators of the Input–Output Network
3.1. Node Degree Distribution
3.2. Centrality Based on the Strongest Path (SP)
3.2.1. Strongest Path
3.2.2. SP Betweenness
3.2.3. Downstream Closeness and Upstream Closeness
4. Experiment
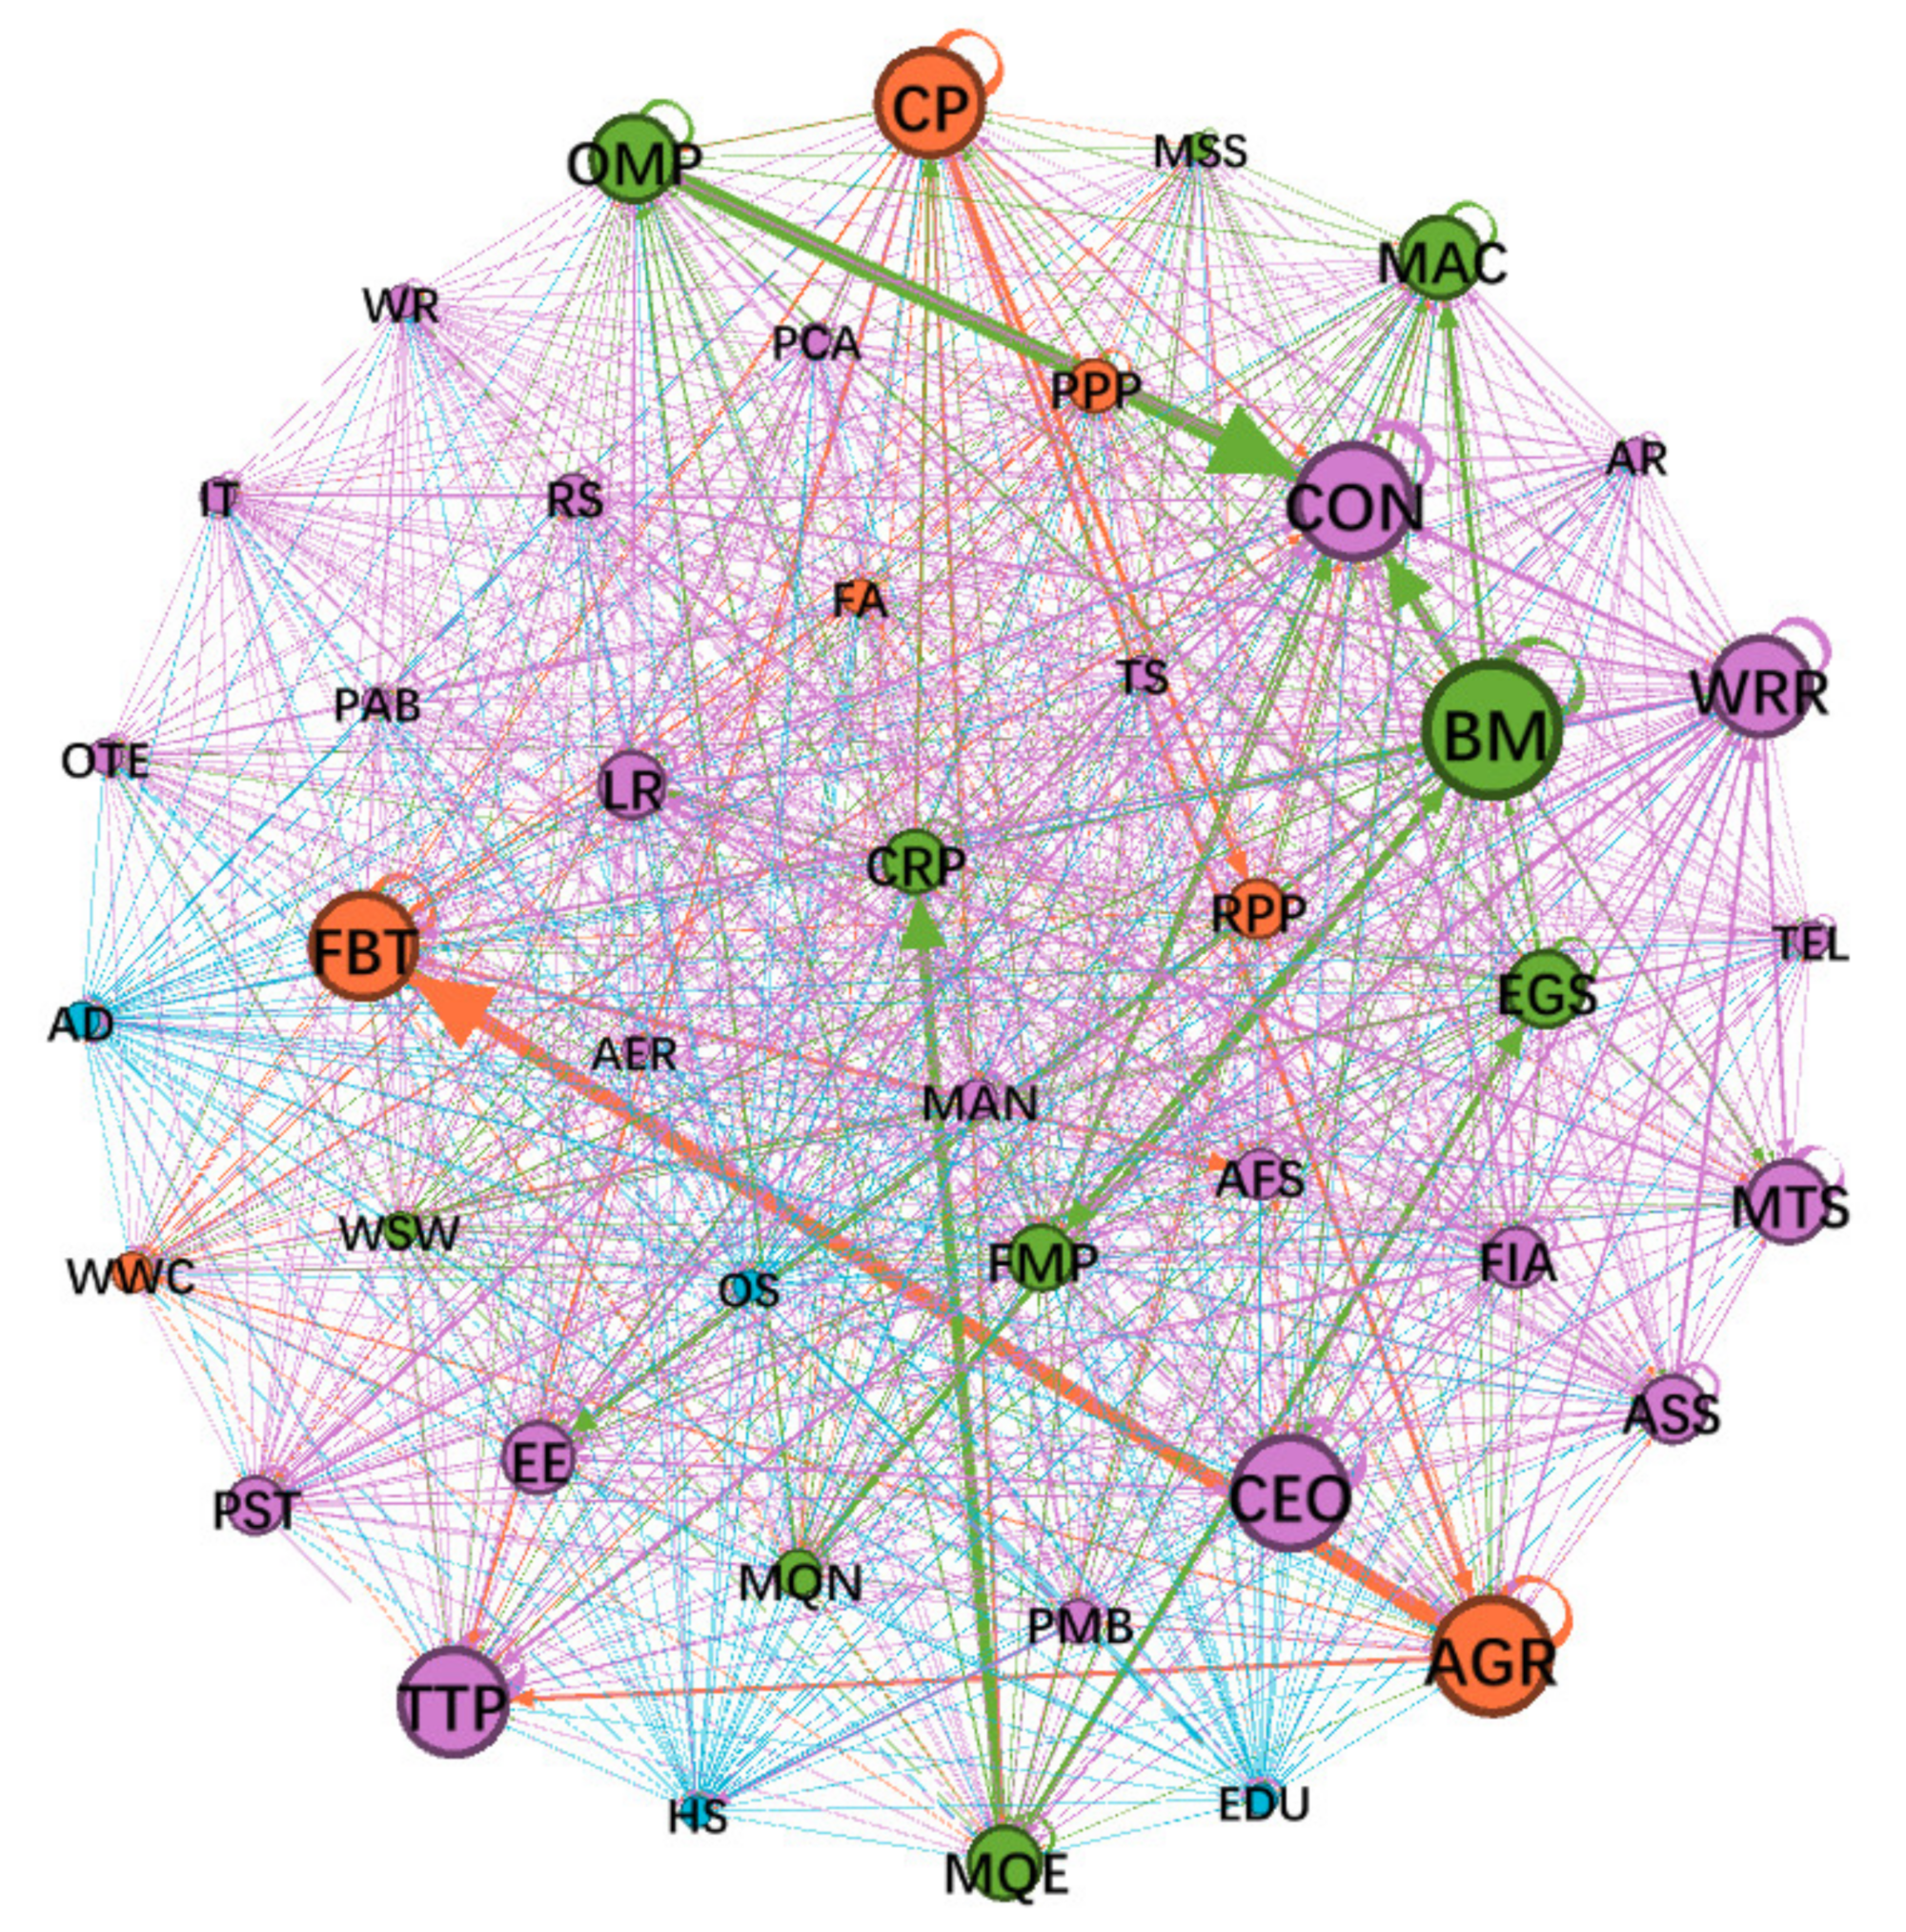
4.1. Chinese Input–Output Network Model
4.2. Robustness Analysis
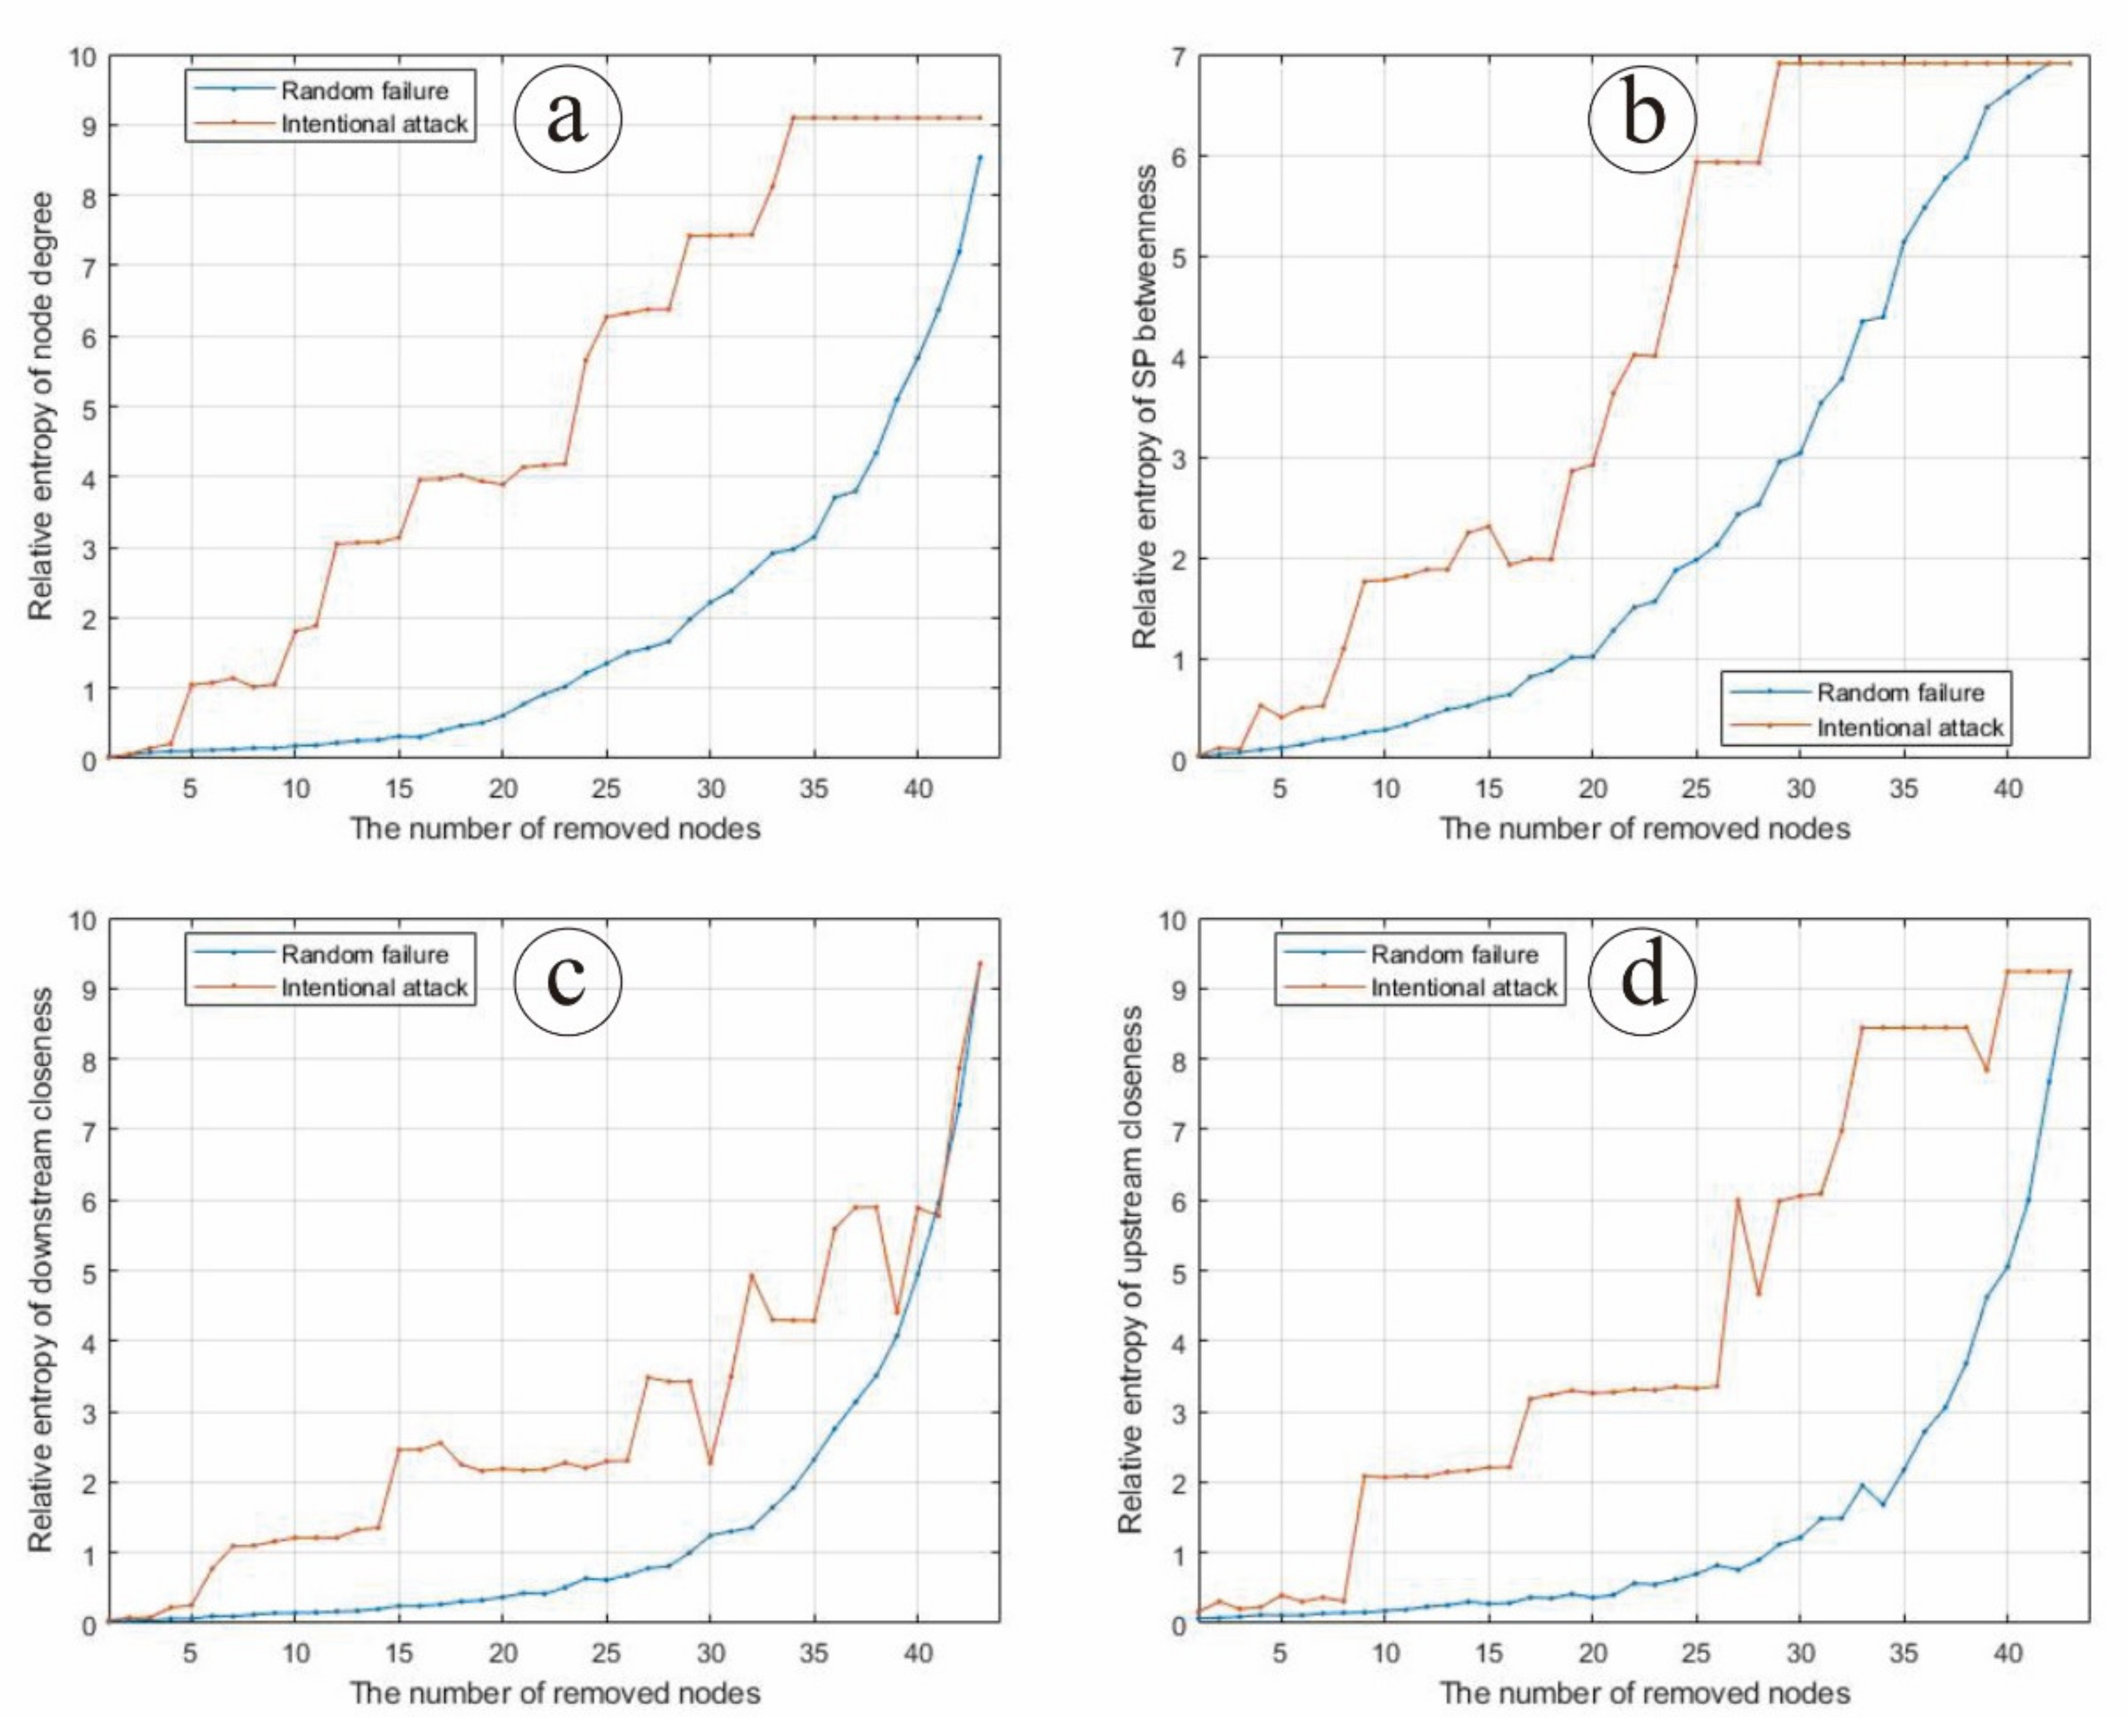
4.2.1. Node Attack
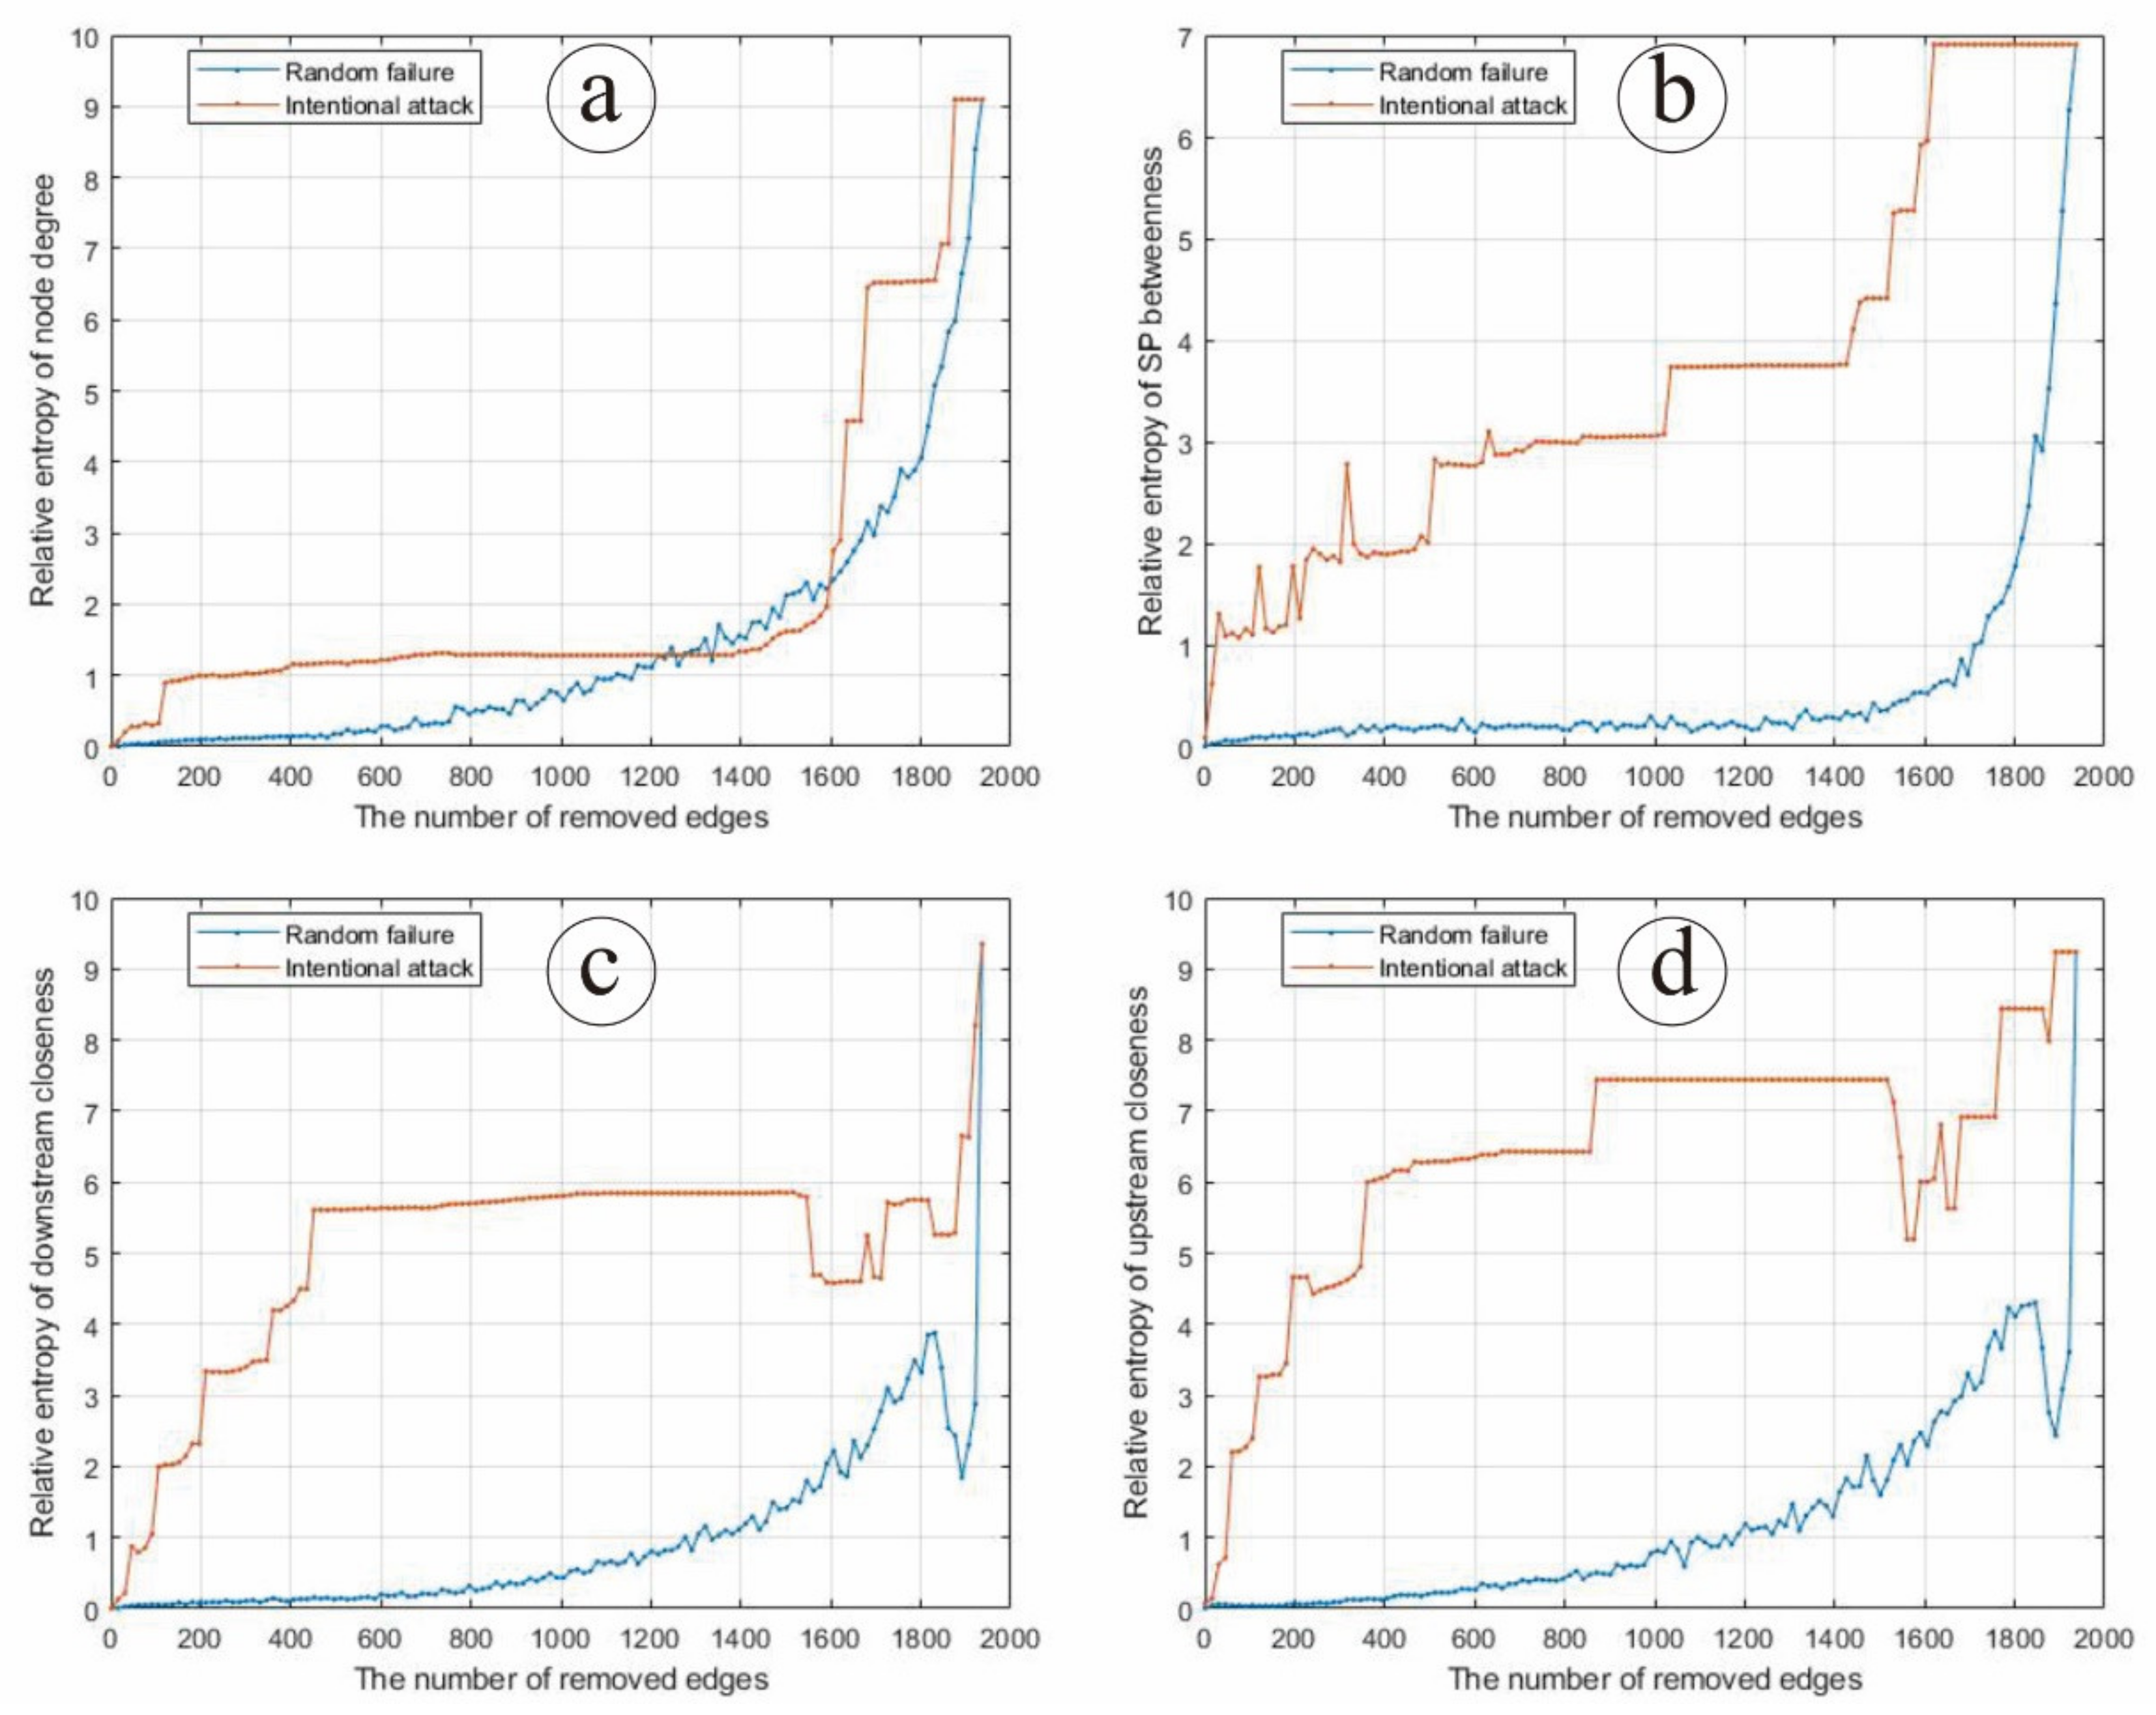
4.2.2. Edge Attack
5. Conclusions
Author Contributions
Funding
Conflicts of Interest
Appendix A

| Serial Number | ISIC Rev.4 | Industry | Abbreviation |
|---|---|---|---|
| 1 | D01T02 | Agriculture, hunting, forestry | AGR |
| 2 | D03 | Fishing and aquaculture | FA |
| 3 | D05T06 | Mining and quarrying, energy producing products | MQE |
| 4 | D07T08 | Mining and quarrying, non-energy producing products | MQN |
| 5 | D09 | Mining support service activities | MSS |
| 6 | D10T12 | Food products, beverages and tobacco | FBT |
| 7 | D13T15 | Textiles, textile products, leather and footwear | TTP |
| 8 | D16 | Wood and products of wood and cork | WWC |
| 9 | D17T18 | Paper products and printing | PPP |
| 10 | D19 | Coke and refined petroleum products | CRP |
| 11 | D20 | Chemical and chemical products | CCP |
| 12 | D21 | Pharmaceuticals, medicinal chemical and botanical products | PMB |
| 13 | D22 | Rubber and plastics products | RPP |
| 14 | D23 | Other non-metallic mineral products | OMP |
| 15 | D24 | Basic metals | BM |
| 16 | D25 | Fabricated metal products | FMP |
| 17 | D26 | Computer, electronic and optical equipment | CEO |
| 18 | D27 | Electrical equipment | EE |
| 19 | D28 | Machinery and equipment, nec | MAC |
| 20 | D29 | Motor vehicles, trailers and semi-trailers | MTS |
| 21 | D30 | Other transport equipment | OTE |
| 22 | D31T33 | Manufacturing nec; repair and installation of machinery and equipment | MAN |
| 23 | D35 | Electricity, gas, steam and air conditioning supply | EGS |
| 24 | D36T39 | Water supply; sewerage, waste management and remediation activities | WSW |
| 25 | D41T43 | Construction | CON |
| 26 | D45T47 | Wholesale and retail trade; repair of motor vehicles | WRR |
| 27 | D49 | Land transport and transport via pipelines | LR |
| 28 | D50 | Water transport | WR |
| 29 | D51 | Air transport | AR |
| 30 | D52 | Warehousing and support activities for transportation | TS |
| 31 | D53 | Postal and courier activities | PCA |
| 32 | D55T56 | Accommodation and food service activities | AFS |
| 33 | D58T60 | Publishing, audiovisual and broadcasting activities | PAB |
| 34 | D61 | Telecommunications | TEL |
| 35 | D62T63 | IT and other information services | IT |
| 36 | D64T66 | Financial and insurance activities | FIA |
| 37 | D68 | Real estate activities | RS |
| 38 | D69T75 | Professional, scientific and technical activities | PST |
| 39 | D77T82 | Administrative and support services | ASS |
| 40 | D84 | Public administration and defence; compulsory social security | PD |
| 41 | D85 | Education | EDU |
| 42 | D86T88 | Human health and social work activities | HS |
| 43 | D90T93 | Arts, entertainment and recreation | AER |
| 44 | D94T96 | Other service activities | OS |
| 45 | D97T98 | Activities of households as employers; undifferentiated goods- and services-producing activities of households for own use | HOU |
References
- Leontief, W. Quantitative Input and Output Relations in the Economic Systems of the United States. Rev. Econ. Stat. 1936, 18, 105–125. [Google Scholar] [CrossRef] [Green Version]
- James, M.; Brian, D.F.; Gerald, S. Network structure of inter-industry flows. Phys. A Stat. Mech. Appl. 2013, 392, 6427–6441. [Google Scholar]
- Blochl, F.; Theis, F.J.; Vega-Redondo, F.; Fisher, E.O.N. Vertex centralities in input–output networks reveal the structure of modern economies. Phys. Rev. E Stat. Nonlinear Soft Matter Phys. 2011, 83, 046127. [Google Scholar] [CrossRef] [PubMed] [Green Version]
- McNerney, J. Network Properties of Economic-Input Output Networks; lnternational lnstitute for Applied Systems Analysis: Laxenburg, Austria, 2009. [Google Scholar]
- Xu, M.; Liang, S. Input–output networks offer new insights of economic structure. Phys. A Stat. Mech. Appl. 2019, 527, 121178. [Google Scholar] [CrossRef]
- Gonçalves, J.; Matsushita, R.; Da Silva, S. The asymmetric Brazilian input–output network. J. Econ. Stud. 2021, 48, 604–615. [Google Scholar] [CrossRef]
- Cerina, F.; Zhu, Z.; Chessa, A.; Riccaboni, M. World Input-Output Network. PLoS ONE 2015, 10, e0134025. [Google Scholar] [CrossRef] [Green Version]
- Theodore, T. Network analysis of inter-sectoral relationships and key sectors in the Greek economy. J. Econ. Interact. Coord. 2017, 12, 413–435. [Google Scholar]
- He, X.; Dong, Y.; Wu, Y.; Wei, G.; Xing, L.; Yan, J. Structure analysis and core community detection of embodied resources networks among regional industries. Phys. A Stat. Mech. Appl. 2017, 479, 137–150. [Google Scholar] [CrossRef]
- Li, W.; Wang, A.; Zhong, W.; Xing, W.; Liu, J. The role of mineral-related industries in Chinese industrial pattern. Resour. Policy 2022, 76, 102590. [Google Scholar] [CrossRef]
- Acemoglu, D.; Carvalho, V.M.; Ozdaglar, A.; Tahbaz-Salehi, A. The Network Origins of Aggregate Fluctuations. Econometrica 2012, 80, 1977–2016. [Google Scholar] [CrossRef] [Green Version]
- Grazzini, J.; Spelta, A. An empirical analysis of the global input–output network and its evolution. Phys. A Stat. Mech. Appl. 2022, 594, 126993. [Google Scholar] [CrossRef]
- Albert, R.; Jeong, H.; Barabási, A.-L. Error and attack tolerance of complex networks. Nature 2000, 406, 378–382. [Google Scholar] [CrossRef] [Green Version]
- Holme, P.; Kim, B.J.; Yoon, C.N.; Han, S.K. Attack vulnerability of complex networks. Phys. Rev. E 2002, 65, 056109. [Google Scholar] [CrossRef] [Green Version]
- Schneider, C.M.; Moreira, A.A.; Andrade, J.S.; Havlin, S.; Herrmann, H.J. Mitigation of malicious attacks on networks. Proc. Natl. Acad. Sci. USA 2011, 108, 3838–3841. [Google Scholar] [CrossRef] [Green Version]
- Sen, A.; Mazumder, A.; Banerjee, J.; Das, A.; Compton, R. Identification of K most vulnerable nodes in multi-layered network using a new model of interdependency. In Proceedings of the 2014 IEEE Conference on Computer Communications Workshops (INFOCOM WKSHPS), Toronto, ON, Canada, 27 April–2 May 2014; pp. 831–836. [Google Scholar]
- Liu, X.; Maiorino, E.; Halu, A.; Glass, K.; Prasad, R.B.; Loscalzo, J.; Gao, J.; Sharma, A. Robustness and lethality in multilayer biological molecular networks. Nat. Commun. 2020, 11, 6043. [Google Scholar] [CrossRef]
- Foti, N.J.; Pauls, S.; Rockmore, D.N. Stability of the World Trade Web over time—An extinction analysis. J. Econ. Dyn. Control 2013, 37, 1889–1910. [Google Scholar] [CrossRef] [Green Version]
- Liu, X.; Stanley, H.E.; Gao, J. Breakdown of interdependent directed networks. Proc. Natl. Acad. Sci. USA 2016, 113, 1138–1143. [Google Scholar] [CrossRef] [Green Version]
- Dorogovtsev, S.N.; Mendes, J.F.; Samukhin, A.N. Giant strongly connected component of directed networks. Phys. Rev. E Stat. Nonlin. Soft Matter Phys. 2001, 64 Pt 2, 025101. [Google Scholar] [CrossRef] [Green Version]
- Qin, J.; Wu, H.; Tong, X.; Zheng, B. A quantitative method for determining the robustness of complex networks. Phys. D Nonlinear Phenom. 2013, 253, 85–90. [Google Scholar] [CrossRef] [Green Version]
- Kullback, S.; Leibler, R.A. On Information and Sufficiency. Ann. Math. Stat. 1951, 22, 79–86, 88. [Google Scholar] [CrossRef]
- Izadi, N.H.; Palhang, M.; Safayani, M. Layered Relative Entropy Policy Search. Knowl.-Based Syst. 2021, 223, 107025. [Google Scholar] [CrossRef]
- Mahdavi, M.; Fesanghary, M.; Damangir, E. An improved harmony search algorithm for solving optimization problems. Appl. Math. Comput. 2007, 188, 1567–1579. [Google Scholar] [CrossRef]
- Fei, L.G.; Deng, Y. A new method to identify influential nodes based on relative entropy. Chaos Solitons Fractals 2017, 104, 257–267. [Google Scholar] [CrossRef]
- Chen, B.; Wang, Z.X.; Luo, C. Integrated evaluation approach for node importance of complex networks based on relative entropy. J. Syst. Eng. Electron. 2016, 27, 1219–1226. [Google Scholar] [CrossRef]
- Wen, T.; Duan, S.Y.; Jiang, W. Node similarity measuring in complex networks with relative entropy. Commun. Nonlinear Sci. Numer. Simul. 2019, 78, 104867. [Google Scholar] [CrossRef]
- Zhang, Q.; Li, M.Z.; Deng, Y. Measure the structure similarity of nodes in complex networks based on relative entropy. Phys. A Stat. Mech. Appl. 2018, 491, 749–763. [Google Scholar] [CrossRef]
- Hong, C.; He, N.; Lordan, O.; Liang, B.-Y.; Yin, N.-Y. Efficient calculation of the robustness measure R for complex networks. Phys. A Stat. Mech. Appl. 2017, 478, 63–68. [Google Scholar] [CrossRef]
- Defourny, J.; Thorbecke, E. Structural path analysis and multiplier decomposition within a social accounting matrix framework. Econ. J. 1984, 94, 111–136. [Google Scholar] [CrossRef]

| Serial Number | Industrial Abbreviation | Weighted Degree | SP Betweenness | Downstream Closeness | Upstream Closeness |
|---|---|---|---|---|---|
| 1 | AGR | 2,562,629 | 92,472 | 26,293 | 16,338 |
| 2 | FA | 256,312 | 2461 | 3340 | 2338 |
| 3 | MQE | 1,339,448 | 245,831 | 24,536 | 7366 |
| 4 | MQN | 587,029 | 8003 | 10,456 | 4708 |
| 5 | MSS | 49,156 | 0 | 1724 | 505 |
| 6 | FBT | 2,255,791 | 131,243 | 15,269 | 25,130 |
| 7 | TTP | 2,297,492 | 711 | 6788 | 12,821 |
| 8 | WWC | 415,010 | 2724 | 4125 | 2791 |
| 9 | PPP | 789,608 | 7407 | 7092 | 4918 |
| 10 | CRP | 1,069,326 | 152,486 | 14,323 | 13,828 |
| 11 | CCP | 2,283,824 | 85,214 | 23,024 | 13,646 |
| 12 | PMB | 517,523 | 26,165 | 3523 | 4108 |
| 13 | RPP | 969,176 | 19,281 | 9262 | 8350 |
| 14 | OMP | 1,713,398 | 89,729 | 18,940 | 11,706 |
| 15 | BM | 3,072,146 | 185,195 | 30,339 | 18,371 |
| 16 | FMP | 1,142,253 | 13,689 | 11,234 | 11,366 |
| 17 | CEO | 2,471,357 | 3147 | 8713 | 14,210 |
| 18 | EE | 1,301,461 | 23,716 | 10,668 | 14,316 |
| 19 | MAC | 1,578,061 | 7072 | 9637 | 17,375 |
| 20 | MTS | 1,596,877 | 16,268 | 6142 | 12,870 |
| 21 | OTE | 256,789 | 4996 | 1272 | 3352 |
| 22 | MAN | 392,986 | 9027 | 2860 | 5779 |
| 23 | EGS | 1,443,474 | 21,102 | 13,240 | 11,682 |
| 24 | WSW | 257,270 | 211 | 2869 | 2204 |
| 25 | CON | 2,516,932 | 4015 | 676 | 55,852 |
| 26 | WRR | 2,082,205 | 65,849 | 31,445 | 16,458 |
| 27 | LR | 1,171,919 | 64,100 | 15,539 | 11,879 |
| 28 | WR | 206,296 | 2067 | 2490 | 2408 |
| 29 | AR | 204,366 | 1227 | 2582 | 1987 |
| 30 | TS | 258,371 | 0 | 3526 | 2831 |
| 31 | PCA | 165,302 | 127 | 2257 | 1390 |
| 32 | AFS | 708,324 | 40,696 | 7459 | 9312 |
| 33 | PAB | 70,715 | 0 | 606 | 981 |
| 34 | TEL | 299,942 | 0 | 2722 | 2831 |
| 35 | IT | 277,840 | 0 | 2850 | 2721 |
| 36 | FIA | 998,099 | 4019 | 18,777 | 3434 |
| 37 | RS | 489,535 | 82 | 7268 | 4375 |
| 38 | PST | 911,260 | 3791 | 11,206 | 8695 |
| 39 | ASS | 1,190,835 | 6898 | 14,674 | 10,311 |
| 40 | PD | 282,407 | 0 | 251 | 6113 |
| 41 | EDU | 170,692 | 0 | 357 | 3498 |
| 42 | HS | 177,786 | 354 | 192 | 4433 |
| 43 | AER | 79,489 | 0 | 410 | 994 |
| 44 | OS | 176,348 | 0 | 1752 | 2129 |
Publisher’s Note: MDPI stays neutral with regard to jurisdictional claims in published maps and institutional affiliations. |
© 2022 by the authors. Licensee MDPI, Basel, Switzerland. This article is an open access article distributed under the terms and conditions of the Creative Commons Attribution (CC BY) license (https://creativecommons.org/licenses/by/4.0/).
Share and Cite
Li, W.; Wang, A.; Xing, W. Research on the Robustness of the Chinese Input–Output Network Based on Relative Entropy Theory. Entropy 2022, 24, 1043. https://doi.org/10.3390/e24081043
Li W, Wang A, Xing W. Research on the Robustness of the Chinese Input–Output Network Based on Relative Entropy Theory. Entropy. 2022; 24(8):1043. https://doi.org/10.3390/e24081043
Chicago/Turabian StyleLi, Weidong, Anjian Wang, and Wanli Xing. 2022. "Research on the Robustness of the Chinese Input–Output Network Based on Relative Entropy Theory" Entropy 24, no. 8: 1043. https://doi.org/10.3390/e24081043
APA StyleLi, W., Wang, A., & Xing, W. (2022). Research on the Robustness of the Chinese Input–Output Network Based on Relative Entropy Theory. Entropy, 24(8), 1043. https://doi.org/10.3390/e24081043