Abstract
In most supply chains (SCs), transaction relationships between suppliers and customers are commonly considered to be an extrapolation from a linear perspective. However, this traditional linear concept of an SC is egotistic and oversimplified and does not sufficiently reflect the complex and cyclical structure of supplier-customer relationships in current economic and industrial situations. The interactional relationships and topological characteristics between suppliers and customers should be analyzed using supply networks (SNs) rather than traditional linear SCs. Therefore, this paper reconceptualizes SCs as SNs in complex adaptive systems (CAS), and presents three main contributions. First, we propose an integrated framework of CAS network by synthesizing multi-level network analysis from the network-, community- and vertex-perspective. The CAS perspective enables us to understand the advances of SN properties. Second, in order to emphasize the CAS properties of SNs, we conducted a real-world SN based on the Japanese industry and describe an advanced investigation of SN theory. The CAS properties help in enriching the SN theory, which can benefit SN management, community economics and industrial resilience. Third, we propose a quantitative metric of entropy to measure the complexity and robustness of SNs. The results not only support a specific understanding of the structural outcomes relevant to SNs, but also deliver efficient and effective support to the management and design of SNs.
1. Introduction
Supply chain management (SCM) has been an important and extensively investigated topic since its appearance in the early 1980s. Due to the importance of supplier-customer relationships in guiding modern research and practice [1], the main impacts of this research in the field of business management and operation research are apparent. An increasing interest in applying a network analysis approach to understand supply networks (SNs) instead of linear supply chains (SCs) has been observed [2,3,4,5,6,7,8,9,10,11,12,13,14]. SNs have become a new analytic paradigm in SCM, and have been identified as regional clusters [2,3,4,6] or industrial sectors [4,7,8], and are also well known as complex adaptive systems (CAS) [5,9,10,11,12,13,14,15,16].
This new theory of SN is extremely valuable and more meaningful than traditional SCs, and both structural and relational characteristics in the SNs enable firms to activate existing partners and select appropriate cooperation partners [6,8,17]. To assess the concepts surrounding structural and relational characteristics, the extension of network analysis to SN is natural, and represents the infrastructure of the social science of business [18,19]. SNs have been increasingly recognized to find new business partners, discover new opportunities, increase operational efficiency, inform strategic direction, and identify and develop new products and services [20].
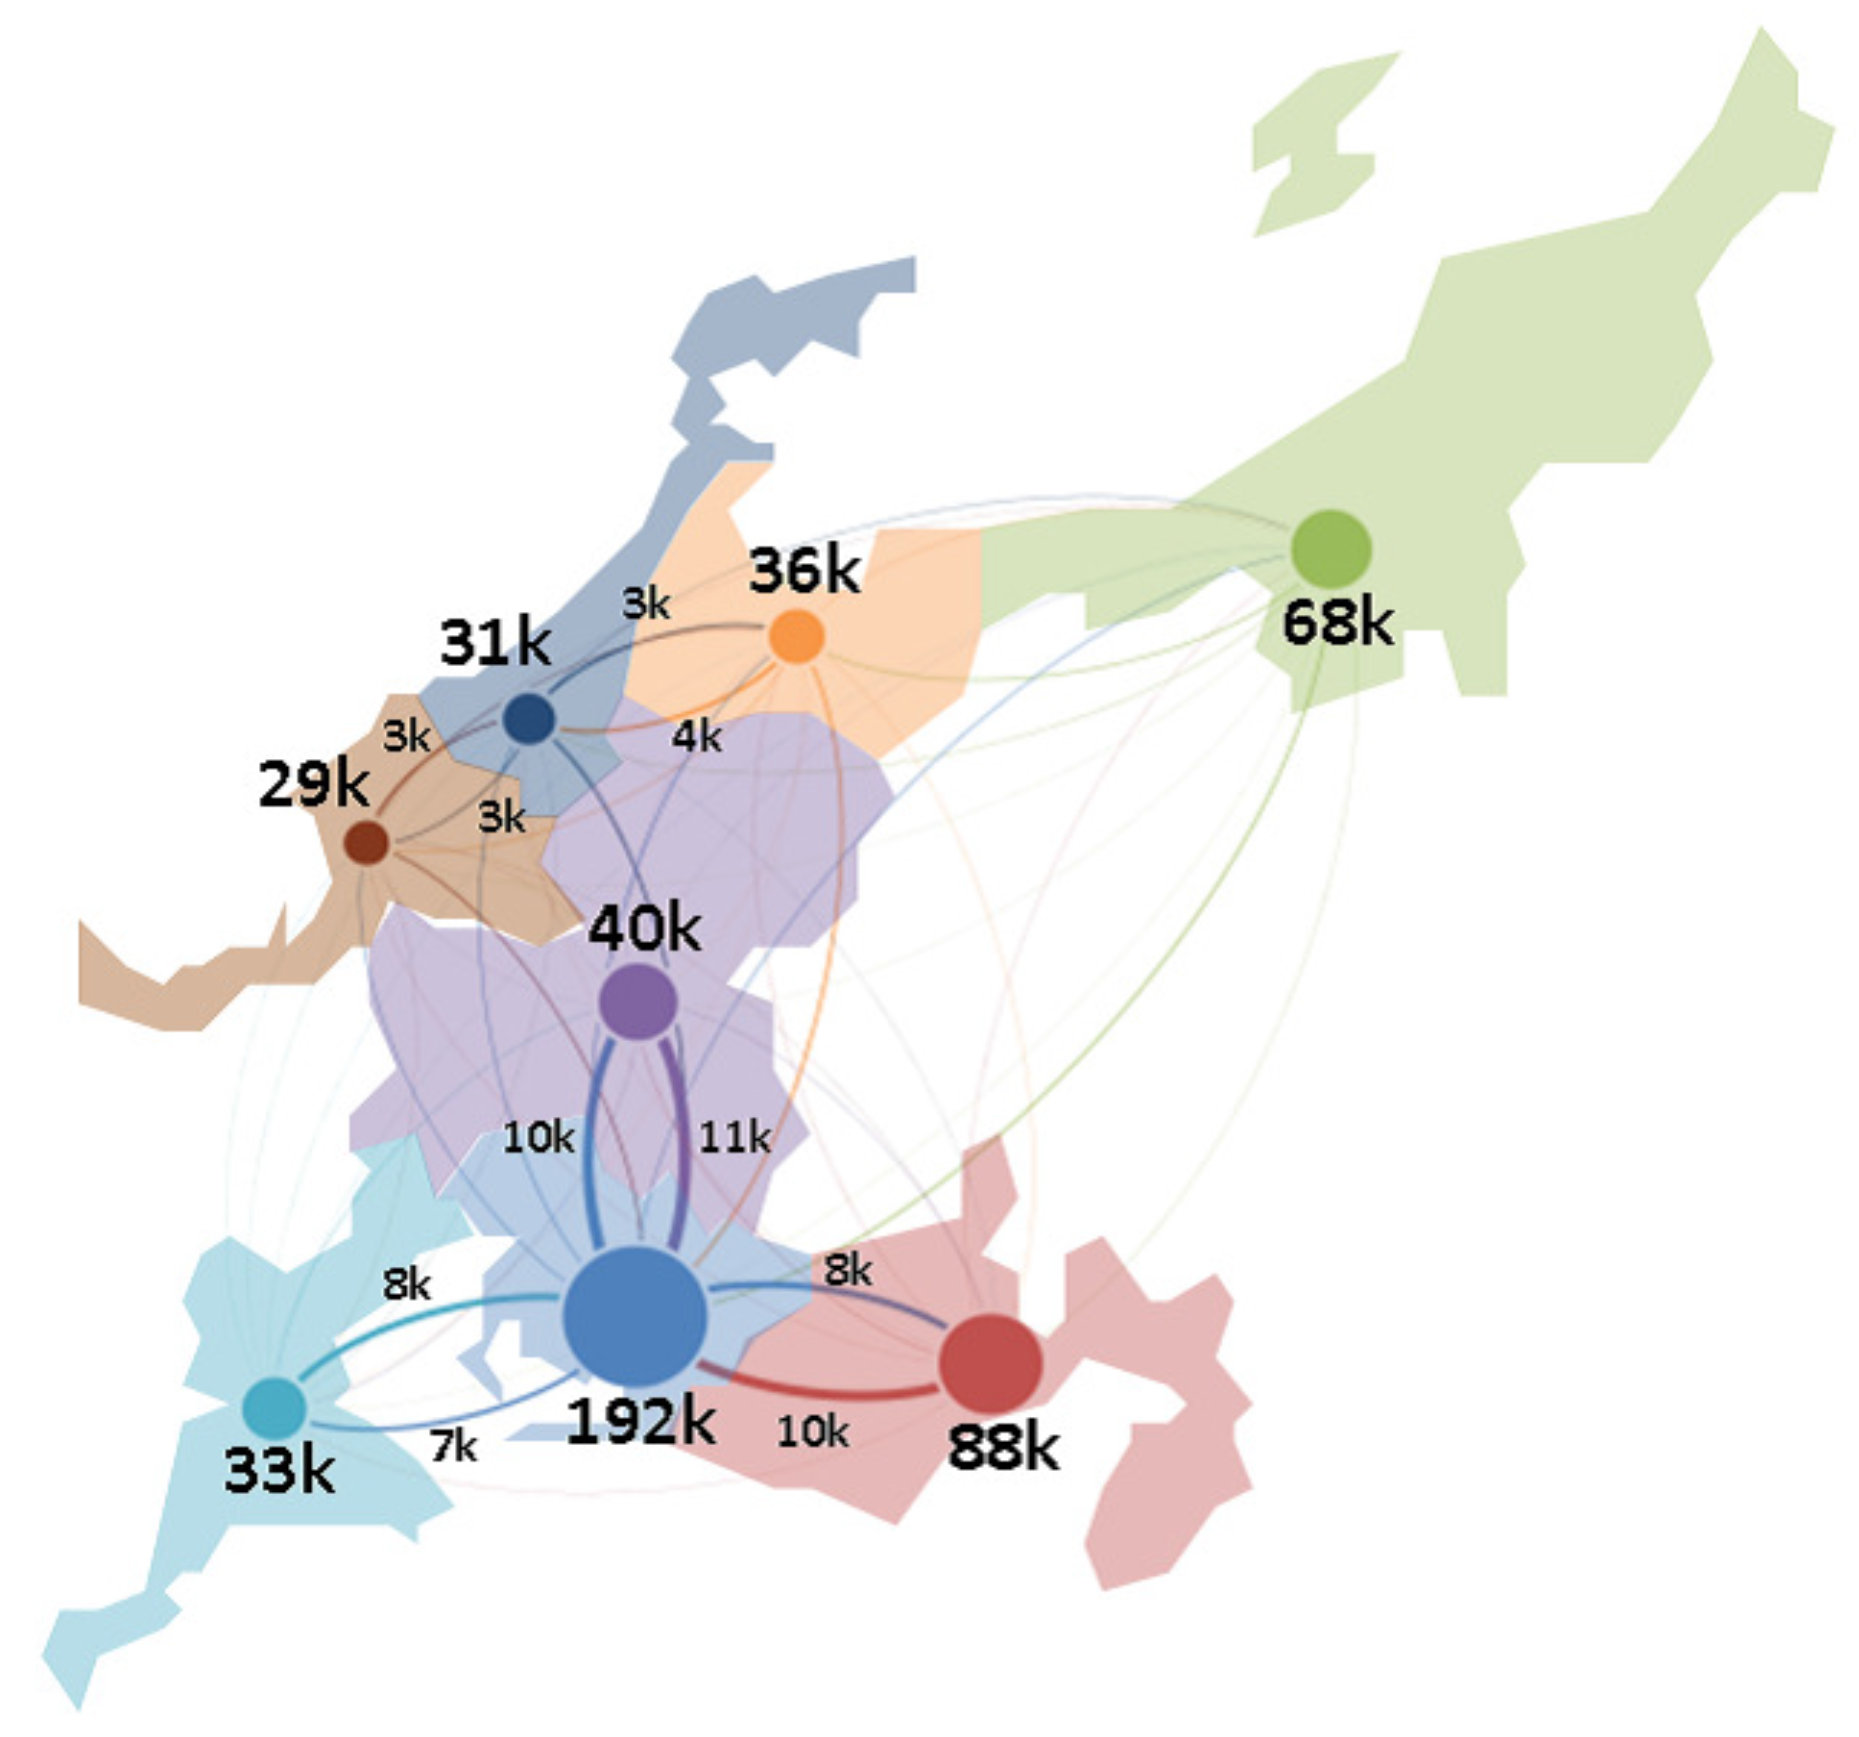
Previous studies have focused on geographical agglomeration and modularized SNs in regional clusters [2,3,4,6]. The regional clusters presented a dense inter-organizational network, which enhanced knowledge diffusion, regional learning and effective resource transfer. Due to the boundary strengths of regional clusters, the majority of the transactions were held within individual regional communities, and the bridges between different communities were much thinner. The analyses and results of the regional clusters were insufficient to reveal the cross-regional features to benefit community-based economics, accounting for the lack of transaction information. However, Takayasu et al. [4,5] investigated the community structure of a large-scale SN. Their studies only initiated possible applications of the visualization of the SN, and their results also showed the firms local closeness. Another similar study of SN focused on industrial sectors [7,8,21,22]. Kim et al. [7] selected Honda and Daimler as the targets and constructed SNs that included raw materials suppliers to the final assemblers. Bellamy et al. [8] also investigated several specific firms (e.g., Sandisk, Kodak and Intel) in the electronics industry and established an SN of 390 electronic firms. These studies well examined the structural properties of interfirm systems, and revealed that an interfirm system could be better modeled as an SN rather than a linear SC. However, they conducted the SNs starting from a focal firm with its directly connected suppliers and customers. Therefore, such SNs were egocentric networks and the analysis was only be extended from the vertex-level viewpoint.
Nevertheless, real-world SNs are complex systems containing numerous firms from multiple interrelated industries. In such systems, any tiny effect or change could cause a chain reaction, and diffuse the influence throughout the whole network. The merits of complexity theory supports a conceptual and methodological framework to identify the dynamic and complicated interfirm relationships between suppliers, manufacturers, assemblers, distributors, and retailers. Pathak et al. [9] firstly adopted a complex adaptive systems (CAS) perspective to gain insights into SN issues and suggested dozens of potential CAS research questions. Their work has familiarized us with the existence of SN theory, and brought the applicability of CAS properties to enrich the SN discipline. Edward and Wilson [
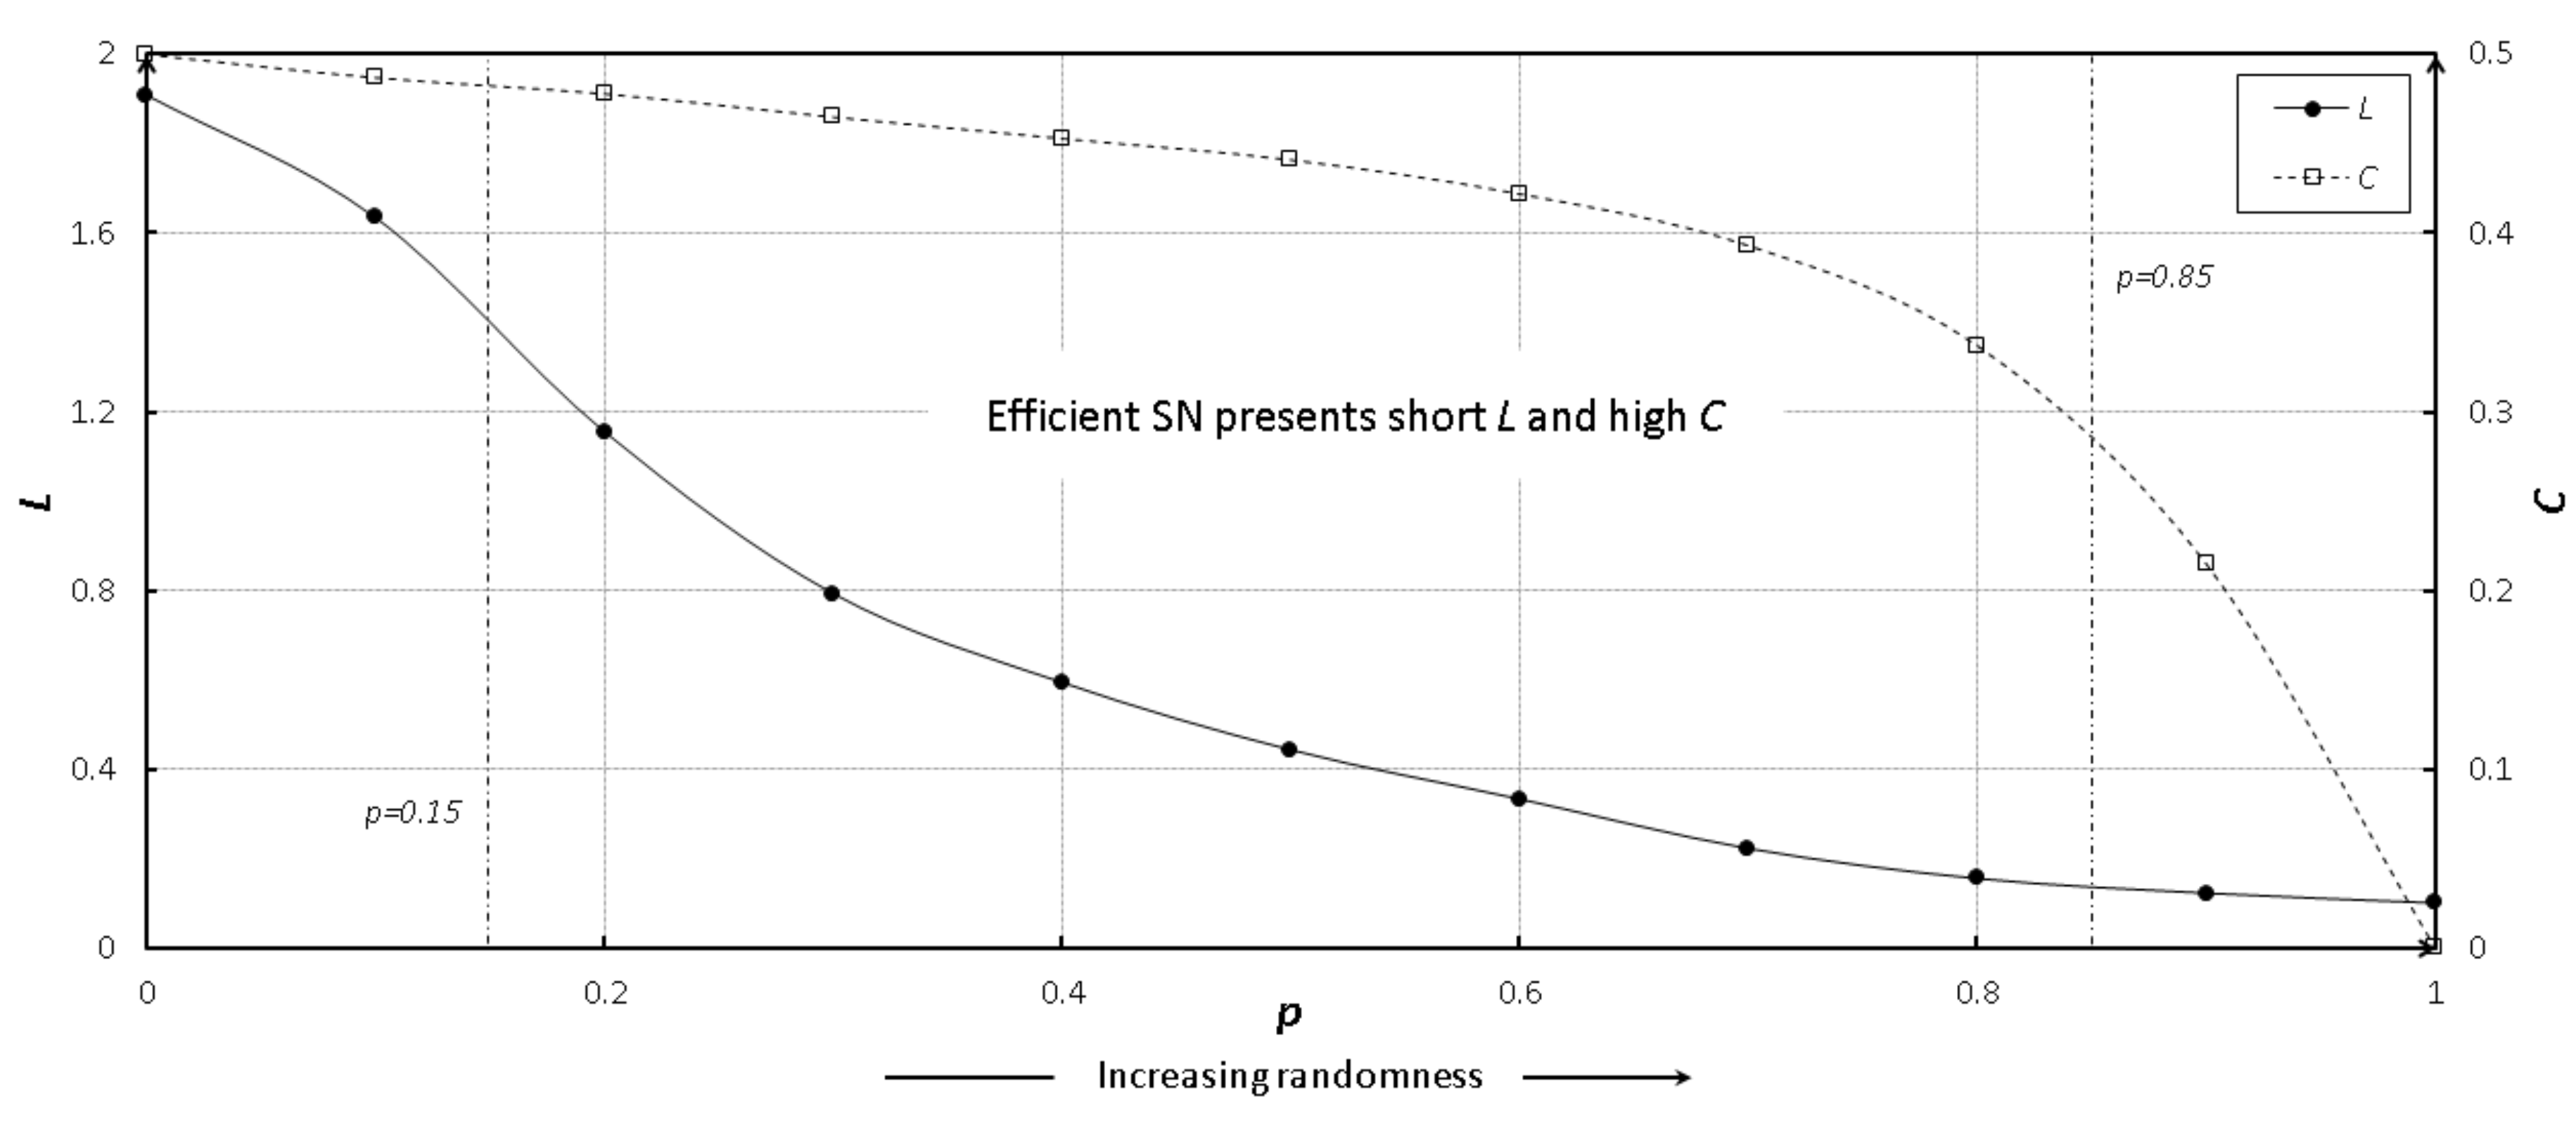
10] further advanced SN theory by embracing the CAS perspective by synthesizing the advances of CAS and demonstrating the small-world (SW) property [23] and scale-free (SF) nature [24] of SNs. The SW property suggested that an efficient SN should present a short average path length and high clustering coefficient, which means that the SW network could efficiently transfer the flows throughout the entire system. The SF nature suggested that an efficient SN should present a power law connectivity distribution, accounting for SN resilience derived by hub firms. Ohnishi et al. [15] also identified the SNs as complex networks with directed links. By comparing them with random networks, they revealed that the firms with a large firm-size in the SN tended to have a large PageRank [25], and small authority and hub scores [26]. Giannoccaro [11] characterized SN as a CAS, and used the NK simulation model [27,28] to exhibit SN properties, which demonstrated that the effects of capacity, efficiency and stability on the SN performance. In future studies, Giannoccaro et al. [12,13,14] conceptualized the SN theory from a CAS perspective, and performed several computational analyses such as Tobit regression [12], fitness landscape [13], and agent-based simulation [14]. These studies argued that CAS provided a conceptual and methodological framework to pursue the network-level issues of SNs, such as SN efficiency, SN resilience and SN interdependence. Zachariou et al. [16] also investigated directed inter-firm networks such as SN, and generalized sandpile dynamics of an SN from a network-level study of complex interactions. They pointed out that characterization of CASs and their measurements was still a developing field that is relevant for a variety of research issues from different viewpoints. Therefore, following a review of SNs literature drawn from the regional clusters, industrial sectors and CAS, a combination of multiple approaches is necessary to adequately explore these multi-level issues in SNs.
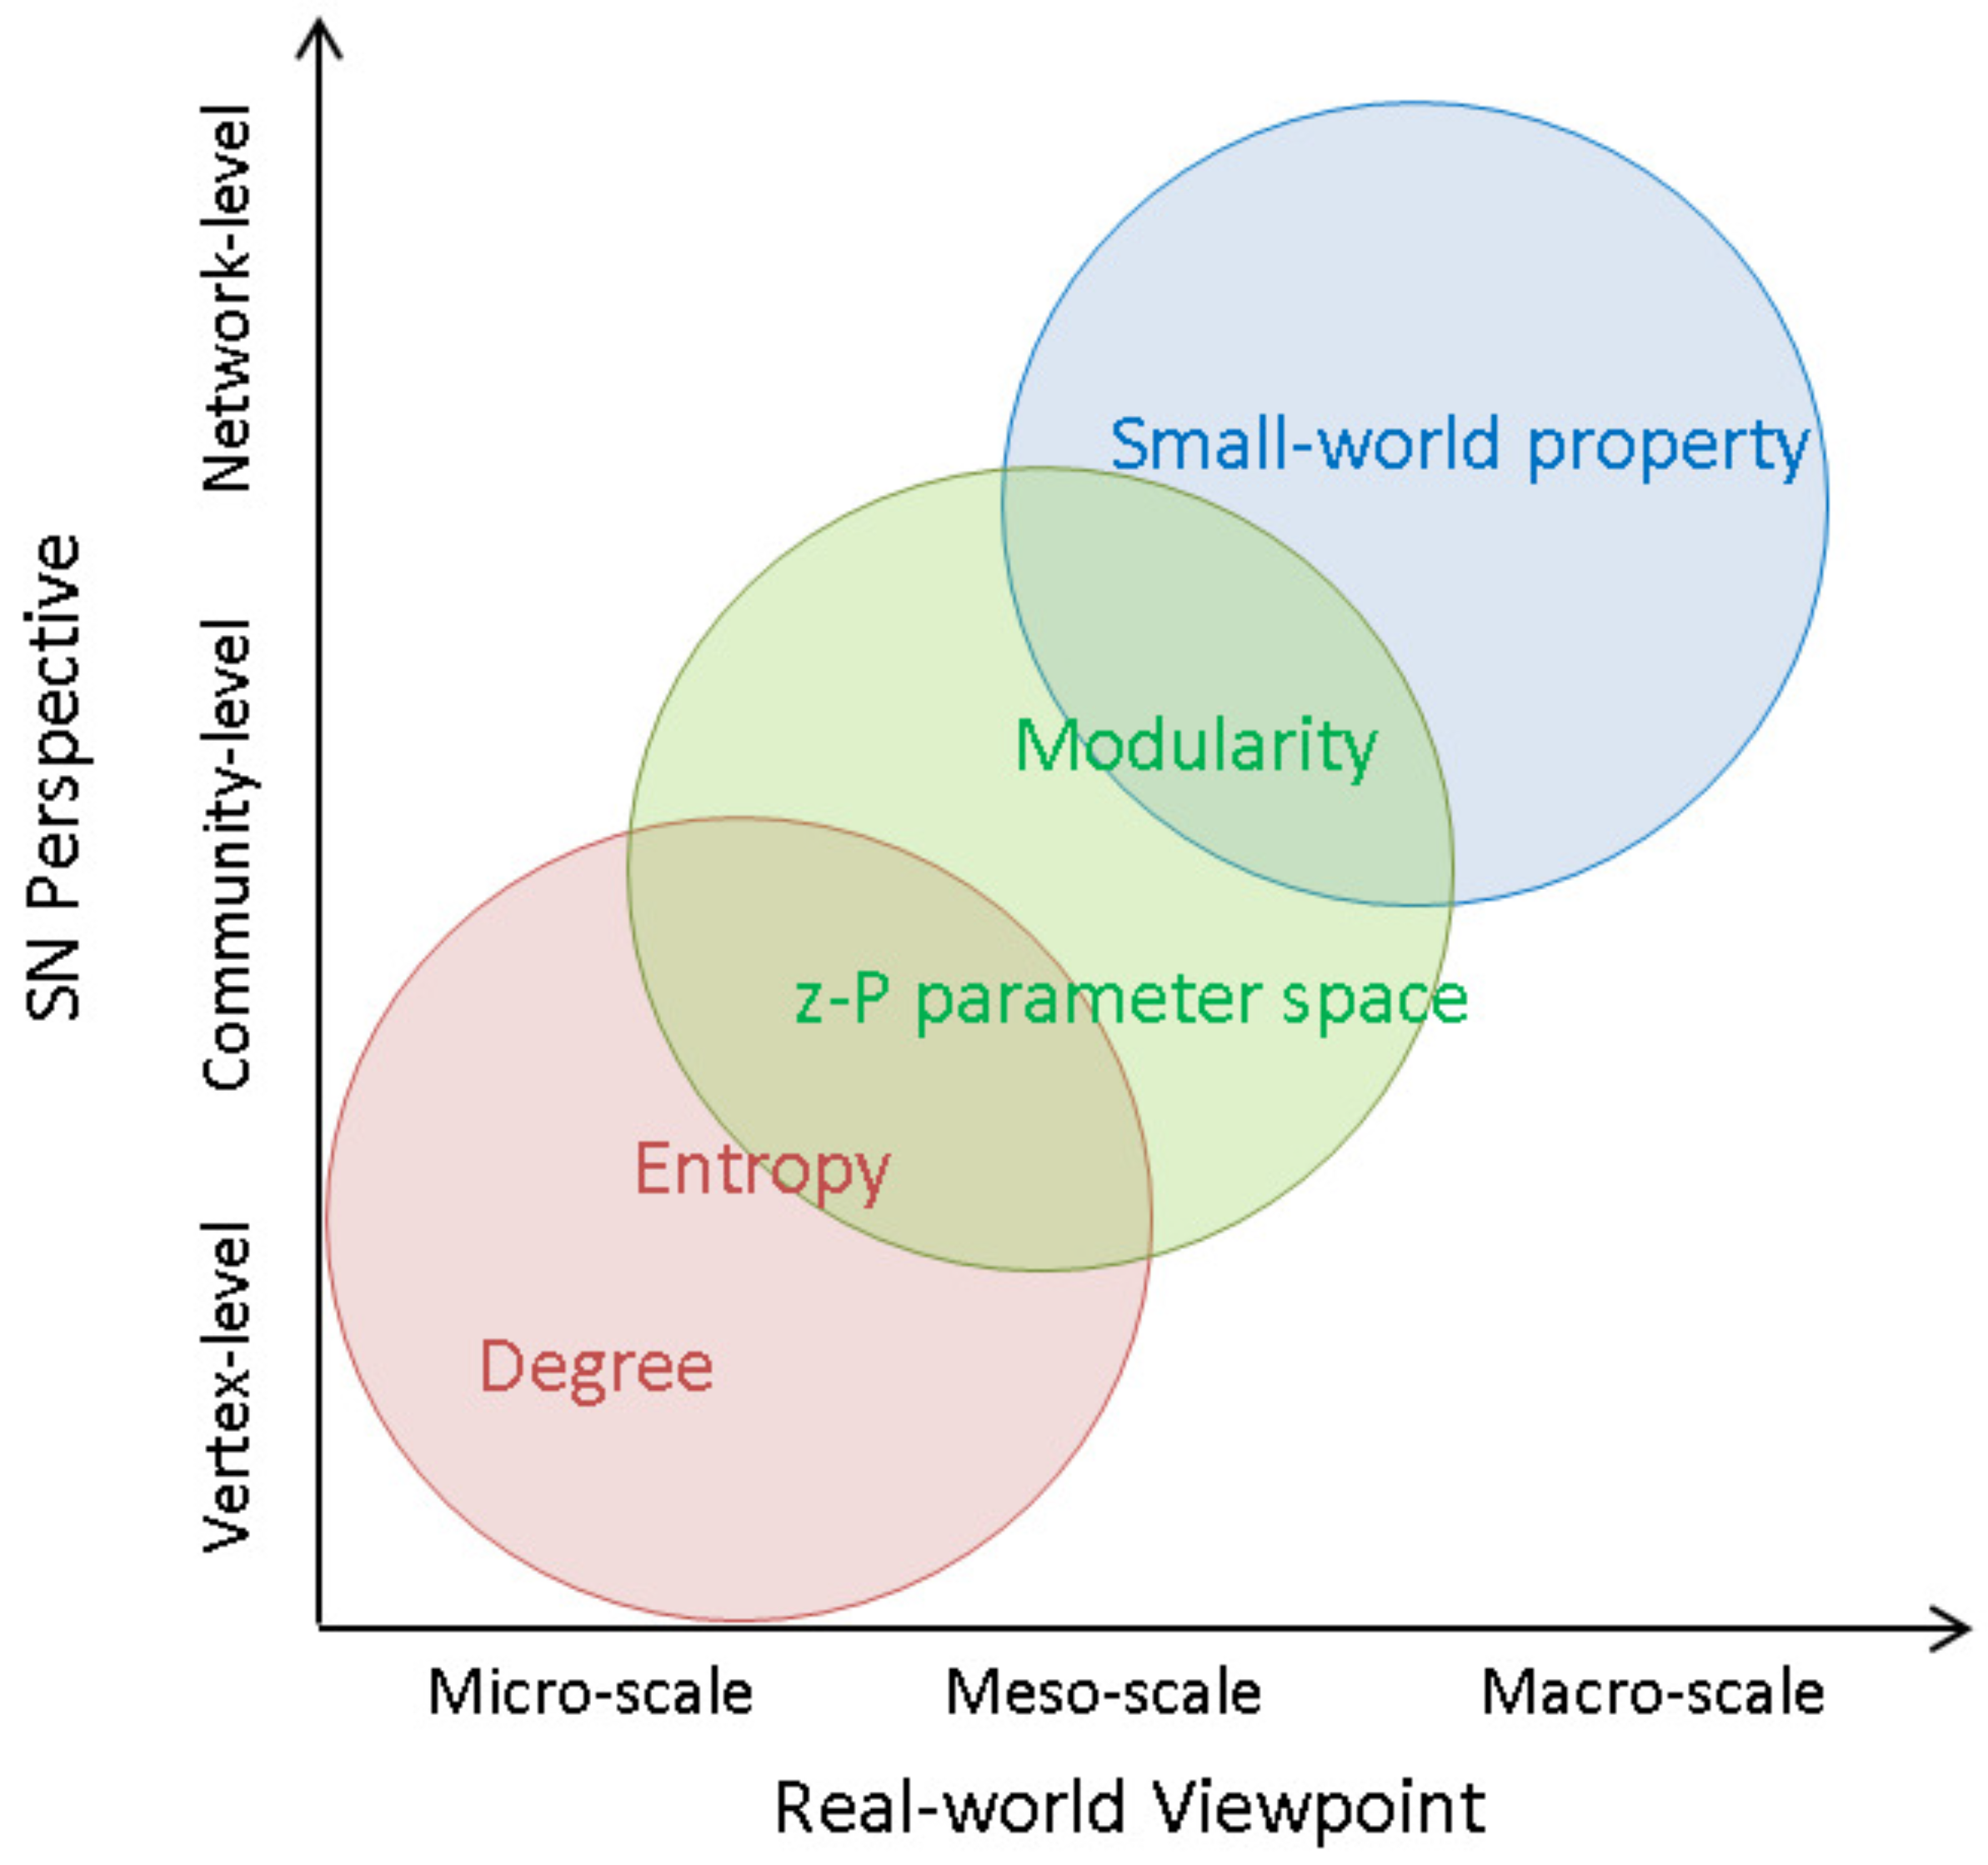
To enrich the SN theory relevant to such difficult issues, this paper presents an integrated investigation of multi-level network analysis from a network-, community- and vertex-perspective. For the network-perspective analysis, we re-emphasized the effects of SW properties (i.e., average shortest path length L and average clustering coefficient C) presented in [23] as to how to evaluate SN efficiency. However, Capaldo and Giannoccaro [
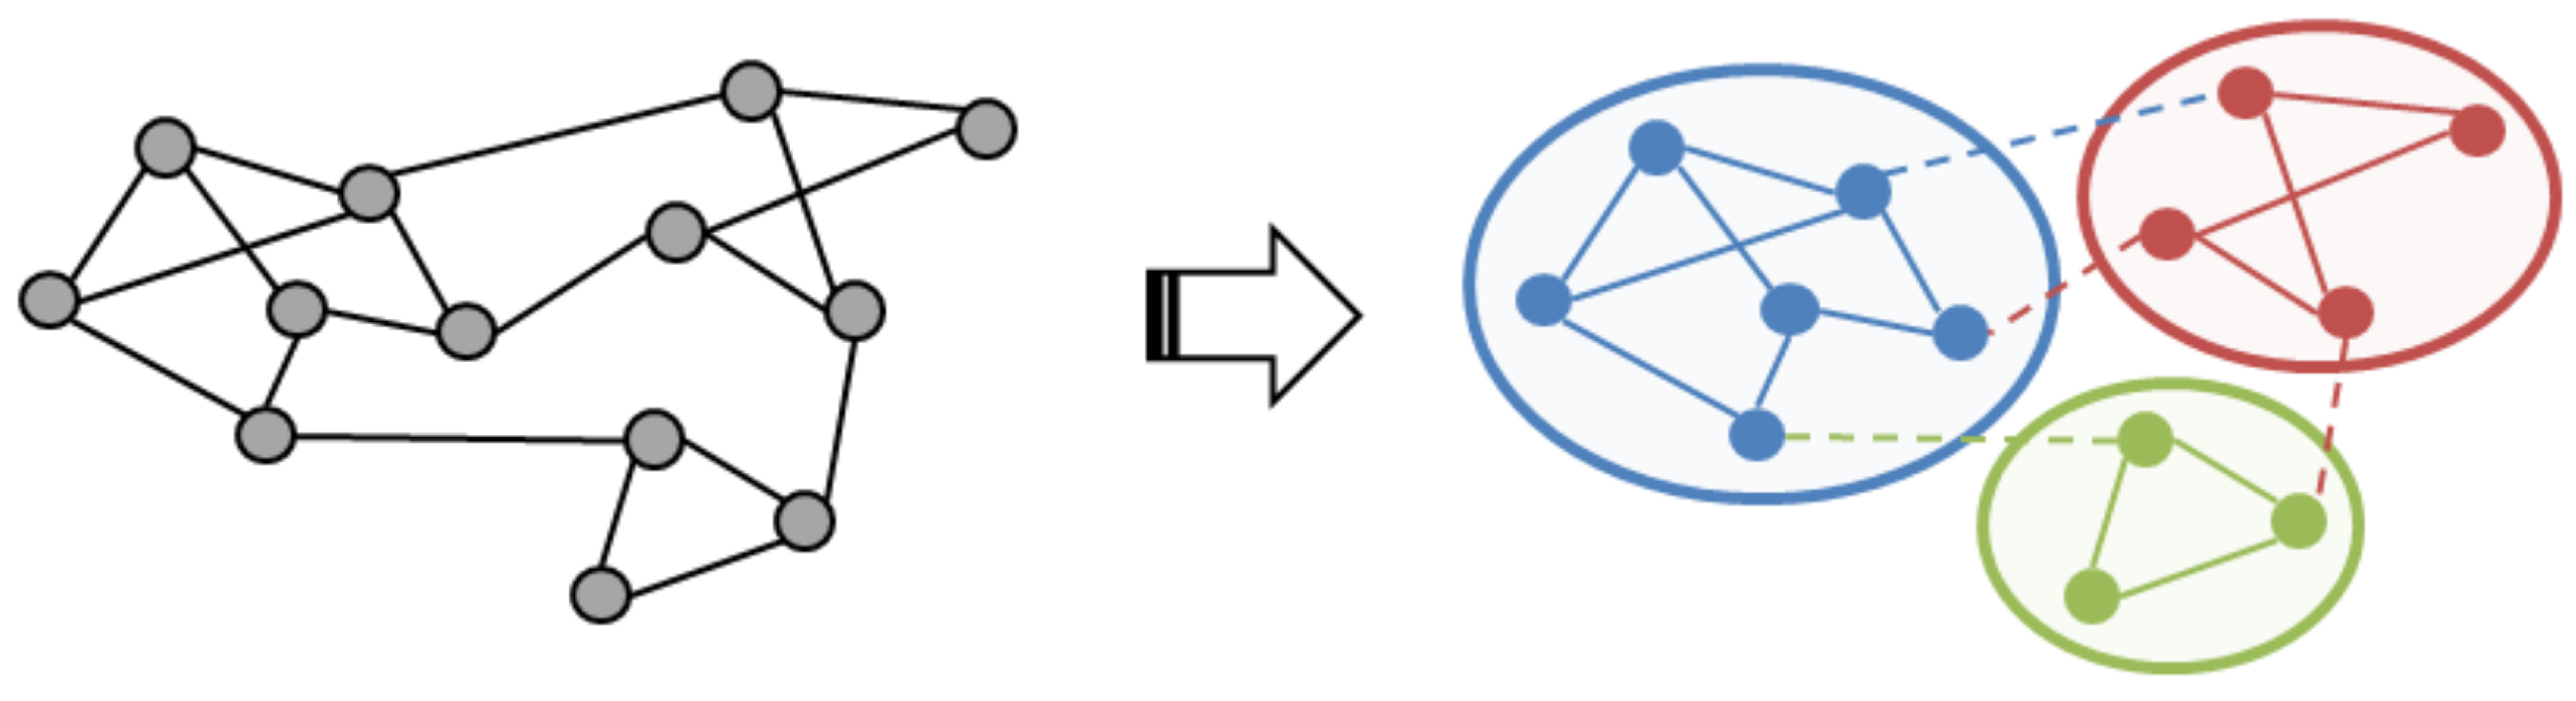
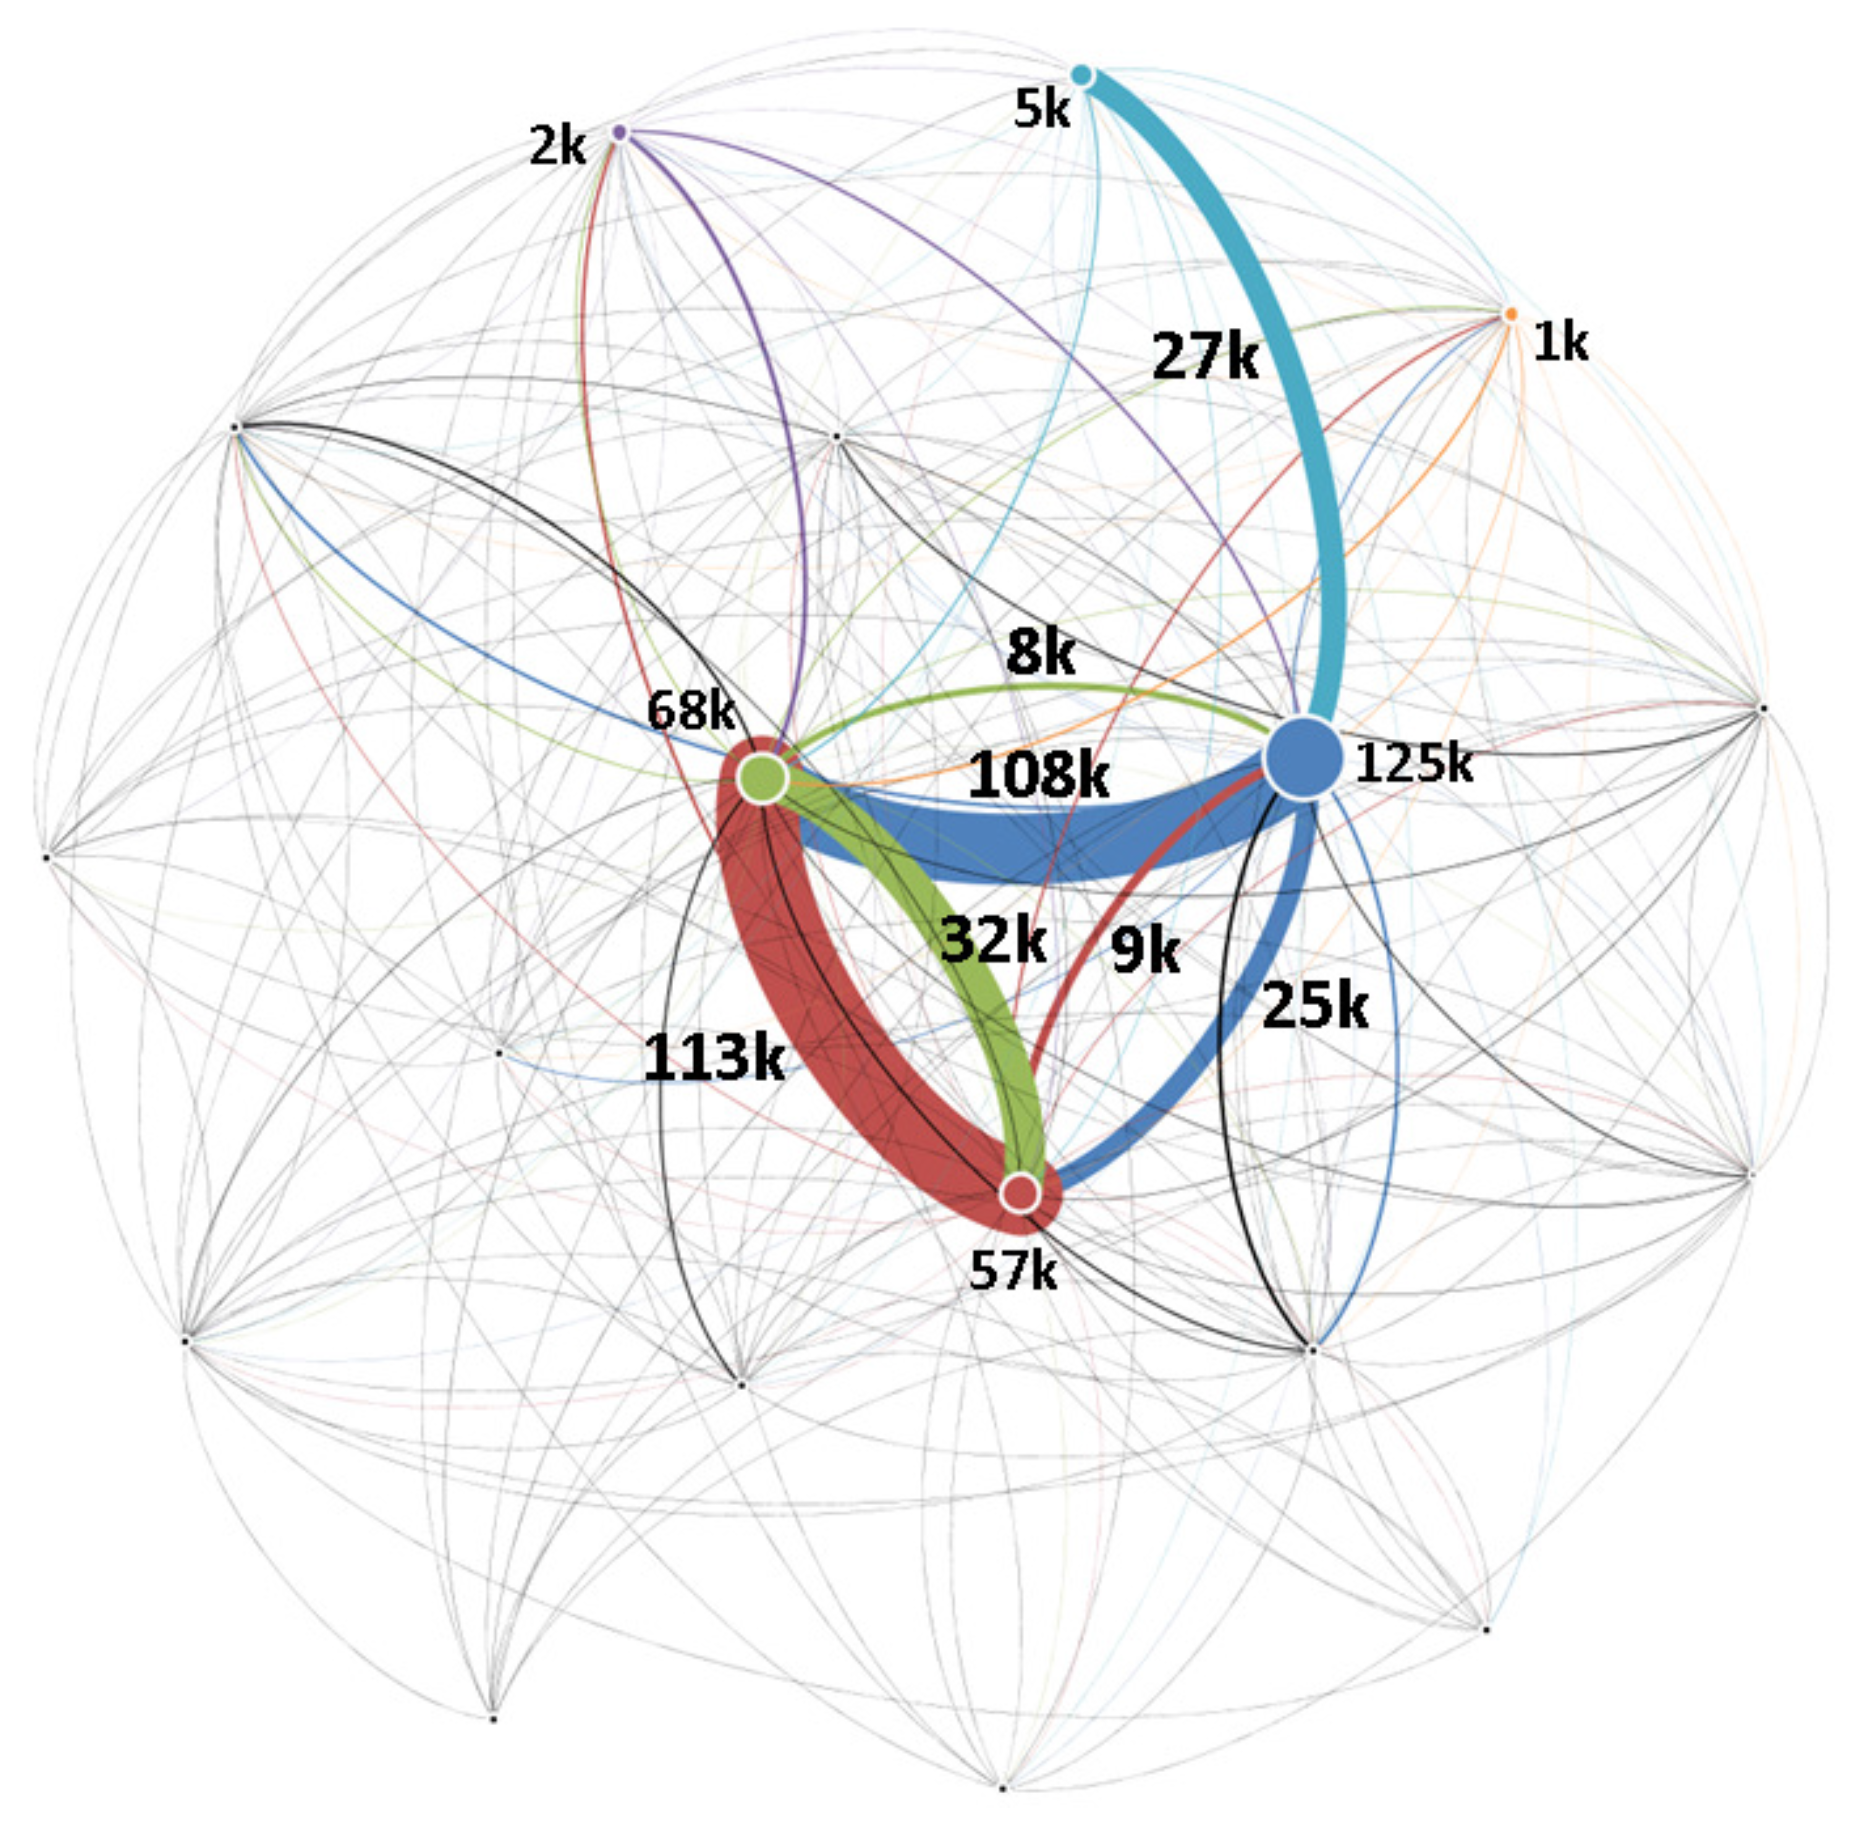
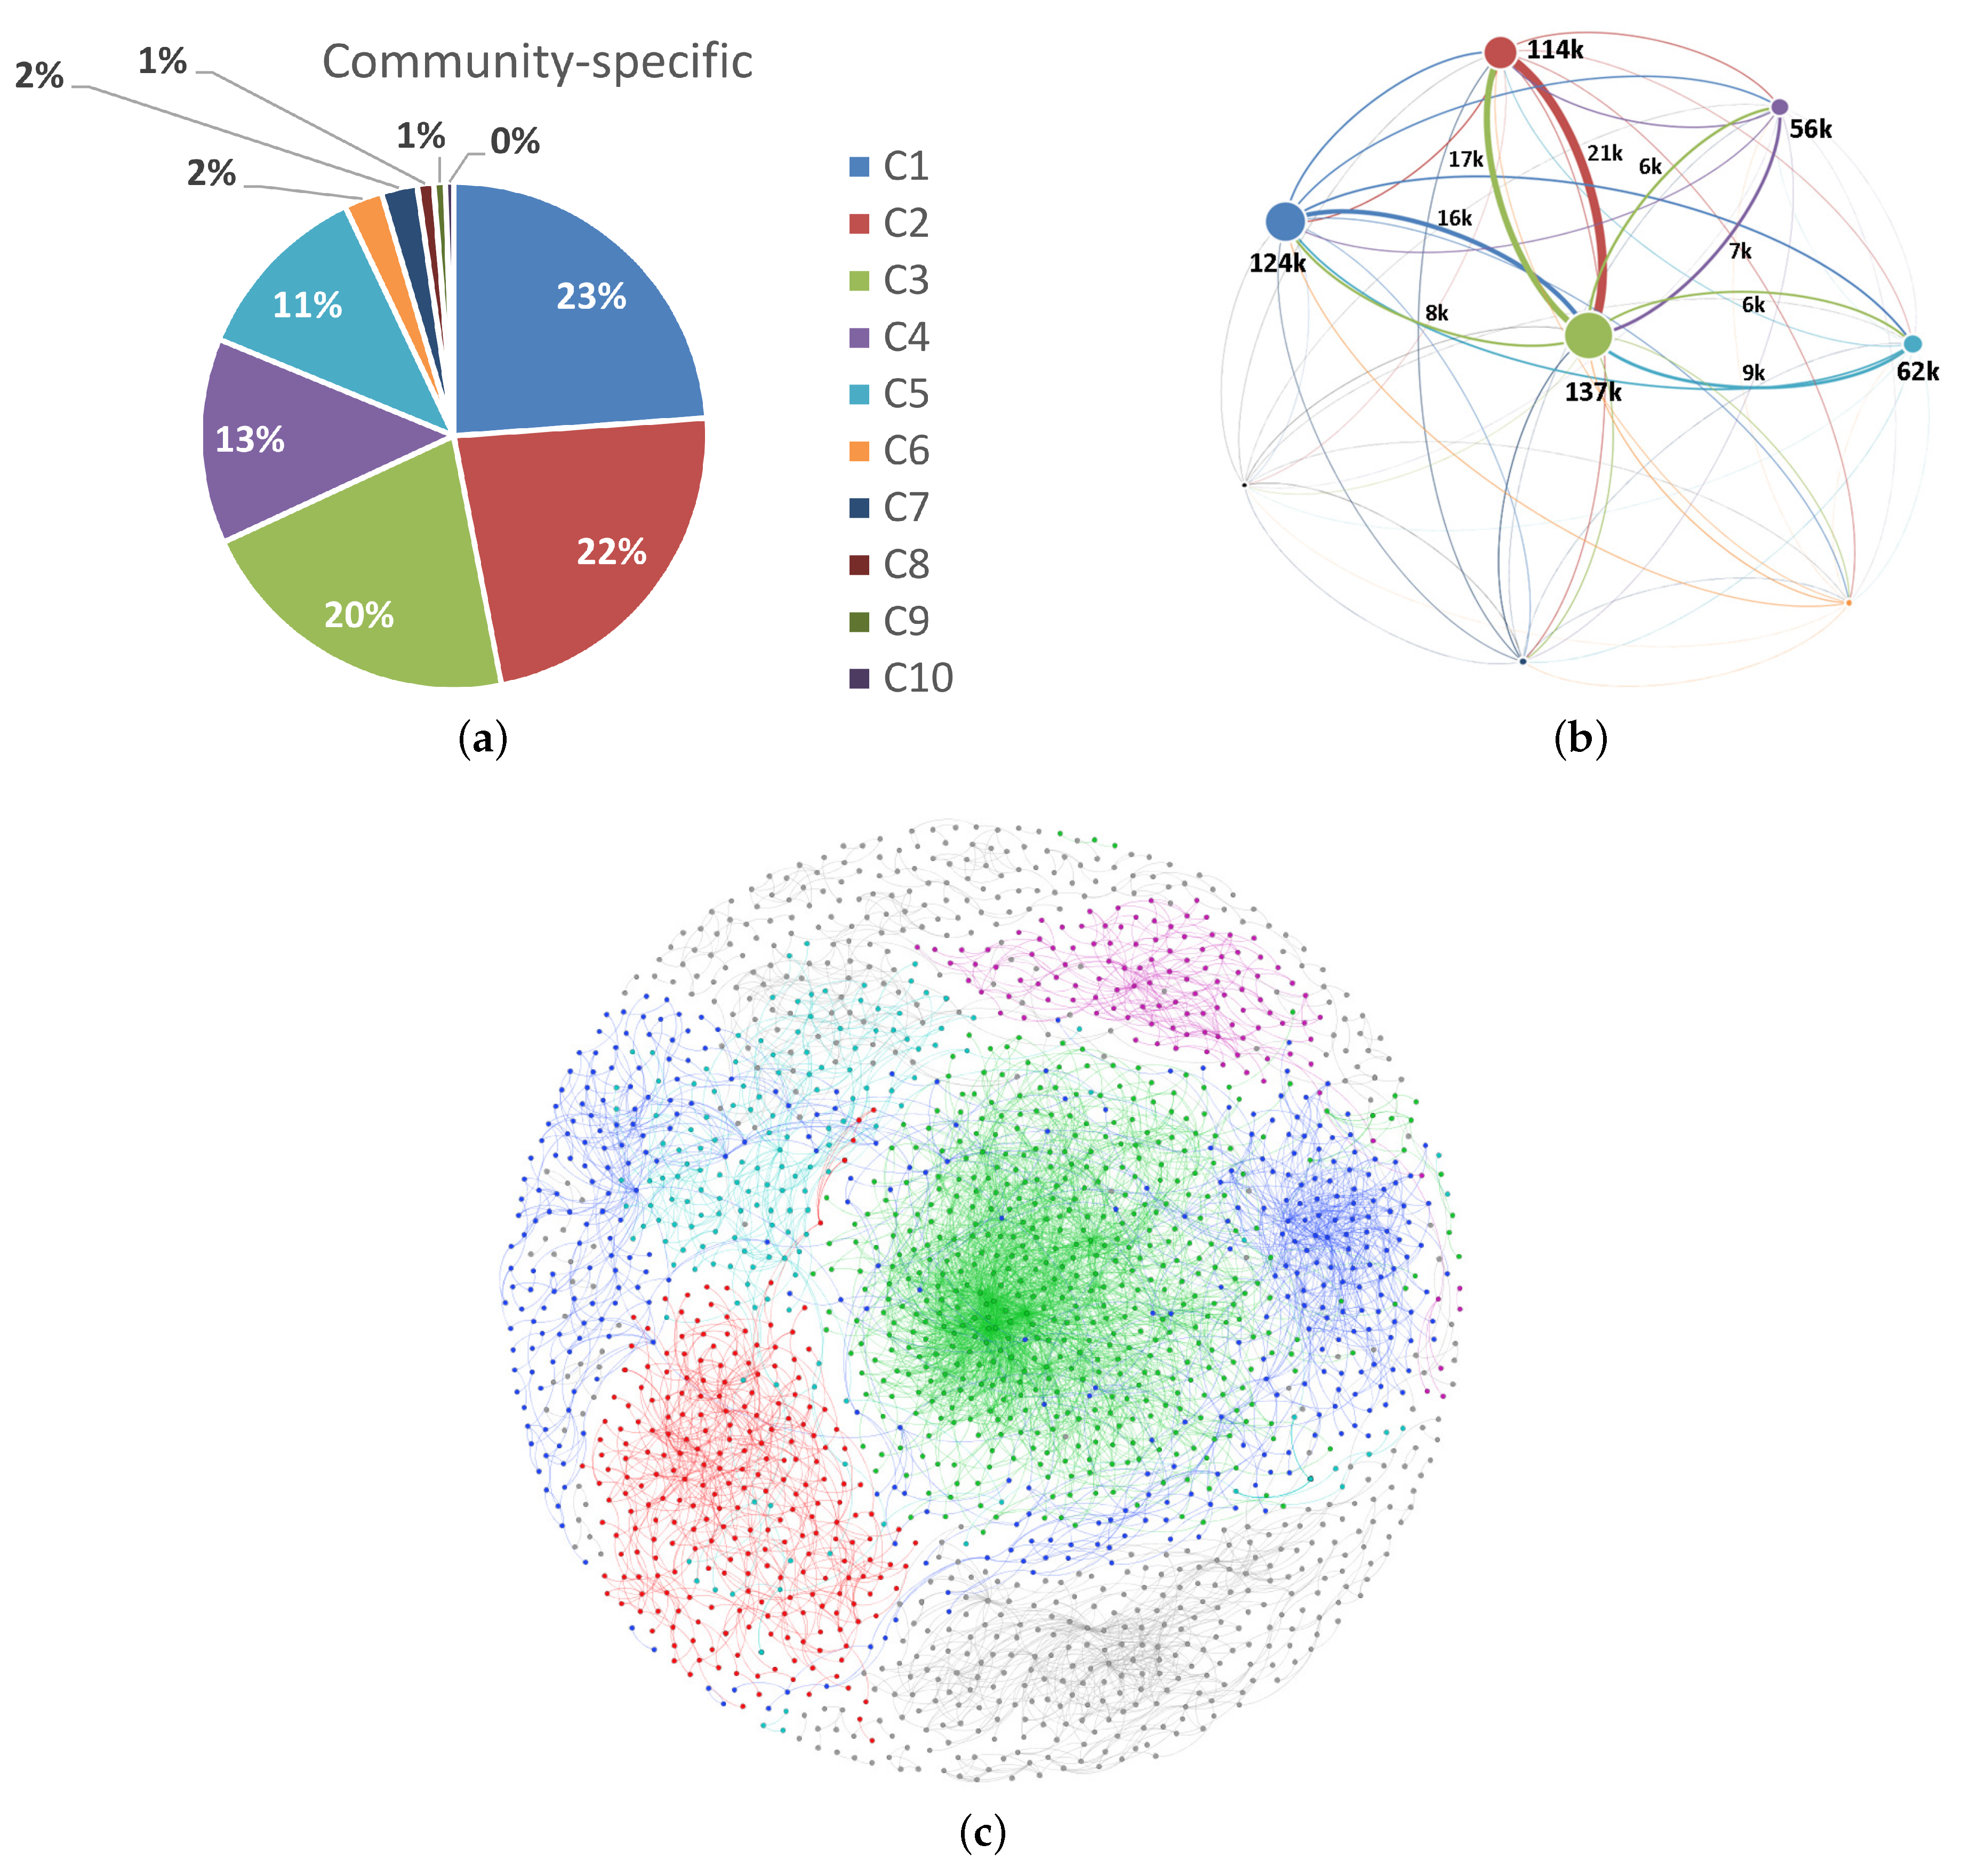
14] investigated 10 patterns of SN forms. Fewer studies have been devoted to this organizational issue by comparing SW properties between distinctive real-world communities with regard to geographic proximity and industrial affinity. Therefore, in the community-perspective analysis, we employed a network clustering algorithm known as the Newman method to optimize the modularity of the real-world SN [29,30,31]. The Newman method employs a hierarchical search by the maximizing modularity 
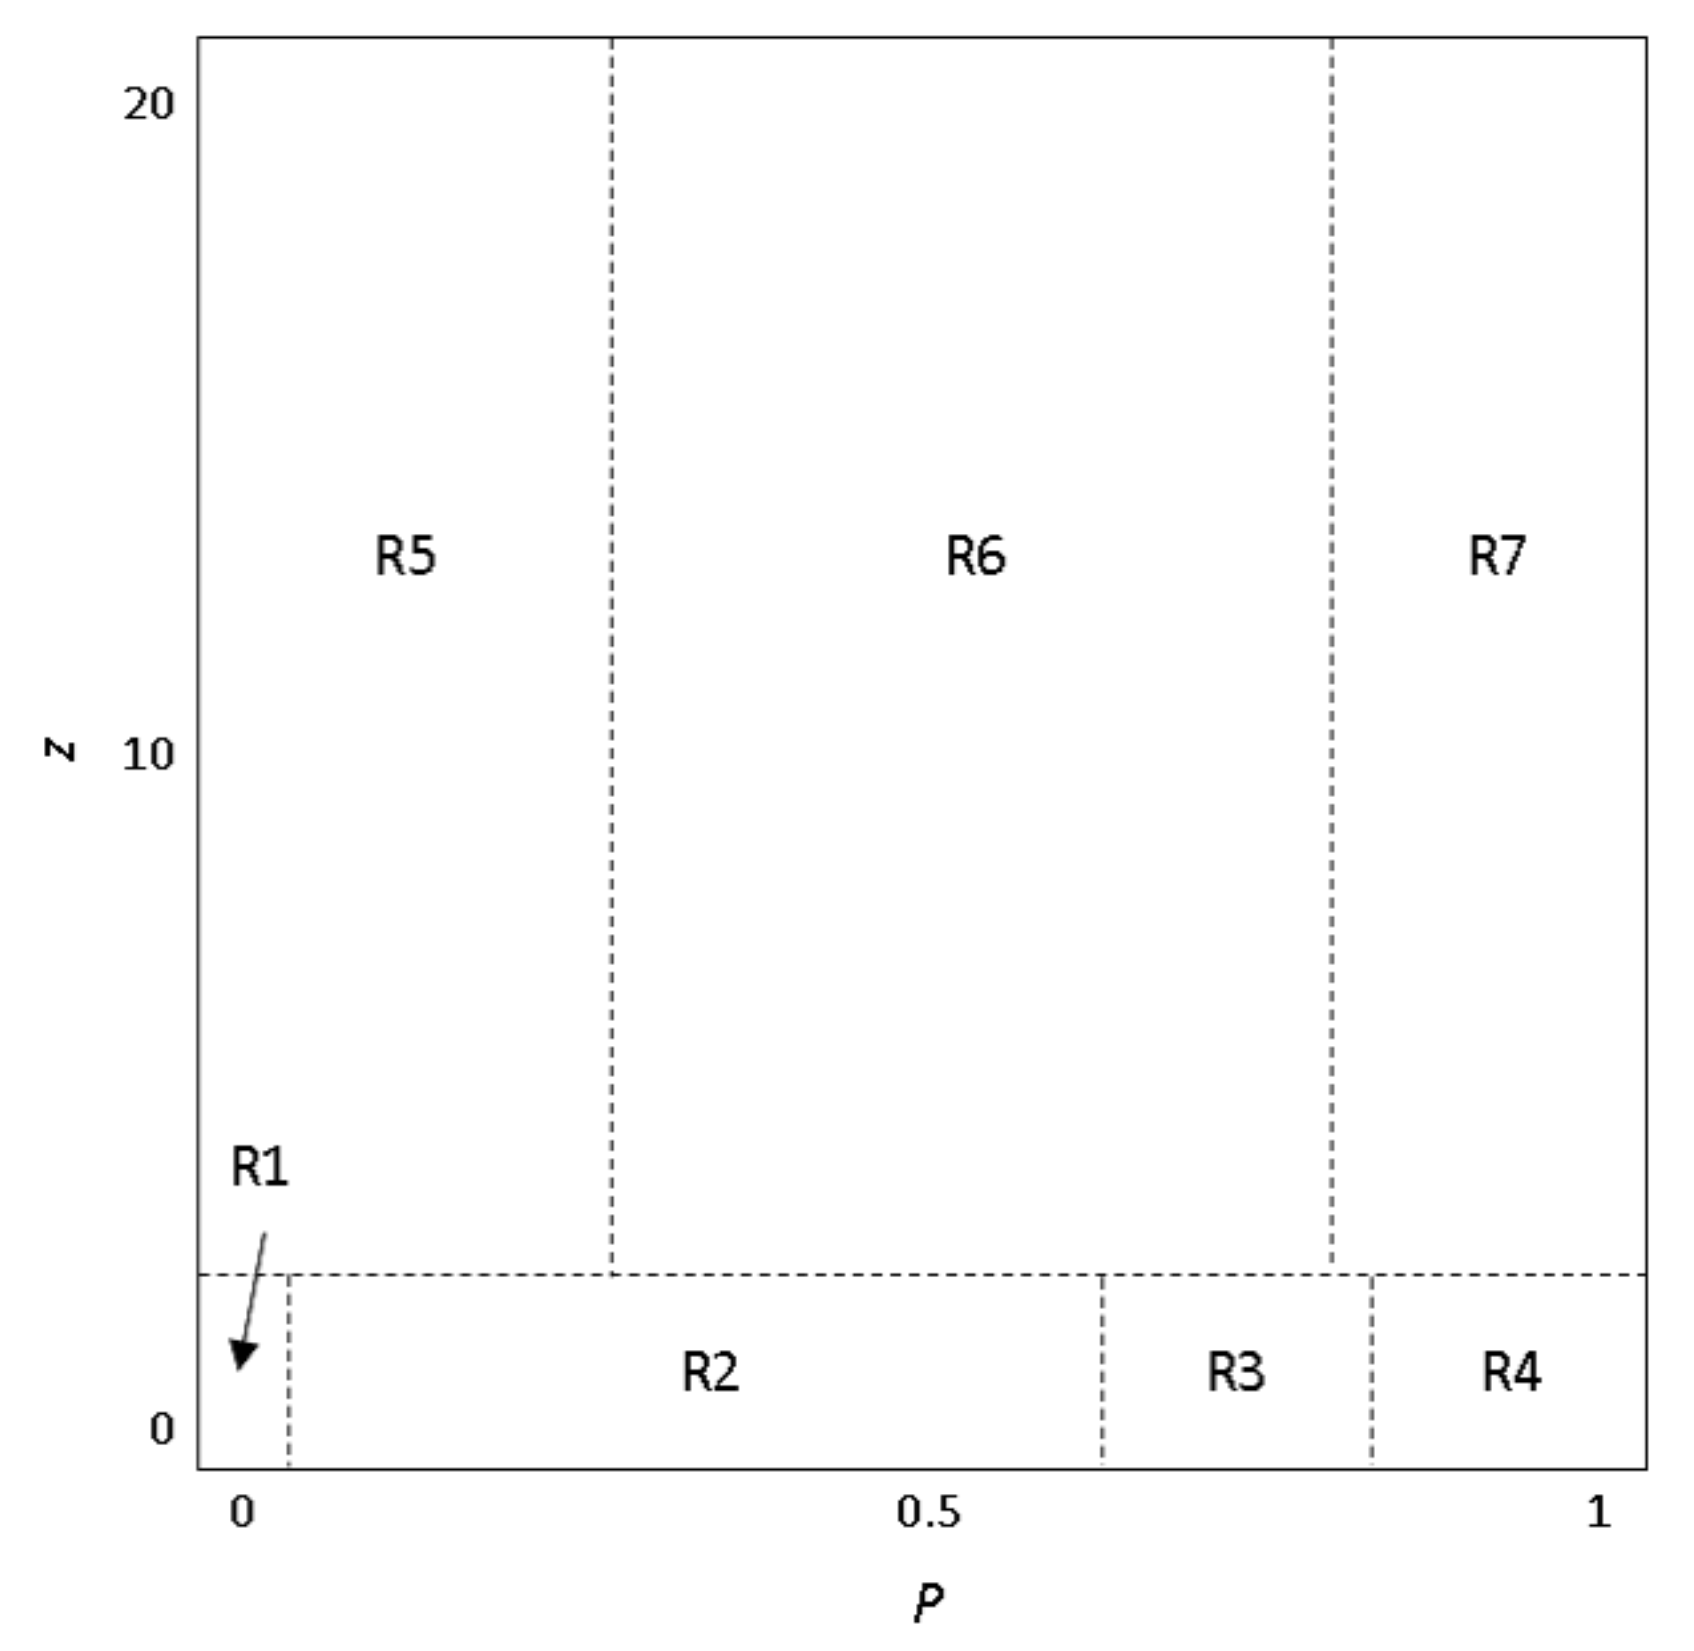
Q, which measures the fraction of connectedness among the communities of the original network from the edge betweenness. Based on the results of the experiment, five main business communities were extracted from the cross-industry and cross-region economies. After clustering, we employed a topological measure of z-P parameter space [32] to re-define the hub firms instead of degree. The z-P parameter space uses a multi-criteria where one is the within-module degree z in its own community and the other one is the participation coefficient P between other communities. This measure separates nodes into seven different roles, where we focused on the “connector hubs”. Due to the existence of such connector hub firms, different communities can overlap boundaries for their flows of information [10], improve the SM properties of SN efficiency, and SN interdependence [3]. Finally, we evaluated the SN resilience of distinctive communities from a vertex-level perspective. This paper employed the entropy [33,34,35,36,37,38,39,
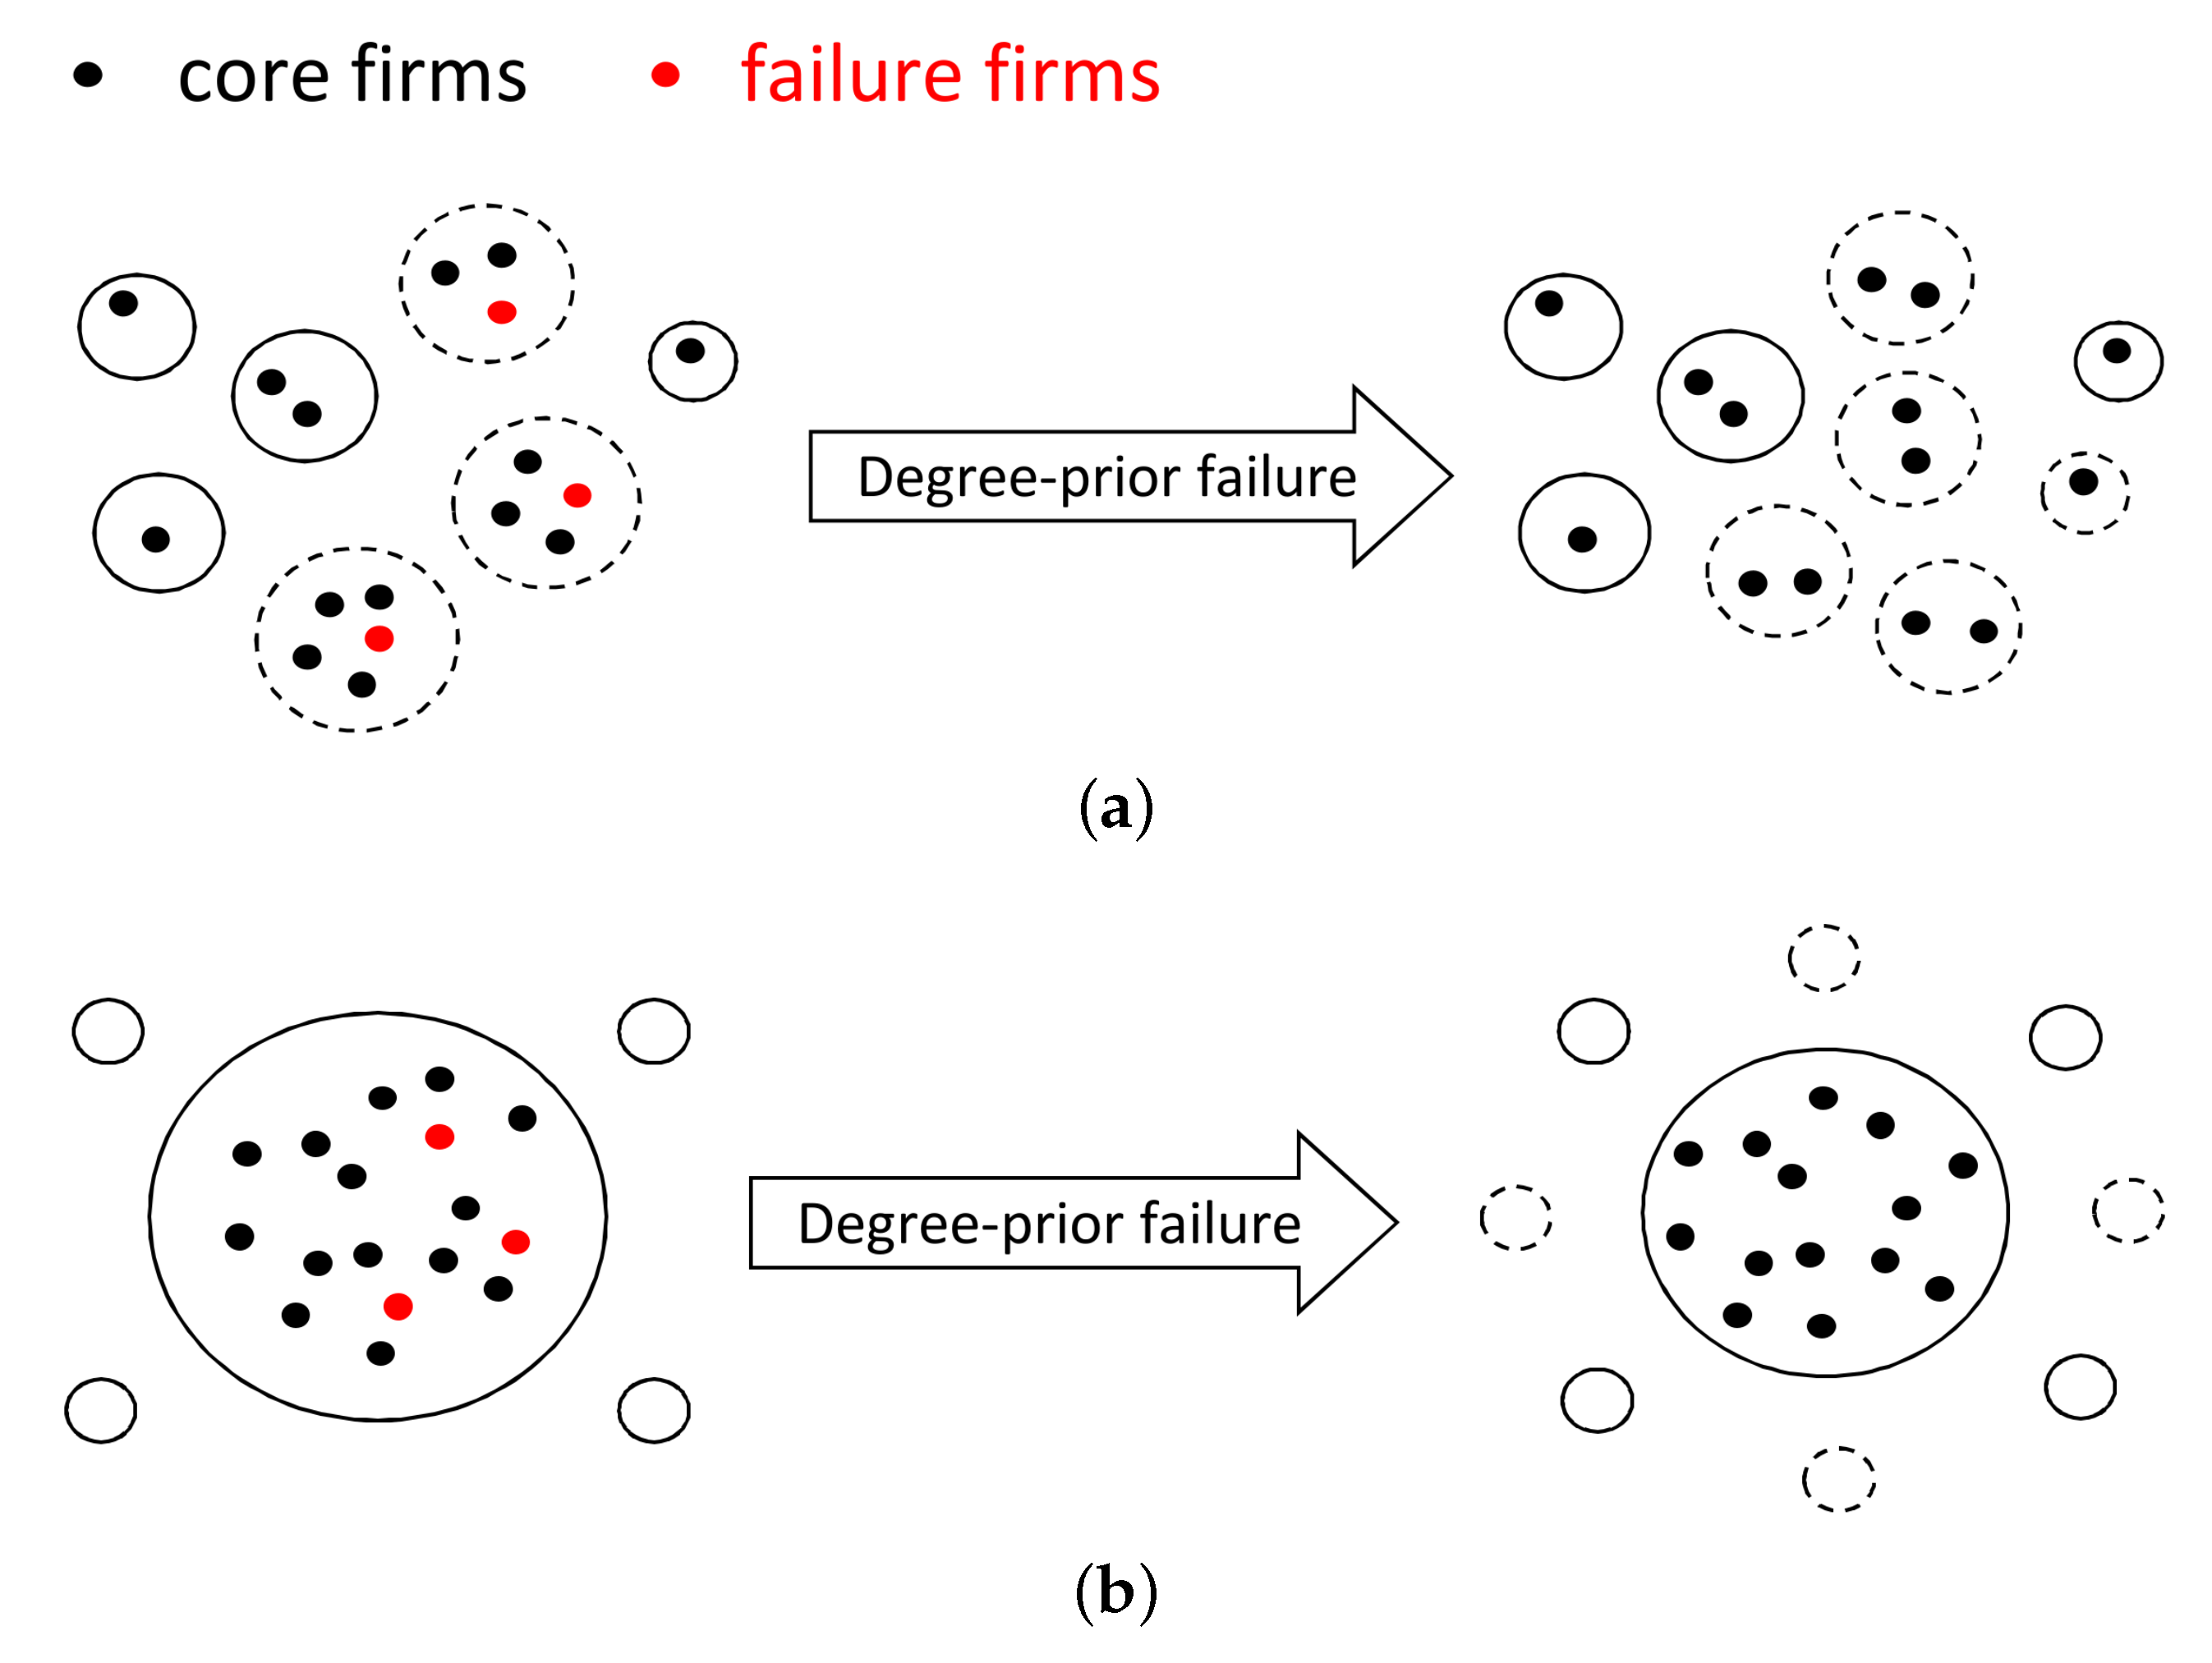
40], which is generated by node degree [41]. Several elimination scenarios of random failures and targeted attacks (i.e., degree-prior and P-prior) were simulated to investigate the complexity and robustness of the SN by sequentially removing the firms [10,18,42,
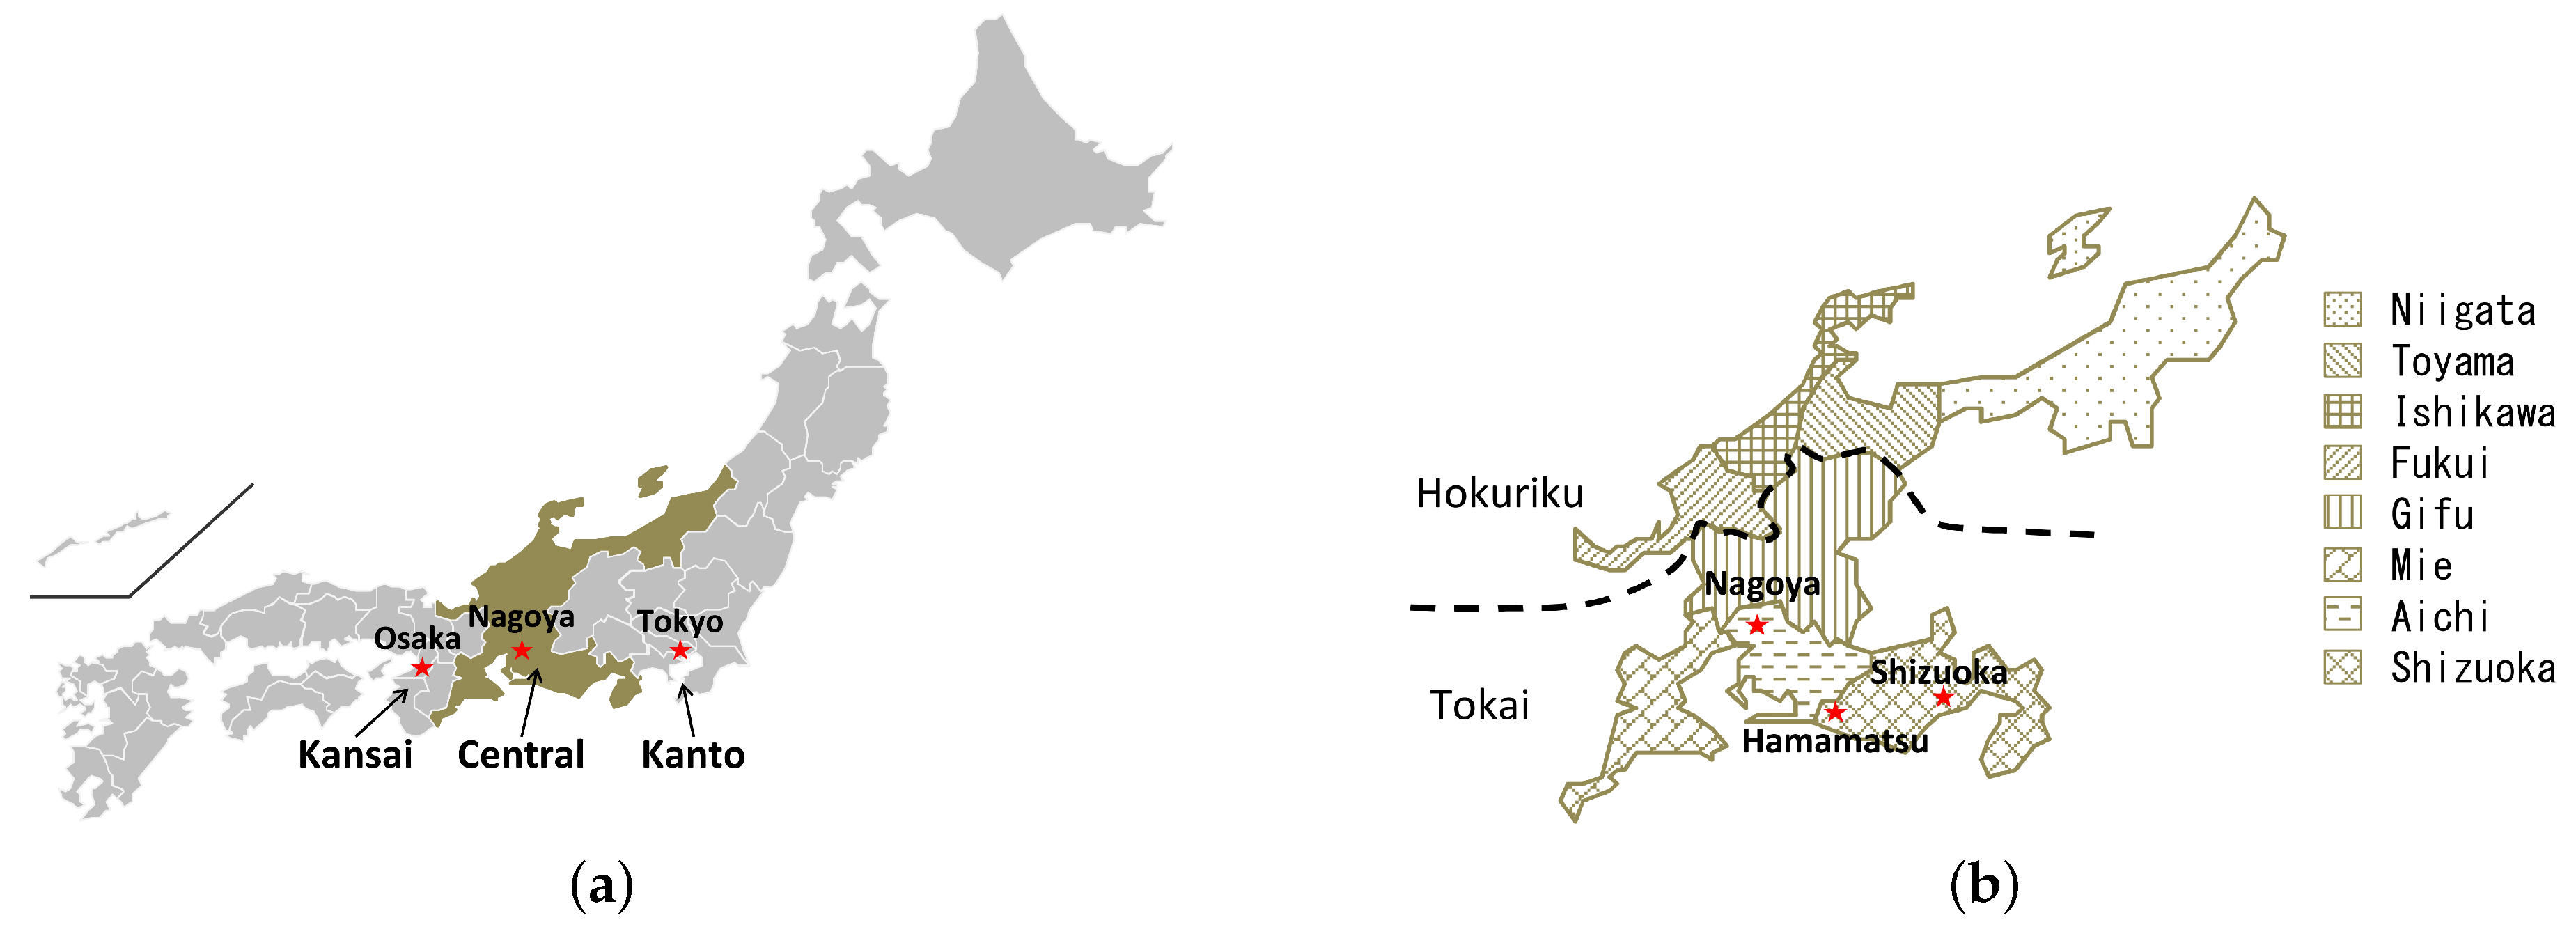
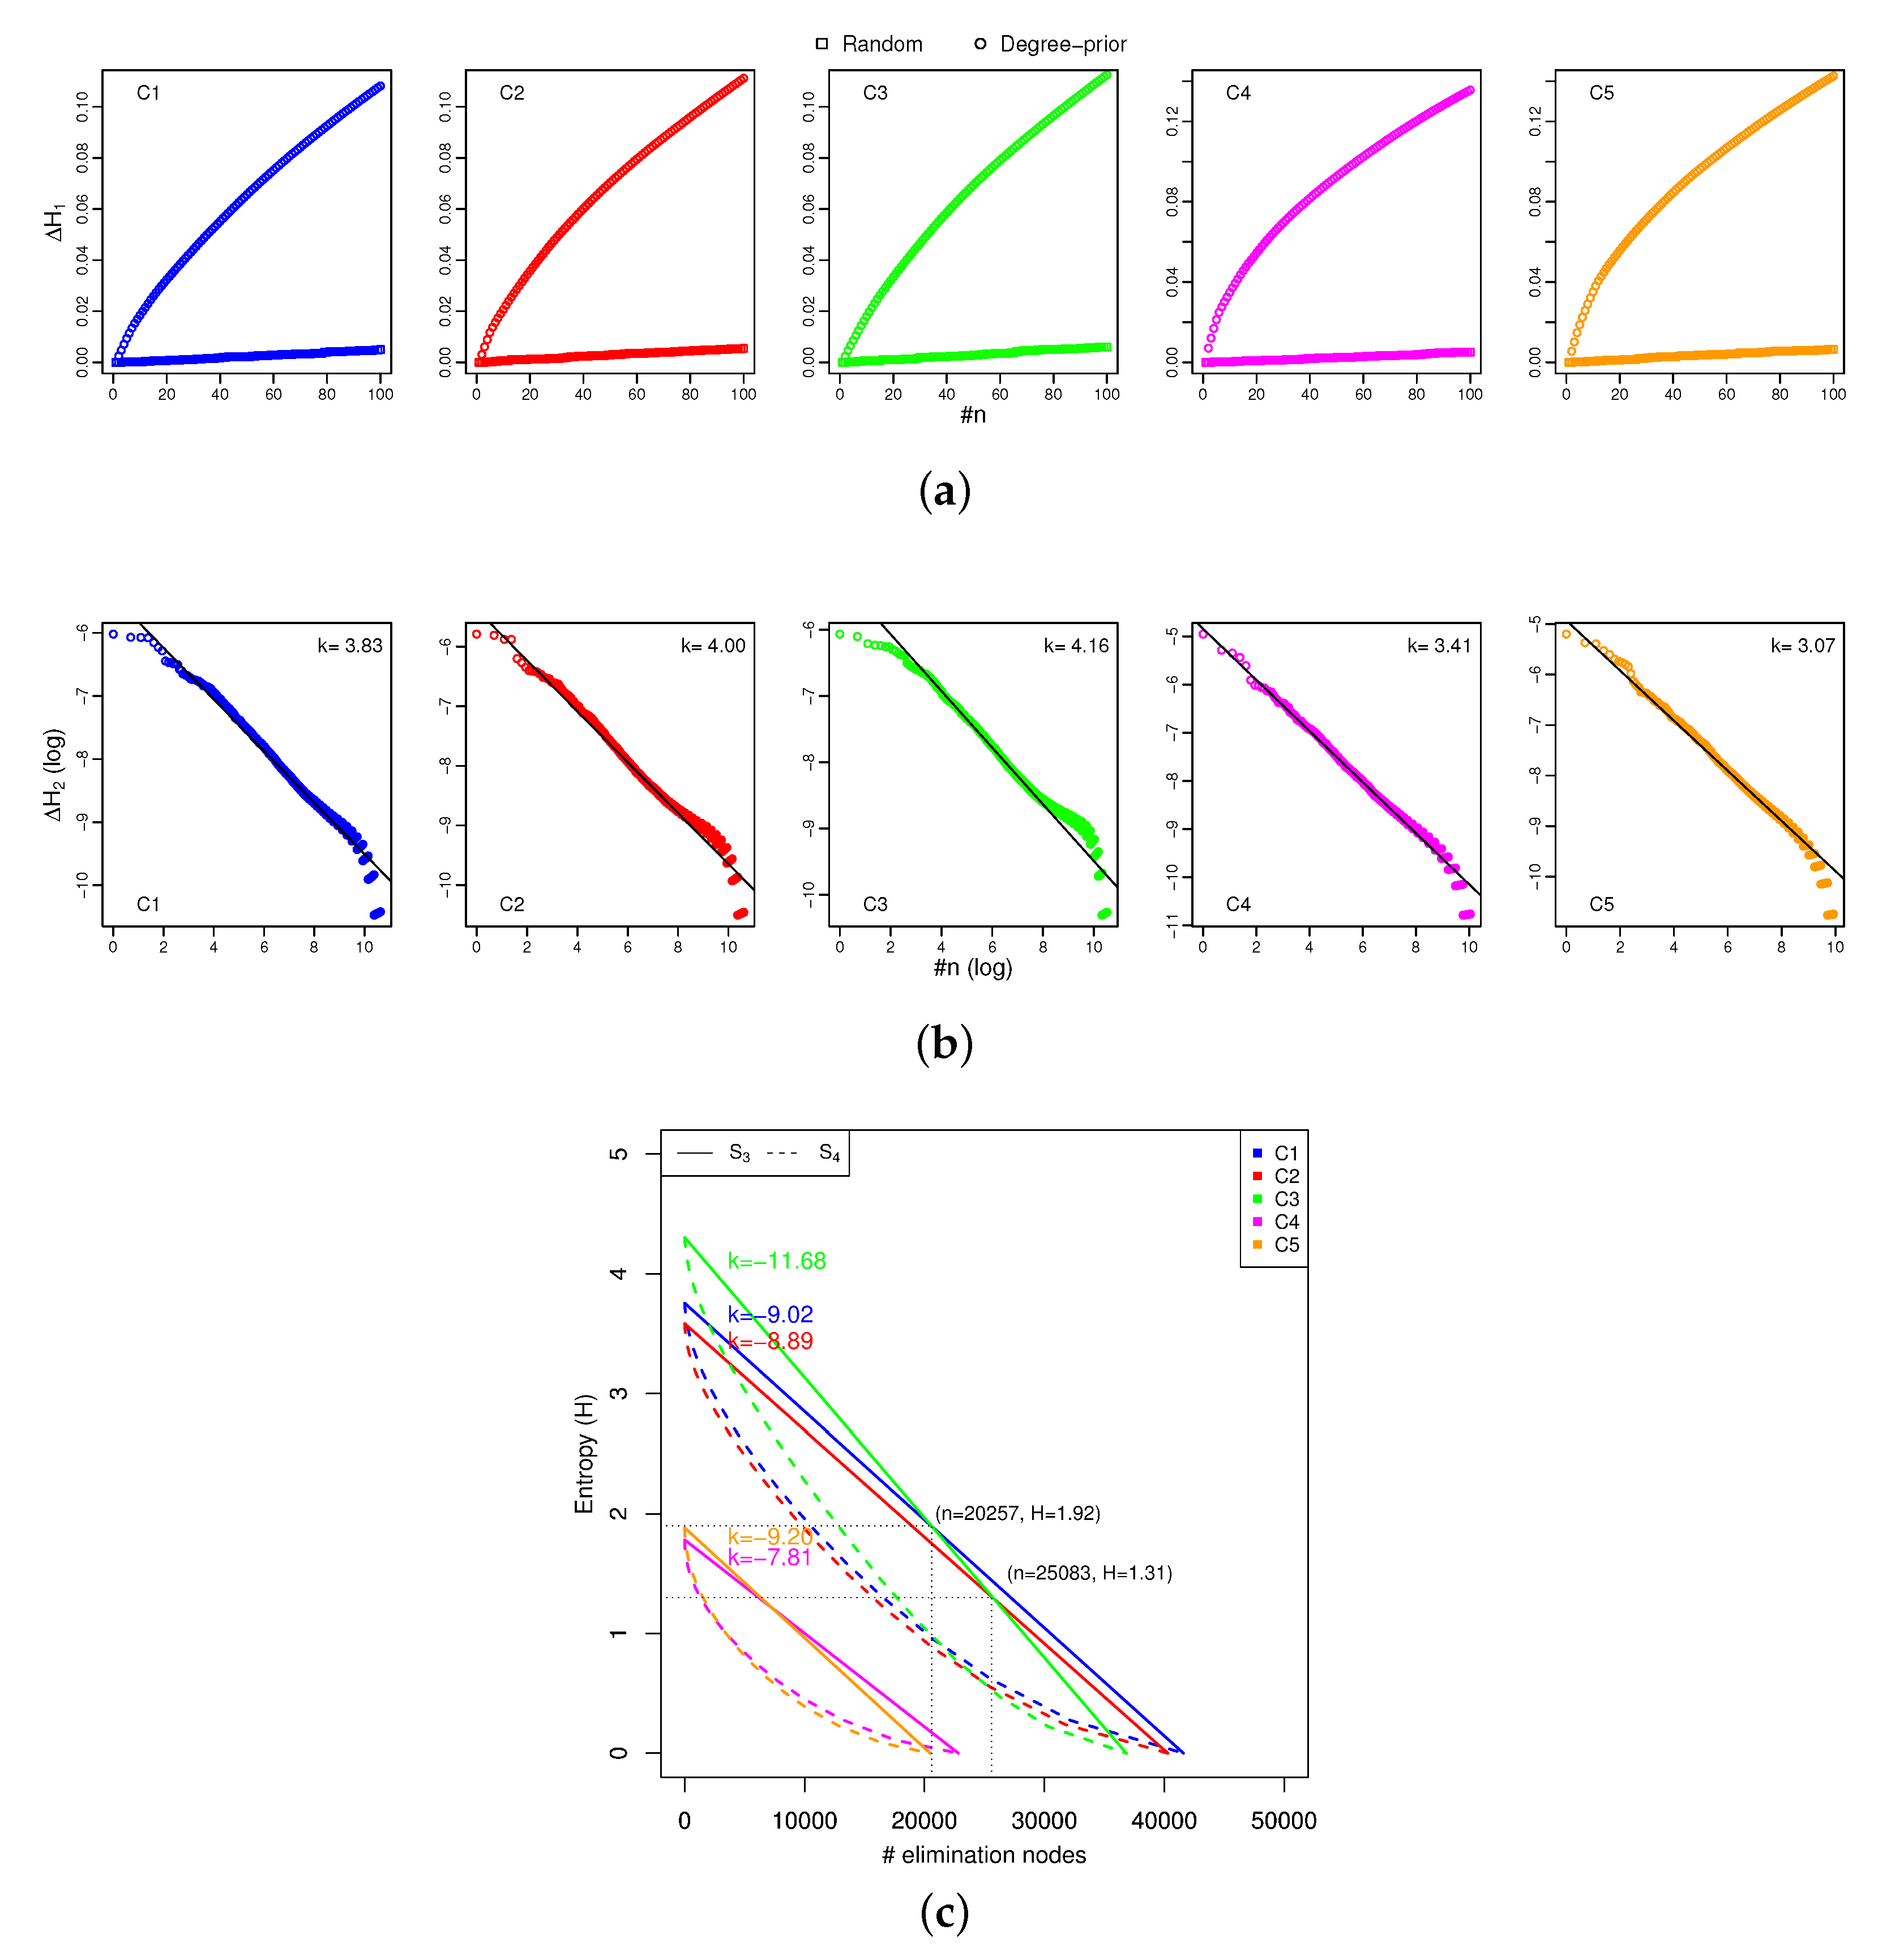
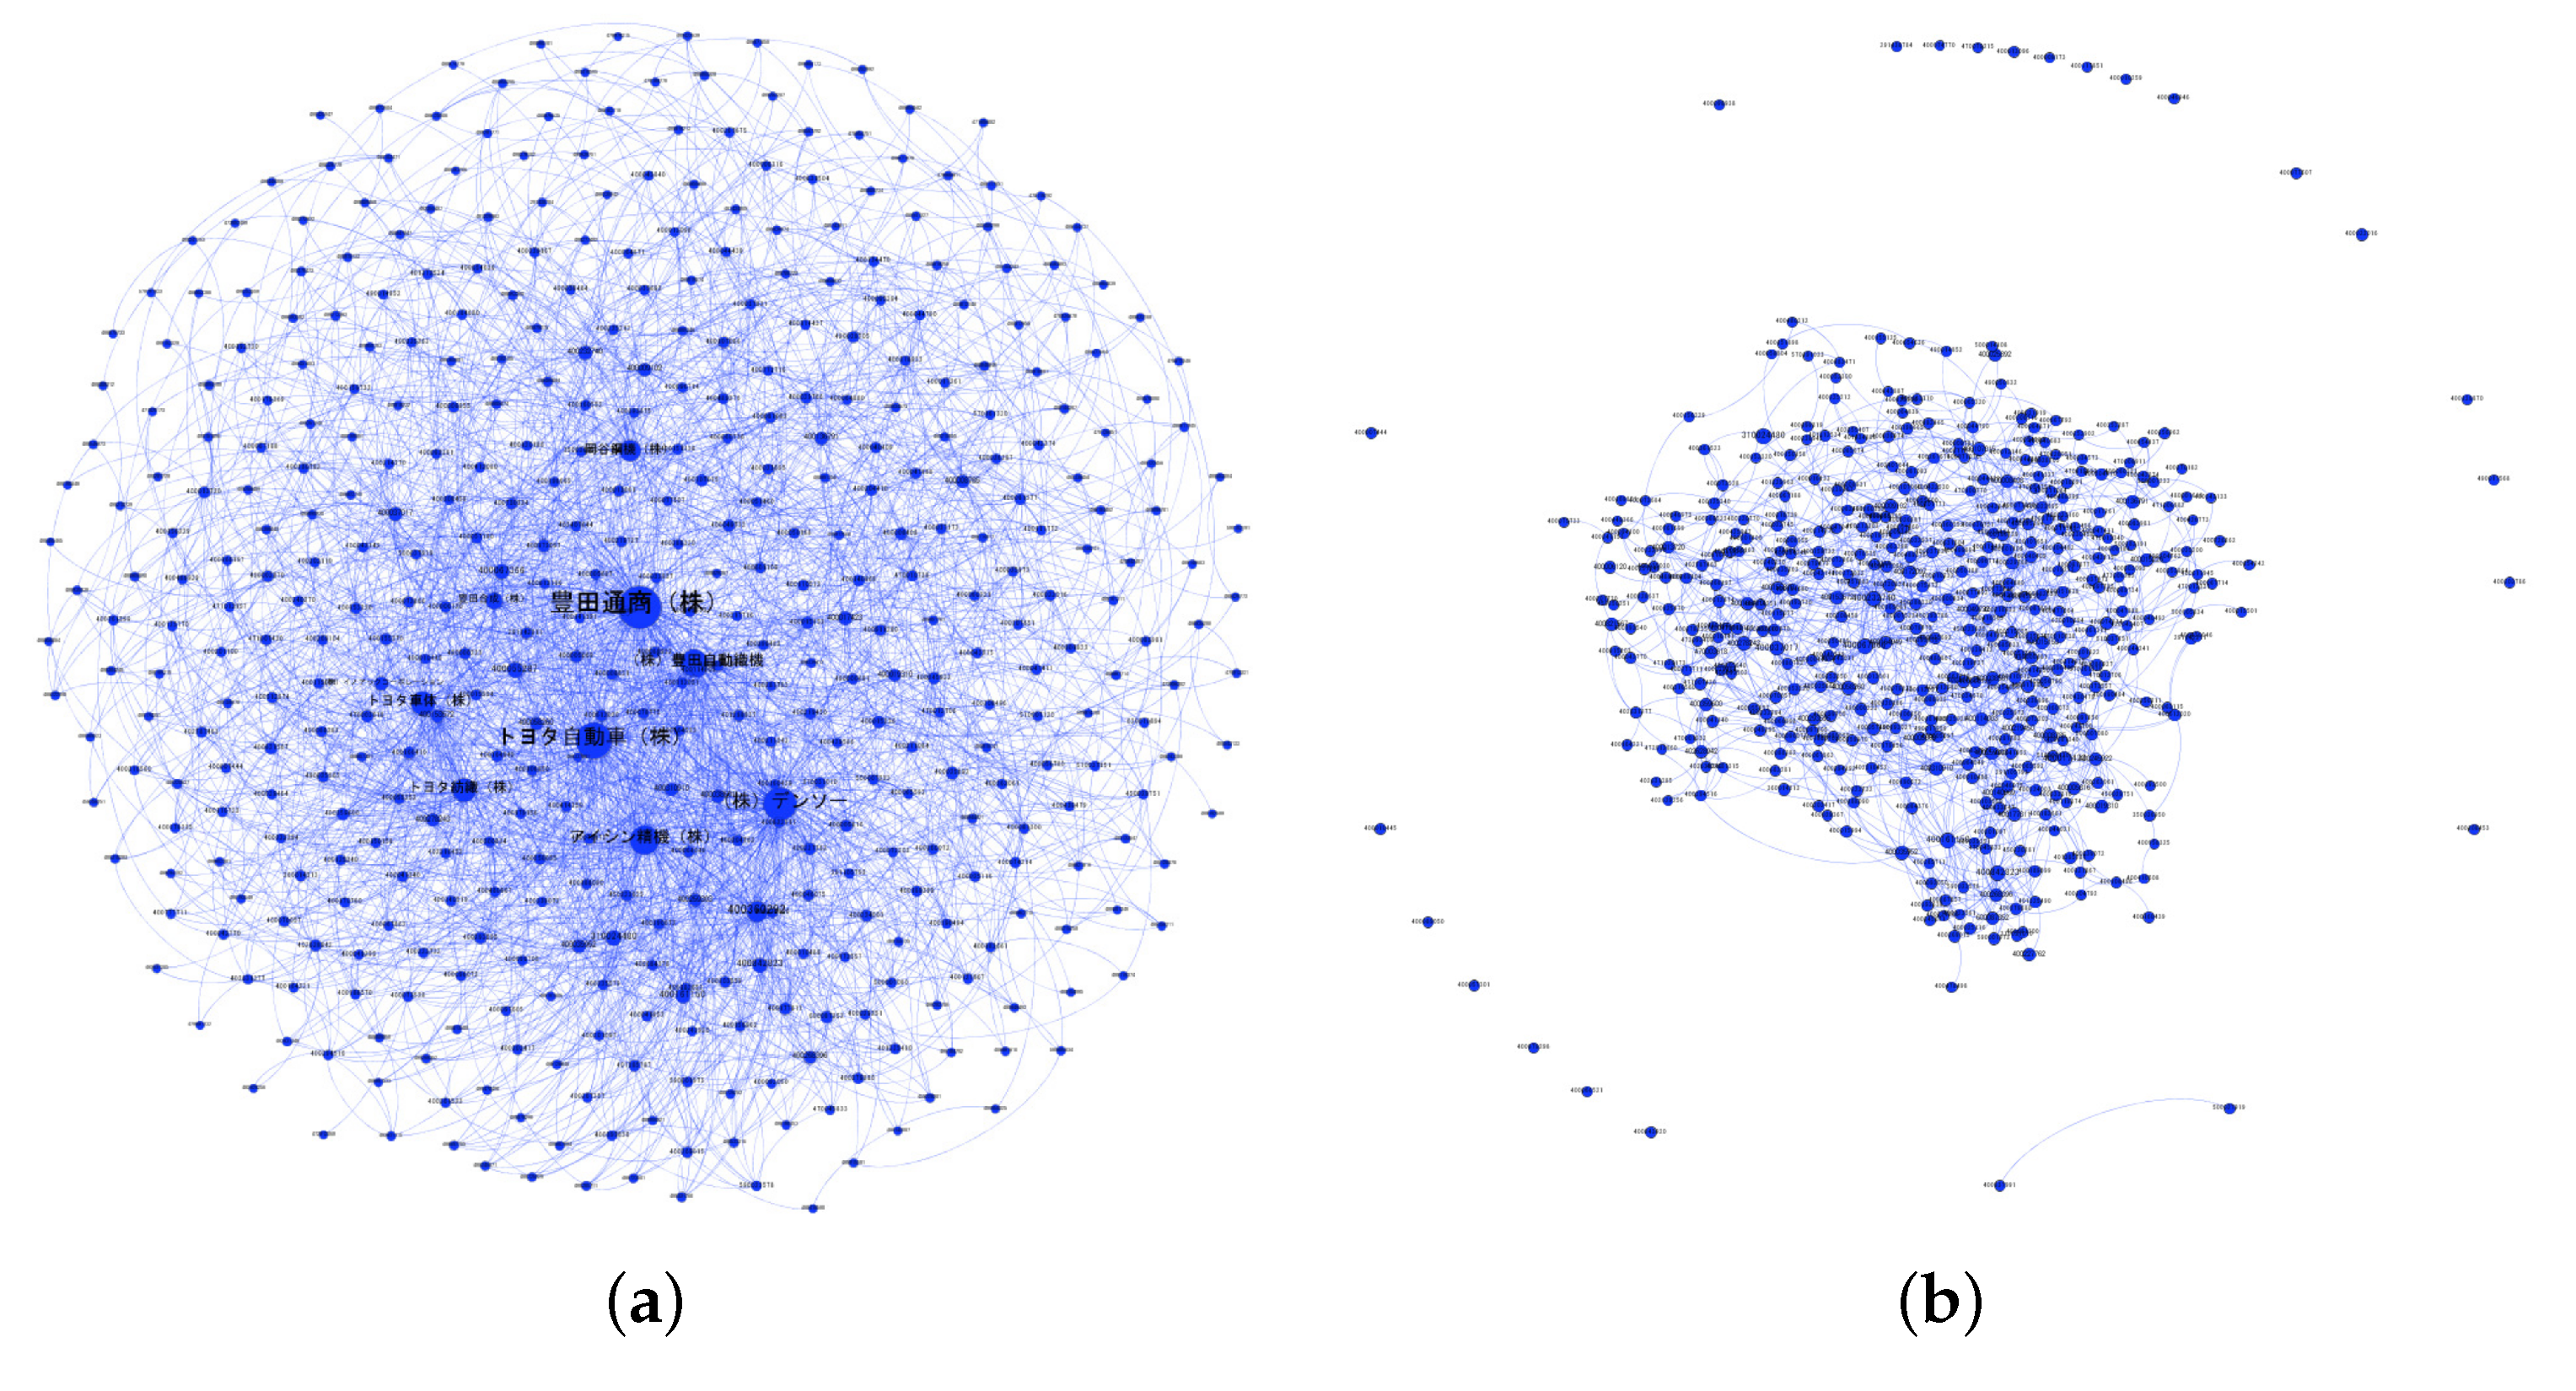
43]. We found that the network entropy showed a strongly correlation with the SN interdependence, and also moderated the correlation between SN efficiency and SN resilience. The objective of this paper was to present not only our structural outcomes concerning the SN, but also the finding that our structural analysis was significantly related to delivering efficient and effective support to SN design and management. Therefore, we introduced a real-world SN in the central area of Japan, which contained more than 180,000 firms, approximately 600,000 business relationships across all industrial categories. In the experiments, we measured the applicability of the proposed SN theory in a real-world case study and demonstrated several managerial implications based on the scenario analysis. Furthermore, this paper familiarized the researchers and managers in the SC discipline with an integrated SN theory, which can also be supported by public institutes or policy development.
In Section 2, we briefly describe the data sources, which were related to geography, industry and transaction information. In Section 3, we describe the network analysis techniques from network-, community- and vertex-level perspectives. In Section 4, we introduce the network analysis methods from the three perspectives and present the experiments, results and discussion based on them. In Section 5, we conclude and summarize the paper.
2. Data
2.1. Geographical Information
Figure 1 shows the geography of the central region of Japan and an overview of eight prefectures. Geographically, the central region is located between the Kanto region and the Kansai regions and includes the major city of Nagoya, which is the prefectural capital of Aichi (see Figure 1a). The central region-known as the Chubu region in Japanese-is one of the largest economic blocks in Japan and is comprised of eight prefectures, namely, Niigata, Toyama, Ishikawa, Fukui, Gifu, Mie, Aichi, and Shizuoka (see Figure 1b).
Figure 1.
Eight prefectures in the central region of Japan. (a) Central region; and (b) Eight prefectures.
The central region encompasses a large and geographically diverse area on the main island of Honshu, which is generally divided into two sub-regions: Hokuriku (including Niigata, Toyama, Ishikawa, and Fukui) and Tokai (including Gifu, Mie, Aichi, and Shizuoka). The Hokuriku sub-region occupies the northern part of the central region, which lies along the Sea of Japan and above the Tokai sub-region. The name Tokai means eastern sea and is derived from the sub-region’s geographic position along the Pacific Ocean. Occasionally, Mie is included in the Kansai region due to the large cultural influence from Kansai. As Mie also has a geographical proximity to Aichi and particularly strong economic ties with Aichi and Gifu, it is naturally included in the Tokai subregion.
In this paper, we focused on the supply chains in the central region, which contained a total of 182,538 firms. These data were provided by Tokyo Shoko Research (TSR) and were collected in 2012 [4,5,15,16,44]. Based on geographic distribution, the number of firms that belonging to each prefecture is described in Table 1. The firm shares of Aichi and Shizuoka ranked first and second, and included more than 50% of the firms in the central region. Both of these prefectures belong to the Tokai sub-region, which is one of the largest industrial regions in Japan, and contains the majority of Japanese car manufacturers/assemblers (e.g., Toyota Motor Corp., Denso Corp., Aisin Seiki Co., Ltd., and Yamaha Motor Co., Ltd.). Its coast is lined with densely populated cities (e.g., Nagoya, Hamamatsu and Shizuoka) with economies that thrive on factories.
Table 1.
Firm shares of individual prefectures in central region.
2.2. Industrial Information
The TSR data not only provided more than 180,000 firms, but also included a full-scale sample of all related industrial categories. According to the Japan Standard Industrial Classification (JSIC), all economic activities are divided into 20 industrial categories and the firm shares of each industrial category (Table 2). Construction (d), Wholesales and Retail Trade (i) and Manufacturing (e) are the main industries and account for approximately 80% of the firms in the central region (see Figure 2).
Table 2.
Firm shares of the Japan Standard Industrial Classification (JSIC) industrial categories.
Figure 2.
Industry-specific distribution of firms in the central region.
2.3. Transaction Information
In addition to geographical information and industrial information, the TSR data also provided information on supplier-customer relationships. Questionnaires were employed by TSR investigators to obtain a list of a firm’s five most important suppliers and customers of a firm. However, individual firms could only have ten transaction relationships, and the questionnaire lists primarily consisted of large firms. Therefore, these large firms could have relationships with hundreds to thousands of suppliers (customers). Table 3 lists the top ten transaction relationships and their locations and industrial categories. The TSR data indicated a total of 598,721 transaction relationships with 6.56 as the average number of transaction relationships for each firm.
Table 3.
Top ten firms with the most transaction relationships in the central region.
3. Methods
As we identified SNs as CASs, it was natural to adopt network analysis techniques and complex system theory to generate, validate and refine the SN theory. After constructing the SN, we subjected an integrated framework to conceptualize the new SN properties (from a network-level, community-level and vertex-level perspective) relevant to a real-world viewpoint from the macro-, meso- and micro-scale (Figure 3). From a macro-scale viewpoint, we examined the SW properties of the SN from a network-level perspective by using the average shortest path length L and the average clustering coefficient C. Next, from a meso-scale viewpoint, we subsequently employed a network clustering algorithm with modularity optimization to detect meso-structures from the SN, and used a topological measure of z-P parameter space to extract the hub firms from each community. Furthermore, analysis from community-level perspective can bury the structural holes in a macroscopic structure from a microscopic structure. Finally, from a micro-scale viewpoint, we proposed the network entropy based on node degree. We identified the firms’ effect on the SN entropy; namely the SN resilience against both random failures and targeted attacks.
Figure 3.
Overview of the multi-level network analysis in supply network (SN) perspective relevant to real-world viewpoint.
3.1. Network-Level Analysis
We quantified the structural SN property using the average shortest path length L and average clustering coefficient (C) which are defined as:
where l denotes the number of edges in the shortest path between and , and
where and denote the number of triangles in the network and number of connected triples of nodes, respectively. In graph theory [3,23], for a given network with n nodes and d edges per node, the regular network satisfies and , while the random network satisfies ln(n)/ln(d) and . If a network G satisfies and , G can be recognized as a small-world network, which is interpolated between regular and random networks.
For an analysis from a network perspective, we evaluated the SW properties of the SN, which are interpolated between regular and random networks (Figure 4 and Figure 5). For a given network with nodes and edges per node, each node in the regular network is connected to its nearest neighbors with a uniform distribution [23] (Figure 5a). When we applied a random rewiring procedure to each edge with the probability , we obtained the random network shown in Figure 5d. This procedure could reconnect the edges from regularity () to disorder (), and we were able to examine the intermediate networks of , which are the small-world networks (Figure 5b,c). As SW networks can efficiently transfer the information flows throughout the whole network rather than the regular and random networks, we suggested that efficient SNs should present a relatively short average path length and a relatively high clustering coefficient (see Figure 4).
Figure 4.
The mechanism of L and C according to network randomness.
Figure 5.
Network structure between regularity and disorder. (a) ; (b) ; (c) ; (d) .
3.2. Community-Level Analysis
3.2.1. Modularity Optimization
To conduct the analysis within a community-level perspective, we performed topological clustering to extract the modular structures of the SN. Real-world networks often have community structures, where groups of nodes are closely connected within themselves and rarely with others (Figure 6).
Figure 6.
Community detection of networks.
Newman et al. [29,30,31] proposed a fast method for optimizing modularity in very large networks, where an approximate function of modularity (Q) optimization was proposed to measure the modular division as:
where denotes the fraction of edges in community i, and denotes the fraction of edges that link the nodes in community i to the nodes in community j. If we let denote the fraction of edges that link the nodes in community i to all other communities, Q can be rewritten as follows:
As the high value of Q indicates that the network has an excellent community structure, this method proposes an alternative approach to finding a suitable community by optimizing Q. Furthermore, it assumes that all nodes are independent communities and employs a greedy search of combining two communities by the maximum as follows:
The value of Q only needs to be recalculated for the new combined community, and the running time can be reduced to approximately . According to the iterative combining process, the best community division is when Q obtains the maximum value, and a community with a high Q presents an excellent modular property. Community structures represent the SN interdependence through self-organizing processes, where the information flows can be better diffused and transmitted from segregated communities to the whole network.
3.2.2. z-P Parameter Space
Efficient SNs also depend on the interdependence of the network structures. It is easy to find and manage the flows from the one supplier to the end customer; however, vertical connections between communities are difficult to form and maintain given the channels for defining their flows of information. We identified such channel leader firms using the z-P parameter space, which provides a multi-criteria [3,32]. One criteria was the within-module degree defined as:
where is the number of links of node i to other nodes in its own module , and is the average of K over all the nodes in , is the standard deviation of K in . The other criteria was the participation coefficient defined as:
where is the number of links of node i to module s, and is the total degree of node i.
Figure 7.
Roles in z-P parameter space.
- R1.
- Ultra-peripheral roles: nodes with all their links within their module (, ).
- R2.
- Peripheral roles: nodes with most links within their module (, ).
- R3.
- Non-hub connector roles: nodes with many links to other modules (, ).
- R4.
- Non-hub kinless roles: nodes with links homogeneously distributed among all modules (, ).
- R5.
- Provincial hub roles: nodes with the vast majority of links within their module (, ).
- R6.
- Connector hub roles: nodes with many links to most of the other modules (, ).
- R7.
- Kinless hub roles: nodes with links homogeneously distributed among all modules (, ).
Among the three hub nodes, we assumed that the connector hub nodes were channel leader firms, due to the nodes being densely connected within the module and simultaneously well connected outside to other modules. In this context, connector hub firms made a particularly significant contribution to community economies.
3.3. Vertex-Level Analysis
3.3.1. Node Degree
After network clustering, we measured the dispersion of the links from each firm between the different communities from a vertex-level analysis. We employed topological measures as the degree defined as:
where, for a given node , when a link exists between and ; otherwise, . Although the degree centrality can be calculated simply with Equation (8), the measurement of the importance (e.g., activity and cohesiveness) of a node is intuitive and interpretable. In the supply network, an enterprise with a high degree can be considered to have more direct contacts with other enterprises, which also indicates a greater impact on other enterprises through operational decisions and strategic behavior [7]. Degree centrality is also acceptable for recognizing enterprise scale: enterprises with a high degree are considered to be large enterprises (LEs), and enterprises with a low degree are small and medium enterprises (SMEs).
3.3.2. Network Entropy
In accordance with the Shannon entropy [33], the information entropy containing n events is defined as:
where denotes the probability of occurrence of event . Next, we assumed that the event was substituted as the node . For given a node with the degree as per Equation (8), the probability P of can be formulated by a weight function as:
where and . Subsequently, the entropy of network G can be defined as:
Equation (11) is based on the Shannon entropy, which is well suitable for measuring the structural and topological complexity of networks [41]. It easily distinguished that regular networks represented a low complexity (entropy), whereas random networks represented a high complexity (entropy) [36]. Network entropy can also be considered as a quantitative measure of network robustness, which has been widely applied in economic, scientific, social and biological networks [35,39,40] and accounts for a relatively positive correlation with the network robustness.
4. Experiments
4.1. Baseline Analysis
4.1.1. Supply Network of Regional Clusters
In this section, we focused on the supply network in the central region that is related to regional clusters. The central region comprises eight prefectures with a total of 182,538 firms (see Table 1). As shown in Table 4, the transaction shares of Aichi ranked first and was substantially larger than the transaction share of other prefectures. Figure 8 shows the supply network in relation to geographic information, where the node size denotes the number of transactions of individual prefectures, and the link thickness indicates the number of transactions between each pair of prefectures. The nodes are colored according to each prefecture, and the links colored according to the sources of the related nodes. Aichi not only ranked first in terms of its share of transactions with firms, but also had the greatest number of transactions with other prefectures. In the Tokai sub-region, the transactions among the four prefectures were well connected. However, Toyama, Ishikawa and Fukui in the Hokuiku sub-region also presented relatively dense connectedness.
Table 4.
Transaction shares of individual prefectures in central region.
Figure 8.
Supply network of regional clusters in the central region.
Due to the boundary strengths of regional clusters, the majority of the transactions were held within individual regions, and the bridges were much thinner. Therefore, the analyses and results of the regional clusters were insufficient for revealing the cross-regional features, which accounted for the lack of transaction information.
4.1.2. Supply Network of Industrial Sectors
In this section, we focused on the supply networks in the central region related to industry sectors. As shown in Table 5, the transaction shares of Construction ranked first and was significantly larger than the transaction shares of other industries. Figure 9 represents the supply network that is related to industry sectors, in which the node size denotes the number of transactions in individual industries and the link thickness denotes the number of transactions between each pair of industries. The nodes related to the top six industries are depicted in different colors in Figure 2, and the other nodes are depicted in gray. The color of the link corresponds to the source of the related nodes.
Table 5.
Transaction shares of Japan Standard Industrial Classification (JSIC) industrial sectors.
Figure 9.
Supply network of industrial sectors in the central region.
Construction not only ranked first in terms of its share of the firms, but also included the greatest number of within-industry transactions. Figure 9 also shows that Construction had one main supplier from the Transport and Postal Services, and two main customers from Manufacturing and Wholesale and Retail Trade. However, Manufacturing had the greatest number of suppliers from the Wholesale and Retail Trade and exhibited highly reciprocal relationships with Wholesale and Retail Trade. In contrast to the regional clusters where most transactions occurred within individual prefectures rather than between prefectures, fewer transactions occurred with each industry, and most transactions occurred between two different industries. Due to the direction of dependent relationships and the lack of reciprocal transaction information, the results and analysis of the industry sectors were insufficient to reveal cross-industry features.
4.2. Results of Community-Level Analysis
4.2.1. Community Detection
In this section, we investigate network clustering as a technical approach to analyzing the customer-supplier relationships in the supply chain by constructing a supply community structure. The fast modularity maximization algorithm—the Newman method is applied to detect and analyze communities from the supply network. As shown in Table 6 and Figure 10a, five main communities are detected from the original network and include more than 90% of the firms. Unlike the analyses based on regional clusters and industry sectors, the analysis of communities provides a cross-location and cross-industry perspective. The Features column of Table 6 denotes the location in uppercase (refer to Table 1) and the industry in lowercase (refer to Table 2). For example, in the Central region row, Aichi (A) and Shizuoka (S) ranked first and second in terms of their share of the firms and included more than 50% of the firms; Construction (d), Wholesale and Retail Trade (i) and Manufacturing (e) ranked as the top three and included approximately 80% of the firms. Therefore, the features of the central region were classified as ASdie.
Table 6.
Clustering results for each community in the central region. n, e and Q denote the number of nodes, number of edges, and modularity, respectively.
Figure 10.
Community detection by optimizing modularity. (a) Community-specific share by firms; (b) Community network and (c) Supply network.
Figure 10b represents the supply network related to industry communities, where the node size denotes the number of transactions inside individual communities and the link thickness denotes the number of transactions between each pair of communities. The nodes related to the top five communities were depicted by different colors based on Figure 10a, and the links were depicted by color according to the sources of the related nodes. The results are summarized as follows:
- C1.
- This community exhibited high independence; Niigata included approximately 50% of the firms and held a uniform firms share for the Wholesale and Retail Trade, Manufacturing, and Construction industries.
- C2.
- This community showed similar organizational properties of the original network, which represented a similar industrial structure (die) and was comprised the three main prefectures of Aichi, Gifu, and Mie.
- C3.
- In this community, Aichi and Shizuoka had the greatest numbers of interacting firms, and Manufacturing ranked first among the industries. Manufacturing contained many more firms than other industries. Although, did not include the largest number of firms, it had the largest number of reciprocal relationships with all other communities, particularly . As shown in Figure 10c, held the most important place in the central region (the supply network of is represented in a firework-like network chart drawn using the open-source network analysis and visualization software Gephi).
- C4.
- This community showed similar organizational properties of the original network; Shizuoka included interactions with approximately 90% of the firms.
- C5.
- This community showed similar organizational properties of the original network; Toyama, Ishikawa and Fukui included interactions with over 98% of the firms.
According to the summarized results, exhibited the largest modularity due to its high independence of regional clusters and excellent integrity of industry categories. , and had a relatively similar modularity to the original network and could recognize similar organizational properties of the industry categories of the original network. Another feature was that these three communities were well separated based on regional clusters. had poor modularity as the majority of the interacting firms were in Manufacturing; consequently, it was strongly connected to other communities. Furthermore, we discovered that these five main communities also engaged in excellent reciprocal and cyclical business communications, namely community economics.
4.2.2. Connector Hub Firms Extraction
To reveal the community economics, the presence of hub firms in the SN is significant, as such firms contribute to raise the performance of the entire SN and benefit the SN interdependence between different communities. According to the z-P parameter space, a firm with high z could be identified as an information transformer to its business partners in the community, and a firm with a high P could be identified as a channel gatekeeper to bridge other communities.
Table 7 showed the hub firms extracted from each community. First, we found that there were fewer provincial hub firms and kinless hub firms in either community. Second, we found that all communities contained a mass of connector hub firms, especially in community , which contained nearly twice the connector hub firms than and , and almost ten times that of and . In this context, community economics can be so-called connector hub businesses that make a particularly significant contribution from the outside communities to the inside community. The effect of such firms can be observed in Figure 10b,c. The connector hub firms not only made inter-connect densely, but also made good bridges with , , , and . Therefore, to quickly and accurately identify community economics and their SN structures, connector hub firms are helpful for local governments and administrations to promulgate more effective policies for stimulating SN efficiency and interdependence and move towards implementing those policies.
Table 7.
Hub firms of each community.
4.3. Results of Network-Level Analysis
As shown in Table 8, the SN of the whole central region shows the average shortest path length is = 15.78 (≥ = 10.19), and average clustering coefficient is = 0.027 (≫ = 0.000036), which represents the small-world properties. According to these two quantitative measures, all five main communities (, , , , and ) also represent small-world properties.
Table 8.
Assessment of small-world network for each community in the central region. n, d, L, and C denote the number of nodes, number of edges per node, average shortest path length, and average clustering coefficient, respectively.
According to Hearnshaw and Wilson [10], an efficient SN with a short L and a high C was demonstrated in this real-world case. Additionally, we also discovered that better community structures presented more efficient SNs. According to Table 8, all communities (, , , , and ) presented a much shorter L than that of the entire central SN. As attempts to shorten L can dramatically enhance the efficiency of SNs with facilitating informational, material and financial flows, based on SN theory, community structures can be identified as a managerial implication.
Subsequently, we focused on the structures of each community. Gapaldo and Giannoccaro [12,13] investigated 10 different patterns of SNs and defined the degree of SN interdependence by the average number of interactions (i.e., d), and the structure of SN interdependence by mapping firm interactions. These studies revealed that higher SN interdependence presented a positive relationship between SN resilience and SN efficiency. Therefore, with the highest d, represented a relatively similar structure that approaches the random network more so than other communities and the central SN. This also proved that was a well-connected network and hard-separated structure (i.e., containing mass of connector hub firms), which was indicated by the community-level analysis in Section 4.2.
4.4. Results of Vertex-Level Analysis
4.4.1. Scenario Design
To further reveal the relationships between SN interdependence and resilience, we designed several scenarios and simulated the analysis results against both random failures and targeted attacks from a vertex-level perspective. The roles of each firm were determined and positioned relative to the connectivity structure of the SN. First, we did not identify the firm roles and remove them randomly from the SN. Second, we identified the pivotal firms within each community using node degree-prior choice, and investigated the robustness of each community’s SN using a strategy involving the sequential elimination of these pivotal firms. Third, we identified the firm roles using a participation coefficient P of the z-P parameter space, and investigated the robustness of the SN of each community after removing these firms. Fourth, when a node was removed from the network, not only did its links disappear, but links between other nodes may also have disappeared in the real case. Therefore, we also identified a random disappearance of links based on when firms were removed from the SN of each community.
- S1:
- Random elimination strategy.
- S2:
- Degree-prior elimination strategy.
- S3:
- P-prior elimination strategy.
- S4:
- P-prior elimination strategy with random indirect links disappear.
In simulations of these four scenarios, we used the network entropy H as a measure of network complexity and network robustness when the firms were successively removed from the SN.
4.4.2. Discussion of Network Complexity
It is well known that a higher complex network makes it more difficult to understand relational interactions and topological characteristics, so only a small change can cause a massive reaction [41]. On the other hand, as network is a nonlinear system, even given the same number of nodes and edges, networks can represent completely different structures such as regular, random, scale-free network and star networks [36]. In this context, evaluating the complexity of such networks is a major challenge and a formidable task in the SNs, as it pushes the limits of the ability of the SC managers to manage material and information flows from their suppliers to their customers [12,13,35].
According to Equation (11), network entropy provides a graph-oriented metric based on the concepts of information dynamics, which can can measure SN interdependence by means of two complexity variables: (1) SN size, i.e., the number of nodes n and links e in SN; and (2) SN topologies, i.e., how firms interact in the SN [12,13]. As shown in Table 9, the network entropy of each community was calculated. First, it was obvious that the larger size (i.e., more nodes and links) SN had higher H, and , , and had much higher complexity than and . However, we also found that even , and , , , and were observed in Table 9, accounting for the different firm interactions. The different interactions of networks has been investigated by Demetrius and Manke [36], who demonstrated four classic structures: regular, random, scale-free, and star networks with the same number of nodes n and links e. The average shortest path length L of different networks were shown as , while the network entropy were reversely shown as . Therefore shortening L in SN is considered as a way to increase SN efficiency [10,12,13,36,41]. Furthermore, we found that an SN with high network entropy represented the high complexity of SN interdependence, which led to SN efficiency. Additionally, it could deliver efficient and effective support to the flows of material and information as the management of such inter-firm relationships present difficult issues. In such SNs, the interdependence degree and pattern are appropriate ways to pursue SN integration problems as they can bury the structural and operational holes [3,12].
Table 9.
The network entropy of each community.
4.4.3. Discussion of Network Robustness
Network entropy has proven to be positively correlated with network robustness [10,12,13,36]; however, the entropy variation when a failure or attack happens in an SN has yet to be demonstrated. In this section, we used the concept of network entropy to measure the robustness of the supply network. Figure 11 shows the simulation results of the network entropy when firms are removed from the individual communities based on different scenarios. Figure 11a,b (represented by the □ and ○ marks) denote the results of accidental node failure () and of intended node attack (), respectively. Figure 11c (represented by the solid lines and dashed lines) denotes the results of the disappearance of intended node attack of P-prior firms without random indirect links () and their disappearance with random indirect links ().
Figure 11.
These figures illustrate comparison of network entropy variation. (a) Comparison of in 100 steps; (b) Comparison of in all steps; and (c) Comparison of H in all steps.
First, we focused on the accumulative variation of loss entropy and define the loss function as follows:
where denotes the initial entropy, and denotes the entropy after t nodes are removed from the network. If we focused on the □ marks in Figure 11a, we found that all communities displayed strong robustness in the face of such accidental failures. When 100 nodes were randomly removed from the supply network, the network entropy of five communities decreased by 0.14%, 0.15%, 0.14%, 0.29% and 0.35%, respectively. When we focused on Figure 11a, the ○ marks showed the results of the degree-prior node failure. The network entropy of five communities significantly changed to that of accidental failures, and decreased by 2.88%, 3.10%, 2.62%, 7.61%, and 7.57%. In particular, had a minimal decrease compared to the other four communities, which indicated that was a much more robust network structure in the face of both accidental and degree-prior failures.
The results supported the research issue suggested by Hearnshaw and Wilson [10] where they revealed that the channel leader firms determined the resilience of the SN against both random disturbances and targeted attacks. As represents a scale-free-like SN interdependence as suggested by Capaldo and Giannoccaro [12,13], it was easier to synchronize SN activities, reduce transaction cost; hence beneficially affecting SN efficiency.
Second, we focused on the loss entropy caused by the individually removed nodes at each enumerative step. The loss function is defined as follows:
which denotes the variation of entropy between and t steps when the tth node is removed from the network. According to the additivity of entropy [41], Equation (13) can also measure the information of node t. Figure 11b shows the variation of loss entropy when the supply networks face degree-prior failure. Here, the results showed that of each supply network (, , , , and ) self-organized into a scale-free power law distribution [24], and the slopes (solid lines) were , , , , and . The results also supported the research issue suggested by Hearnshaw and Wilson [10] where they revealed that resilient SNs demonstrate a power law distribution of relationship importance for all connection types.
Furthermore, represented the maximal slope, which also indicated that it had a highly inter-connected SN interdependence when compared with other communities. Capaldo and Giannoccaro discussed different structures of SNs, and revealed that SN interdependence moderated the relationship between SN resilience and SN efficiency which varied across different network structures [12,13] and is illustrated in Figure 12. Figure 12a represents an exponential feature [42], which would separate into several smaller communities in the event of degree-prior failures. The network shown in Figure 12b represents a scale-free feature [24,42], which shows a preferential attachment based on degree-prior choice. Therefore, the network structure of is highly robust to a coordinated attack against their pivotal firms (referred to as LEs), which only fracture the network to separate the SMEs into non-communicating islands.
Figure 12.
Inter-connected features of different supply networks. (a) Network structure of , , , and ; and (b) Network structure of .
Finally, we focused on the entropy of the remained network when firms were removed from the SN, and the entropy of remained network was recalculated by Equation (11). The solid lines represent the results by applying the P-prior elimination strategy where the slopes were , , , , and , respectively. The slopes represented the importance of the hub firms in each community where represented the maximal slope. The larger slope indicated that the hub firms play important roles to benefit SN efficiency. Conversely, the SN would reduce in performance if such nodes were lost with targeted attacks of P-prior. As shown in Figure 11c, the entropy of was lower than after removing 20,257 nodes, and lower than after removing 25,083 nodes, which was also observed between and . Additionally, when we simulated P-prior elimination strategy with the disappearance of random indirect links (), the dashed lines represented a more dramatic fall than .
4.4.4. Visualization of a Real-World Case Study
The visualization of the SN enabled us to intuitively understand the purpose of our analysis. We selected as a real-world case study, and represented it from the vertex-level perspective as shown in Figure 13a, where the size of the nodes were arranged by degree. We extracted the top ten firms that accounted for the majority of the transactions (Table 10) where Aichi (A) and Manufacturing (e) ranked first.
Figure 13.
Comparison of supply networks according to the pivotal firms. (a) Before removing the top ten firms; and (b) After removing the top ten firms.
Table 10.
Top ten firms that accounted for the most transactions in .
- (I)
- For operational resilience, we revealed that these pivotal firms not only held the most important position, but also significantly influenced the supply transformation for focal locations and focal industries.
When we removed these ten nodes from the network (Figure 13b), we determined that the average degree of decreased from 7.46 to 7.08 and the average path length of increased from 5.69 to 6.56. However, this result indicated that lost more than 7000 business interactions, which also influenced 271 SMEs who separated from the SN into isolated firms. Nevertheless, the entire SN was not fractured into several non-communicating islands, and the remaining firms could also reach their suppliers (customers) via an additional path.
- (II)
- In terms of strategic resilience, these pivotal firms represented gate-keepers who control the flow of materials and communication. Furthermore, if the SN contains such firms, it could lead to less distributed paths and wastes by making the SN more robust to prevent SN disruption.
5. Conclusions
This paper presents an exploratory study of a supply network (SN) using network analysis techniques to analyze SN theory from multi-level perspectives of the whole network. Compared with existing studies in the complex system discipline, most of them identify the SNs as complex adaptive systems (CASs), and hence complex system theory can be widely used to generate, validate, and refine the SNs properties from a network-level perspective. On the other hand, compared with existing studies in the SCM discipline, most of them identify SNs as regional clusters or industrial sectors, and analyze the specific firms considering geographic proximity or industrial affinity from a vertex-level perspective. For these multi-level issues in SN theory, this paper proposed an integrated framework to enrich the SN theory from a network-level perspective to a vertex-level perspective. One of the most important contributions of this framework is to introduce community-level analysis, which can bury the structural analysis hole between network-level analysis and vertex-level analysis.
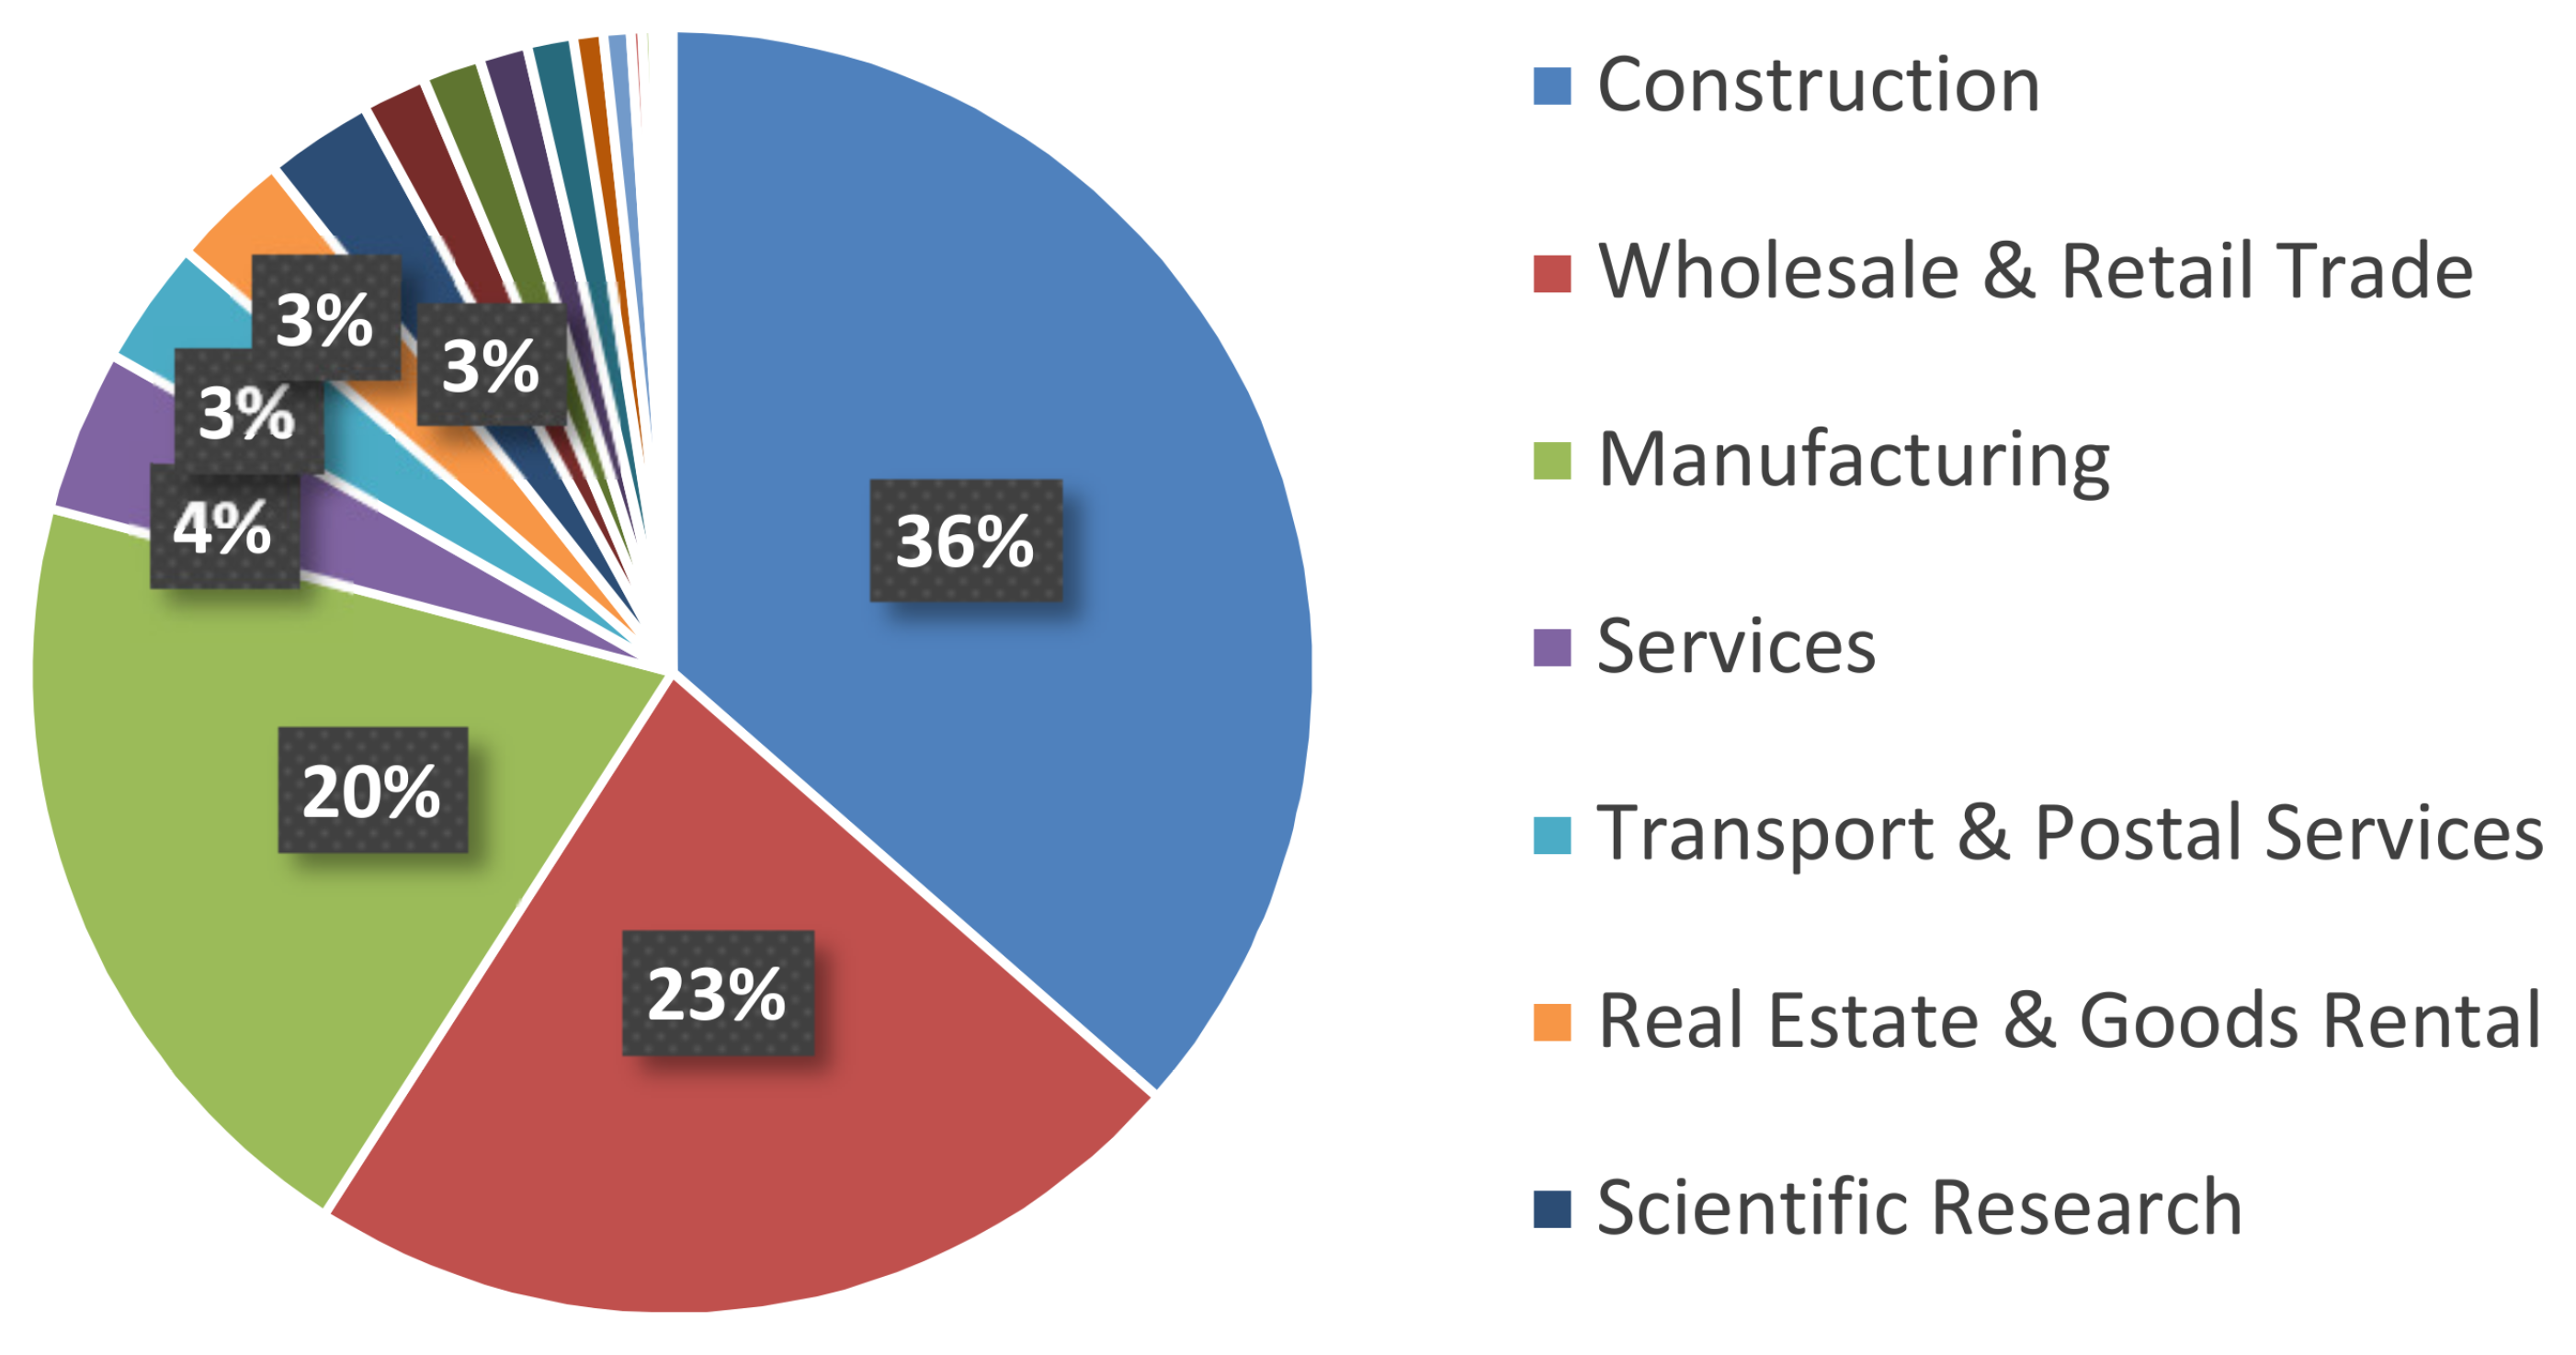
In the network-level analysis, we applied the small-world properties to the SNs, and found that SN efficiency depended on a short average path length and high clustering coefficient. In the community-level analysis, we employed a network clustering method to detect communities of SN interdependence, and found that better community structures could benefit SN efficiency, namely community economics. As community economics has also been identified as connector hub business, we extracted such hub firms by using z-P parameter space and found that the number of hub firms could moderate the relationship between SN interdependence and SN efficiency. Finally, in the vertex-level analysis, we introduced network entropy to measure the SN resilience, and applied several scenarios to conduct analysis against random failures and targeted attacks. The results revealed that SN resilience was dependent on SN interdependence. In the experiment, we constructed an SN from the real-world case of the central region of Japan, which contains over 180,000 nodes and approximately 600,000 links. Compared with existing studies, our SN contained eight prefectures and a full-scale sample of industries from 20 categories. Therefore, another most important contributions of this paper was to apply and investigate the SN theory in a real-world large-scale supply chain. This paper not only familiarizes researchers and managers in the SCM field with the existence of the integrated SN theory, but also delivers several managerial implications to support SN design and management. We also hope that SN theory can be supported by public institutions in policy development.
Our study had two limitations that will be addressed in future research. First, we did not identify the SN as a directed networks. In our SN theory, the measures of CAS (such as clustering coefficient, the shortest path length, and others) were used for undirected networks and ignoring link directions although the real-world SN represented supplier-customer relationships with directed links [15,16]. Therefore, a future extension of SN theory will conduct a directed network, and frame SN as a directed CAS. Second, this study also ignored the firm’s attributes. Real-world firms contain rich attributes such as sales, number of employees, location, and industry sector, which are very useful for community detection [5,45]. Therefore, we propose an attribute-associated network clustering method to enrich current SN theory.
Acknowledgments
We are grateful to the editors for their constructive comments on the initial versions of this manuscript. We are also grateful to the three anonymous referees for their constructive comments on earlier versions of this paper.
Author Contributions
Y. Zuo and Y. Kajikawa conceived and designed the experiments; Y. Zuo performed the experiments; Y. Zuo analyzed the data; Y. Zuo and Y. Kajikawa contributed data and analysis tools; Y. Zuo wrote the paper.
Conflicts of Interest
The authors declare no conflict of interest.
References
- Autry, C.W.; Griffis, S.E. Supply chain capital: The impact of structural and relational linkages on firm execution and innovation. J. Bus. Logist. 2008, 29, 357–373. [Google Scholar] [CrossRef]
- Takeda, Y.; Kajikawa, Y.; Sakata, I.; Matsushima, K. An analysis of geographical agglomeration and modularized industrial networks in a regional cluster: A case study at Yamagata prefecture in Japan. Technovation 2008, 28, 531–539. [Google Scholar] [CrossRef]
- Kajikawa, Y.; Takeda, Y.; Sakata, I.; Matsushima, K. Multiscale analysis of interfirm networks in regional clusters. Technovation 2010, 30, 168–180. [Google Scholar] [CrossRef]
- Kamehama, K.; Iino, T.; Iyetomi, H.; Ikeda, Y.; Ohnishi, T.; Takayasu, H.; Takayasu, M. Structure analyses of a large-scale transaction network through visualization based on molecular dynamics. J. Phys. Conf. Ser. 2010, 221, 012013. [Google Scholar] [CrossRef]
- Iino, T.; Kamehama, K.; Iyetomi, H.; Ikeda, Y.; Ohnishi, T.; Takayasu, H.; Takayasu, M. Community structure in a large-scale transaction network and visualization. J. Phys. Conf. Ser. 2010, 221, 012012. [Google Scholar] [CrossRef]
- Kajikawa, Y.; Mori, J.; Sakata, I. Identifying and bridging networks in regional clusters. Technol. Forecast. Soc. 2012, 79, 252–262. [Google Scholar] [CrossRef]
- Kim, Y.; Choi, T.Y.; Yan, T.; Dooley, K. Structural investigation of supply networks: A social network analysis approach. J. Oper. Manag. 2011, 29, 194–211. [Google Scholar] [CrossRef]
- Bellamy, M.A.; Ghosh, S.; Hora, M. The influence of supply network structure on firm innovation. J. Oper. Manag. 2014, 32, 357–373. [Google Scholar] [CrossRef]
- Pathak, S.D.; Day, J.M.; Nair, A.; Sawaya, W.J.; Kristal, M.M. Complexity and Adaptivity in Supply Networks: Building Supply Network Theory Using a Complex Adaptive Systems Perspective. Decis. Sci. 2007, 38, 547–580. [Google Scholar] [CrossRef]
- Hearnshaw, E.J.; Wilson, M.M. A complex network approach to supply chain network theory. Int. J. Oper. Prod. Manag. 2013, 33, 442–469. [Google Scholar] [CrossRef]
- Giannoccaro, I. Assessing the influence of the organization in the supply chain management using NK simulation. Int. J. Prod. Econ. 2011, 131, 263–272. [Google Scholar] [CrossRef]
- Capaldo, A.; Giannoccaro, I. How does trust affect performance in the supply chain? The moderating role of interdependence. Int. J. Prod. Econ. 2015, 166, 36–49. [Google Scholar] [CrossRef]
- Capaldo, A.; Giannoccaro, I. Interdependence and network-level trust in supply chain networks: A computational study. Ind. Mark. Manag. 2015, 44, 180–195. [Google Scholar] [CrossRef]
- Giannoccaro, I. Adaptive supply chains in industrial districts: A complexity science approach focused on learning. Int. J. Prod. Econ. 2015, 170, 576–589. [Google Scholar] [CrossRef]
- Ohnishi, T.; Takayasu, H.; Takayasu, M. Hubs and Authorities on Japanese Inter-Firm Network: Characterization of Nodes in Very Large Directed Networks. Prog. Theor. Phys. Suppl. 2009, 179, 157. [Google Scholar] [CrossRef]
- Zachariou, N.; Expert, P.; Takayasu, M.; Christensen, K. Generalised Sandpile Dynamics on Artificial and Real-World Directed Networks. PLoS ONE 2015, 10, 1–13. [Google Scholar] [CrossRef] [PubMed]
- Zuo, Y.; Kajikawa, Y.; Mori, J. Extraction of business relationships in supply networks using statistical learning theory. Heliyon 2016, 2, e00123. [Google Scholar] [CrossRef] [PubMed]
- Barabasi, A.L.; Bonabeau, E. Scale-free networks. Sci. Am. 2003, 288, 60–69. [Google Scholar] [CrossRef] [PubMed]
- Sugiyama, K.; Honda, O.; Ohsaki, H.; Imase, M. Application of Network Analysis Techniques for Japanese Corporate Transaction Network. In Proceedings of the 6th Asia-Pacific Symposium on Information and Telecommunication Technologies, Yangon, Myanmar, 9–10 November 2005. [Google Scholar]
- Dyer, J.H.; Hatch, N.W. Using Supplier Networks to Learn Faster. MIT Sloan Manag. Rev. 2004, 45, 57–63. [Google Scholar]
- Becattini, G. Industrial Sectors and Industrial Districts: Tools for Industrial Analysis. Eur. Plan. Stud. 2002, 10, 483–493. [Google Scholar] [CrossRef]
- Lin, C.H.; Tung, C.M.; Huang, C.T. Elucidating the industrial cluster effect from a system dynamics perspective. Technovation 2006, 26, 473–482. [Google Scholar] [CrossRef]
- Watts, D.J.; Strogatz, S.H. Collective dynamics of ’small-world’ networks. Nature 1998, 393, 440–442. [Google Scholar] [CrossRef] [PubMed]
- Barabasi, A.L.; Albert, R. Emergence of Scaling in Random Networks. Science 1999, 286, 509–512. [Google Scholar] [PubMed]
- Brin, S.; Page, L. The anatomy of a large-scale hypertextual Web search engine. Comput. Netw. ISDN 1998, 30, 107–117. [Google Scholar] [CrossRef]
- Kleinberg, J.M. Authoritative Sources in a Hyperlinked Environment. J. ACM 1999, 46, 604–632. [Google Scholar] [CrossRef]
- Kauffman, S. The Origins of Order: Self-Organization and Selection in Evolution; Oxford University Press: Oxford, UK, 1993. [Google Scholar]
- Levinthal, D.A. Adaptation on Rugged Landscapes. Manag. Sci. 1997, 43, 934–950. [Google Scholar] [CrossRef]
- Newman, M.E.J. Fast algorithm for detecting community structure in networks. Phys. Rev. E 2004, 69, 066133. [Google Scholar] [CrossRef] [PubMed]
- Clauset, A.; Newman, M.E.J.; Moore, C. Finding community structure in very large networks. Phys. Rev. E 2004, 70, 066111. [Google Scholar] [CrossRef] [PubMed]
- Newman, M.E.J. Communities, modules and large-scale structure in networks. Nat. Phys. 2012, 8, 25–31. [Google Scholar] [CrossRef]
- Guimera, R.; Amaral, L.A.N. Functional cartography of complex metabolic networks. Nature 2005, 433, 895–900. [Google Scholar] [CrossRef] [PubMed]
- Shannon, C.E. A Mathematical Theory of Communication. Bell Syst. Tech. J. 1948, 27, 379–423. [Google Scholar] [CrossRef]
- Kolmogorov, A.N. Three approaches to the quantitative definition of information. Int. J. Comput. Math. 1968, 2, 157–168. [Google Scholar] [CrossRef]
- Rodewald, J.; Colombi, J.; Oyama, K.; Johnson, A. Methodology for Simulation and Analysis of Complex Adaptive Supply Network Structure and Dynamics Using Information Theory. Entropy 2016, 18, 367. [Google Scholar] [CrossRef]
- Demetrius, L.; Manke, T. Robustness and network evolution-an entropic principle. Physica A 2005, 346, 682–696. [Google Scholar] [CrossRef]
- Anand, K.; Bianconi, G. Entropy measures for complex networks: Toward an information theory of complex topologies. Phys. Rev. E 2009, 80, 045102. [Google Scholar] [CrossRef] [PubMed]
- Bianconi, G. The entropy of network ensembles. Phys. Rev. E 2009, 79, 036114. [Google Scholar] [CrossRef] [PubMed]
- Machado, J.A.T.; Mata, M.E.; Lopes, A.M. Fractional State Space Analysis of Economic Systems. Entropy 2015, 17, 5402–5421. [Google Scholar] [CrossRef]
- Machado, J.A.T.; Lopes, A.M. Fractional Jensen-Shannon Analysis of the Scientific Output of Researchers in Fractional Calculus. Entropy 2017, 19, 127. [Google Scholar] [CrossRef]
- Modrak, V.; Marton, D. Development of Metrics and a Complexity Scale for the Topology of Assembly Supply Chains. Entropy 2013, 15, 4285–4299. [Google Scholar] [CrossRef]
- Albert, R.; Jeong, H.; Barabasi, A.L. Error and attack tolerance of complex networks. Nature 2000, 406, 378–382. [Google Scholar] [CrossRef] [PubMed]
- Tanizawa, T.; Paul, G.; Cohen, R.; Havlin, S.; Stanley, H. Optimization of network robustness to waves of targeted and random attacks. Phys. Rev. E Stat. Nonlin. Soft. Matter. Phys. 2005, 71, 047101. [Google Scholar] [CrossRef] [PubMed]
- Tokyo Shoko Research, Ltd. TSR Report and Database Services. Available online: http://www.tsr-net.co.jp/en/outline.html (accessed on 15 November 2015).
- Expert, P.; Evans, T.S.; Blondel, V.D.; Lambiotte, R. Uncovering space-independent communities in spatial networks. Proc. Natl. Acad. Sci. USA 2011, 108, 7663–7668. [Google Scholar] [CrossRef] [PubMed]
© 2017 by the authors. Licensee MDPI, Basel, Switzerland. This article is an open access article distributed under the terms and conditions of the Creative Commons Attribution (CC BY) license (http://creativecommons.org/licenses/by/4.0/).