You are currently viewing a new version of our website. To view the old version click .
Sensors
  • Article
  • Open Access

21 August 2019

Design and Performance Evaluation of a Low-Cost Autonomous Sensor Interface for a Smart IoT-Based Irrigation Monitoring and Control System

,
,
and
1
Department of Mathematical Sciences (Computer Science), Faculty of Science, Yelwa Campus, Abubakar Tafawa Balewa University (Federal University of Technology), Dass Road, P.M.B. 0248, Bauchi, Nigeria
2
Computer Systems Laboratory, Department of Computer Engineering, Chosun University, Dongku SeoSukDong 375, Gwangju 501-759, Korea
3
Multi-disciplinary Laboratory (MLab), Abdussalam International Centre for Theoretical Physics (ICTP), Via Beirut 31, 34014 Trieste, Italy
*
Authors to whom correspondence should be addressed.
This article belongs to the Section Internet of Things

Abstract

Irrigation systems are becoming increasingly important, owing to the increase in human population, global warming, and food demand. This study aims to design a low-cost autonomous sensor interface to automate the monitoring and control of irrigation systems in remote locations, and to optimize water use for irrigation farming. An internet of things-based irrigation monitoring and control system, employing sensors and actuators, is designed to facilitate the autonomous supply of adequate water from a reservoir to domestic crops in a smart irrigation systems. System development lifecycle and waterfall model design methodologies have been employed in the development paradigm. The Proteus 8.5 design suite, Arduino integrated design environment, and embedded C programming language are commonly used to develop and implement a real working prototype. A pumping mechanism has been used to supply the water required by the soil. The prototype provides power supply, sensing, monitoring and control, and internet connectivity capabilities. Experimental and simulation results demonstrate the flexibility and practical applicability of the proposed system, and are of paramount importance, not only to farmers, but also for the expansion of economic activity. Furthermore, this system reduces the high level of supervision required to supply irrigation water, enabling remote monitoring and control.

2. Autonomous Sensor Interface System Architecture and Design

2.1. Autonomous System

An autonomous system is defined as a system that detects its operating environment and senses the operating parameters, changes its operating behavior in that environment, and adapts to the changes and events occurring in that environment. Autonomic systems provide the capabilities to solve system complexities by using technology to manage and control dynamical systems. These types of systems operate with independent and pre-defined conditions, protocols, and policies, without human intervention. Autonomous systems can configure, optimize, manage, and control their actions according to predetermined conditions, rules, and learning the environments in a given period of time. The origin of the word autonomic comes from the field of human biology. For example, the human body consists of an autonomic nervous system that monitors and controls the human heartbeat, check blood sugar levels, and regulates and maintains body temperature to normal without human intervention. An autonomous sensor interface can be employed in smart irrigation agriculture to solve the problem of water shortage to the plants. Autonomous systems provide the capabilities of self-managing its operation by using appropriate actions in response to situational changes that arise in a dynamic environment. The main objective of an autonomous system is to monitor and control the loop that generates and collects detailed information from the surroundings and supply the appropriate action. As outlined in [22,23], an autonomous system has four characteristics as follows:
  • Self-Configuration: This is the ability of the autonomous system to adapt dynamically to environmental and situational changes, based on pre-defined protocols, and principles that govern the operating environment. Self-configuration provides continuous signal strength in sensing environmental parameters and enhances sensor-node productivity. This will provide scalability and flexibility in the sensor network interface.
  • Self-Healing: This feature provides the means of autonomous discovery and fault detection. It provides the ability to discover, diagnose, and respond to unpredicted situational changes that may occur in a dynamic environment. Self-healing detects sensor component failure and initiates a repair technique without affecting system workability. The system repairing mechanisms makes it resilient against errors and faults.
  • Self-Optimization: This feature provides autonomous monitoring and control to facilitate the fair and optimal use of limited resources. Self-optimizing sensor components possess capabilities of controlling themselves to attain the stated goals and objectives in a given environment. The optimization techniques are the reallocation and rescheduling of resources caused by arising changes in the dynamic environment, to enhance the overall sensor network utilization, real-time transmission, and retransmission of sensor data.
  • Self-Protection: This feature provides the capabilities of anticipating, identifying, and providing mechanisms for protection against threats and various kinds of attacks in autonomous systems. This feature enables the autonomous system to detect malicious and suspicious behavior within the system and take reactive measures to counterattack them and make the system less vulnerable to threats. Furthermore, this feature provides security measures and policies to protect components and the entire system against all internal or external threats and vulnerability attacks.
In summary, these four characteristics of autonomous systems are employed in the design and implementation of an autonomous sensor interface for IoT-based irrigation monitoring and control systems for agricultural use. The system can configure, heal, optimize, and protect its operation, and enhance the supply of water to the plant to increase agricultural production.

2.2. Autonomous Sensor Interface System Architecture

The low-cost autonomous sensor interface for the design of smart irrigation system architecture consists of the input and output processes, as illustrated in Figure 1. The entire system operation is controlled by the Arduino Uno board, which is programmed on the behavior of other system components [24]. The system consists of the following eight units: Power supply; water pump; WiFi module; soil moisture sensor; Arduino board; temperature, pH, and humidity sensors; user interface; and a 16 × 2 liquid crystal display (LCD) unit. The combination of these components makes the integration of the system easier to debug and provides optimal performance. The sensor values are uploaded on the Internet at 5-min intervals. The power supply unit provides a continuous supply of electricity to the smart irrigation system; it utilizes a 12 V transformer and a relay circuit. The system uses a generic AC 220 V to 12 V DC step down power supply module for Arduino generic PCs to power the board and the water Pump. A 12 V relay circuit is used to regulate and control the water pump. The board can be supplied with power, either from the DC power jack (7–12 V), the USB connector (5 V), or the VIN pin of the board (7–12 V). The power output is supplied to the Arduino board and the water pumping unit. The water pumping unit provides a mechanism by which adequate water in due proportion is supplied to the plants. This mechanism is programmed, controlled, and monitored by the Arduino Uno board. The Arduino board unit is the main monitoring and control unit. The Arduino Uno is a microcontroller board based on the ATmega328. It has 14 digital input/output pins, 6 analog inputs, a 16-MHz ceramic resonator, and a universal serial board. This unit is programmed using embedded C language to provide the necessary control signals to manage the entire irrigation system. The moisture sensor unit is responsible for measuring the soil moisture content of the water level of the soil, using the sensor uses capacitance to measure the water content of the soil. This is essential in smart agricultural practices, as it helps farmers monitor and control the smart irrigation system. In practice, this sensor, which is flexible and configurable, is inserted into the irrigation farmland i.e., soil to be examined and the volumetric water content of the soil is reported in percentage. The user interface unit provides a convenient interface to access and programme the sensors. The system users have the ability to interact with the system, using desktop, laptop, and smartphone devices. The LCD unit is a medium through which the microcontroller communicates with the user. The LCD unit is used to display sensed data readings from the sensors. The WiFi module unit is a self-contained system-on-chip (SoC) device with an integrated transmission control protocol/internet protocol (TCP/IP) stack, that provides access to a WiFi network. It has the capability of hosting an application or offloading all WiFi networking functions from another application processor. The module is a wireless local area network (WLAN) module with devices, based on IEEE standards. Furthermore, WiFi-compatible devices can connect to the Internet via a WLAN and wireless access point [25,26].
Figure 1. Low-cost sensor interface for smart IoT-based irrigation monitoring and control system architecture.

2.3. Real-Time System Monitoring and Control

Figure 2 illustrates the real-time device monitoring and control system. The connected sensor components and ports are initialized to display the start-up information on the 16 × 2 LCD screen. The microcontroller subsequently attempts to establish connection with the different components of the system. As soon as the connection is established, the WiFi module and moisture sensors will authenticate the established connection and start reading the moisture content level of the soil. The readings are displayed on the LCD screen through the user interface window of the Arduino serial monitor. In situation whereby the sensor readings are not obtained, i.e., there is no established connection, a retransmission is possible. The real-time water level (moisture sensor) module is accessed through the Internet at the www.thingspeak.com interface to obtain the monitoring values from the sensors. The date and time when the data was sensed are recorded. The two sensors autonomously obtain the measurement of the indicated parameters, such as temperature, humidity, and moisture level. The recorded measurements are saved in the Internet server at thingspeak.com, along with the date and timestamp. After the recorded data are received, a descriptive chart is plotted to indicate the moisture level of the soil. The system is programmed to switch the pump ON and OFF, based on the soil moisture content, using the embedded C programming language, as illustrated in Figure 2.
Figure 2. Real-time system monitoring and control.

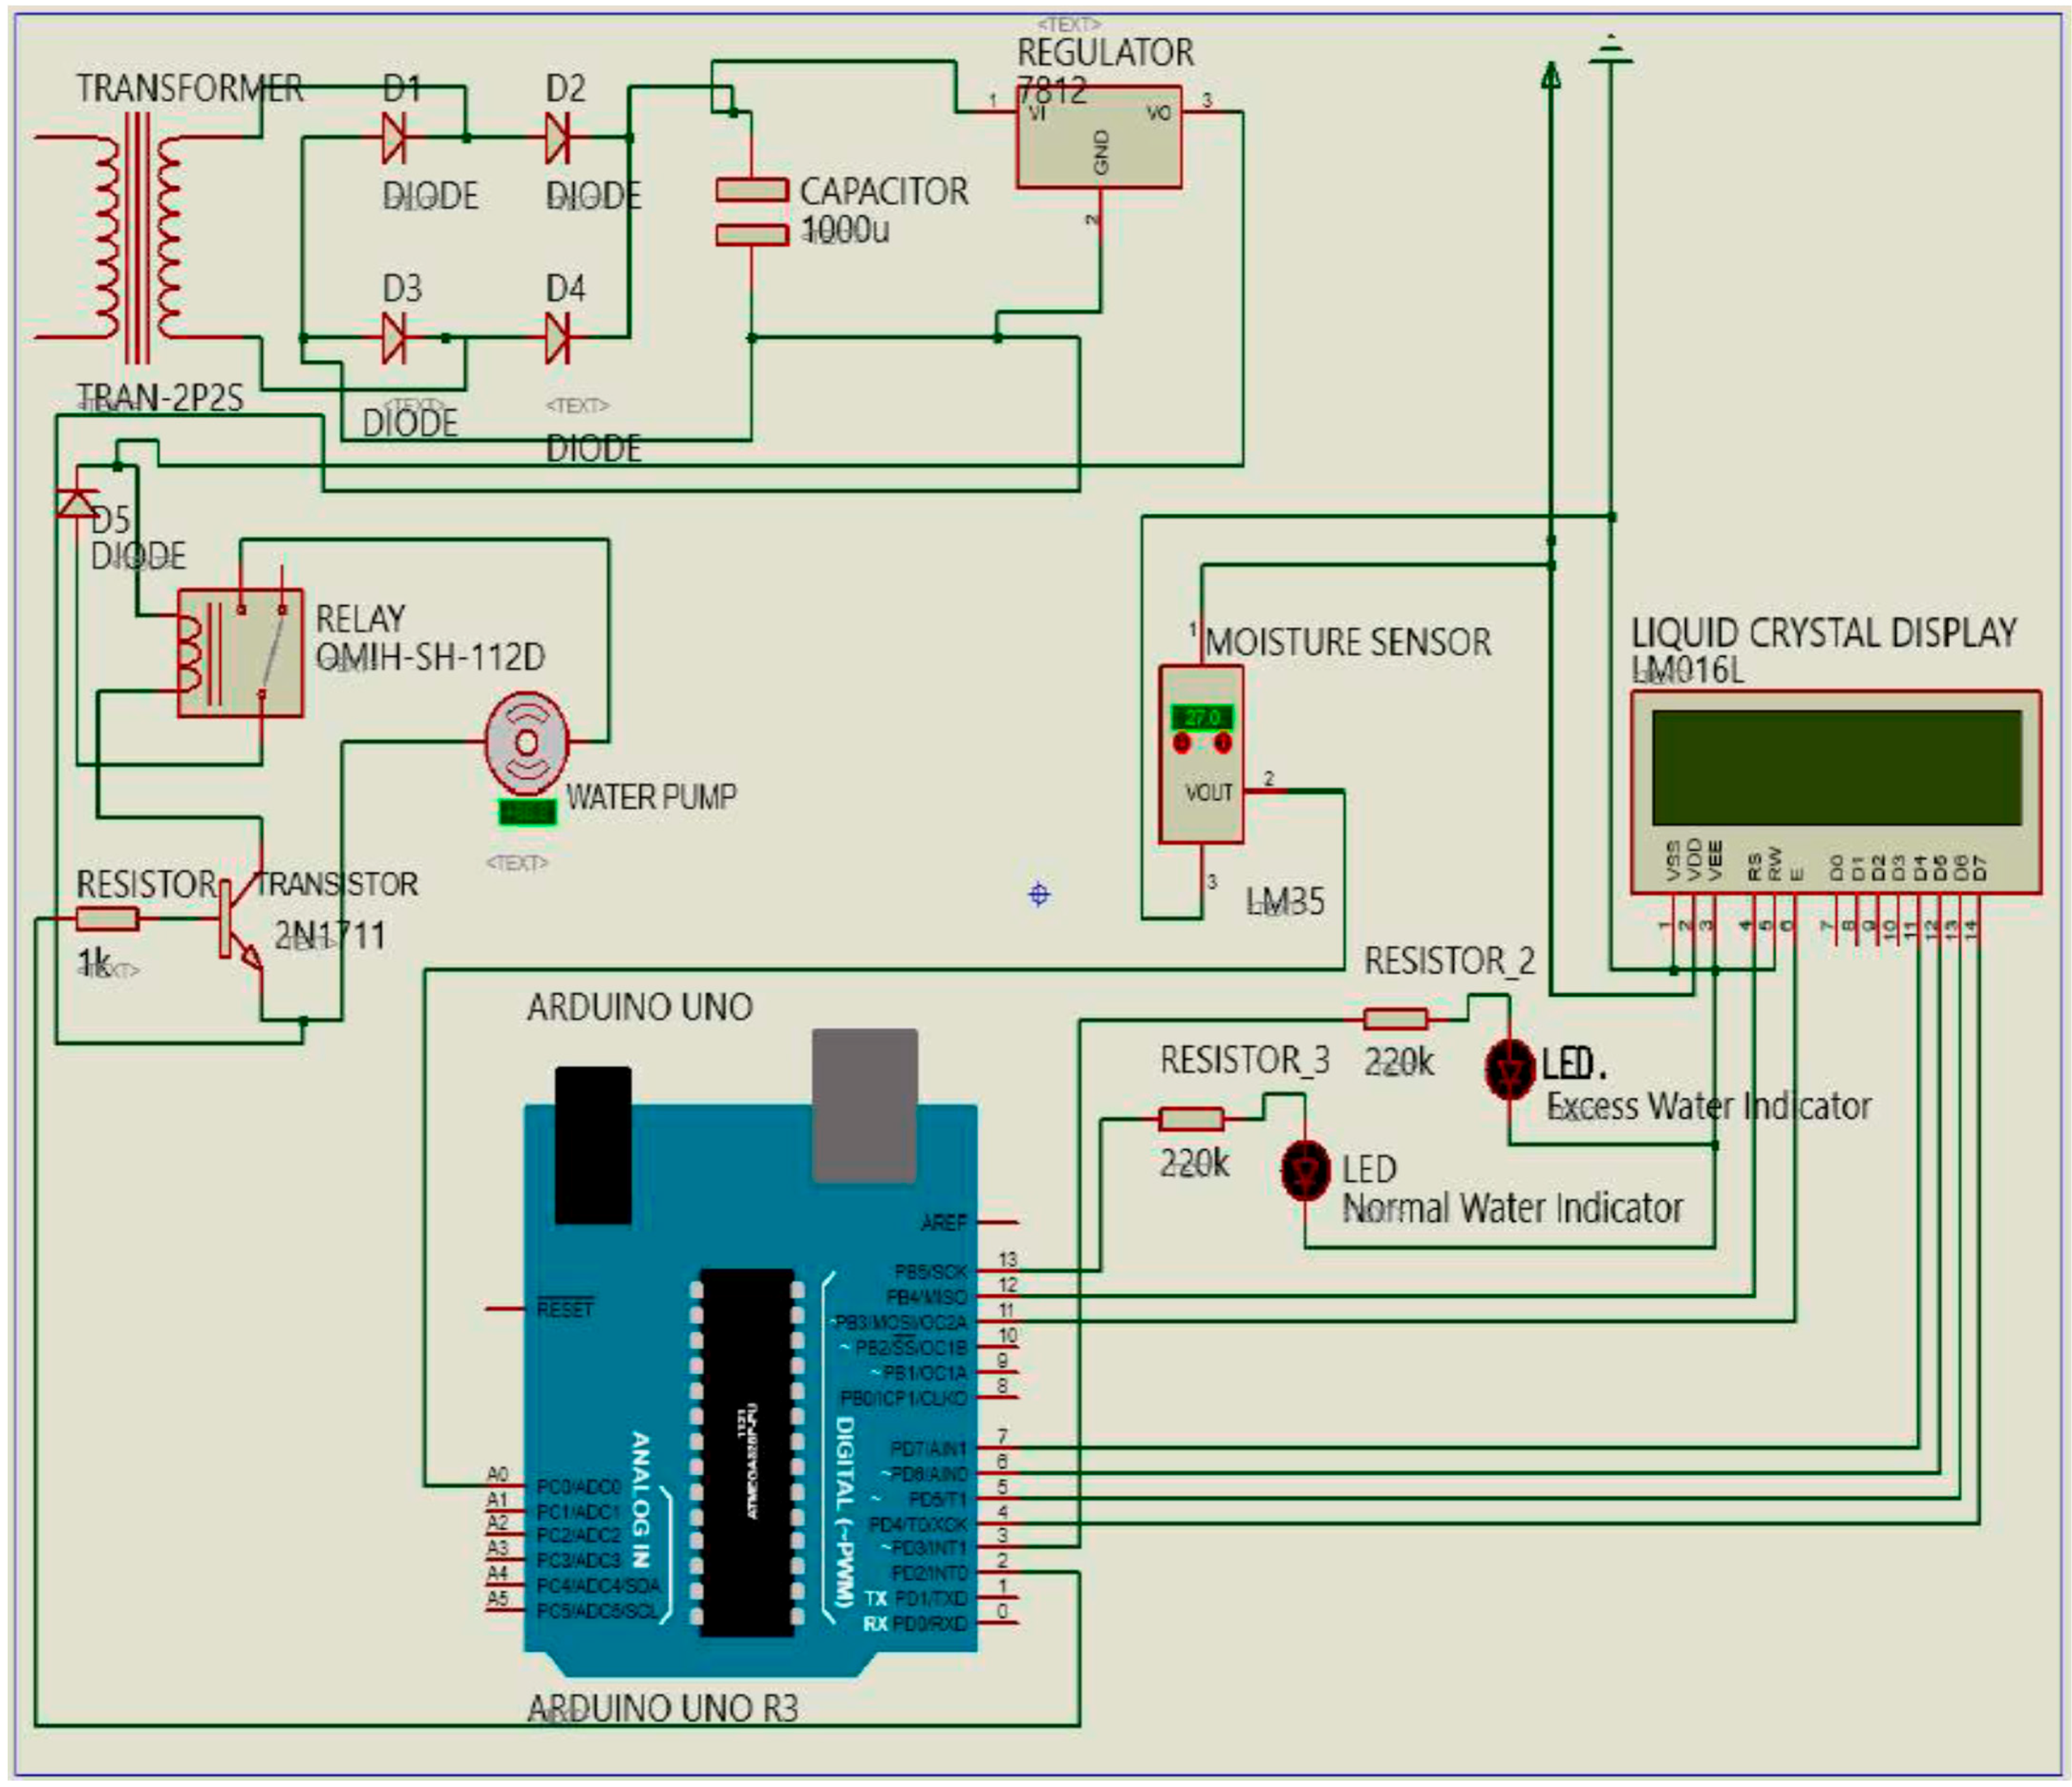
2.4. System Modeling and Simulation

The low-cost sensor interface, for the smart irrigation system, is simulated using the Proteus 8.5 design suite, Arduino Uno integrated development environment (IDE), and embedded C programming language. Proteus 8.5 Professional is an efficient tool and a high-performance design environment for simulating technical computing [25]. It integrates computation and the virtual representation of the systematic operation of the system, displaying how the constructed system components will work. Arduino, as the development board, provides an IDE, by which source codes can be written, verified, and uploaded to the microcontroller. Arduino is an open-source electronics platform that provides hardware/software co-design tools for designing embedded applications [24]. The embedded C programming language is suitable for the design of embedded systems and sensor components. The codes, written in embedded C language, allow the circuit or devices to achieve their optimal performance. In addition, it has a failure rate of less than one percent when developed to interact with hardware components. The Proteus 8.5 is a professional PCB design tool that can be integrated with a shape-base auto router; it provides features, such as fully featured schematic capture, highly configurable design rules, and interactive SPICE circuit simulation. Proteus design combines the ISIS schematic capture and ARES PCB layout programs to provide a powerful, integrated, and easy-to-use tool suite for educational and professional PCB design. Figure 3 illustrates the basic schematic components of the autonomous sensor interface for the smart IoT-based irrigation system. The moisture sensor, 16 × 2 LCD, transformer, light-emitting diode (LED), diode, Arduino Uno (microcontroller), water pump, power regulator, relay circuit, and many other devices constitute a complete irrigation monitoring and control system. Another approach is the use of a field-programmable gate array and system-on-chip for the monitoring and control system [26,27,28].
Figure 3. Schematic diagram of a smart irrigation modeling and simulation system.

2.5. The Moisture Sensor Calibration

Herein, we present the sensor calibration technique, used in this study. A two-point calibration method was employed [29,30,31] to calibrate the moisture sensor input. The Arduino board is configured to takes sensor readings simultaneously for 5 s during the system startup. The system then monitors the highest and lowest values of the sensor readings. These sensor readings, taken during the first five seconds, are termed the minimum and maximum of the anticipated values for the readings taken during the system loop. A two-point calibration technique is applied to the raw moisture sensor outputs. This approach is very important to re-scaling the output and has the potential to correct both slope and offset errors. Pseudocode 1 shows the procedure used to calibrate the moisture sensor, mentioned in the experimental section. The following configuration needs to be set before the Arduino startup process. The initial values for the minimum and maximum of the moisture sensor are set to int MoistureMin = 400, and int MoistureMax = 100, respectively.
The configuration above looks surprising. However, it calibrates the output of the sensor. First, the MoistureMin is set high (400) and monitored for any reading below that, saving it as the new minimum. Similarly, the MoistureMax is set low (100) and monitored for any reading higher, as the new maximum. In doing so, any further moisture readings can be mapped to the range between the MoistureMin and MoistureMax values. Finally, the moisture sensor can be calibrated using the map function, as illustrated in Algorithm 1.
Algorithm 1: Soil moisture sensor calibration process.
1: // Algorithm to Calibrate the moisture sensor during the first five seconds.
2: // Set the initial values for the minimum and maximum values of the moisture sensor.
3: int MoistureMin ← 400; // The minimum moisture sensor value.
4: int MoistureMax ← 100; // The maximum moisture sensor value.
5: while (millisecond () < 5000)
6:   {
7:   MoistureValueanalogRead (MoisturePin)
8:   // Record the maximum sensor value
9:   if (MoistureValue > MoistureMax)
10:      {
11:        MoistureMaxMoistureValue
12:      }
13:   // Record the minimum sensor value
14:    if (MoistureValue < MoistureMin)
15:    {
16:      MoistureMinMoistureValue
17:     }
18:   }
19: MoistureValuemap (MoistureValue, MoistureMin, MoistureMax, 100, 400);

2.6. The Soil Moisture Sensor

There are two classes of sensors that measure the soil moisture content. The first class is known as, the soil moisture sensors, and this class of sensors measure the volumetric water content in soil. The second class is referred to as soil-water potential sensors. This class of sensor measures another property of moisture in soils called the water potential, including tensiometers and gypsum blocks. Meanwhile, the direct gravimetric measurement of free-soil moisture requires removing, drying, and weighing of a soil sample. While the soil moisture sensors measure the volumetric water content indirectly, by employing any other property of the soil, such as dielectric constant, resistance, capacitance, or interaction with neutrons as a substitute for the moisture content [32].
The research by Jim Bilskie [33] is based on the direct gravimetric and volumetric measurements of soil water status content and potential. As mentioned by the author, the state of water in soil is defined in relation to the amount of water and energy associated with the forces, which hold the water in the soil. The amount of water, that is described by the water content and the energy state of the water, is the water potential.
The soil-water content can be expressed as direct or indirect on a gravimetric or volumetric basis. The direct gravimetric water content ( Φ g ) is the mass of water per mass of dry soil. It is measured by weighing a soil sample (Mass_Wet), drying the sample to remove the water, then weighing the dried soil (Mass_Dry). This is given in Equation (1):
Φ g   =   M a s s _ W a t e r M a s s _ S o i l   =   M a s s _ W e t     M a s s _ D r y   M a s s _ D r y
The direct volumetric water content Φ v is the volume of liquid water per volume of soil. Volume is the ratio of mass to density ( ρ ), this is given in Equation (2).
Φ v =   V o l u m e _ W a t e r V o l u m e _ S o i l   =   M a s s _ W a t e r ρ _ W a t e r M a s s _ S o i l ρ _ S o i l   =   Φ g   ×   ρ _ S o i l ρ _ W a t e r
Another parameter for the direct volumetric water content is the soil bulk density ( ρ _Bulk), which is used for soil density ( ρ _Soil) parameter, and is defined as the ratio of soil dry mass to sample volume. Herein, the density of water is close to 1 and most situations is ignored. Furthermore, another important property of the soil is the soil porosity (ε), this property has a direct relationship with the soil bulk density, as provided in Equation (3). Where the parameter ρ _Solid is the density of the soil fraction and is approximated and given as 2.6 g·mc−3:
ε   =   1     ρ _ B u l k ρ _ S o l i d
The soil moisture sensor module, used in this study, is based on the LM393 comparator. Farmers need to measure the soil moisture regularly to prevent plants from drying. Hence, measuring the soil moisture is very important in agriculture to help farmers remotely manage and control the irrigation system. This type of sensor indirectly measures the volumetric water content of the soil. To measure the soil moisture content, the moisture sensor uses the capacitance to measure the water content of soil. The operating principle, used by the soil moisture sensor, uses the capacitance to measure dielectric permittivity of the surrounding environment. In soil, dielectric permittivity is a function of the water content. The soil moisture sensor generates a voltage proportional to the dielectric permittivity, and consequently the water content of the soil. The moisture sensor averages the water content over the whole length of the sensor. In the sensor, there exists a 2 cm zone of influence, with respect to the flat surface of the sensor. However, there is little or no sensitivity at the extreme edges of the flat surface. The soil moisture sensor is practically applied to quantify the loss of moisture for a dedicated period of time, due to evaporation and plant uptake. It evaluates the optimum soil moisture content for various species of plants, and monitors soil moisture content to control irrigation in agricultural farmland. The sensor can be inserted into the soil to be tested, and the volumetric water content of the soil is reported as a percentage. In doing so, the farmer can precisely monitor and control the amount of water to be supplied, with the aid of an easy-to-use mechanism, using a water pump and a microcontroller unit. The conductivity of the soil may be severely altered by the application of fertilizers, and this would result in false soil moisture readings when using a conductive probe.
The soil moisture sensor comprises two parts: The main sensor and the control board unit. The main sensor part consists of a number of conductive probes, that can be used to measure the volumetric content of the water in the soil. The control unit is designed, based on the LM392 IC, as a voltage comparator. Other components included are connectors, LEDs, resistors, and capacitors. Furthermore, a potentiometer is provided to adjust the sensitivity of the control unit module, as illustrated in Figure 4. The ground moisture sensor operates based on the principle of voltage comparison, as exemplified in Figure 5. Herein, one input of the comparator is connected to a 10-kΩ potentiometer, and the other input is tied to a voltage divider network, designed with a 10-kΩ resistor and a sensor probe for insertion into the ground. The probe conductivity varies, depending on the water content. In a situation by which the water content of the soil is less, the probe conductivity would be less; therefore, the input to the comparator would be HIGH. This implies that the output of the comparator is HIGH; based on this, the LED would be in the OFF state. Furthermore, in a situation in which there is adequate water content in the soil, the probe conductivity increases, resulting in a comparator output of LOW. Thus, the LED would start to blink. An essential feature of this sensor module is that it provides an analog output that can be sent to the microcontroller. The analog signal can be transmitted to the analog input pin of the Arduino board. The volumetric water content of the soil can be measured and presented as a percentage [34,35].
Figure 4. Low-cost sensor interface for smart irrigation modeling and simulation system.
Figure 5. Circuit diagram of the moisture soil sensor operating principle.

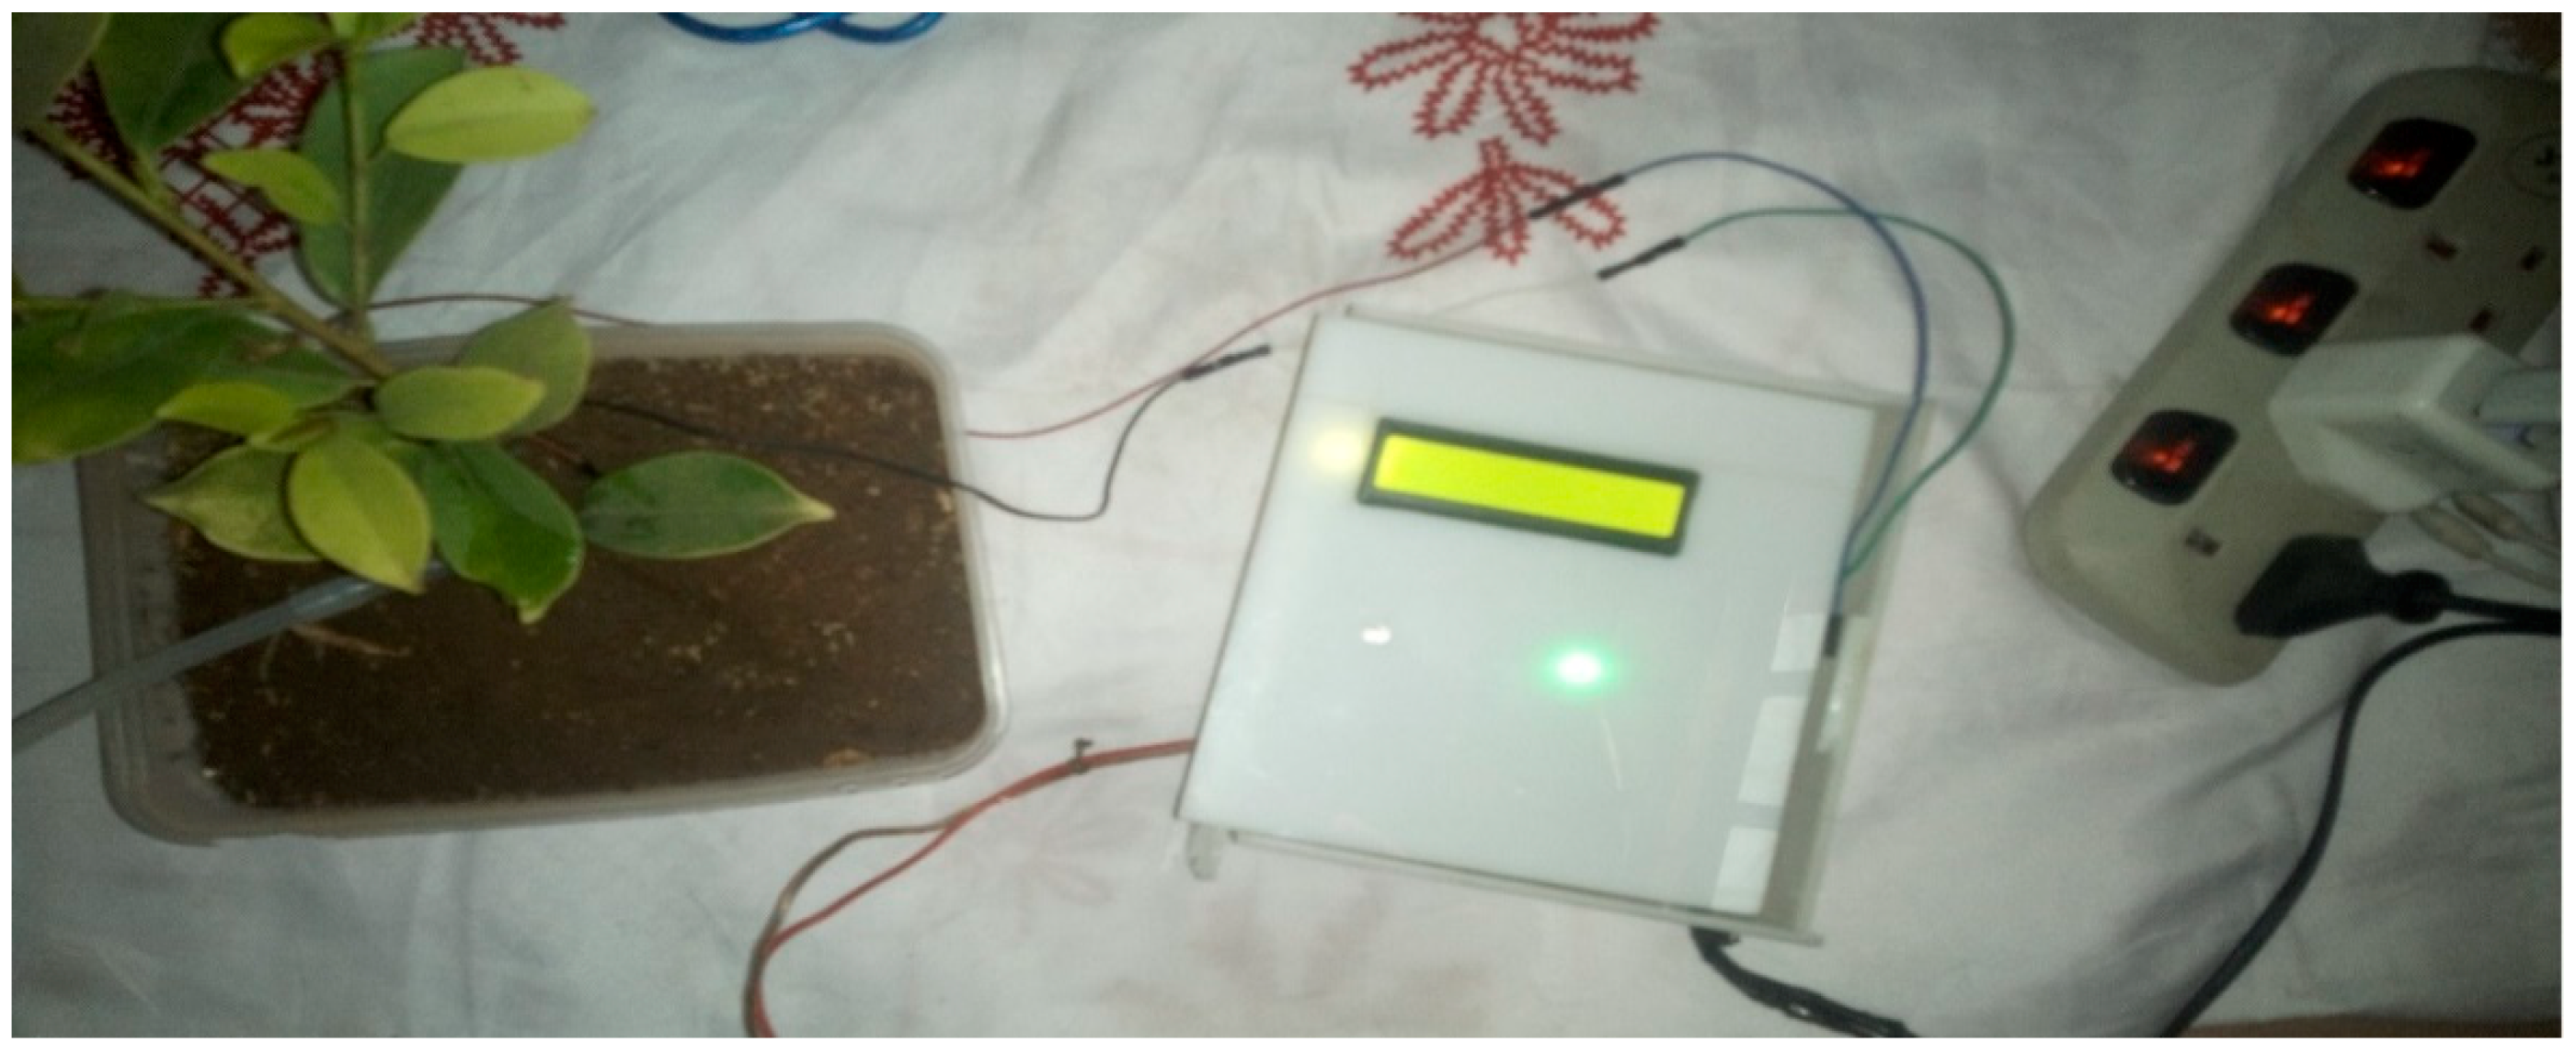
3. System Implementation

The implementation of the low-cost autonomous sensor interface, for a smart IoT-based irrigation monitoring and control system, establishes that the new system is operational and satisfies the operational requirement of the user for measurement and evaluation. The important parameters to be measured, by the smart system, have been defined and are well-established. The moisture sensors are buried in the ground at the required depth of 2 cm. Once the soil reaches the desired moisture level, the sensors send a signal to the microcontroller to turn off the relay circuits, which control the water pump. The implementation can be tested in the designated location. These tests include, arranging the constructed system prototype at a strategic location in farmland, such that the environmental parameters would be monitored by the sensors. The processed sensor data are transmitted to the web server through the website, www.thingspeak.com [27], where users can view the monitoring and control data. Figure 6, Figure 7, Figure 8, Figure 9 and Figure 10 illustrate the experimental setup of the autonomous sensor interface for the IoT-based irrigation system. The components are interconnected via a smart interface, the water pump is connected to the plants to supply water when the moisture level of the soil is below normal, and the immersed moisture sensor, buried in the soil, monitors the moisture level and communicates the information to the microcontroller. Thereafter, the monitored and control information is transmitted to the LCD screen, and uploaded to the web server, through the WiFi module. Figure 11 and Figure 12 demonstrate the implemented prototype.
Figure 6. Low-cost sensor interface for Internet of Things (IoT)-based irrigation system component setup.
Figure 7. Low-cost sensor interface for IoT-based irrigation system sensor probe inserted in completely dry soil.
Figure 8. Prototype testing in less moist soil (Moisture level 25%).
Figure 9. Prototype testing in highly moist soil (Moisture level 410%).
Figure 10. Prototype testing in less dry soil (Moisture level 17%).
Figure 11. The implemented prototype view part 1.
Figure 12. The implemented prototype view part 2.

4. Experimental Results and Discussion

The experimental results are obtained from the implemented prototype. We conducted several experiments under different simulated scenarios to demonstrate the workability of the proposed system. The results are the outputs obtained from the calibrated sensor readings, transmitted and stored on the website, www.thingspeak.com. The prototype was operated and tested to evaluate device workability in real situations. The date and timestamp of the data of each sensor are displayed on the website for user information.

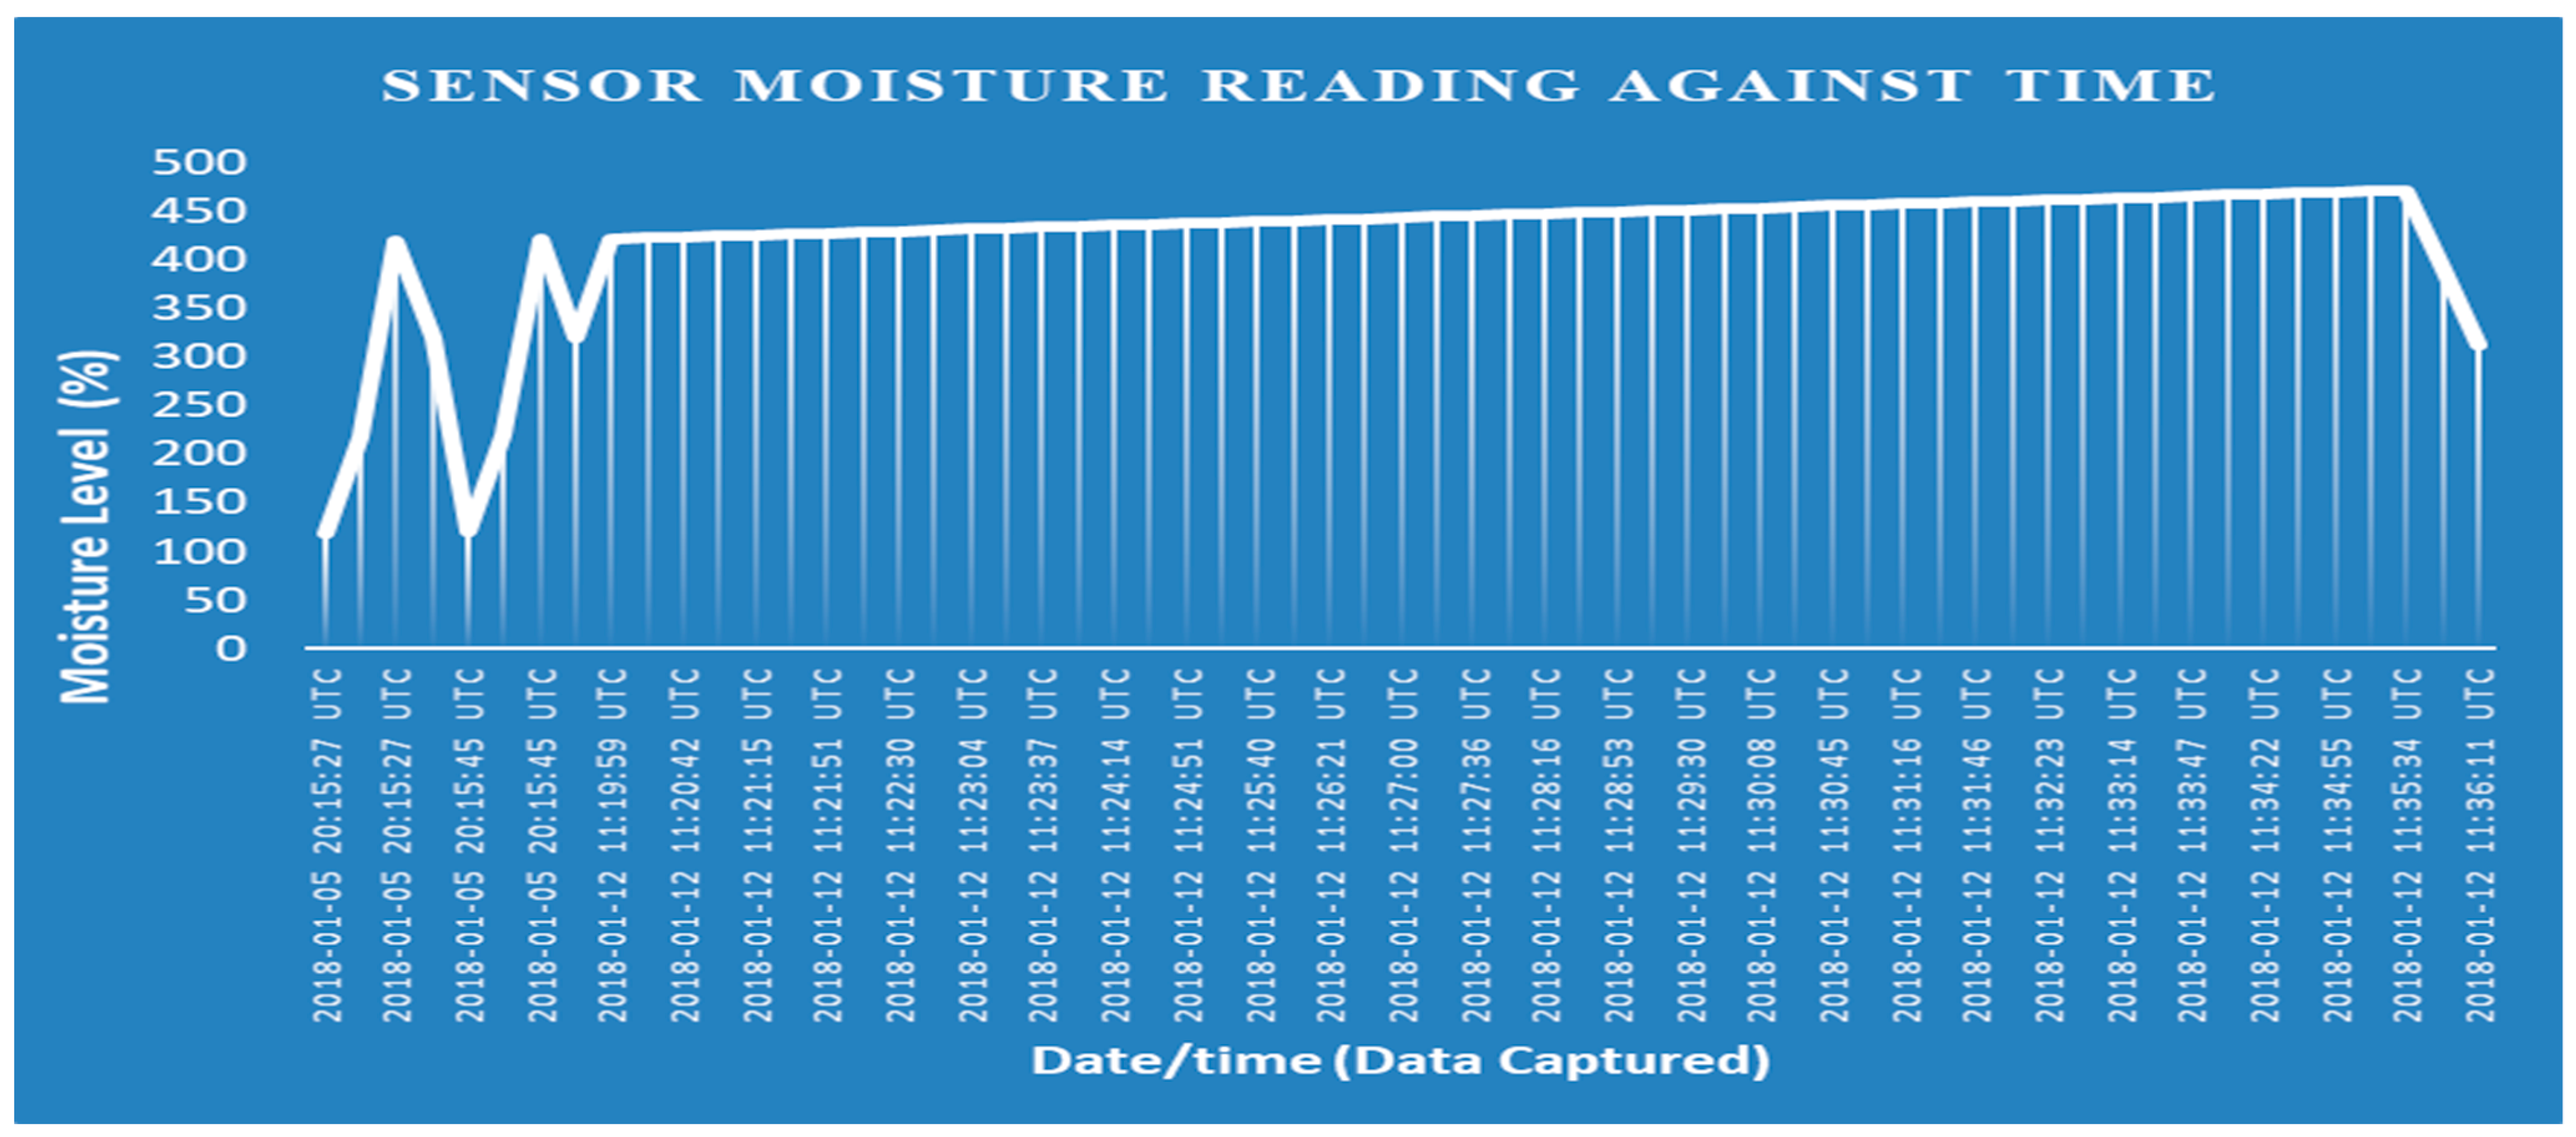
4.1. Sensor Data Logging

The calibrated data, captured by the sensors, are transmitted to the web server [27]. The moisture sensor sends data, through the WiFi module to www.thingspeak.com, is accessible via a phone or personal computer. Here, the logged data of the moisture content values, with the appending date and time, are shown in the serial terminal, as illustrated in Figure 13. The numerical data can also be downloaded and saved in comma-separated values (CSV) or the excel file format. It is important to obtain the moisture content values, in order to demonstrate the efficiency and data integrity of the developed system prototype. This represents significant advances in irrigation system technology, particularly in the present age of serious advancements in sensor technology and creativity.
Figure 13. Sensor data logging.
Figure 14, Figure 15, Figure 16 and Figure 17 illustrate the calibrated soil moisture values against time. These values are obtained from the sensor reading of the implemented prototype from the website, www.thingspeak.com in real time, using the key value of the application programming interface (API). Figure 18 shows the variation of temperature, humidity, and pressure in the tested soil as reported by the www.thinkspeak.com analytic and visualization website. We can observe that, in Figure 19, the soil status (dry or moist) determines the supply of the water to the plants at different time intervals. As the water content increases, and becomes higher than the threshold values (between 100% and 400% volumetric water content), the supply of water stops, thus preventing the supply of excess water to the plants, which can damage or harm their roots and expose them to the environment. The designed system drastically minimizes water loss and prevents plant damage, which is due to the high-water content of its roots or leaves. Below 100%, the soil moisture is low, and the plant will dry. The water pump is turned ON. Above 400%, the moisture exceeds the threshold limit and the water pump is turned OFF. This shows that the monitoring and control of water content in farmland, plays a vital role in improving the irrigation system of farming and ensuring a significant increase in agricultural productivity, with minimal or no effort from the farmer.
Figure 14. Moisture levels against time obtained from http://www.thingspeak.com (API key =9VHO8NR618JJT9CN).
Figure 15. Moisture levels against time obtained from http://www.thingspeak.com (API key = FE4H530DNA2NJQXB).
Figure 16. Moisture levels against time obtained from http://www.thingspeak.com (API key = FE4H530DNA2NJQXB).
Figure 17. Moisture levels against time obtained from http://www.thingspeak.com (API key = FE4H530DNA2NJQXB).
Figure 18. Variation of soil temperature, humidity, and pressure measurements obtained from http://www.thingspeak.com (API key = FE4H530DNA2NJQXB).
Figure 19. Soil moisture values against time.

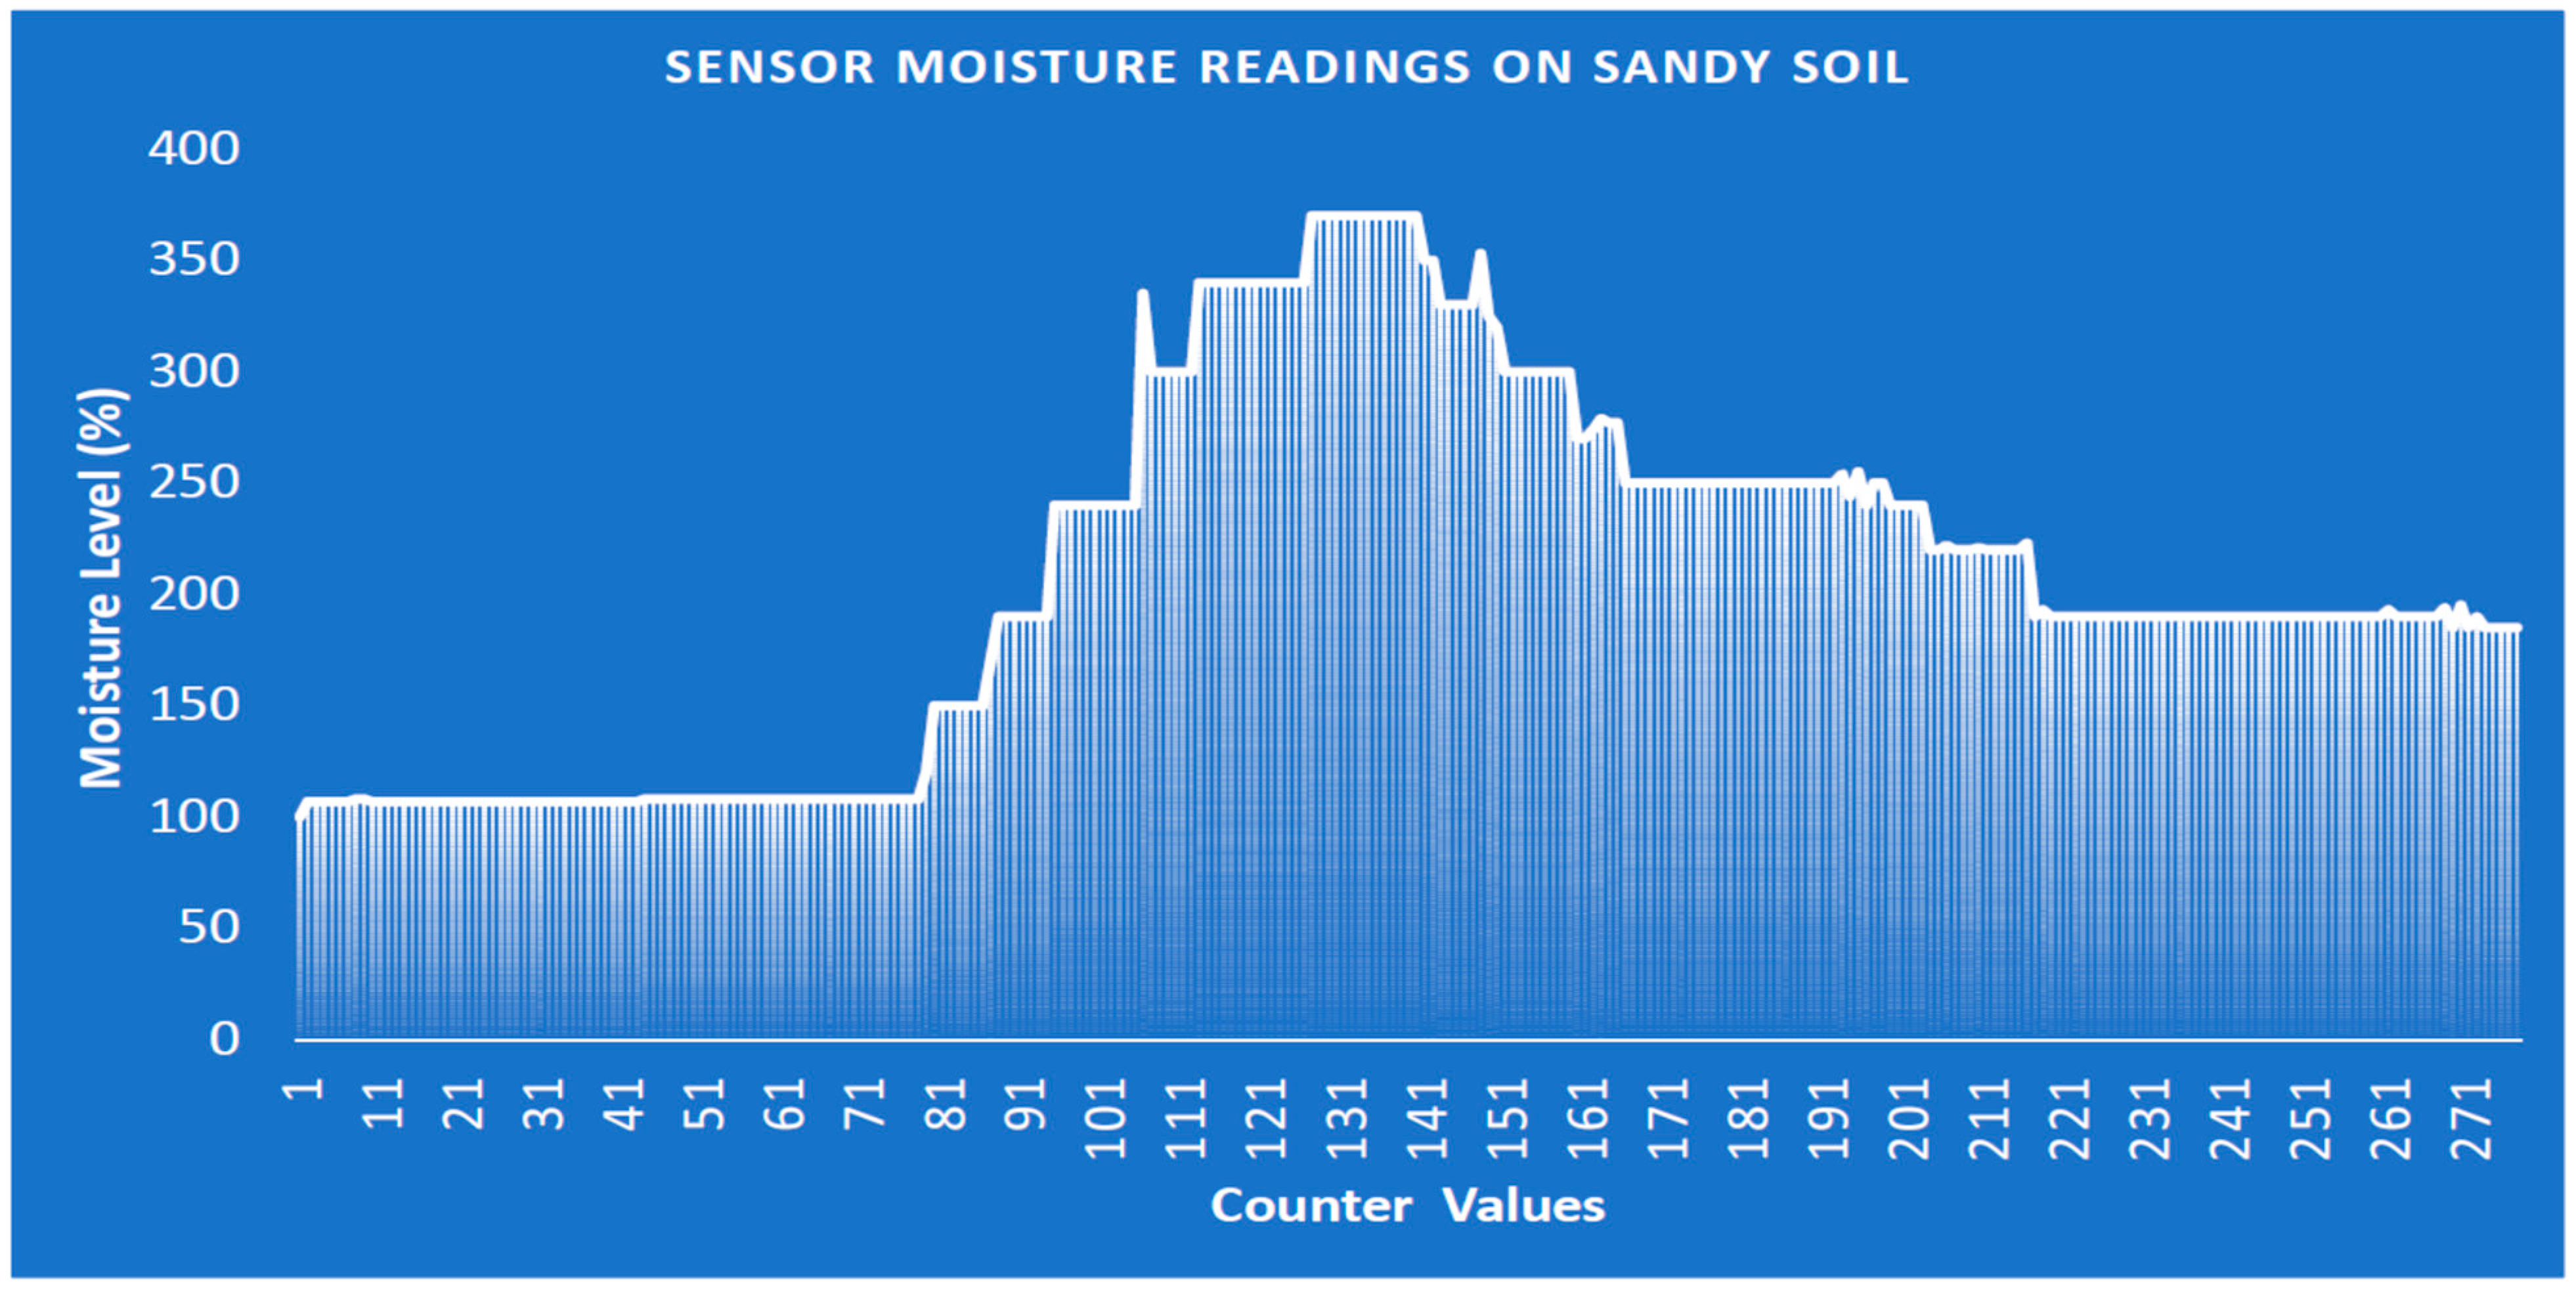
4.2. Performance Evaluation on Loamy and Sandy Soils

Loamy and sandy soils are selected for performance evaluation, owing to the fact that they are prominent types of soil that are suitable for autonomous irrigation farming. The test was conducted by setting the system counter at 0 to proceed to 300, and various moisture readings were taken with different counter values, while the device was in operation. Figure 20 illustrates the performance of the loamy soil in terms of moisture content. It can be observed that, as the water is supplied to the soil, the soil tends to absorb the water slowly (i.e., a soil moisture level value of approximately 100%), which is due to the water-retaining capability of loamy soil, and at a particular point (i.e., from the moisture level 300 to 350 percent), it retains water, causing the water pump to steadily switch off to stop the further supply of water. This demonstrates that the implemented prototype can perform satisfactorily when deployed in irrigated farmland enriched with loamy soil. Furthermore, in deploying the system in loamy soil farmland, the cost of electricity consumption is minimized by closing the water pump when the moisture level exceeds 400%. This also control the supply of water to plants and prevent the roots from being exposed to the surrounding environment, resulting in higher crop yield.
Figure 20. Soil moisture level against counter values on loamy soil.
Figure 21 illustrates the performance of sandy soil in terms of moisture content. As the water is supplied to the dry sandy soil, the water tends to be quickly absorbed by the soil, due to the poor water-retaining capability of the soil. The moisture level is higher at the counter values of 81 to 161. However, the moisture level significantly drops to below 200%, causing the moisture content level to decline significantly with time. The monitoring and control of sandy soil require a greater consumption of electricity to power the water pump, in order to maintain the moisture level status at normal (i.e., between 100% and 400%). This approach is implemented to help inform farmers in real-time that irrigation is required. These findings are of immense assistance to farmers and decision-makers in the proper monitoring and control of agricultural farm products for sustainable development.
Figure 21. Soil moisture level against counter values on sandy soil.

4.3. Cost Analysis

Table 1 shows the list of items, and their descriptions that are used to design and implement the device prototype. The cost analysis is expressed in U.S. Dollar (USD). These cost patterns are subject to vary from time to time, due to fluctuations in the global market exchange rate [36]. The cost analysis provided excludes the cost of shipping, value added tax, and labor. It can be observed that the total cost of the complete prototype is valued at $79 USD, which indicates a very low-cost device that is affordable and can be utilized by farmers with low income, compared to the approach presented by the authors in [18].
Table 1. Cost analysis of the implemented device prototype.

5. Conclusions

This article presents a low-cost autonomous sensor interface for the design of an IoT-based smart irrigation monitoring and control system. A real working prototype was designed and implemented. The main objective of this work was to enable farmers to have autonomous monitoring and control of remote farmland, to generate an increase in crop production. This study used a moisture sensor to measure the water content in the soil, a water pump to supply the required amount of water to the plants, and a WiFi module to make the sensed data accessible through the Internet. The web server serves as the main base station for the storage of sensor readings. The data, stored on the web server, were rigorously analyzed. The sensor measurements were transmitted to the Internet in real time. Based on the acquired results, a farmer can precisely monitor the water content of the soil in his/her farmland. The performance evaluation of the system is reliable, in terms of the captured data, speed, accuracy, and integrity of the sensed data that is obtained from the sensors. Based on the descriptive nature of the plotted graphs, a farmer can determine whether a plant is in good condition, in terms of the water content of the soil beneath it. In real time, the system notifies farmers of any inadequate or excess water supply to the farm, as the water pump is switched on or off, depending on the moisture level. The proposed low-cost system can be implemented on a large-scale agricultural farm, to simplify and eliminate the unnecessary stress a farmer normally undergoes in supplying water to his/her farmland. The proposed system, and presented experimental results, will be of immense assistance to farmers and decision-makers in the proper monitoring and control of agricultural farm products.
Future work will consider the use of a field programmable gate array (FPGA) and system-on-chip (SoC)-based architecture, namely, the Xilinx Zynq 7000 FPGA-SoC device using the Python programming language for Zynq devices. This will enhance high performance device monitoring and control when deployed to large agricultural farmland.

Author Contributions

Conceptualization, S.A.; Data curation, J.W.N., J.-A.L. and M.L.C.; Formal analysis, S.A., J.W.N., J.-A.L. and M.L.C.; Funding acquisition, J.-A.L.; Investigation, S.A. and J.W.N.; Methodology, S.A. and J.W.N.; Project administration, J.-A.L. and M.L.C.; Resources, J.W.N. and M.L.C.; Software, S.A. and J.W.N.; Supervision, J.-A.L.; Validation, S.A., J.W.N. and J.-A.L.; Visualization, J.-A.L. and M.L.C.; Writing—original draft, S.A.; Writing—review & editing, J.-A.L. and M.L.C.

Funding

This research was supported by Basic Science Research Program through the National Research Foundation of Korea (NRF) funded by the Ministry of Education (2019R1I1A3A01058887), and in part by the Korea Institute of Energy Technology Evaluation and Planning and Ministry of Trade, Industry and Energy of the Republic of Korea under Grant 20184010201650.

Acknowledgments

The authors would like to thank the National Research Foundation of Korea through the Ministry of ICT and the Korea Institute of Energy Evaluation and Planning and Ministry of Trade, Industry and Energy of the Republic of Korea for providing the financial support of this research work. Special thanks are owed to the Abdussalam International Centre for Theoretical Physics (ICTP), Trieste, Italy and Iain Darby of the International Atomic Energy Agency (IAEA), Vienna, Austria, for the ICTP workshop/Seminar SMR 3143, “Joint ICTP-IAEA School on Zynq-7000 SoC and its Applications for Nuclear and Related Instrumentation”, Aug–Sep 2017, Trieste, Italy.

Conflicts of Interest

The authors declare no conflict of interest.

References

  1. Imran, A.L.; Gao, J.; Tabinda, N.S.; Farman, A.C.; Noman, A.B.; Waqar, A.Q. Monitoring and Control Systems in Agriculture Using Intelligent Sensor Techniques: A Review of the Aeroponic System. J. Sens. 2018, 18, 8672769. [Google Scholar]
  2. Bégué, A.; Arvor, D.; Bellon, B.; Betbeder, J.; De Abelleyra, D.; Ferraz, R.P.D.; Lebourgeois, V.; Lelong, C.; Simões, M.; Verón, S.R. Remote Sensing and Cropping Practices: A Review. Remote Sens. 2018, 10, 99. [Google Scholar] [CrossRef]
  3. Jirapond, M.; Nathaphon, B.; Siriwan, K.; Narongsak, L.; Apirat, W.; Pichetwut, N. IoT and agriculture data analysis for smart farm. Comput. Electron. Agric. 2019, 156, 467–474. [Google Scholar]
  4. Zhang, X.; Zhang, J.; Lin, L.; Zhang, Y.; Yang, G. Monitoring Citrus Soil Moisture and Nutrients Using an IoT Based System. Sensors 2017, 17, 447. [Google Scholar] [CrossRef] [PubMed]
  5. Da Costa, E.; De Oliveira, N.; Morais, F.; Carvalhaes-Dias, P.; Duarte, L.; Cabot, A.; Siqueira Dias, J. A Self-Powered and Autonomous Fringing Field Capacitive Sensor Integrated into a Micro Sprinkler Spinner to Measure Soil Water Content. Sensors 2017, 17, 575. [Google Scholar] [CrossRef] [PubMed]
  6. Yogesh, G.G.; Devendra, S.C.; Hitendra, C.C. A Review on Automated Irrigation System Using Wireless Sensor Network. Int. J. Adv. Res. Electron. Commun. Eng. 2016, 5, 1725–1731. [Google Scholar]
  7. Sumeet, S.; Sandhya, U.; Piyali, S.; Yatin, J. Arduino Based Automated Watering System. IJIRT 2015, 2, 419–420. [Google Scholar]
  8. Sumeet, S.B.; Manoj, A.M. IoT Based Automated Irrigation System. Int. J. Mod. Trends Eng. Res. 2015, 2, 1532–1538. [Google Scholar]
  9. Marie, F.L. Design of an Automated Irrigation System: Student Paper Competition; McGill University: Montreal, QC, Canada, 16 May 2005. [Google Scholar]
  10. Deweshvree, R.; Indurkar, P.R.; Khatri, D.M. Review Paper Based on Automatic Irrigation System Based on RF Module. IJAICT 2015, 1, 736–738. [Google Scholar]
  11. Raheela, S.; Muhammad, T.; Javed, F.; Muhammad, A.S. Internet of Things based Expert System for Smart Agriculture. Int. J. Adv. Comput. Sci. Appl. 2016, 7, 341–350. [Google Scholar]
  12. Gabriel, V.; Juan, F.D.P.; Daniel, H.; De La Iglesia, D.H.; Javier, B. Combining Multi-Agent Systems and Wireless Sensor Networks for Monitoring Crop Irrigation. Sensors 2017, 17, 1775. [Google Scholar]
  13. Prem, P.J.; Ali, Y.; Dimitrios, G.; Ahsan, M.; Arkady, Z. Internet of Things Platform for Smart Farming: Experiences and Lessons Learnt. Sensors 2016, 16, 1884. [Google Scholar]
  14. Chandan, K.S.; Pramitee, B. A Low-Cost Smart Irrigation Control System. In Proceedings of the International Conference on Electronics and Communication System, Coimbatore, India, 26–27 February 2015; pp. 1146–1152. [Google Scholar]
  15. Karthikeswari, M.; Mithraderi, P. Automated Irrigation System in Agriculture Using Wireless Sensor Technology. Int. J. Adv. Res. Electr. Electron. Instrum. Eng. 2014, 3, 13622–13627. [Google Scholar]
  16. Purnima, S.R.; Reddy, N. Design of a remote monitoring and control System with Automatic Irrigation System Using GSM Bluetooth. Int. J. Comput. Appl. 2012, 47, 6–13. [Google Scholar] [CrossRef][Green Version]
  17. Archana, P.; Priya, R. Design and implementation of automatic plant watering system. Int. J. Adv. Eng. Glob. Technol. 2016, 4, 1567–1570. [Google Scholar]
  18. Ferrarezi, R.S.; Dove, S.K.; Van Iersel, M.W. An automated system for monitoring soil moisture and controlling irrigation using low-cost open-source microcontrollers. HortTechnology 2015, 25, 110–118. [Google Scholar] [CrossRef]
  19. Bavel, C.H.V.; Bavel, M.G.V.; Lascano, R.J.; Camp, C.R. Automatic Irrigation Based on Monitoring Plant Transpiration. Available online: http://dynamax.com/images/uploads/papers/61_Automatic_Irrigation_Based.pdf (accessed on 3 January 2019).
  20. Rocha, N.O.; Teixeira, A.; Leão, R.; Moreira, L.; Galvão, L. Hyperspectral Remote Sensing for Detecting Soil Salinization Using ProSpecTIR-VS Aerial Imagery and Sensor Simulation. Remote Sens. 2017, 9, 42. [Google Scholar] [CrossRef]
  21. Durga, G.; Ifat, J.; Goutam, K. High Temperature AlGaN/GaN Membrane Based Pressure Sensors. Micromachine 2018, 9, 207. [Google Scholar]
  22. Abba, S.; Lee, J.A. An Autonomous Self-Aware and Adaptive Fault-Tolerant Routing Technique for Wireless Sensor Networks. Sensors 2015, 15, 20316–20354. [Google Scholar] [CrossRef] [PubMed]
  23. Kephart, J.O.; Chess, D.M. The Vision of Autonomic Computing. Computer 2003, 36, 41–50. [Google Scholar] [CrossRef]
  24. Arduino Integrated Design Environment. Available online: http://www.arduino.cc (accessed on 8 February 2018).
  25. Labcenter Electronics Ltd. Proteus Design Suite 8.5 Professional. Available online: http://www.labcenter.com (accessed on 10 February 2018).
  26. Abba, S.; Lee, J.A. FPGA-Based Design of an Intelligent On-Chip Sensor Network Monitoring and Control Using Dynamically Reconfigurable Autonomous Sensor Agents. Int. J. Distrib. Sens. Netw. 2016, 29, 4246596. [Google Scholar] [CrossRef]
  27. Understand Your Thing. The Open IoT Platform with Matlab Analytics. Available online: http://www.thingspeak.com (accessed on 6 February 2018).
  28. Sani, A.; Beauty, P.E. Smart Framework for Environmental Pollution Monitoring and Control System Using IoT-Based Technology. Sens. Transducers 2019, 229, 84–93. [Google Scholar]
  29. Bill, E. Calibrating Sensors, Adafruit Learning System. Available online: http://learn.adafruit.com/calibrating-sensors (accessed on 15 March 2018).
  30. Arduino Reference. Available online: https://www.arduino.cc/en/Reference/Map (accessed on 15 March 2018).
  31. Electronic Hub. Available online: https://www.electronicshub.org/interfacing-soil-moisture-sensor-with-arduino/ (accessed on 1 January 2019).
  32. Available online: https://en.wikipedia.org/wiki/Soil_moisture_sensor (accessed on 5 July 2019).
  33. Jim, B. Soil Water Status: Content and Potential; App. Note: 2S-I; Campbell Scientific, Inc.: Logan, UT, USA, 2001. [Google Scholar]
  34. Marek, B.; Piotr, B.; Anetta, D.; Piotr, M. Evaluation of Low-Cost Sensors for Ambient PM2.5 Monitoring. J. Sens. 2018, 2018, 5096540. [Google Scholar]
  35. ePro Labs. Available online: https://wiki.eprolabs.com/index.php?title=Moisture_Sensor (accessed on 5 July 2019).
  36. Available online: https://www.Amazon.com (accessed on 2 January 2019).

Article Metrics

Citations

Article Access Statistics

Multiple requests from the same IP address are counted as one view.