Higher HEI-2015 Score Is Associated with Reduced Risk of Depression: Result from NHANES 2005–2016


Abstract
1. Introduction
2. Materials and Methods
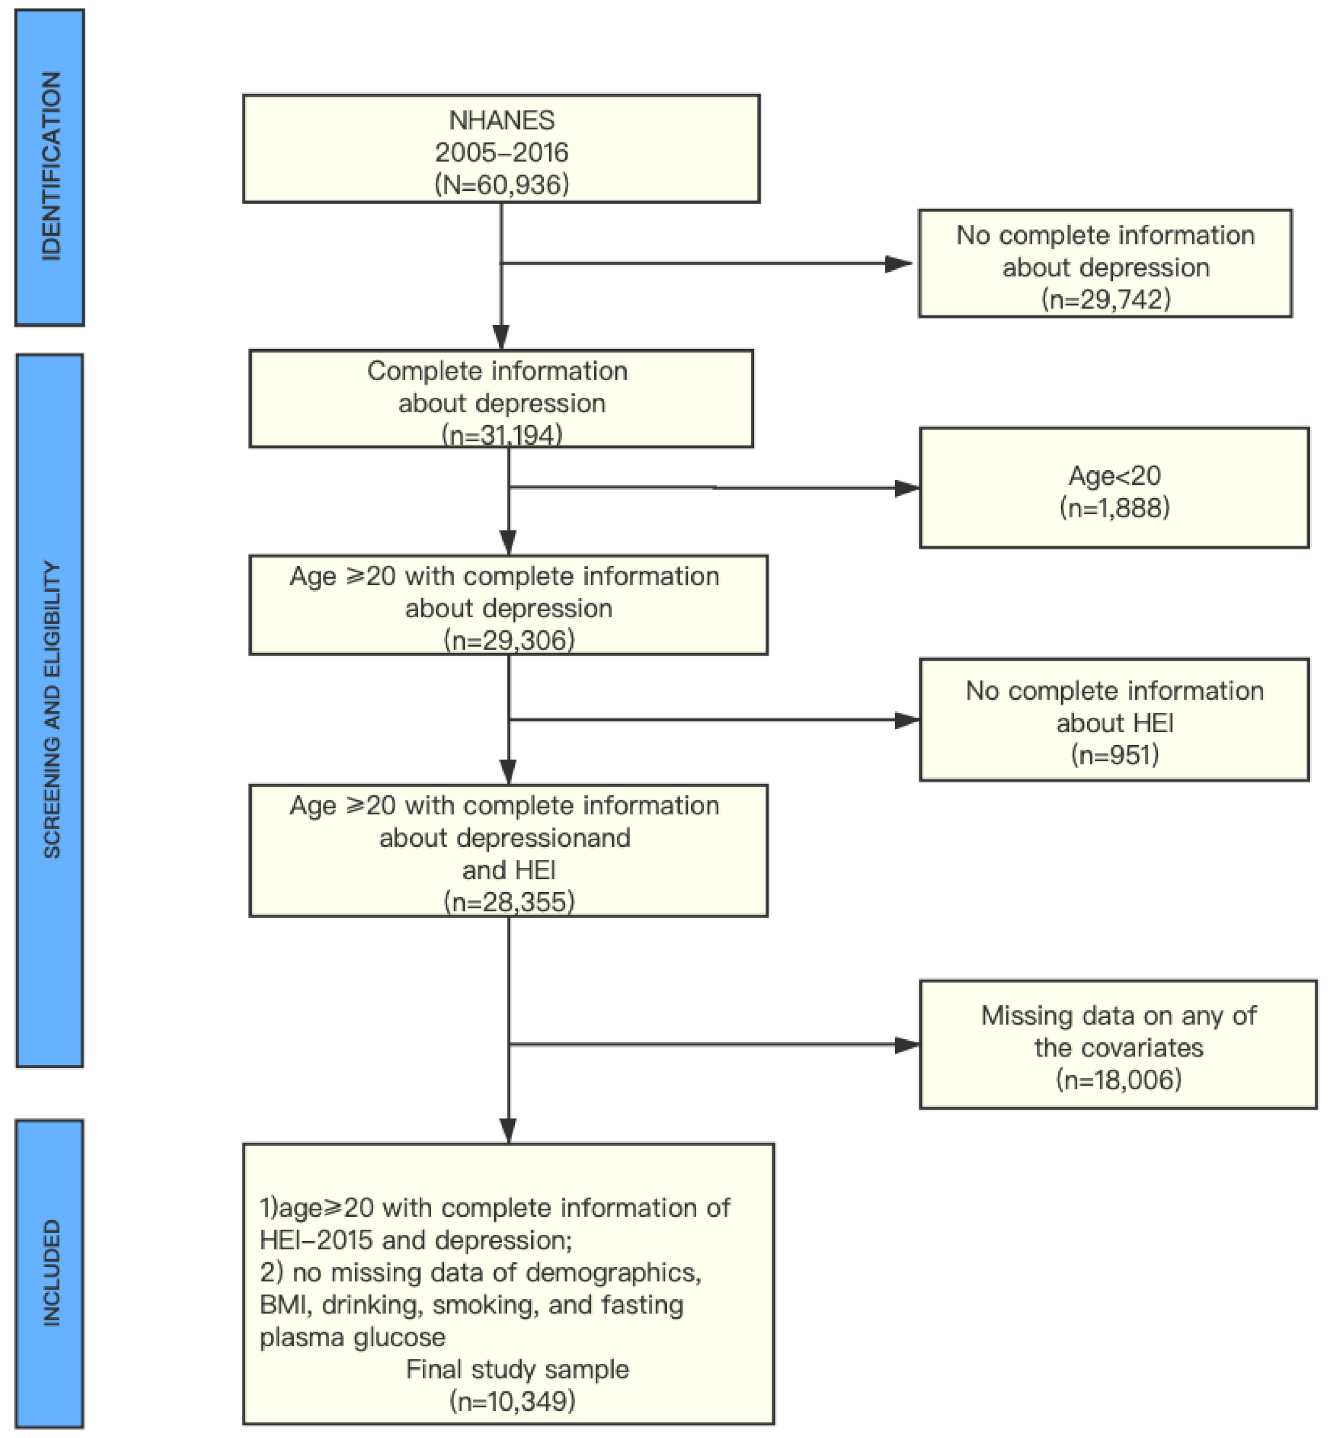
2.1. Sample
2.2. Measures
Covariates
2.3. Statistical Analysis
3. Results
4. Discussion
5. Conclusions
Author Contributions
Funding
Institutional Review Board Statement
Informed Consent Statement
Data Availability Statement
Conflicts of Interest
References
- Park, L.T.; Zarate, C.A., Jr. Depression in the Primary Care Setting. N. Engl. J. Med. 2019, 380, 559–568. [Google Scholar] [CrossRef] [PubMed]
- Anxiety and Depression Association of America. Available online: https://adaa.org/understanding-anxiety/depression#Types%20of%20Depression (accessed on 17 August 2020).
- World Health Organization. Available online: https://www.who.int/publications/i/item/depression-global-health-estimates (accessed on 19 July 2020).
- Carney, R.M.; Freedland, K.E. Depression and coronary heart disease. Nat. Rev. Cardiol. 2017, 14, 145–155. [Google Scholar] [CrossRef] [PubMed]
- Wang, S.; Mao, S.; Xiang, D.; Fang, C. Association between depression and the subsequent risk of Parkinson’s disease: A meta-analysis. Prog. Neuropsychopharmacol. Biol. Psychiatry 2018, 86, 186–192. [Google Scholar] [CrossRef]
- Hidese, S.; Asano, S.; Saito, K.; Sasayama, D.; Kunugi, H. Association of depression with body mass index classification, metabolic disease, and lifestyle: A web-based survey involving 11,876 Japanese people. J. Psychiatr. Res. 2018, 102, 23–28. [Google Scholar] [CrossRef] [PubMed]
- Byers, A.L.; Yaffe, K. Depression and risk of developing dementia. Nat. Rev. Neurol. 2011, 7, 323–331. [Google Scholar] [CrossRef]
- Nouwen, A.; Winkley, K.; Twisk, J.; Lloyd, C.E.; Peyrot, M.; Ismail, K.; Pouwer, F.; European Depression in Diabetes (EDID) Research Consortium. Type 2 diabetes mellitus as a risk factor for the onset of depression: A systematic review and meta-analysis. Diabetologia 2010, 53, 2480–2486. [Google Scholar] [CrossRef]
- Wakefield, C.E.; Butow, P.N.; Aaronson, N.A.; Hack, T.F.; Hulbert-Williams, N.J.; Jacobsen, P.B.; International Psycho-Oncology Society Research Committee. Patient-reported depression measures in cancer: A meta-review. Lancet Psychiatry 2015, 2, 635–647. [Google Scholar] [CrossRef]
- Rehm, J.; Shield, K.D. Global Burden of Disease and the Impact of Mental and Addictive Disorders. Curr. Psychiatry Rep. 2019, 21, 10. [Google Scholar] [CrossRef]
- Li, Z.; Wang, W.; Xin, X.; Song, X.; Zhang, D. Association of total zinc, iron, copper and selenium intakes with depression in the US adults. J. Affect. Disord. 2018, 228, 68–74. [Google Scholar] [CrossRef] [PubMed]
- Nakamura, M.; Miura, A.; Nagahata, T.; Shibata, Y.; Okada, E.; Ojima, T. Low Zinc, Copper, and Manganese Intake is Associated with Depression and Anxiety Symptoms in the Japanese Working Population: Findings from the Eating Habit and Well-Being Study. Nutrients 2019, 11, 847. [Google Scholar] [CrossRef]
- Sánchez-Villegas, A.; Álvarez-Pérez, J.; Toledo, E.; Salas-Salvadó, J.; Ortega-Azorín, C.; Zomeño, M.D.; Vioque, J.; Martínez, J.A.; Romaguera, D.; Pérez-López, J.; et al. Seafood Consumption, Omega-3 Fatty Acids Intake, and Life-Time Prevalence of Depression in the PREDIMED-Plus Trial. Nutrients 2018, 10, 2000. [Google Scholar] [CrossRef] [PubMed]
- Anglin, R.E.; Samaan, Z.; Walter, S.D.; McDonald, S.D. Vitamin D deficiency and depression in adults: Systematic review and meta-analysis. Br. J. Psychiatry 2013, 202, 100–107. [Google Scholar] [CrossRef] [PubMed]
- Perez-Cornago, A.; Sanchez-Villegas, A.; Bes-Rastrollo, M.; Gea, A.; Molero, P.; Lahortiga-Ramos, F.; Martinez-Gonzalez, M.Á. Relationship between adherence to Dietary Approaches to Stop Hypertension (DASH) diet indices and incidence of depression during up to 8 years of follow-up. Public Health Nutr. 2017, 20, 2383–2392. [Google Scholar] [CrossRef] [PubMed]
- Cherian, L.; Wang, Y.; Holland, T.; Agarwal, P.; Aggarwal, N.; Morris, M.C. DASH and Mediterranean-Dash Intervention for Neurodegenerative Delay (MIND) Diets are Associated with Fewer Depressive Symptoms Over Time. J. Gerontol. A Biol. Sci. Med. Sci. 2020. [Google Scholar] [CrossRef]
- Fresán, U.; Bes-Rastrollo, M.; Segovia-Siapco, G.; Sanchez-Villegas, A.; Lahortiga, F.; de la Rosa, P.A.; Martínez-Gonzalez, M.A. Does the MIND diet decrease depression risk? A comparison with Mediterranean diet in the SUN cohort. Eur. J. Nutr. 2019, 58, 1271–1282. [Google Scholar] [CrossRef]
- National Health and Nutrition Examination Survey. Available online: https://www.cdc.gov/nchs/nhanes/about_nhanes.htm (accessed on 15 June 2020).
- Nutrition and Your Health: 2015–2020 Dietary Guidelines for Americans, 8th ed.; US Government Printing Office: Washington, DC, USA, 2015. Available online: https://health.gov/our-work/food-nutrition/previous-dietary-guidelines/2015 (accessed on 20 May 2020).
- Krebs-Smith, S.M.; Pannucci, T.E.; Subar, A.F.; Kirkpatrick, S.I.; Lerman, J.L.; Tooze, J.A.; Wilson, M.M.; Reedy, J.; Reedy, J. Update of the Healthy Eating Index: HEI-2015. J. Am. Acad. Nutr. Diet. 2018, 118, 1591–1602. [Google Scholar] [CrossRef]
- Cruz, N.; Shabaneh, O.; Appiah, D. The Association of Ideal Cardiovascular Health and Ocular Diseases among U.S Adults. Am. J. Med. 2020. [Google Scholar] [CrossRef]
- Kroenke, K.; Spitzer, R.L.; Williams, J.B. The PHQ-9: Validity of a brief depression severity measure. J. Gen. Intern. Med. 2001, 16, 606–613. [Google Scholar] [CrossRef]
- Tsai, J.; Homa, D.M.; Gentzke, A.S.; Mahoney, M.; Sharapova, S.R.; Sosnoff, C.S.; Caron, K.T.; Wang, L.; Melstrom, P.C.; Trivers, K.F. Exposure to Secondhand Smoke Among Nonsmokers—United States, 1988–2014. MMWR Morb. Mortal. Wkly. Rep. 2018, 67, 1342–1346. [Google Scholar] [CrossRef]
- Scholes, S.; Bann, D. Education-related disparities in reported physical activity during leisure-time, active transportation, and work among US adults: Repeated cross-sectional analysis from the National Health and Nutrition Examination Surveys, 2007 to 2016. BMC Public Health 2018, 18, 926. [Google Scholar] [CrossRef]
- Montgomery, J.; Lu, J.; Ratliff, S.; Mezuk, B. Food Insecurity and Depression among Adults with Diabetes: Results from the National Health and Nutrition Examination Survey (NHANES). Diabetes Educ. 2017, 43, 260–271. [Google Scholar] [CrossRef] [PubMed]
- Dreimüller, N.; Lieb, K.; Tadić, A.; Engelmann, J.; Wollschläger, D.; Wagner, S. Body mass index (BMI) in major depressive disorder and its effects on depressive symptomatology and antidepressant response. J. Affect. Disord. 2019, 256, 524–531. [Google Scholar] [CrossRef] [PubMed]
- ALHarthi, S.S.Y.; Natto, Z.S.; Midle, J.B.; Gyurko, R.; O’Neill, R.; Steffensen, B. Association between time since quitting smoking and periodontitis in former smokers in the National Health and Nutrition Examination Surveys (NHANES) 2009 to 2012. J. Periodontol. 2019, 90, 16–25. [Google Scholar] [CrossRef] [PubMed]
- Gay Isabel, C.; Tran Duong, T.; Paquette David, W. Alcohol intake and periodontitis in adults aged ≥30 years: NHANES 2009–2012. J. Periodontol. 2018, 89, 625–634. [Google Scholar]
- Caspard, H.; Jabbour, S.; Hammar, N.; Fenici, P.; Sheehan, J.J.; Kosiborod, M. Recent trends in the prevalence of type 2 diabetes and the association with abdominal obesity lead to growing health disparities in the USA: An analysis of the NHANES surveys from 1999 to 2014. Diabetes Obes. Metab. 2018, 20, 667–671. [Google Scholar] [CrossRef] [PubMed]
- Rao, J.N.K.; Scott, A.J. On Simple Adjustments to Chi-Square Tests with Sample Survey Data. Ann. Stat. 1987, 15, 385–397. [Google Scholar] [CrossRef]
- Salk, R.H.; Hyde, J.S.; Abramson, L.Y. Gender differences in depression in representative national samples: Meta-analyses of diagnoses and symptoms. Psychol. Bull. 2017, 143, 783–822. [Google Scholar] [CrossRef]
- Culbertson, F.M. Depression and gender. An international review. Am. Psychol. 1997, 52, 25–31. [Google Scholar] [CrossRef]
- Fletcher, J.M. Adolescent depression and educational attainment: Results using sibling fixed effects. Health Econ. 2010, 19, 855–871. [Google Scholar] [CrossRef]
- Korhonen, K.; Remes, H.; Martikainen, P. Education as a social pathway from parental socioeconomic position to depression in late adolescence and early adulthood: A Finnish population-based register study. Soc. Psychiatry Psychiatr. Epidemiol. 2017, 52, 105–116. [Google Scholar] [CrossRef]
- Freeman, A.; Tyrovolas, S.; Koyanagi, A.; Chatterji, S.; Leonardi, M.; Ayuso-Mateos, J.L.; Tobiasz-Adamczyk, B.; Koskinen, S.; Rummel-Kluge, C.; Haro, J.M. The role of socio-economic status in depression: Results from the COURAGE (aging survey in Europe). BMC Public Health 2016, 16, 1098. [Google Scholar] [CrossRef] [PubMed]
- Çakıcı, M.; Gökçe, Ö.; Babayiğit, A.; Çakıcı, E.; Eş, A. Depression: Point-prevalence and risk factors in a North Cyprus household adult cross-sectional study. BMC Psychiatry 2017, 17, 387. [Google Scholar] [CrossRef] [PubMed]
- Gero, K.; Kondo, K.; Kondo, N.; Shirai, K.; Kawachi, I. Associations of relative deprivation and income rank with depressive symptoms among older adults in Japan. Soc. Sci. Med. 2017, 189, 138–144. [Google Scholar] [CrossRef] [PubMed]
- Fukuda, Y.; Hiyoshi, A. Influences of income and employment on psychological distress and depression treatment in Japanese adults. Environ. Health Prev. Med. 2012, 17, 10–17. [Google Scholar] [CrossRef]
- Tomita, A.; Manuel, J.I. Evidence on the Association Between Cigarette Smoking and Incident Depression from the South African National Income Dynamics Study 2008–2015: Mental Health Implications for a Resource-Limited Setting. Nicotine Tob. Res. 2020, 22, 118–123. [Google Scholar] [CrossRef]
- Luger, T.M.; Suls, J.; Vander Weg, M.W. How robust is the association between smoking and depression in adults? A meta-analysis using linear mixed-effects models. Addict. Behav. 2014, 39, 1418–1429. [Google Scholar] [CrossRef]
- Tjora, T.; Hetland, J.; Aarø, L.E.; Wold, B.; Wiium, N.; Øverland, S. The association between smoking and depression from adolescence to adulthood. Addiction 2014, 109, 1022–1030. [Google Scholar] [CrossRef]
- Shafer, K.; Pace, G.T. Gender differences in depression across parental roles. Soc. Work 2015, 60, 115–125. [Google Scholar] [CrossRef]
- Ul-Haq, Z.; Mackay, D.F.; Fenwick, E.; Pell, J.P. Association between body mass index and mental health among Scottish adult population: A cross-sectional study of 37,272 participants. Psychol. Med. 2014, 44, 2231–2240. [Google Scholar] [CrossRef]
- Bagnardi, V.; Rota, M.; Botteri, E.; Tramacere, I.; Islami, F.; Fedirko, V.; Scotti, L.; Jenab, M.; Turati, F.; Pasquali, E.; et al. Light alcohol drinking and cancer: A meta-analysis. Ann. Oncol. 2013, 24, 301–308. [Google Scholar] [CrossRef]
- Xu, W.; Wang, H.; Wan, Y.; Tan, C.; Li, J.; Tan, L.; Yu, J.T. Alcohol consumption and dementia risk: A dose-response meta-analysis of prospective studies. Eur. J. Epidemiol. 2017, 32, 31–42. [Google Scholar] [CrossRef] [PubMed]
- Larsson, S.C.; Wallin, A.; Wolk, A. Alcohol consumption and risk of heart failure: Meta-analysis of 13 prospective studies. Clin. Nutr. 2018, 37, 1247–1251. [Google Scholar] [CrossRef] [PubMed]
- Larsson, S.C.; Wallin, A.; Wolk, A.; Markus, H.S. Differing association of alcohol consumption with different stroke types: A systematic review and meta-analysis. BMC Med. 2016, 14, 178. [Google Scholar] [CrossRef] [PubMed]
- Knott, C.; Bell, S.; Britton, A. Alcohol Consumption and the Risk of Type 2 Diabetes: A Systematic Review and Dose-Response Meta-analysis of More Than 1.9 Million Individuals from 38 Observational Studies. Diabetes Care 2015, 38, 1804–1812. [Google Scholar] [CrossRef] [PubMed]
- Xi, B.; Veeranki, S.P.; Zhao, M.; Ma, C.; Yan, Y.; Mi, J. Relationship of Alcohol Consumption to All-Cause, Cardiovascular, and Cancer-Related Mortality in U.S. Adults. J. Am. Coll. Cardiol. 2017, 70, 913–922, Erratum in: J. Am. Coll. Cardiol. 2017, 70, 1542. [Google Scholar] [CrossRef] [PubMed]
- Alati, R.; Lawlor, D.A.; Najman, J.M.; Williams, G.M.; Bor, W.; O’Callaghan, M. Is there really a ‘J-shaped’ curve in the association between alcohol consumption and symptoms of depression and anxiety? Findings from the Mater-University Study of Pregnancy and its outcomes. Addiction 2005, 100, 643–651. [Google Scholar] [CrossRef]
- Korczak, D.J.; Madigan, S.; Colasanto, M. Children’s Physical Activity and Depression: A Meta-analysis. Pediatrics 2017, 139, e20162266. [Google Scholar] [CrossRef]
- Kandola, A.; Ashdown-Franks, G.; Hendrikse, J.; Sabiston, C.M.; Stubbs, B. Physical activity and depression: Towards understanding the antidepressant mechanisms of physical activity. Neurosci. Biobehav. Rev. 2019, 107, 525–539. [Google Scholar] [CrossRef]
- Choi, K.W.; Chen, C.Y.; Stein, M.B.; Klimentidis, Y.C.; Wang, M.J.; Koenen, K.C.; Smoller, J.W.; Major Depressive Disorder Working Group of the Psychiatric Genomics Consortium. Assessment of Bidirectional Relationships between Physical Activity and Depression among Adults: A 2-Sample Mendelian Randomization Study. JAMA Psychiatry 2019, 76, 399–408. [Google Scholar] [CrossRef]
- Kvam, S.; Kleppe, C.L.; Nordhus, I.H.; Hovland, A. Exercise as a treatment for depression: A meta-analysis. J. Affect. Disord. 2016, 202, 67–86. [Google Scholar] [CrossRef]
- Ley, S.H.; Hamdy, O.; Mohan, V.; Hu, F.B. Prevention and management of type 2 diabetes: Dietary components and nutritional strategies. Lancet 2014, 383, 1999–2007. [Google Scholar] [CrossRef]
- Ley, S.H.; Pan, A.; Li, Y.; Manson, J.E.; Willett, W.C.; Sun, Q.; Hu, F.B. Changes in Overall Diet Quality and Subsequent Type 2 Diabetes Risk: Three U.S. Prospective Cohorts. Diabetes Care 2016, 39, 2011–2018. [Google Scholar] [CrossRef] [PubMed]
- Anderson, R.J.; Freedland, K.E.; Clouse, R.E.; Lustman, P.J. The prevalence of comorbid depression in adults with diabetes: A meta-analysis. Diabetes Care 2001, 24, 1069–1078. [Google Scholar] [CrossRef] [PubMed]


| Characteristics | 2005–2006 (n = 1595) | 2007–2008 (n = 1839) | 2009–2010 (n = 1913) | 2011–2012 (n = 1619) | 2013–2014 (n = 1778) | 2015–2016 (n = 1605) | p Trend |
|---|---|---|---|---|---|---|---|
| No. with depressive symptoms | 84 | 157 | 166 | 131 | 159 | 139 | |
| The prevalence of depression (Weighted %) | 4.8 | 6.8 | 7.0 | 7.4 | 8.0 | 7.4 | <0.001 |
| Sex (No. Weighted %) | <0.001 | ||||||
| Male | 856 (51.2) | 993 (52.7) | 983 (51.4) | 891 (52.0) | 710 (50.7) | 856 (50.6) | |
| Female | 739 (48.8) | 846 (47.3) | 930 (48.7) | 728 (48.0) | 868 (49.3) | 749 (49.4) | |
| Age group (No. Weighted %) | <0.001 | ||||||
| 20–24 y | 151 (8.9) | 136 (9.1) | 175 (9.3) | 171 (9.6) | 143 (9.5) | 115 (7.2) | |
| 25–49 y | 746 (51.5) | 775 (51.0) | 809 (47.6) | 709 (46.3) | 764 (45.4) | 670 (44.8) | |
| 50+ y | 698 (39.6) | 928 (39.9) | 929 (43.1) | 739 (44.1) | 871 (45.0) | 820 (45.8) | |
| Race (No. Weighted %) | <0.001 | ||||||
| Non-Hispanic White | 865 (75.2) | 932 (72.6) | 1023 (73.9) | 728 (71.9) | 868 (70.2) | 646 (68.7) | |
| Non-Hispanic Black | 334 (9.7) | 364 (10.4) | 298 (9.8) | 366 (10.1) | 339 (10.7) | 321 (10.1) | |
| Mexican American | 281 (7.2) | 304 (8.0) | 331 (7.3) | 159 (6.6) | 224 (8.3) | 240 (7.1) | |
| Other races | 115 (7.9) | 239 (9.0) | 261 (9.0) | 366 (11.4) | 347 (10.8) | 398 (14.1) | |
| Education level (No. Weighted %) | <0.001 | ||||||
| <High school | 373 (14.8) | 509 (17.5) | 475 (16.2) | 323 (14.0) | 345 (14.2) | 306 (11.9) | |
| High school/GED | 400 (26.2) | 453 (23.8) | 434 (22.7) | 340 (18.7) | 384 (20.1) | 374 (22.3) | |
| Some college/AA degree | 483 (32.8) | 478 (29.4) | 567 (30.6) | 500 (33.1) | 557 (33.2) | 506 (32.6) | |
| College or more | 339 (26.1) | 399 (29.4) | 437 (31.4) | 456 (34.2) | 492 (32.5) | 419 (33.1) | |
| Household income (No. Weighted %) | <0.001 | ||||||
| 0–130% FPL | 352 (13.3) | 503 (17.3) | 598 (20.5) | 540 (21.8) | 574 (23.1) | 463 (18.2) | |
| >130–350% FPL | 652 (39.1) | 718 (33.6) | 711 (36.0) | 576 (36.6) | 610 (34.3) | 665 (37.9) | |
| >350% FPL | 591 (47.6) | 618 (49.1) | 604 (43.4) | 503 (41.9) | 594 (42.6) | 477 (43.3) | |
| BMI status (No. Weighted %) | <0.001 | ||||||
| Normal or low weight | 479 (32.0) | 538 (31.6) | 540 (31.0) | 503 (31.2) | 535 (30.0) | 422 (26.1) | |
| Overweight | 537 (31.9) | 653 (36.1) | 665 (34.0) | 528 (33.6) | 589 (33.2) | 534 (32.5) | |
| Obese | 579 (36.2) | 648 (32.3) | 708 (34.9) | 588 (35.2) | 654 (36.9) | 649 (41.4) | |
| Smoking status (No. Weighted %) | <0.001 | ||||||
| Never | 721 (44.6) | 863 (50.1) | 950 (51.4) | 853 (54.1) | 911 (53.2) | 767 (48.1) | |
| Former | 482 (28.5) | 528 (26.7) | 531 (28.0) | 413 (25.5) | 481 (26.8) | 469 (31.1) | |
| Current | 392 (27.2) | 448 (23.1) | 432 (20.6) | 353 (20.5) | 386 (20.0) | 369 (20.8) | |
| Drinking status (No, Weighted %) | <0.001 | ||||||
| None | 394 (19.0) | 434 (18.5) | 385 (16.1) | 315 (15.3) | 362 (15.6) | 307 (15.7) | |
| Light | 516 (33.4) | 620 (33.9) | 682 (34.0) | 591 (34.9) | 656 (36.5) | 606 (36.0) | |
| Moderate | 457 (30.7) | 514 (32.1) | 546 (33.3) | 453 (31.2) | 522 (33.3) | 483 (34.3) | |
| Heavy | 228 (16.8) | 271 (15.5) | 300 (16.7) | 238 (18.6) | 238 (14.6) | 209 (13.9) | |
| Diabetes (No. Weighted %) | <0.001 | ||||||
| No | 1448 (93.0) | 1617 (92.6) | 1707 (92.3) | 1445 (92.5) | 1570 (90.2) | 1370 (88.7) | |
| Yes | 147 (7.0) | 222 (7.4) | 206 (7.7) | 174 (7.5) | 208 (9.8) | 235 (11.3) | |
| HEI status (No. Weighted %) | <0.001 | ||||||
| Inadequate | 889 (57.2) | 959 (55.2) | 958 (49.3) | 825 (49.7) | 895 (50.9) | 758 (47.3) | |
| Average | 594 (36.4) | 751 (38.6) | 789 (41.3) | 652 (39.8) | 704 (40.1) | 720 (45.1) | |
| Optimal | 112 (6.4) | 129 (6.1) | 166 (9.4) | 142 (10.5) | 179 (9.1) | 127 (7.5) |
| Characteristics | Adults without Depression | Adults with Depression | p-Value |
|---|---|---|---|
| No. (Weighted %) | 9513 (93.1) | 836 (6.9) | |
| Sex | <0.001 | ||
| Male | 5159 (52.4) | 330 (38.1) | |
| Female | 4354 (47.6) | 506 (61.9) | |
| Age group | <0.001 | ||
| 20–24 y | 4129 (9.5) | 326 (7.4) | |
| 25–49 y | 3212 (47.9) | 368 (45.6) | |
| 50+ y | 2172 (42.6) | 142 (47.1) | |
| Race | <0.001 | ||
| Non-Hispanic White | 4654 (72.3) | 408 (69.1) | |
| Non-Hispanic Black | 1846 (9.9) | 176 (13.5) | |
| Mexican American | 1430 (7.5) | 109 (6.2) | |
| Other races | 1583 (10.3) | 143 (11.2) | |
| Education level | <0.001 | ||
| <High school | 2052 (14.0) | 279 (24.9) | |
| High school/GED | 2176 (21.8) | 209 (26.3) | |
| Some college/AA degree | 2841 (31.8) | 250 (34.4) | |
| College or more | 2444 (32.4) | 98 (14.5) | |
| Household income | <0.001 | ||
| 0–130% FPL | 2574 (17.4) | 456 (42.3) | |
| >130–350% FPL | 3667 (36.2) | 265 (35.7) | |
| >350% FPL | 3272 (46.4) | 115 (22.0) | |
| BMI status | <0.001 | ||
| Normal or low weight | 2795 (30.4) | 222 (28.7) | |
| Overweight | 3293 (34.2) | 213 (24.8) | |
| Obese | 3425 (35.4) | 401 (46.5) | |
| Smoking status | <0.001 | ||
| Never | 4787 (51.6) | 278 (31.8) | |
| Former | 2695 (28.0) | 209 (24.3) | |
| Current | 2031 (20.3) | 349 (44.0) | |
| Drinking status | <0.001 | ||
| None | 1979 (16.2) | 218 (23.0) | |
| Light | 3336 (34.6) | 335 (37.9) | |
| Moderate | 2833 (33.4) | 142 (20.6) | |
| Heavy | 1365 (15.8) | 141 (18.5) | |
| Diabetes | <0.001 | ||
| No | 8463 (92.0) | 694 (85.6) | |
| YES | 1050 (8.0) | 142 (14.4) | |
| HEI status | <0.001 | ||
| Inadequate | 4783 (50.8) | 501 (62.4) | |
| Average | 3908 (40.7) | 302 (34.3) | |
| Optimal | 822 (8.5) | 33 (3.2) |
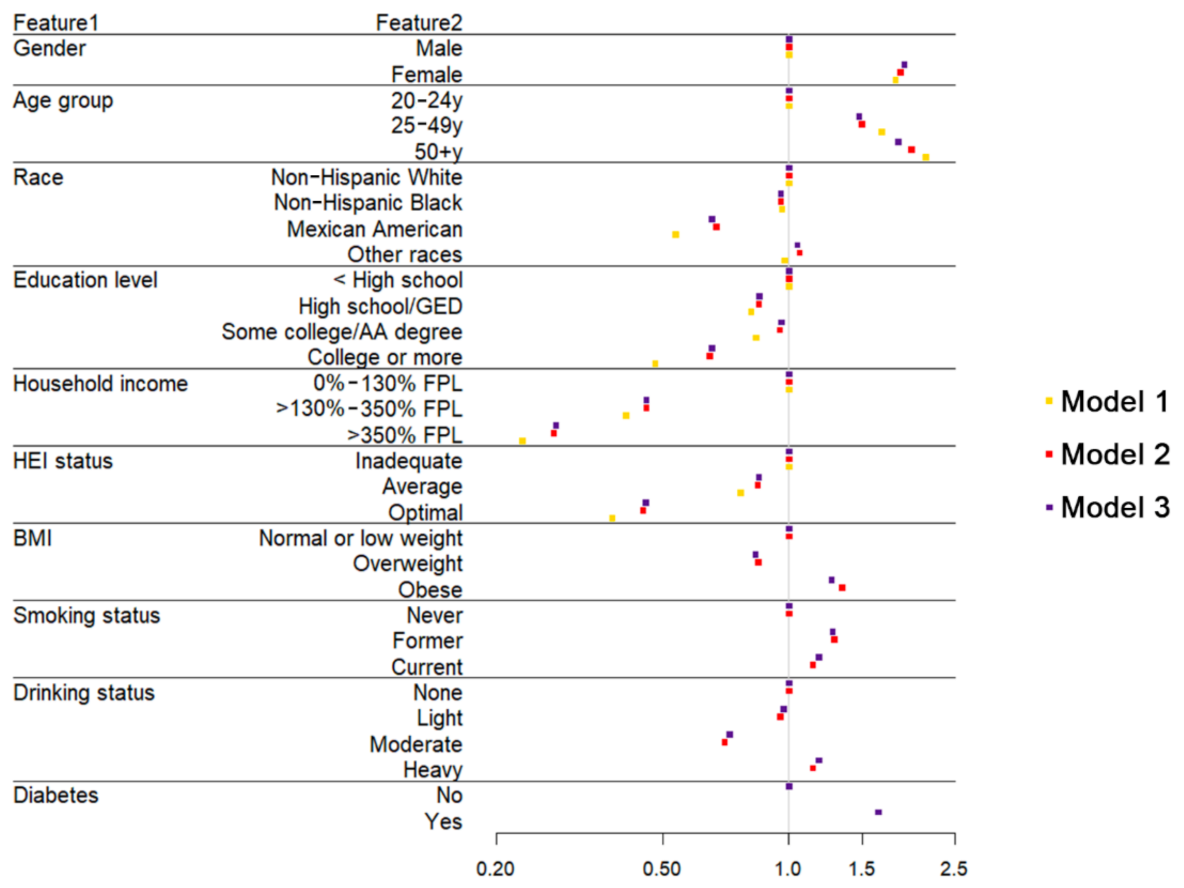
| Variable | OR (95% CI) | ||
|---|---|---|---|
| Model 1 | Model 2 | Model 3 | |
| Sex (reference, Male) | |||
| Female | 1.799 (1.787, 1.791) | 1.850 (1.847, 1.852) | 1.889 (1.887, 1.892) |
| Age group (reference, 20–24 y) | |||
| 25–49 y | 1.669 (1.665, 1.673) | 1.495 (1.491, 1.499) | 1.472 (1.468, 1.476) |
| 50+ y | 2.128 (2.123, 2.133) | 1.968 (1.963, 1.973) | 1.827 (1.822, 1.832) |
| Race (reference, Non-Hispanic White) | |||
| Non-Hispanic Black | 0.963 (0.961, 0.965) | 0.958 (0.956, 0.960) | 0.958 (0.956, 0.960) |
| Mexican American | 0.535 (0.534, 0.537) | 0.670 (0.668, 0.672) | 0.656 (0.655, 0.658) |
| Other races | 0.976 (0.974, 0.978) | 1.062 (1.060, 1.064) | 1.048 (1.046, 1.050) |
| Education level (reference, <High school) | |||
| High school/GED | 0.812 (0.810, 0.813) | 0.848 (0.846, 0.849) | 0.852 (0.850, 0.853) |
| Some college/AA degree | 0.835 (0.833, 0.836) | 0.952 (0.950, 0.953) | 0.962 (0.961, 0.964) |
| College or more | 0.479 (0.478, 0.480) | 0.647 (0.646, 0.649) | 0.655 (0.653, 0.656) |
| Household income (reference, 0–130% FPL) | |||
| >130–350% FPL | 0.407 (0.406, 0.407) | 0.456 (0.456, 0.457) | 0.456 (0.455, 0.457) |
| >350% FPL | 0.230 (0.230, 0.231) | 0.274 (0.273, 0.274) | 0.277 (0.276, 0.277) |
| HEI status (reference, Inadequate) | |||
| Average | 0.766 (0.765, 0.767) | 0.842 (0.841, 0.843) | 0.848 (0.846, 0.849) |
| Optimal | 0.378 (0.377, 0.379) | 0.448 (0.447, 0.450) | 0.455 (0.453, 0.456) |
| BMI (reference, Normal or low weight) | |||
| Overweight | 0.844 (0.843, 0.846) | 0.833 (0.832, 0.835) | |
| Obese | 1.341 (1.339, 1.343) | 1.265 (1.263, 1.267) | |
| Smoking status (reference, Never) | |||
| Former | 1.286 (1.284, 1.288) | 1.274 (1.272, 1.276) | |
| Current | 2.546 (2.542, 2.550) | 2.564 (2.560, 2.568) | |
| Drinking status (reference, None) | |||
| Light | 0.955 (0.954, 0.957) | 0.971 (0.969, 0.973) | |
| Moderate | 0.702 (0.701, 0.703) | 0.722 (0.720, 0.723) | |
| Heavy | 1.141 (1.139, 1.144) | 1.181 (1.179, 1.184) | |
| Diabetes (reference, No) | |||
| YES | 1.637 (1.634, 1.640) | ||
Publisher’s Note: MDPI stays neutral with regard to jurisdictional claims in published maps and institutional affiliations. |
© 2021 by the authors. Licensee MDPI, Basel, Switzerland. This article is an open access article distributed under the terms and conditions of the Creative Commons Attribution (CC BY) license (http://creativecommons.org/licenses/by/4.0/).
Share and Cite
Wang, K.; Zhao, Y.; Nie, J.; Xu, H.; Yu, C.; Wang, S. Higher HEI-2015 Score Is Associated with Reduced Risk of Depression: Result from NHANES 2005–2016. Nutrients 2021, 13, 348. https://doi.org/10.3390/nu13020348
Wang K, Zhao Y, Nie J, Xu H, Yu C, Wang S. Higher HEI-2015 Score Is Associated with Reduced Risk of Depression: Result from NHANES 2005–2016. Nutrients. 2021; 13(2):348. https://doi.org/10.3390/nu13020348
Chicago/Turabian StyleWang, Kai, Yudi Zhao, Jiaqi Nie, Haoling Xu, Chuanhua Yu, and Suqing Wang. 2021. "Higher HEI-2015 Score Is Associated with Reduced Risk of Depression: Result from NHANES 2005–2016" Nutrients 13, no. 2: 348. https://doi.org/10.3390/nu13020348
APA StyleWang, K., Zhao, Y., Nie, J., Xu, H., Yu, C., & Wang, S. (2021). Higher HEI-2015 Score Is Associated with Reduced Risk of Depression: Result from NHANES 2005–2016. Nutrients, 13(2), 348. https://doi.org/10.3390/nu13020348