
Pharmacokinetics and Tissue Distribution of Itampolin A following Intragastric and Intravenous Administration in Rats Using Ultra-High-Performance Liquid Chromatography–Tandem Mass Spectrometry


Abstract
1. Introduction
2. Results and Discussion
2.1. Method Optimization
2.1.1. Optimization of Extraction Method
2.1.2. Optimization of UHPLC-MS/MS Conditions
2.2. Method Validation
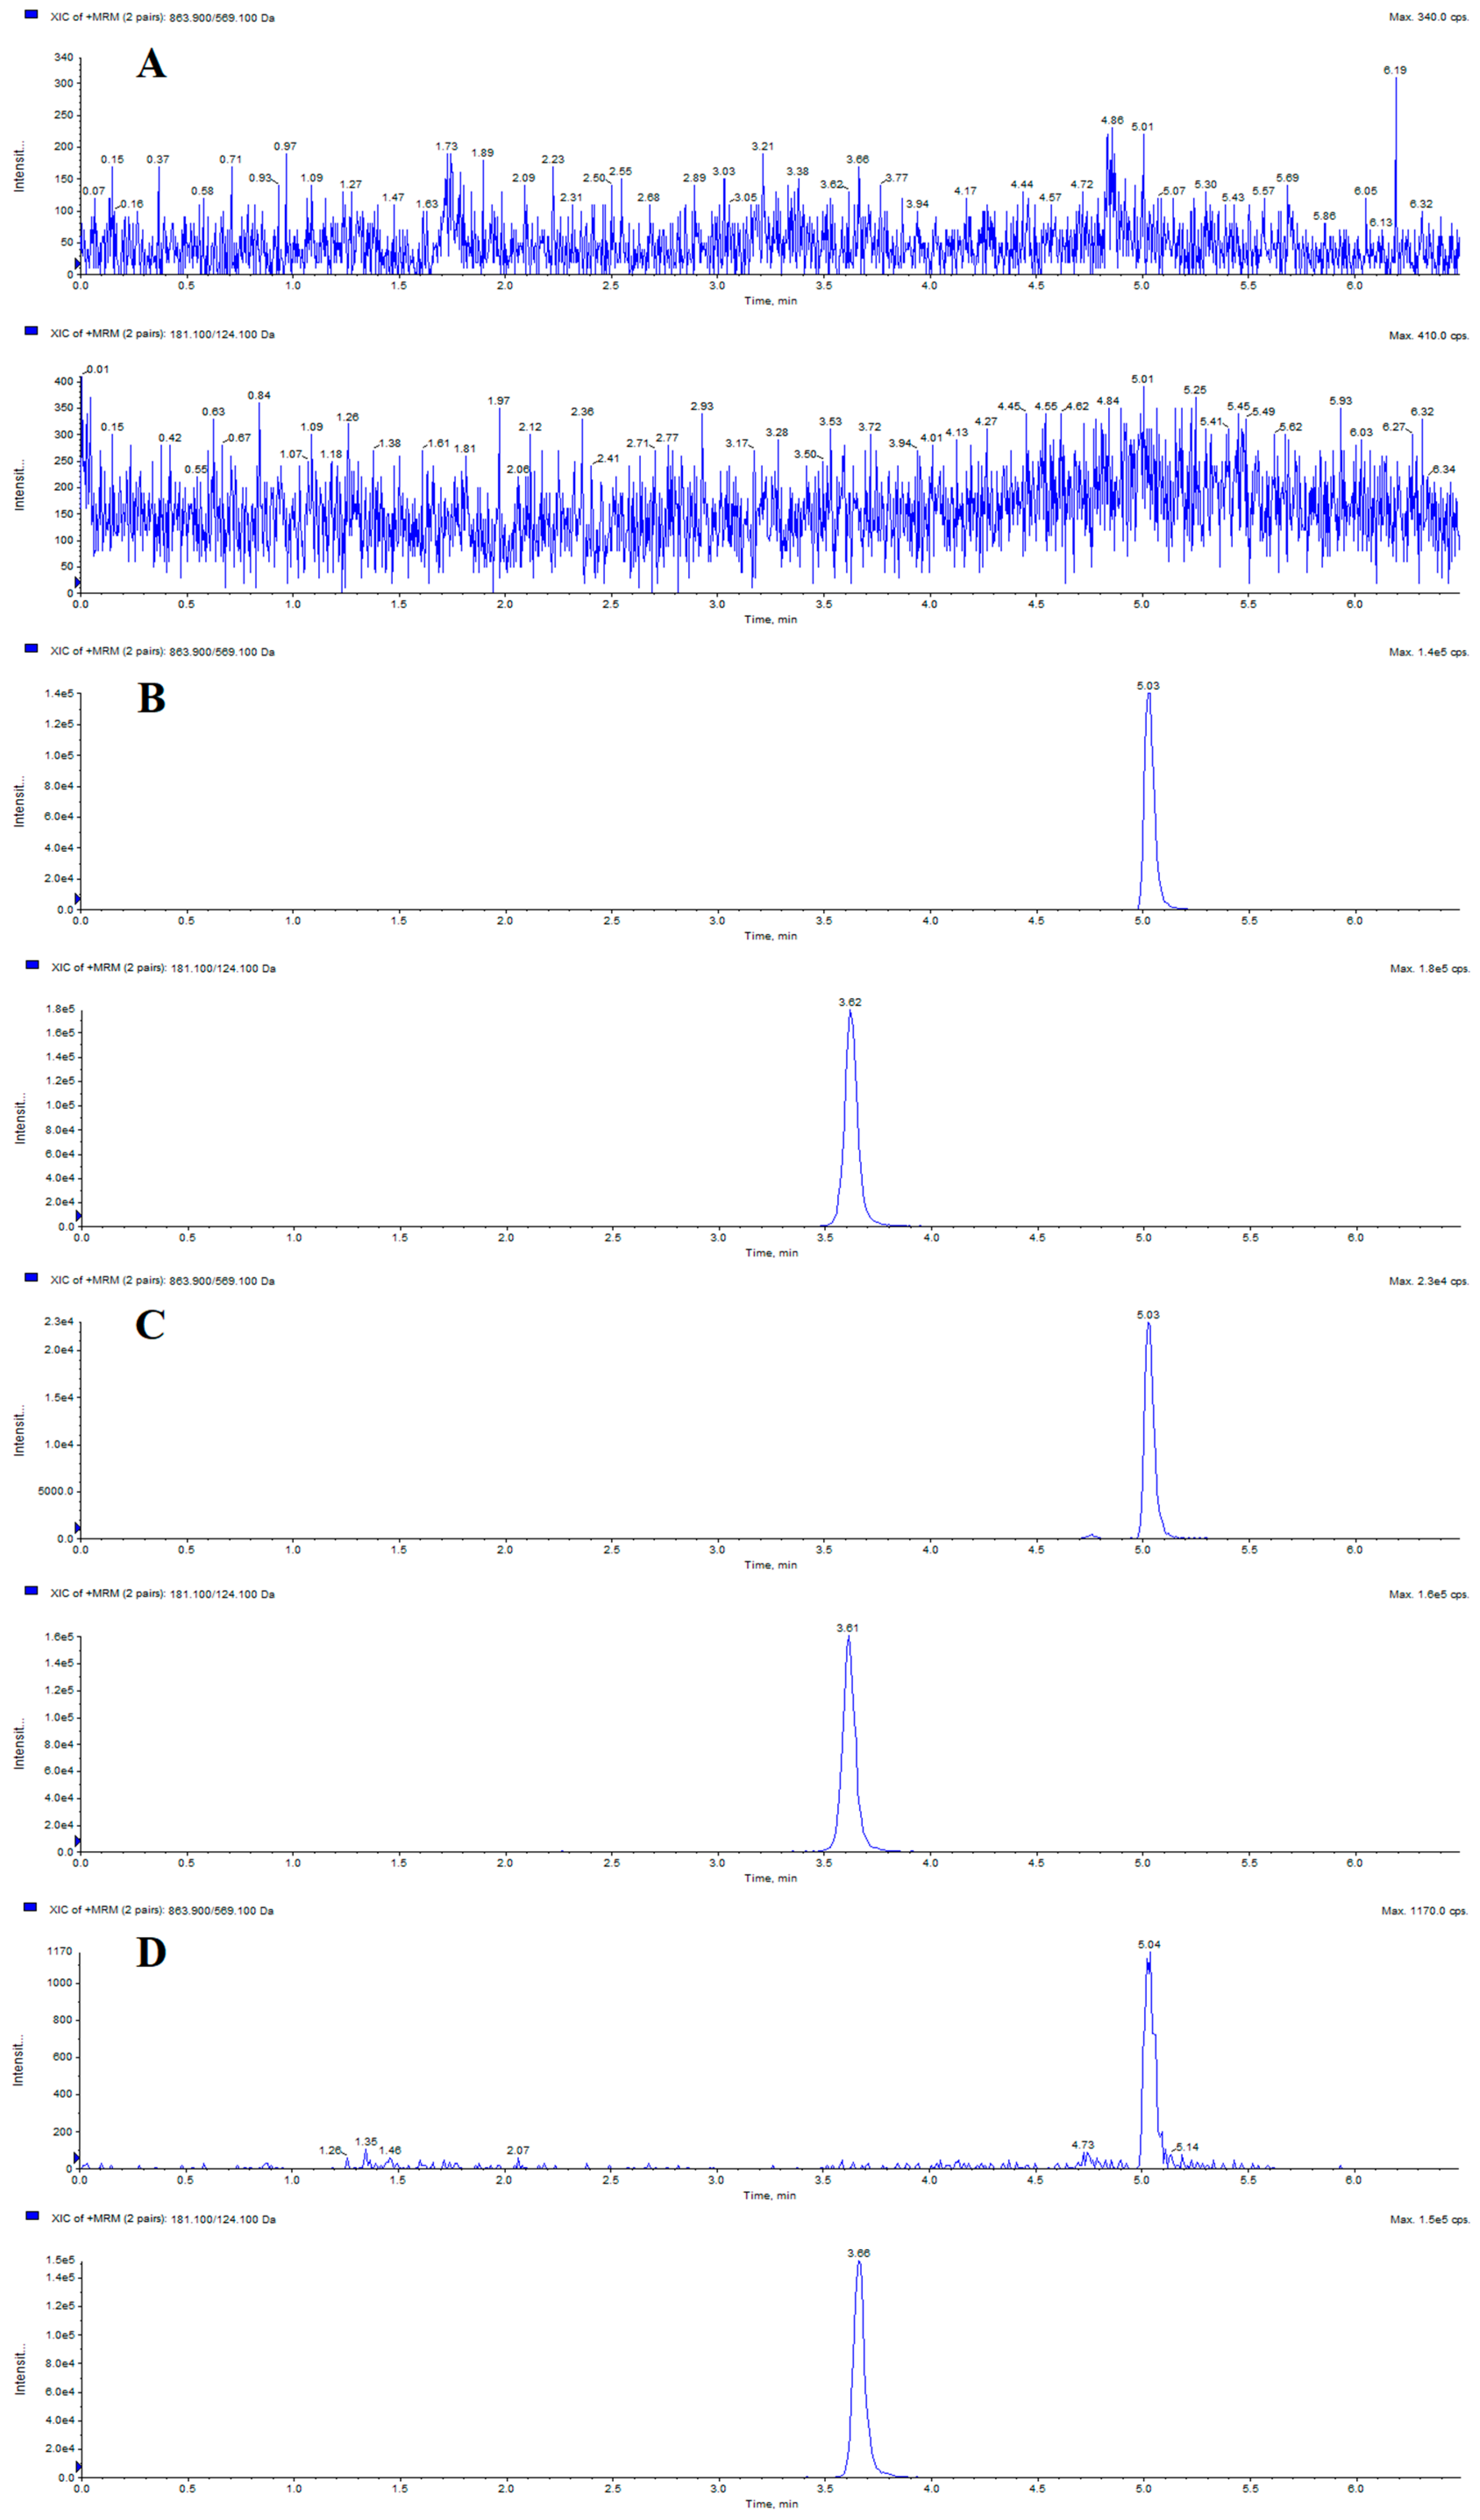
2.2.1. Specificity
2.2.2. Calibration Curve and LLOQ
2.2.3. Precision and Accuracy
2.2.4. Extraction Recovery and Matrix Effect
2.2.5. Stability
2.3. Dose Selection
2.4. Pharmacokinetic Study
2.4.1. Intragastric Administration PKs
2.4.2. Intravenous Administration PKs
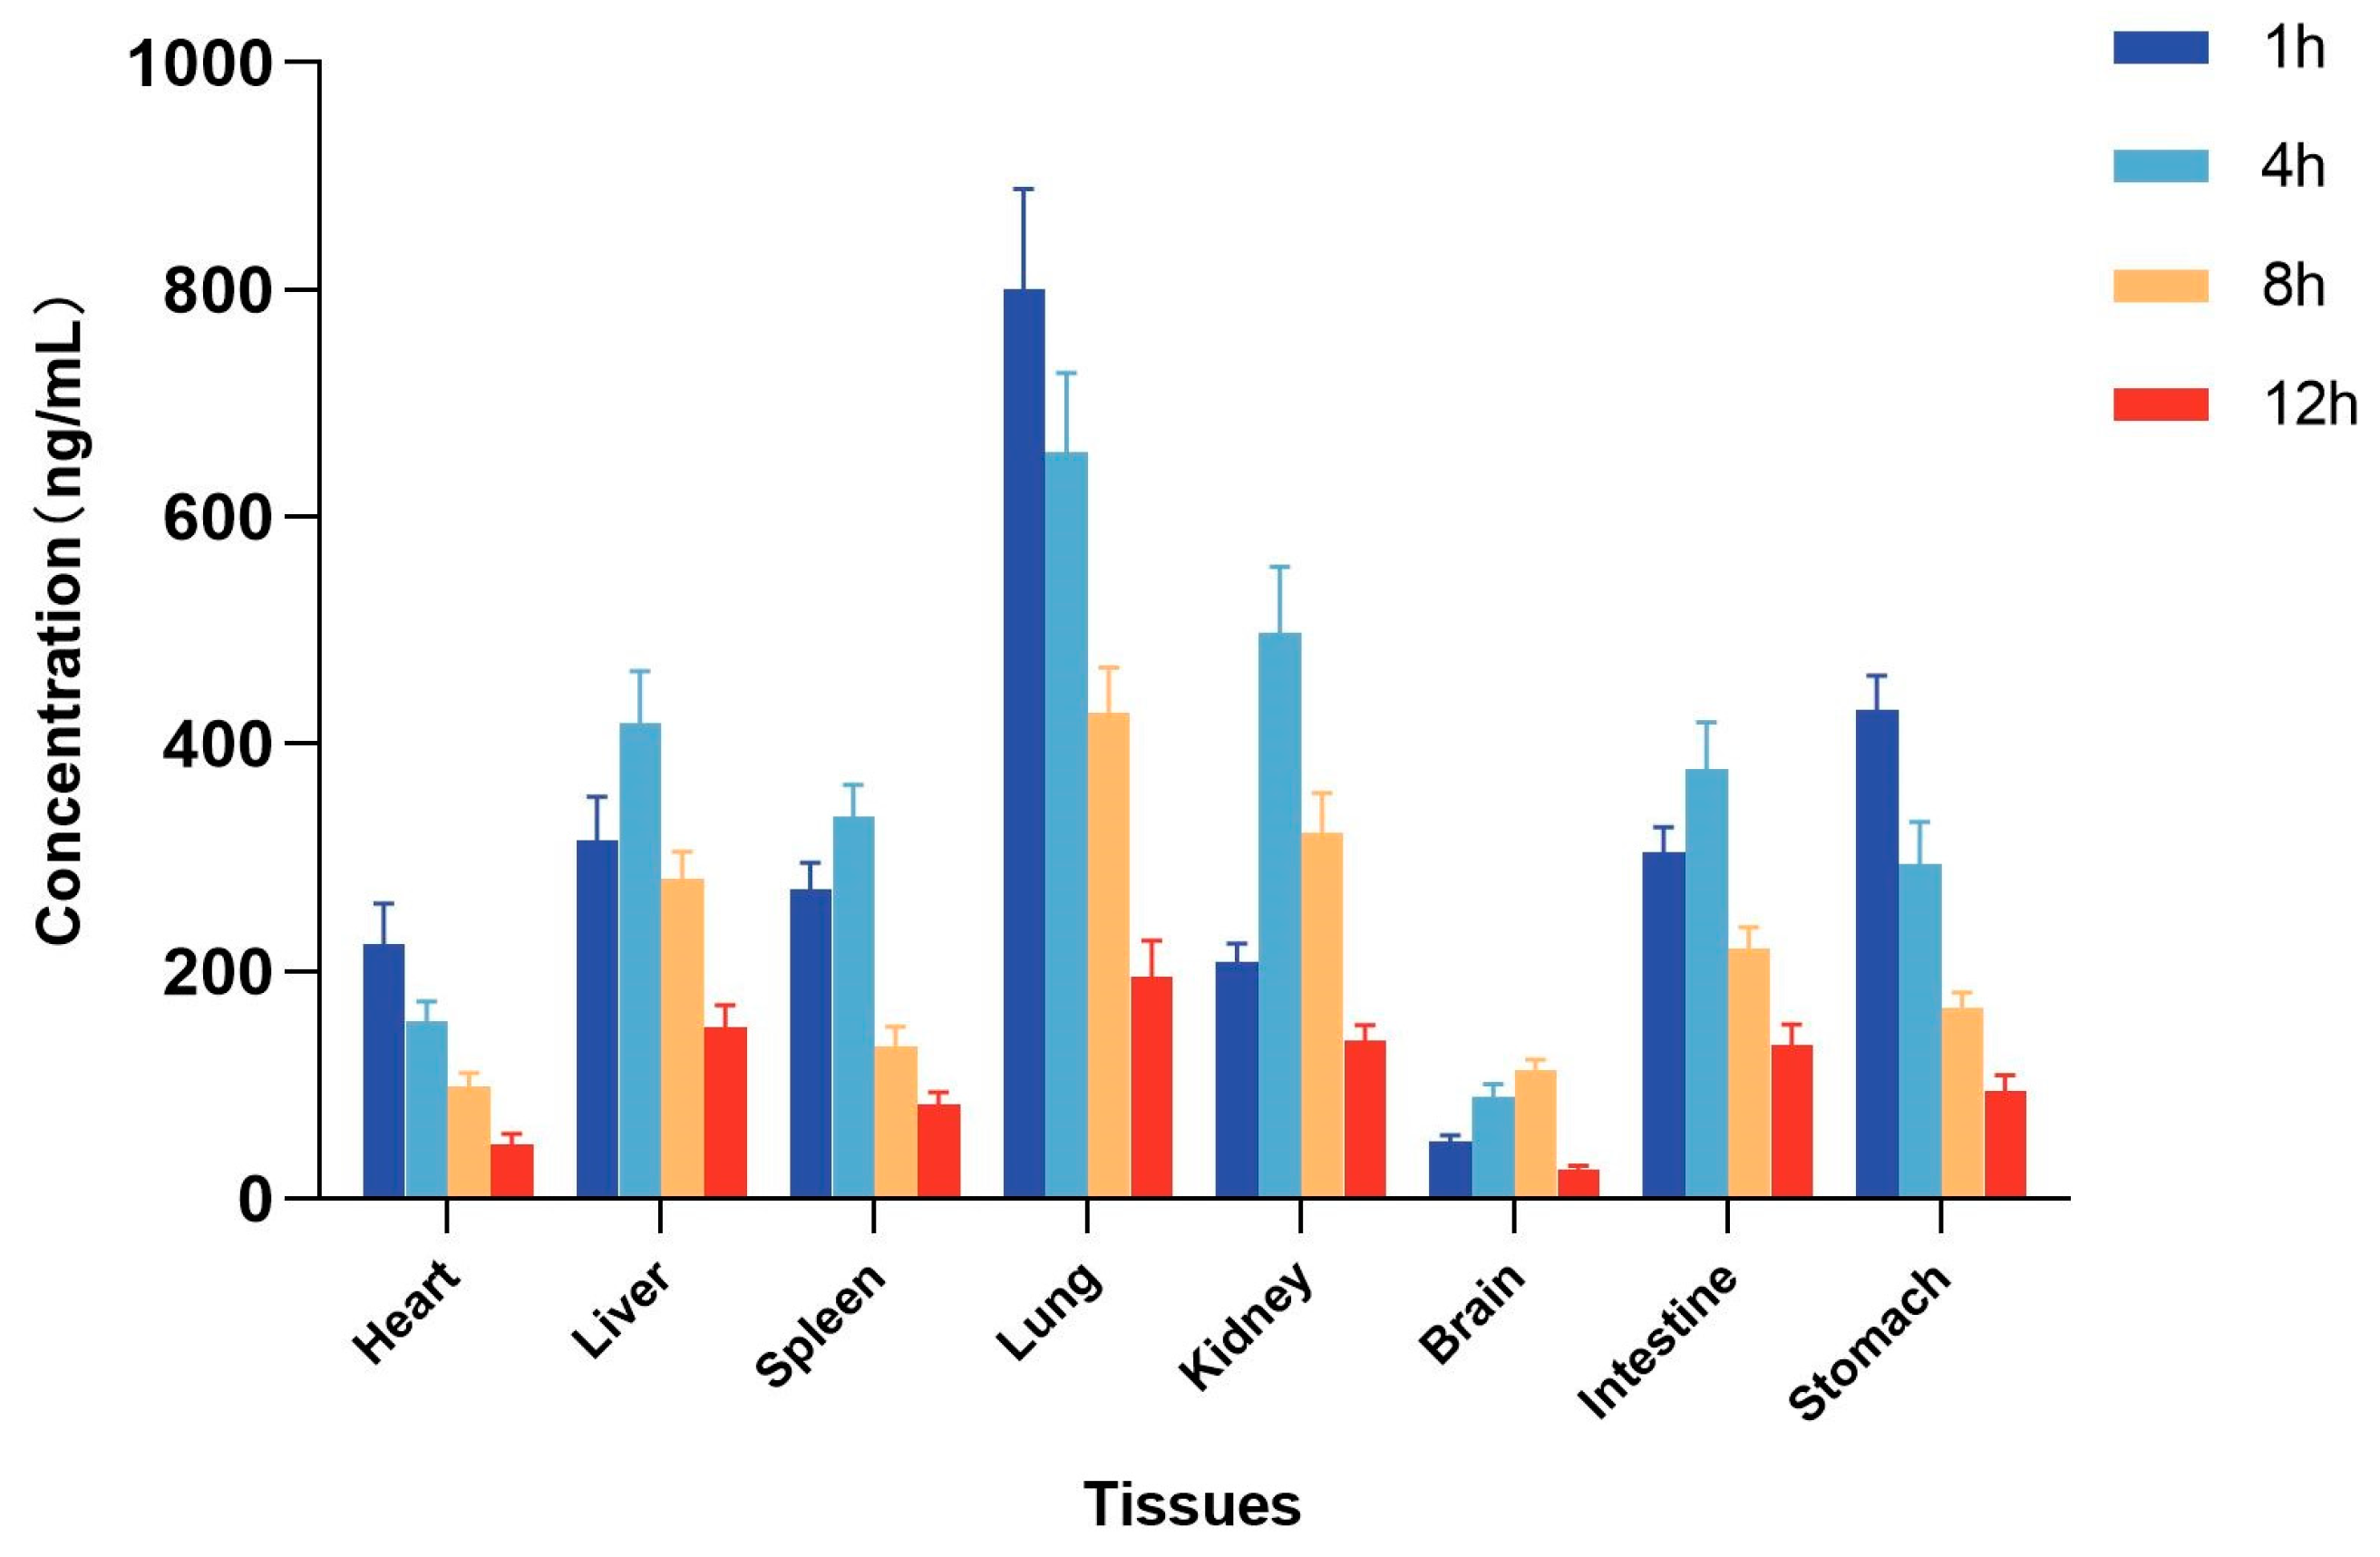
2.5. Tissue Distribution Study
3. Materials and Methods
3.1. Reagents and Materials
3.2. Animals
3.3. Instruments and UHPLC-MS/MS Conditions
3.4. Preparation of Calibration Standards and Quality Control (QC) Samples
3.5. Sample Preparation
3.6. Sample Preparation
3.6.1. Specificity
3.6.2. Calibration Curve and LLOQ
3.6.3. Precision and Accuracy
3.6.4. Extraction Recovery and Matrix Effect
3.6.5. Stability
3.7. Pharmacokinetic Study
3.7.1. Intragastric Administration
3.7.2. Intravenous Administration
3.8. Tissue Distribution Study
3.9. Data Analysis
4. Conclusions
Author Contributions
Funding
Institutional Review Board Statement
Informed Consent Statement
Data Availability Statement
Conflicts of Interest
References
- Golfakhrabadi, F.; Khaledi, M.; Nazemi, M.; Safdarian, M. Isolation, identification, and HPTLC quantification of dehydrodeoxycholic acid from Persian Gulf sponges. J. Pharm. Biomed. Anal. 2021, 197, 113962. [Google Scholar] [CrossRef]
- Mayer, A.M.S.; Rodríguez, A.D.; Taglialatela-Scafati, O.; Fusetani, N. Marine pharmacology in 2009–2011: Marine compounds with antibacterial, antidiabetic, antifungal, anti-inflammatory, antiprotozoal, antituberculosis, and antiviral activities; affecting the immune and nervous systems, and other miscellaneous mechanisms of action. Mar. Drugs 2013, 11, 2510–2573. [Google Scholar] [CrossRef]
- Carroll, A.R.; Copp, B.R.; Grkovic, T.; Keyzers, R.A.; Prinsep, M. Marine natural products. Nat. Prod. Rep. 2024, 41, 162–207. [Google Scholar] [CrossRef]
- Tziveleka, L.A.; Vagias, C.; Roussis, V. Natural products with anti-HIV activity from marine organisms. Curr. Top. Med. Chem. 2003, 3, 1512–1535. [Google Scholar] [CrossRef]
- Yasuhara-Bell, J.; Lu, Y.A. Marine compounds and their antiviral activities. Antivir. Res. 2010, 86, 231–240. [Google Scholar] [CrossRef]
- Pick, N.; Rawat, M.; Arad, D.; Lan, J.; Fan, J.; Kende, A.S. In vitro properties of antimicrobial bromotyrosine alkaloids. J. Med. Microbiol. 2006, 55, 407–415. [Google Scholar] [CrossRef]
- Kiem, P.V.; Huyen, L.T.; Hang, D.T.; Nhiem, N.X.; Tai, B.H.; Anh, H.L.T.; Cuong, P.V.; Quang, T.H.; Minh, C.V.; Dau, N.V.; et al. Sesquiterpene derivatives from marine sponge Smenospongia cerebriformis and their anti-inflammatory activity. Bioorg. Med. Chem. Lett. 2017, 27, 1525–1529. [Google Scholar] [CrossRef]
- Schoenfeld, R.C.; Conova, S.; Rittschof, D.; Ganem, B. Cytotoxic, antifouling bromotyramines: A synthetic study on simple marine natural products and their analogues. Bioorg. Med. Chem. Lett. 2002, 12, 823–825. [Google Scholar] [CrossRef]
- El-Hossary, E.M.; Cheng, C.; Hamed, M.M.; Hamed, A.N.E.; Ohlsen, K.; Hentschel, U.; Abdelmohsen, U.R. Antifungal potential of marine natural products. Eur. J. Med. Chem. 2017, 126, 631–651. [Google Scholar] [CrossRef]
- Montenegro, P.F.; Pham, G.N.; Abdoul-Latif, F.M.; Taffin-de-Givenchy, E.; Mehiri, M. Marine Bromotyrosine Derivatives in Spotlight: Bringing Discoveries and Biological Significance. Mar. Drugs 2024, 22, 132. [Google Scholar] [CrossRef]
- Banday, A.H.; ul Azha, N.; Farooq, R.; Sheikh, S.A.; Ganie, M.A.; Parray, M.N.; Mushtaq, H.; Hameed, I.; Lone, M.A. Exploring the potential of marine natural products in drug development: A comprehensive review. Phytochem. Lett. 2024, 59, 124–135. [Google Scholar] [CrossRef]
- Sorek, H.; Rudi, A.; Aknin, M.; Gaydou, E.; Kashman, Y. Itampolins A and B, new brominated tyrosine derivatives from the sponge Iotrochota purpurea. Tetrahedron Lett. 2006, 47, 7237–7240. [Google Scholar] [CrossRef]
- Liang, J.W.; Li, X.Y.; He, X.; Sun, Q.; Zhang, T.J.; Meng, F.H. (+)- and (−)-itampolin A: First total synthesis, anticancer effect through inhibition of phospho p38 expression. Curr. Org. Synth. 2017, 14, 912–917. [Google Scholar] [CrossRef]
- Liang, J.W.; Wang, M.Y.; Wang, S.; Li, X.Y.; Meng, F.H. Fragment-Based Structural Optimization of a Natural Product Itampolin A as a p38α Inhibitor for Lung Cancer. Mar. Drugs 2019, 17, 53. [Google Scholar] [CrossRef]
- Zhao, N.; Sun, Q.; Olounfeh, K.M.; Chen, Q.L.; Liang, J.W.; Wang, S.; Wang, L.; Song, Y.; Meng, F.H. A validated UHPLC-MS/MS method for measurement of pharmacokinetics and tissue distribution of trolline in rat. J. Pharm. Biomed. Anal. 2019, 169, 208–214. [Google Scholar] [CrossRef]
- Ren, Y.X.; Wang, Z.B.; Wu, C.C.; Dong, H.R.; Gan, C.L.; Fan, L.Z.; Wang, W.Y.; Yang, C.J. Ultrahigh-performance liquid chromatography with tandem mass spectrometry for the determination of 10 alkaloids in beagle plasma after the oral administration of the three Coptidis rhizoma extracts. J. Ethnopharmacol. 2019, 239, 111896. [Google Scholar] [CrossRef]
- Zhao, N.; Tan, H.R.; Chen, Q.L.; Sun, Q.; Wang, L.; Song, Y.; Olounfeh, K.M.; Meng, F.H. Development and Validation of a Sensitive UHPLC-MS/MS Method for the Measurement of Gardneramine in Rat Plasma and Tissues and Its Application to Pharmacokinetics and Tissue Distribution Study. Molecules 2019, 24, 3953. [Google Scholar] [CrossRef]
- Matteo, C.; Orienti, I.; Eramo, A.; Zeuner, A.; Ferrari, M.; Passoni, A.; Bagnati, R.; Ponzo, M.; Bello, E.; Zucchetti, M.; et al. Validated LC-MS/MS Assay for the Quantitative Determination of Fenretinide in Plasma and Tumor and Its Application in a Pharmacokinetic Study in Mice of a Novel Oral Nanoformulation of Fenretinide. Pharmaceutics 2024, 16, 387. [Google Scholar] [CrossRef]
- Lucci, P.; Núez, O. Applications and Uses of Formic Acid in Liquid Chromatography Mass Spectrometry Analysis. In Advances in Chemical Research; Taylor, J.C., Ed.; Nova Science Publishers Inc.: New York, NY, USA, 2014; pp. 71–86. [Google Scholar]
- Zhang, Y.D.; Zong, X.X.; Wu, J.L.; Liu, Y.; Liu, Z.Q.; Zhou, H.; Liu, L.; Li, N. Pharmacokinetics and tissue distribution of eighteen major alkaloids of Aconitum carmichaelii in rats by UHPLC-QQQ-MS. J. Pharm. Biomed. Anal. 2020, 185, 113226. [Google Scholar] [CrossRef]
- Zhang, F.; Yan, Y.; Ding, K.; Lian, W.W.; Li, L.; Wang, W.P.; Xia, C.Y.; Yang, H.; He, J.; Zhang, W.K.; et al. Development and validation of a simple and rapid UPLC-MS/MS method for loganin and its application in pharmacokinetic and tissue distribution studies. J. Ethnopharmacol. 2024, 319, 117130. [Google Scholar] [CrossRef]
- Song, Y.; Wang, K.F.; Wei, X.Y.; Wei, T.Y.; Xiao, T.H.; Wei, M.J. Pharmacokinetics, tissue distribution and plasma protein binding rate of palmatine following intragastric and intravenous administration in rats using liquid chromatography tandem mass spectrometry. J. Pharm. Biomed. Anal. 2021, 203, 114226. [Google Scholar] [CrossRef] [PubMed]
- Ma, L.Y.; Yu, Q.L.; Zhuang, M.; Yang, C.; Liu, Y.; Li, Y.L.; Liu, C.; Shen, X.Y.; Chang, Y. UHPLC-MS/MS Assay for Quantification of Legubicin, a Novel Doxorubicin-Based Legumain-Activated Prodrug, and Its Application to Pharmacokinetic and Tissue Distribution Studies. Molecules 2024, 29, 775. [Google Scholar] [CrossRef] [PubMed]
- Jouyban, A.; Soltani, S. Biological sample preparation: Attempts on productivity increasing in bioanalysis. Bioanalysis 2014, 6, 1691–1710. [Google Scholar]
- Bioanalytical Method Validation Guidance for Industry 2018. Available online: https://www.fda.gov/files/drugs/published/Bioanalytical-Method-Validation-Guidance-for-Industry.pdf (accessed on 2 November 2019).
- Xu, S.M.; Li, S.; Yan, Z.W.; Wang, Y.D.; Zhang, L.Y. Development and Validation of a UHPLC–MS/MS Method for the Quantification of a Novel PYGB Inhibitor in Plasma: Application to Pharmacokinetic Studies. Molecules 2023, 28, 6995. [Google Scholar] [CrossRef]
- Song, Y.; Zhang, Y.; Duan, X.Y.; Cui, D.W.; Qiu, X.; Bian, Y.; Wang, K.F.; Feng, X.S. Pharmacokinetics and Tissue Distribution of Anwuligan in Rats after Intravenous and Intragastric Administration by Liquid Chromatography-Mass Spectrometry. Molecules 2020, 25, 39. [Google Scholar] [CrossRef]
- Drug Analysis System [CP/DK]. Available online: http://www.drugchina.net/# (accessed on 2 November 2019).

| Samples | Calibration Curves | Correlation Coefficients (r2) | Linear Ranges (ng/mL) | LLOQs (ng/mL) |
|---|---|---|---|---|
| Plasma | Y = 0.0750 + 0.00569x | 0.9966 | 1–1600 | 1 |
| Heart | Y = 0.0560 + 0.00604x | 0.9985 | 1–1600 | 1 |
| Liver | Y = 0.0337 + 0.00736x | 0.9939 | 1–1600 | 1 |
| Spleen | Y = 0.0945 + 0.01077x | 0.9945 | 1–1600 | 1 |
| Lung | Y = 0.0047 + 0.00877x | 0.9986 | 1–1600 | 1 |
| Kidney | Y = 0.0530 + 0.00803x | 0.9983 | 1–1600 | 1 |
| Brain | Y = 0.0271 + 0.01345x | 0.9959 | 1–1600 | 1 |
| Intestine | Y = 0.0163 + 0.00723x | 0.9975 | 1–1600 | 1 |
| Stomach | Y = 0.0586 + 0.00905x | 0.9969 | 1–1600 | 1 |
| Samples | Spiked CONC (ng/mL) | Measured CONC (ng/mL) | Accuracy (RE, %) | Intra-Day Precision (RSD, %) | Inter-Day Precision (RSD, %) |
|---|---|---|---|---|---|
| Plasma | 1 | 0.93 ± 0.08 | −7.3 | 9.3 | 6.2 |
| 3 | 3.25 ± 0.20 | 8.2 | 8.0 | 5.8 | |
| 40 | 41.53 ± 2.65 | 3.8 | 4.7 | 6.6 | |
| 1280 | 1227.34 ± 69.64 | −4.1 | 9.5 | 4.9 | |
| Heart | 1 | 1.02 ± 0.04 | 2.2 | 3.7 | 2.2 |
| 3 | 3.24 ± 0.34 | 8.0 | 11.1 | 3.1 | |
| 40 | 36.39 ± 4.70 | −9.0 | 4.5 | 13.6 | |
| 1280 | 1345.66 ± 63.85 | 5.1 | 4.4 | 6.6 | |
| Liver | 1 | 0.96 ± 0.05 | −4.5 | 5.3 | 7.3 |
| 3 | 3.18 ± 0.37 | 6.0 | 12.4 | 2.9 | |
| 40 | 41.30 ± 3.52 | 3.3 | 9.0 | 2.2 | |
| 1280 | 1329.90 ± 82.87 | 3.9 | 5.3 | 10.8 | |
| Spleen | 1 | 0.93 ± 0.10 | −7.1 | 11.3 | 9.0 |
| 3 | 3.11 ± 0.29 | 3.6 | 9.8 | 5.0 | |
| 40 | 41.64 ± 3.41 | 4.1 | 8.6 | 4.5 | |
| 1280 | 1310.37 ± 52.98 | 2.4 | 3.9 | 4.9 | |
| Lung | 1 | 1.05 ±0.06 | 4.6 | 5.6 | 4.8 |
| 3 | 2.77 ± 0.32 | −7.8 | 12.0 | 8.1 | |
| 40 | 42.88 ± 3.77 | 7.2 | 8.5 | 10.6 | |
| 1280 | 1233.68 ± 84.06 | 3.6 | 6.7 | 7.9 | |
| Kidney | 1 | 1.03 ± 0.06 | 3.1 | 5.6 | 8.4 |
| 3 | 3.09 ± 0.28 | 2.8 | 9.8 | 2.6 | |
| 40 | 36.89 ± 3.71 | −7.8 | 10.6 | 4.9 | |
| 1280 | 1334.12 ± 97.11 | 4.2 | 7.1 | 8.4 | |
| Brain | 1 | 1.06 ± 0.08 | 5.7 | 7.2 | 8.1 |
| 3 | 3.07 ± 0.24 | 2.3 | 8.1 | 6.1 | |
| 40 | 41.72 ± 3.01 | 4.3 | 7.5 | 5.0 | |
| 1280 | 1234.17 ± 69.70 | −3.6 | 5.5 | 7.0 | |
| Intestine | 1 | 1.08 ± 0.07 | 8.2 | 6.8 | 7.0 |
| 3 | 2.79 ± 0.26 | −6.9 | 9.4 | 9.1 | |
| 40 | 40.81 ± 2.16 | 2.0 | 5.3 | 5.2 | |
| 1280 | 1320.34 ± 70.49 | 3.2 | 5.4 | 4.7 | |
| Stomach | 1 | 1.03 ± 0.05 | 3.2 | 4.4 | 5.2 |
| 3 | 2.64 ± 0.31 | −11.9 | 12.2 | 7.6 | |
| 40 | 39.18 ± 3.15 | −2.1 | 8.3 | 5.7 | |
| 1280 | 1333.97 ± 59.48 | 4.2 | 4.7 | 2.4 |
| Samples | Spiked CONC (ng/mL) | Matrix Effect | Extraction Recovery | ||
|---|---|---|---|---|---|
| Mean ± SD (%) | RSD (%) | Mean ± SD (%) | RSD (%) | ||
| Plasma | 1 | 105.2 ± 6.0 | 5.7 | 97.3 ± 6.6 | 6.8 |
| 3 | 101.8 ± 4.4 | 4.4 | 104.0 ± 6.6 | 6.4 | |
| 40 | 85.2 ± 4.9 | 5.7 | 99.0 ± 4.7 | 4.7 | |
| 1280 | 96.7 ± 3.5 | 3.6 | 102.7 ± 3.7 | 3.6 | |
| Heart | 1 | 94.0 ± 4.5 | 4.8 | 102.1 ± 4.3 | 4.2 |
| 3 | 98.8 ± 3.4 | 3.4 | 104.9 ± 2.3 | 2.2 | |
| 40 | 102.3 ± 2.7 | 2.6 | 89.7 ± 4.7 | 5.3 | |
| 1280 | 101.9 ± 7.0 | 6.9 | 95.5 ± 6.3 | 6.6 | |
| Liver | 1 | 92.2 ± 7.8 | 8.5 | 101.8 ± 5.6 | 5.5 |
| 3 | 100.8 ± 4.2 | 4.2 | 103.7 ± 4.3 | 4.2 | |
| 40 | 97.4 ± 5.8 | 5.9 | 98.8 ± 1.8 | 1.8 | |
| 1280 | 105.3 ± 7.0 | 6.6 | 107.5 ± 8.5 | 7.9 | |
| Spleen | 1 | 106.4 ± 5.2 | 4.9 | 96.8 ± 4.2 | 4.3 |
| 3 | 98.4 ± 6.9 | 7.0 | 103.0 ± 9.3 | 9.0 | |
| 40 | 106.2 ± 2.8 | 2.7 | 88.0 ± 4.5 | 5.1 | |
| 1280 | 99.4 ± 5.2 | 5.2 | 94.7 ± 6.0 | 6.3 | |
| Lung | 1 | 97.8 ± 9.5 | 9.7 | 104.5 ± 8.7 | 8.3 |
| 3 | 94.6 ± 5.9 | 6.2 | 96.9 ± 7.6 | 7.8 | |
| 40 | 113.9 ± 3.6 | 3.2 | 101.7 ± 4.7 | 4.6 | |
| 1280 | 96.1 ± 8.0 | 8.4 | 103.2 ± 3.8 | 3.7 | |
| Kidney | 1 | 96.9 ± 6.7 | 6.9 | 96.4 ± 4.8 | 5.0 |
| 3 | 102.7 ± 6.2 | 6.0 | 102.8 ± 6.9 | 6.7 | |
| 40 | 104.8 ± 2.7 | 2.6 | 92.3 ± 5.3 | 5.8 | |
| 1280 | 99.0 ± 5.1 | 5.2 | 104.2 ± 3.1 | 2.9 | |
| Brain | 1 | 100.9 ± 4.7 | 4.7 | 92.4 ± 3.2 | 3.4 |
| 3 | 97.8 ± 1.3 | 1.3 | 98.7 ± 5.6 | 5.6 | |
| 40 | 112.2 ± 7.6 | 6.8 | 92.5 ± 7.2 | 7.8 | |
| 1280 | 99.4 ± 3.7 | 3.7 | 101.8 ± 3.2 | 3.2 | |
| Intestine | 1 | 97.6 ± 6.2 | 6.3 | 87.8 ± 5.3 | 6.0 |
| 3 | 101.2 ± 3.2 | 3.2 | 111.6 ± 2.7 | 2.4 | |
| 40 | 100.7 ± 7.5 | 7.4 | 96.4 ± 4.5 | 4.6 | |
| 1280 | 94.1 ± 3.6 | 3.8 | 99.5 ± 2.1 | 2.1 | |
| Stomach | 1 | 99.5 ± 2.4 | 2.4 | 107.1 ± 4.1 | 3.9 |
| 3 | 110.6 ± 4.7 | 4.1 | 105.9 ± 3.7 | 3.5 | |
| 40 | 93.3 ± 4.4 | 3.9 | 97.9 ± 5.7 | 5.8 | |
| 1280 | 97.9 ± 5.5 | 5.6 | 101.5 ± 8.8 | 8.7 | |
| Samples | Spiked CONC (ng/mL) | Short-Term (at Room Temperature for 4 h) | Autosampler 4 °C for 24 h | Three Freeze–Thaw Cycles | Long-Term (at −80 °C for 30 Days) |
|---|---|---|---|---|---|
| Plasma | 3 | 103.9 ± 8.0 | 97.3 ± 5.5 | 106.8 ± 8.8 | 90.5 ± 6.7 |
| 40 | 100.1 ± 4.1 | 96.6 ± 6.3 | 95.3 ± 8.3 | 93.6 ± 8.2 | |
| 1280 | 97.8 ± 4.1 | 98.3 ± 2.9 | 110.6 ± 5.6 | 95.8 ± 8.4 | |
| Heart | 3 | 97.7 ± 3.6 | 87.2 ± 7.2 | 94.3 ± 6.5 | 103.3 ± 6.8 |
| 40 | 100.3 ± 2.6 | 103.9 ± 3.5 | 108.3 ± 9.7 | 97.4 ± 5.3 | |
| 1280 | 89.3 ± 5.3 | 94.0 ± 7.3 | 98.9 ± 4.9 | 95.3 ± 5.4 | |
| Liver | 3 | 98.2 ± 7.5 | 96.3 ± 8.2 | 103.3 ± 4.7 | 93.7 ± 5.1 |
| 40 | 93.5 ± 2.5 | 98.8 ± 4.8 | 96.4 ± 8.1 | 87.1 ± 6.8 | |
| 1280 | 102.9 ± 6.5 | 113.6 ± 4.2 | 95.1 ± 9.2 | 97.9 ± 5.2 | |
| Spleen | 3 | 96.2 ± 2.2 | 103.8 ± 8.5 | 98.4 ± 6.6 | 89.5 ± 8.9 |
| 40 | 100.6 ± 3.8 | 105.8 ± 3.6 | 112.2 ± 6.5 | 102.9 ± 8.7 | |
| 1280 | 98.4 ± 2.1 | 101.2 ± 4.2 | 92.4 ± 7.8 | 104.1 ± 5.2 | |
| Lung | 3 | 108.7 ± 5.1 | 102.5 ± 9.3 | 95.9 ± 7.2 | 95.6 ± 4.9 |
| 40 | 103.1 ± 3.3 | 99.3 ± 6.9 | 86.0 ± 4.2 | 106.7 ± 8.8 | |
| 1280 | 101.2 ± 2.9 | 98.5 ±3.1 | 91.4 ± 5.9 | 96.4 ± 4.8 | |
| Kidney | 3 | 98.6 ± 4.0 | 93.0 ± 8.9 | 97.1 ± 6.7 | 89.1 ± 7.1 |
| 40 | 106.8 ± 7.3 | 100.7 ± 7.6 | 98.4 ± 5.0 | 97.3 ± 8.5 | |
| 1280 | 99.8 ± 8.1 | 92.7 ± 4.2 | 98.8 ± 3.6 | 110.4 ± 5.9 | |
| Brain | 3 | 112.6 ± 3.9 | 98.3 ± 5.8 | 99.5 ± 6.3 | 94.3 ± 8.7 |
| 40 | 99.9 ± 10.9 | 108.0 ± 4.0 | 93.7 ± 7.8 | 95.0 ± 2.9 | |
| 1280 | 99.7 ± 2.9 | 96.8 ± 8.3 | 104.3 ± 2.6 | 94.6 ± 5.7 | |
| Intestine | 3 | 100.1 ± 6.1 | 99.5 ± 5.3 | 108.7 ± 2.9 | 96.3 ± 7.9 |
| 40 | 101.3 ± 2.3 | 106.4 ± 8.9 | 98.3 ± 5.0 | 85.9 ± 7.4 | |
| 1280 | 99.7 ± 3.3 | 102.3 ± 4.1 | 107.5 ± 8.2 | 89.0 ± 7.9 | |
| Stomach | 3 | 100.6 ± 7.6 | 87.5 ± 3.3 | 103.2 ± 4.2 | 92.6 ± 6.5 |
| 40 | 99.0 ± 4.3 | 104.8 ± 7.8 | 114.8 ± 6.6 | 95.6 ± 5.8 | |
| 1280 | 99.1 ± 4.2 | 98.5 ± 2.6 | 97.7 ± 4.7 | 94.1 ± 6.1 |
| Pharmacokinetic Parameters | i.g. Low Dose (10 mg/kg) | i.g. Mid Dose (25 mg/kg) | i.g. High Dose (50 mg/kg) | i.v. (5 mg/kg) |
|---|---|---|---|---|
| Cmax (ng/mL) | 283.1 ± 20.0 | 412.3 ± 13.7 | 807.1 ± 36.9 | 1339.0 ± 52.2 |
| Tmax (h) | 1.7 ± 0.2 | 1.7 ± 0.2 | 0.9 ± 0.1 | 0.03 ± 0.0 |
| t1/2 (h) | 2.6 ± 0.3 | 2.3 ± 0.2 | 2.1 ± 0.2 | 2.6 ± 0.2 |
| ke (h−1) | 0.27 ± 0.03 | 0.30 ± 0.02 | 0.33 ± 0.03 | 0.27 ± 0.02 |
| AUC0–t (ng·h/mL) | 938.9 ± 34.9 | 1536.1 ± 44.9 | 2640.1 ± 44.6 | 978.0 ± 26.2 |
| AUC0–∞ (ng·h/mL) | 1077.8 ± 55.8 | 1943.8 ± 116.0 | 3194.7 ± 94.7 | 2829.9 ± 109.7 |
| MRT0–∞ (h) | 4.6 ± 0.5 | 4.2 ± 0.3 | 3.7 ± 0.2 | 4.8 ± 0.3 |
| CL (L/h/kg) | 11.1 ± 0.5 | 12.9 ± 0.8 | 12.4 ± 0.4 | 1.8 ± 0.1 |
| Vd (L/kg) | 42.2 ± 2.9 | 43.9 ± 1.7 | 44.6 ± 2.8 | 6.6 ± 0.4 |
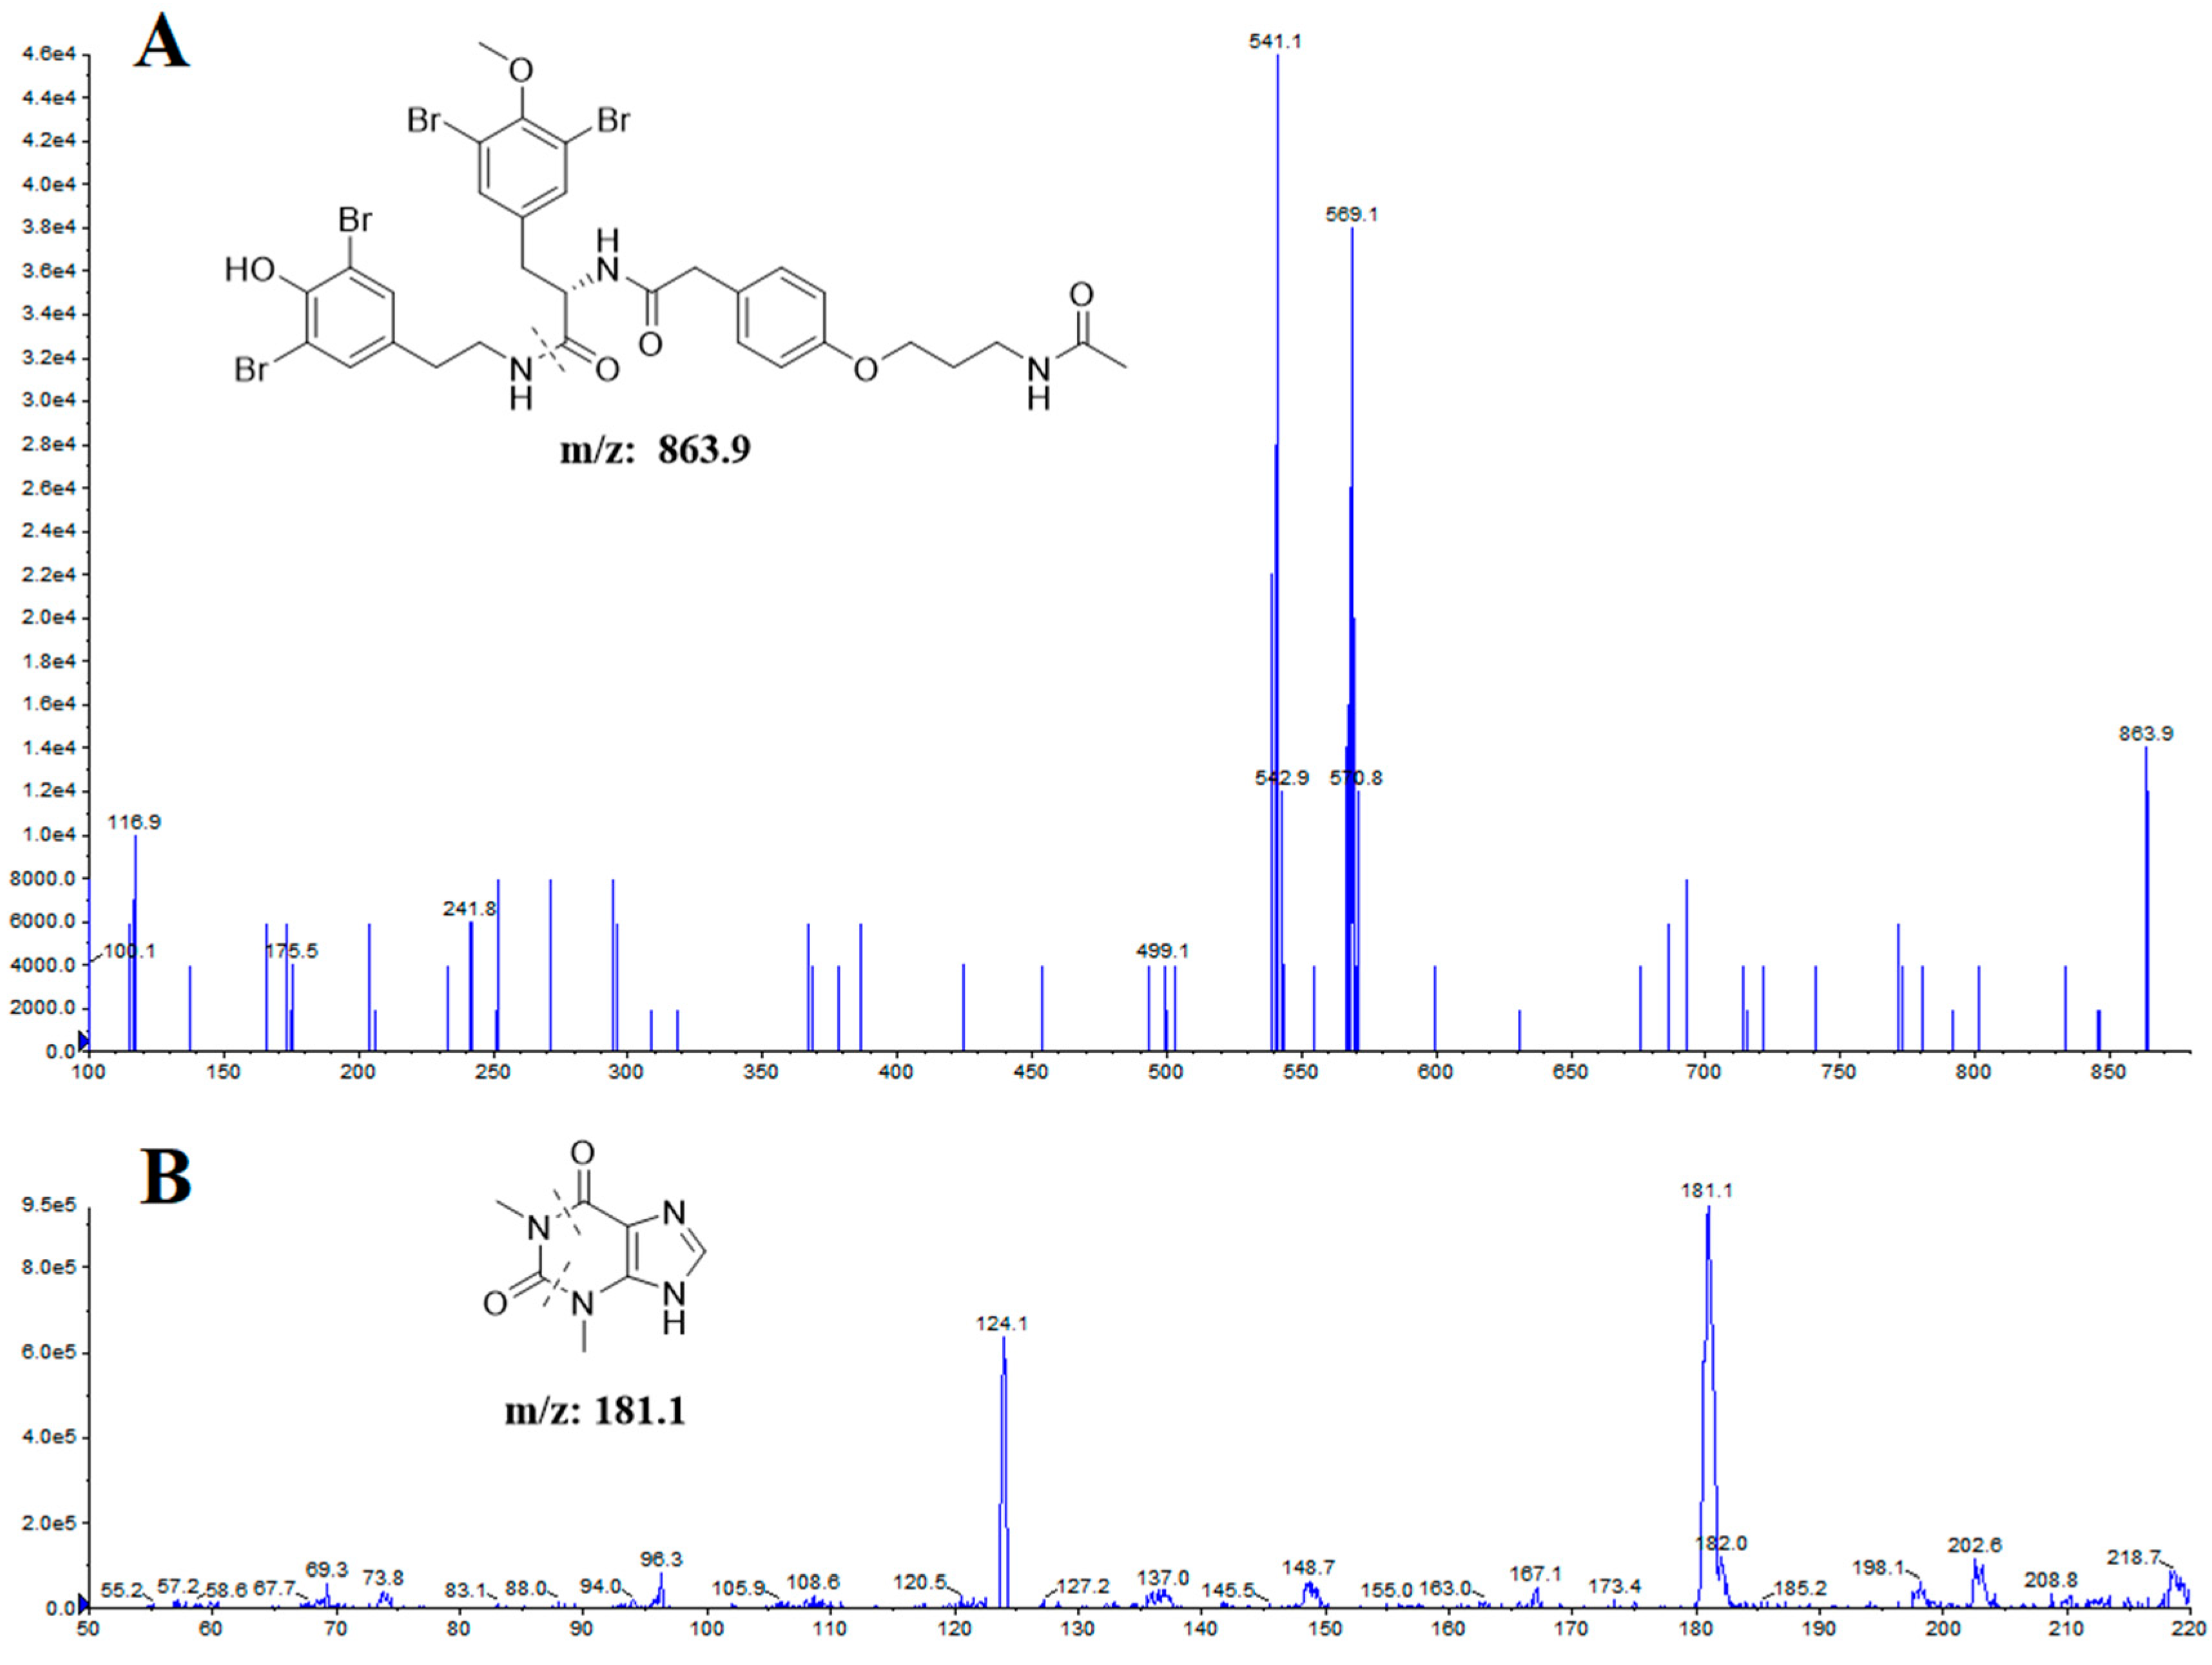
| Analytes | Transitions (m/z) | Declustering Potential (V) | Collision Energy (eV) |
|---|---|---|---|
| itampolin A | 863.9 → 569.1 | 148 | 30.9 |
| IS | 181.1 → 124.1 | 70 | 26.6 |
Disclaimer/Publisher’s Note: The statements, opinions and data contained in all publications are solely those of the individual author(s) and contributor(s) and not of MDPI and/or the editor(s). MDPI and/or the editor(s) disclaim responsibility for any injury to people or property resulting from any ideas, methods, instructions or products referred to in the content. |
© 2024 by the authors. Licensee MDPI, Basel, Switzerland. This article is an open access article distributed under the terms and conditions of the Creative Commons Attribution (CC BY) license (https://creativecommons.org/licenses/by/4.0/).
Share and Cite
Sun, Q.; Liang, J.; Zhang, Q.; Wang, X.; Zhao, N.; Meng, F. Pharmacokinetics and Tissue Distribution of Itampolin A following Intragastric and Intravenous Administration in Rats Using Ultra-High-Performance Liquid Chromatography–Tandem Mass Spectrometry. Molecules 2024, 29, 2652. https://doi.org/10.3390/molecules29112652
Sun Q, Liang J, Zhang Q, Wang X, Zhao N, Meng F. Pharmacokinetics and Tissue Distribution of Itampolin A following Intragastric and Intravenous Administration in Rats Using Ultra-High-Performance Liquid Chromatography–Tandem Mass Spectrometry. Molecules. 2024; 29(11):2652. https://doi.org/10.3390/molecules29112652
Chicago/Turabian StyleSun, Qi, Jingwei Liang, Qingyu Zhang, Xuezhen Wang, Nan Zhao, and Fanhao Meng. 2024. "Pharmacokinetics and Tissue Distribution of Itampolin A following Intragastric and Intravenous Administration in Rats Using Ultra-High-Performance Liquid Chromatography–Tandem Mass Spectrometry" Molecules 29, no. 11: 2652. https://doi.org/10.3390/molecules29112652
APA StyleSun, Q., Liang, J., Zhang, Q., Wang, X., Zhao, N., & Meng, F. (2024). Pharmacokinetics and Tissue Distribution of Itampolin A following Intragastric and Intravenous Administration in Rats Using Ultra-High-Performance Liquid Chromatography–Tandem Mass Spectrometry. Molecules, 29(11), 2652. https://doi.org/10.3390/molecules29112652