Abstract
The school meal promotes healthy eating habits through nutritionally adequate preparations. Consequently, it prevents obesity and malnutrition, favoring learning. This systematic review aimed at investigating the methods for evaluating the acceptance of school menus offered by school feeding programs (SFPs) around the world. Specific search strategies were conducted on PubMed, Lilacs, Web of Science, Scopus, Embase, Google Scholar, and ProQuest Global. The methodological quality of the included studies was assessed using the Meta-Analysis Statistical Assessment and Review Instrument. A total of 89 studies were included. The countries with the highest number of studies were Brazil (n = 42), South Korea (n = 13), and the United States (n = 12). The most used methods (69.66%) were numerical scales, with a higher prevalence for the 5-point scale (50.56%). Other methods included questionnaires and/or interviews with objective and/or subjective questions (44.94%); and mathematical formulas and/or visual estimates evaluating the consumption of food and leftovers (40.45%). The prevalent use of the 5-point hedonic scale may be due to its low cost, simplicity, ease of elaboration, application speed, and student understanding. Mathematical formulas and/or visual estimation were used by about 40% of the studies, but it is difficult to compare studies.
1. Introduction
School feeding programs (SFPs) are social policies within the scope of food and nutrition security (FNS) generally aimed at children and adolescents in situations of food insecurity and living in areas of low socioeconomic status [1], corroborating the importance of these programs to guarantee the food security of these individuals. By early 2020, 388 million had received school meals daily in at least 161 countries of all income levels [2].
However, The State of Food Security and Nutrition in the World 2021 report, a global assessment of food insecurity and malnutrition in 2020, estimated that 2.3 billion people, nearly two-thirds of the global population, lack access to adequate food. Furthermore, between 720 and 811 million faced hunger, and the prevalence of malnutrition reached approximately 9.9% of the population worldwide [3].
These programs provide, through school meals, a social safety net and lead to improved educational and nutrition outcomes [4]. This network includes immediate responses to economic shocks and long-term social protection. They benefit educational performance by increasing school enrollment and attendance, reducing absenteeism, and contributing to learning and cognition. In addition, they cooperate to alleviate hunger and provide nutrients to fight malnutrition. According to [5], these programs offer nutritionally balanced meals that contribute to developing healthy eating behaviors among students.
However, several studies report that the acceptance of the offered school menus/meals by these programs may not correspond to the expectations of the planning stage and, thus, not reach the objectives of being effectively consumed and appreciated [6,7,8,9,10,11,12,13,14,15].
Given this scenario, the numerous factors involved in the acceptance of school meals are well-founded in the literature. Among them, there are sensory characteristics, such as taste [16,17,18,19] and appearance, including color, size, and form [20,21], food preferences and neophobias [22,23,24], and the consumption of competitive foods (sold in school cafeterias, purchased outside of school, and brought from home) [25,26,27]. Additionally, the physical and cultural environment and sociodemographic characteristics such as sex, race, education level, and family income influence acceptance [28,29].
The listed factors may increase school food waste [30,31,32,33]. The amount of food waste, among other factors, is related to students’ perception and acceptance of school meals and eating habits in the home environment [34,35,36].
According to the Food Waste Index report (2021) by the United Nations Environment Program (UNEP), food waste in households, retail establishments, and the food service industry totaled 931 million tonnes per year. The global average of 74 kg per capita of food wasted yearly is similar across low, middle, and high-income countries [37]. Faced with this problem, Target 12.3 of the Sustainable Development Goals (SDGs) by the United Nations Organization (UN) aims to halve per capita food waste worldwide, at retail and consumer levels, and reduce food loss by 2030 [38].
The literature on the subject is broad and diverse, and there is no consensus on which methodologies should be used to effectively measure school menus’ acceptance. Because of this, the importance of adequate instruments and methods for collecting acceptance data is reinforced so that it is possible to verify the effectiveness of these programs. For advances in the field, synthesizing the literature is an important step, and there is evidence that there is no study in the scientific literature that verifies the existence of methods and assessment instruments across countries. Therefore, the objective of the present systematic review was to investigate the methods for evaluating the acceptance of school menus offered by SFPs in different countries.
2. Materials and Methods
This systematic review was prepared according to the Preferred Reporting Items for Systematic Reviews and Meta-Analyses (PRISMA), and its checklist (PRISMA) was registered in PROSPERO (CRD42022321616). The protocol was performed according to the following steps.
2.1. Inclusion and Exclusion Criteria
The inclusion criteria were studies that evaluated the acceptance of school menus offered by SFPs up to high schools worldwide, with no date and language limits. The exclusion criteria were: (i) comments, reviews, letters, abstracts, conferences, undergraduate papers, clinical and review studies, case reports, and books, (ii) studies that do not focus on the evaluation of acceptance of school menus from SFPs around the world, (iii) studies that analyzed the acceptance of preparations that have not yet been included in the menus of the SFPs, (iv) studies in private schools, unrelated to government-subsidized SFPs, (v) preliminary studies, and (vi) studies that evaluated the acceptance of menus offered in universities (Table S1 in Supplementary Materials). No filter on publication date was used since we aimed to search for any acceptability of school menus assessment methods previously published.
2.2. Information Source
Detailed individual search strategies were developed for each database: Pubmed, Lilacs, Web of Science, Scopus, and Embase. A search for gray literature was performed on Google Scholar and for dissertations and theses in ProQuest Global. In addition, the reference lists of selected articles were examined to read the full text of possible relevant studies, as these could have been missed during the electronic search in databases. The last search in all databases was carried out on 11 January 2023.
2.3. Search Strategy
The appropriate combinations of truncation and keywords were selected and adapted for the search in each database (Table S2 in Supplementary Materials). Rayyan software (Qatar Computing Research Institute-QCRI) was used to assist in selecting and excluding duplicate articles, and all references were managed by Mendeley desktop software.
2.4. Study Selection
The process of screening the studies was carried out in two phases. In phase 1, two researchers (SAS, SAB) independently reviewed the titles and abstracts of all references identified in the databases. These excluded articles that did not meet the eligibility criteria. In phase 2, the full texts of the selected articles were read in full by the same reviewers (SAS, SAB), and only those that met the inclusion criteria were included. In cases of divergence, for both phases, there was discussion until a consensus was reached between the two reviewers. Otherwise, a third reviewer (DdCM) made the final decision. The final selection was based on the full text. SAS critically evaluated the reference list of selected studies. Additional studies were added by the experts (RBAB, RPZ).
2.5. Data Collection Process
Two reviewers (SAS, SAB) independently collected the following characteristics from the selected studies: authors and year of publication, country of research, the objective of the study, methods and/or strategies/protocols for sensory evaluation and acceptance of school menus offered by SFPs in the world, and main results referring to the identified methods. Calibration exercises were performed before starting the review to ensure consistency across reviewers. Disagreements were resolved by discussion, and the third reviewer (DdCM) judged the disagreements. These data were synthesized by three reviewers (SAS, SAB, and DdCM) using a standardized table containing the following information: references, authors, year, country, objectives, schools (quantity), teaching stage (according to the teaching stages of each country), participants (students, parents, nutritionists, employees), acceptance methods performed, evaluated attributes, and main results referring to the identified methods.
2.6. Risk of Individual Bias in the Included Studies
The quality criteria were synthesized using a statistical review assessment instrument (MASTARI) and the Joanna Briggs Institute protocol to assess the risk of bias in the studies. The instrument for assessing the risk of bias included seven questions:
- Were the methods of evaluation of acceptance of menus characterized?
- Were the evaluated menus and/or preparations specified?
- Was the evaluation carried out in schools participating in school feeding programs?
- Was the study design adequate?
- Was the sample of participants selected for the analysis representative and randomly determined?
- Was the statistical analysis adequate for the objective of the study?
- Did the results answer the main question?
After analysis, the risk of bias was categorized according to the percentage of “yes” scores: “High” for up to 49%, “Moderate” for between 50 and 69%, and “Low” for more than 70% (Table S3 in Supplementary Materials).
3. Results
Of the 2419 studies found, and after excluding 382 duplicates, 2037 were selected through their abstracts. Of these, 1935 were excluded for not meeting the eligibility criteria. Thereby, 102 studies were selected for a full reading. However, 8 studies were not found, totaling 94 eligible studies. After reading, 39 were excluded, and 55 studies were included. Other studies were identified through other methods, citation searching (n = 87), relevant papers known to authors (n = 3), and organizations (n = 1), totaling 91 studies thoroughly read. However, 3 were not found, resulting in 88 eligible studies, of which 54 were excluded, and 34 were included. In the end, the 55 previously included were added to these 34, resulting in a total of 89 articles in the systematic review (Figure 1).
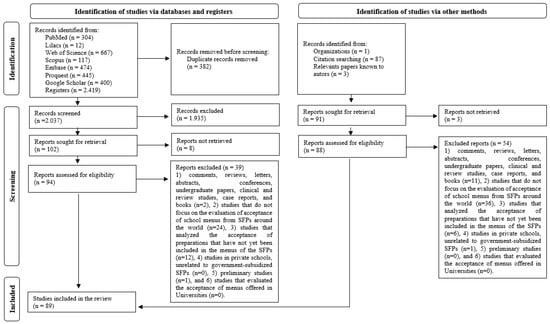
Figure 1.
Flowchart of included/excluded studies and search conducted on school menus assessment methods. Adapted from the PRISMA protocol (2020).
3.1. Studies Characteristics
The selected studies were conducted in the following countries: Brazil (n = 42), South Korea (n = 13), the United States (n = 12), Italy (n = 8), Colombia (n = 2), India (n = 2), Chile (n = 3), Ghana (n = 1), Philippines (n = 1), Spain (n = 1), Paraguay (n = 1), Finland (n = 1), and Georgia (n = 1). The date range for the included studies was between 1977 and 2021 (Table 1).

Table 1.
Main descriptive characteristics and results from the included studies.
The 89 studies included in this review were extracted from articles published in scientific journals (85.39%; n = 76), master’s dissertations (6.74%; n = 6), doctoral theses (5.62%; n = 5), and governmental organizations (2.25%; n = 2). All studies were carried out in public schools/educational institutions participating in SFPs subsidized by the government and offered to the students for free and/or reduced-price meals.
Most studies (23.60%; n = 21) evaluated only one school. There was a range from 1 to 480 evaluated schools, except for six studies that did not report the number of schools. The most explored teaching stage was elementary school, in 63 studies (70.79%), followed by middle school, 43 (48.31%), high school (23.60%; n = 21), preschool (7.86%; n = 7), youth and adult education (YAE) (3.37%; n = 3), and daycare (1.12%; n = 1), isolated or together with the other stages. However, one study did not report the teaching stage.
Considering the sample of subjects who assessed acceptance of menus, all studies included students ranging from 10 to 35,393. More than half of the studies (74.16%; n = 66) evaluated responses from 10 to 1000 students, 19.10% (n = 17) between 1000 and 6000, and 3.37% (n = 3) included 14,717, 34,434, and 35,379 students, respectively. Nevertheless, three (3.37%) did not report the number of participants. In two studies, parents (n = 2044; n = 71) participated, and in three studies, teachers (n = 175; n = 1978) participated. The presence of cooks (n = 4) was verified in two studies, and food handlers and teachers (n = 5) in one study.
3.2. Methods of Evaluating the Acceptance of School Menus
The results showed that the most used acceptance assessment method was the hedonic/Likert scale of 2, 3, 4, 5, 6, 7, and 9 points, present in 62 studies (69.66%). The 5-point scale was the most prevalent (50.56%; n = 45). Mathematical formulas and/or visual estimates evaluating food consumption and leftover food (plate waste or rest ingestion) were used in 36 studies (40.45%). The qualitative methodology of collective subject discourse (CSD) evaluating acceptance was present in 1 study (1.12%), and questionnaires and/or interviews with objective and/or subjective questions were observed in 40 (44.94%) (Table 2).
Table 2.
Distribution of sensory evaluation methods and acceptance of school menus of school feeding programs among the included studies.
For each study, methods were found singly or in combination. The most frequent combination was the hedonic/Likert scale associated with questionnaires and/or interviews in 21 studies (23.60%), then 20 (22.47%) studies with scale and mathematical formulas and/or visual estimation, 15 (16.85%) studies with mathematical formulas and questionnaires and/or interviews, and a combination of the three methods in 7 studies (7.86%). Only one study (1.12%) combined the qualitative methodology of collective subject discourse (CSD) and questionnaires and/or interviews. Finally, it is noteworthy that 44 studies (49.44%) used only one assessment method, as mentioned above.
The same method was used to evaluate different attributes, depending on the study. Regarding scales, the nomenclature “hedonic scale” was used by 37 studies (41.57%), “Likert scale” by 23 (25.84%), 5-point nongender horizontally oriented facial scale by 2 (2.25%), and both “hedonic scale” and “Likert scale” by 1 (1.12%). For the evaluation of leftover food, various mathematical formulas were used by direct weighing (33.71%; n = 30) or the visual estimation method (13.48%; n = 12). Of these, five Brazilian studies (5.62%) evaluated the meal repetition percentage/index by direct weighing. Questionnaires were applied in 38 studies (42.70%) and interviews in 4 (4.49%).
Table 3 presents the main sensorial and acceptance evaluation methods each country uses. Of the 13 countries, the hedonic/Likert scale was the most prevalent method or the only one used (61.54%; n = 8). Questionnaires and/or interviews were the most used by four countries (30.77%), and mathematical formulas and/or visual estimation by six (46.15%). Only one country used the qualitative methodology of collective subject discourse (CSD).
Table 3.
Distribution of sensory evaluation methods and acceptance of school menus of school feeding programs among the included studies. Distribution of the studies by country and sensory evaluation and acceptance methods of school menus in SFPs.
All countries used more than one method in their studies, except the Philippines and Spain. Among the countries that presented more than one study, the hedonic/Likert scale was used in all studies from South Korea (n = 13) and India (n = 2), in half of Brazil (n = 21) and Colombia (n = 1), in 6 (75%) from Italy, 9 (75%) from the United States and, in 1 (33.33%) from Chile. However, it was not present in studies from Spain. For countries with only one study, Ghana, Philippines, Paraguay, and Finland included the hedonic/Likert scale, and Georgia did not use it.
In general and for each country, the types of methods in the studies remained the same over the years. However, the use of one or more methods varied depending on the country or the author, as well as the nomenclature of the evaluated attributes and the forms of presentation of the methodological procedures of each study.
3.3. Main Menus/Meals Evaluated
For each study, meals were evaluated either alone or together. The most evaluated meal among the studies was lunch (61.80%; n = 55), followed by snacks (43.82%; n = 39), breakfast (6.74%; n = 6), and dinner (1.12%; n = 1). Among the studies that evaluated more than one type of meal, there were six studies for lunch and breakfast (6.74%), four for lunch and a snack (4.49%), one for lunch and dinner (1. 12%), and one for breakfast, lunch and dinner (1.12%).
In Brazil, it was found that all the served snacks consisted predominantly of sweet preparations (such as “snacks”) or salty preparations (such as “lunch”), served alternately during the week.
3.4. Risk of Bias
Among the analyzed studies, all (n = 89) had a low risk of bias. All studies evaluated the acceptance of school menus offered by SFPs around the world and answered the main research question (Table S3 in Supplementary Materials).
4. Discussion
Several studies (n = 89) used different methods for sensory evaluation and acceptance of school menus from school feeding programs (SFPs). Thus, the concern of the scientific community and the importance of the theme in the context of school meals is evident.
Considering the countries in which studies were included in this review, Brazil, South Korea, the United States, Italy, Colombia, India, Chile, Ghana, Spain, Paraguay, and Finland have established SFPs, as well as the Philippines [108,109]. For Georgia, no information was found about a national program. The fact that it does not have a program may have influenced the low number (n = 1) of studies in that country. Despite a national school feeding program in the mentioned countries, only Brazil is evaluating the acceptability of school meals in public schools mandatory [110]. For the other countries, this was not observed.
The most used acceptance method among the studies was the hedonic or Likert scale of 2, 3, 4, 5, 6, 7, and 9 points (69.66%; n = 62), and the 5-point scale was the most prevalent (50.56%; n = 45). The hedonic scales are classified as nominal, verbal, numerical, graphic, or mixed and express the taster’s likes or dislikes for a food product [111]. This method is the most used in the sensory analysis of food, as it is quick to perform, easy to understand and apply, and capable of measuring individual variations more accurately. Furthermore, it presents more attractive techniques, can be used with untrained tasters, and can evaluate many sensory stimuli [112].
The food industry widely uses hedonic scales, applied with consumers to obtain information that helps in decision-making for developing new food products to be introduced in the market, new variations, or reformulations [113,114,115,116]. Thus, hedonic or affective tests are often used to assess acceptance or optimize the acceptability of these products [117,118,119].
The verbal taste scale for testing children, known as Peryam and Kroll (P&K), is a 9-point hedonic scale that uses verbal anchors using the terms “super good” to “super bad”. After testing, the author found that the 9-point scale discriminated better than the 7-point among children aged 5 to 7. They have corroborated these results when comparing 3-, 5-, and 9-point scales with children aged 8 to 10 years. They disputed the hypotheses that facial scales were superior to verbal and that shorter ones were better than longer ones [120].
The authors of [120] pointed out that facial scales can confuse or introduce an unintentional bias, as a face representing “disgust” can be interpreted as conveying anger, and one intended to show “likes” can suggest “happiness”, rather than representing the child’s opinion about the food.
These authors have shown that responses are more likely to be crowded at the upper end of the scale when there are fewer response options (5-point hedonic scale). When using a 7-point hedonic scale among children aged 8 to 14, it was concluded that a vertical orientation leads to more positive responses than a horizontal orientation. As for the horizontal scale, the positive side on the left leads to higher ratings than a scale with the negative side on the left.
Due to the advancement of digital communication and the rapid popularization of emojis, interest in their application to understanding how consumers perceive and describe their experiences with food products has been aroused. In this sense, emojis can provide information about human behavior that cannot be obtained by analyzing communications only in written form [121].
Other authors evaluated the taste and emotional response of children aged 8 to 11 (3rd, 4th, and 5th grades) by applying a pictorial facial scale based on emojis. The results demonstrated a high positive correlation between emotional response and taste. For the authors, the emoji scale proved to be applicable for measuring emotional responses using names of verbal food stimuli with children in the United States. Therefore, the authors supported the choice of emojis for acceptance assessment, precisely the emotional response. None of the studies included in this review used emojis present in social media [122].
Of the 13 countries, the hedonic or Likert scales were the most prevalent method (61.54%/n = 8). The 5-point scale was the most used. The 7-point scale was used in most studies from Italy (37.50%), the Philippines (100%), and Finland (100%). In Brazil, despite not being the most prevalent method, 23 studies (54.76%) used a scale, of which 42.86% used 5 points (n = 18), 4.49% 3 points (n = 4), and 2.38% (1 study) used 3 and 5 points. As Kroll (1990) pointed out, 9-point scales are more adequate for studies with children than 3-, 5-, or 7-point scales; however, they were not prevalent in this systematic review.
Preferences are an essential indicator of food consumption, predicting the average amount consumed and the proportion of people who will accept these foods [123]. Therefore, studies evaluated different perceptions using the same method.
Acceptance is an experience characterized by a definite positive attitude of the subject about the analyzed object, which the actual use of a particular food can measure [45]. The acceptance of students is an essential factor in establishing the quality of the service provided by school food services regarding the provision of school meals [124]. It improves nutrient ingestion by students and reduces food waste, contributing to sustainability.
The Brazilian school feeding program constructed a manual to evaluate the acceptability of school meals. Acceptability is described as the set of methodological procedures, scientifically recognized, intended to measure the acceptance index of the food offered to students. It is part of the sensory analysis of food, which evokes, measures, analyzes, and interprets reactions to the characteristics of foods and materials as perceived by the organs of sight, smell, taste, touch, and hearing [124].
This Brazilian manual suggests using two methods: hedonic scale and rest ingestion. For the hedonic scale, the use of verbal or facial scales depends on the age of the students, but all of them use a 5-point scale. For the analysis of the answers, if the sample presented a percentage ≥85% in the expressions “I liked” (4 points) and “I loved it” (5 points), the tested food was accepted [124]. Even though this governmental manual suggests the use of hedonic scales, the majority of the studies from Brazil did not use it, nor did the other ingestion evaluations. This is because the manual was published in 2010, and there have been many studies before this year. Studies from Brazil published from 2013 onwards began to use the methods described in the aforementioned manual, using only the hedonic scale, the rest intake, or both. After the manual’s publication, only eight studies adopted different methodologies [12,74,78,79,82,86,89,92].
In the United States, the School Nutrition and Meal Cost Study of 2019 stand out, which evaluates student participation, satisfaction, and plate waste in volume 4. It is considered a nationally representative study with a sample of over 1000 elementary, middle, and high school students. Additionally, it investigated parental satisfaction [99], an important data collection strategy that can contribute to investigating the public’s opinion for decision-making and implementing public policies in this context. This national study used scales of 2, 3, 4, and 5 points because each scale evaluated different attributes. Another extensive school program that does not use 7- or 9-point scales is pointed as the best strategy.
The mathematical formulas and/or visual estimates evaluating food consumption and leftover food (plate waste or rest ingestion) were used in 36 studies (40.45%). Twelve studies (13.48%) employed the visual estimation method. This method determines the waste of dishes, indirectly measuring food waste. Therefore, it requires trained observers to estimate the weight of the waste. Depending on the study, it may be an efficient collection method [125].
However, even trained observers’ skills may vary in estimating the amount of food ingested and discarded, allowing this to be a source of bias. Additionally, observers who have not tried the food offered to the students may not understand the reasons for discarding it due to characteristics such as inadequate temperature and undercooked food [76].
Regarding the Brazilian studies, the acceptance of the menus was evaluated using the method “Visual Estimation of Rest on Each Plate”. The method aims to verify the amount of food offered to the student and not consumed, that is, left on each plate [56]. It is the most recommended due to its speed, ease of application, validity, and reproducibility of results, better reflecting individual variations [44,55].
The method of “Visual Estimation of Leftovers in Each Plate” is valid but limited since students who do not participate in the school feeding program are not included in the indices that determine the acceptability of school feeding due to the rejection of the menu and social constraints, among other reasons [55].
The visual estimation method through digital photography of meal trays before and after ingestion allows evaluators to have the time to consider the amount of food consumed by each student carefully. The author verified a 92% agreement between the weighed trays and those visually estimated from post-consumption photographs [80].
The evaluation of consumption and leftover food (plate waste or rest ingestion) using mathematical formulas was performed by twenty-four studies (26.97%). In studies in Brazil, the methods named “Measures of aggregate leftovers”, “Menu repetition percentage/index”, “Effective Attendance Index”, “Rest Ingestion index”, “Rejection Index”, “Adherence Index”, and “Acceptability Index” were used. In South Korea, “Examinations leftovers” was used. In the United States, “Plate waste” and “Aggregate plate waste” were used. In Italy, the “Satisfaction Index” was used. In Chile, “Real intake of food” and “Satisfaction Indicator” were used. In Spain, “Estimate of leftovers” was used, and in Paraguay, “Percentage of food consumption” was used.
Among them, the Brazilian studies [19,44,45,55,59] evaluated the acceptability of school meals by the percentage/index of repetition of the meal (direct weighing), that is, whether or not students repeated the offered meal. However, this calculation does not constitute a form of evaluation of acceptability since the student can practice repeating the meal to satisfy his physiological hunger and not necessarily because he appreciates/likes the food offered.
This method may present biases due to several factors. The training of the evaluators, the equipment and materials used (scales, spreadsheets, etc.), the data collection procedures used, the way of portioning the food offered, the type of mathematical formula applied and its cutoff points, and the interpretation of results, among others. Thus, comparing these formulas in terms of effectiveness and validity becomes difficult.
Questionnaires and/or interviews with objective and/or subjective questions were observed in forty studies (44.94%). Most respondents were children, mainly from the elementary school stage (70.79%; n = 63), generally comprised of the age group of 7 to 11 years.
Completely labeled response options help produce more reliable responses, as partially labeled ones require clear definitions of the offered response options [126]. Thus, dealing with partially labeled answer options becomes more challenging since their logical and abstract thinking is limited, and they must interpret and translate the unlabeled options themselves.
It is worth considering Piaget’s theory of child development to combine developmental skills and the cognitive demands of survey research [126]. During childhood and adolescence, the continuous development of functions related to language, literacy, and memory is observed, which potentially affects their ability to answer a research question well [127].
The simplicity and clarity of the questions are essential for the development of questionnaires, making them immediately recognizable to children. These have difficulties with ambiguous and vague words as they tend to interpret words literally. Thus, the unequivocal wording of the questions is essential to improve the quality of the research data [128].
Extensive questionnaires that seek detailed information should be avoided as they can lead to withdrawal and incomplete responses [129]. The content and context of the questions and the physical environment can affect children and adolescents and, consequently, the quality of the data [127].
The advantages of applying questionnaires include the speed of application, the ability to collect a significant amount of data, and the ability to reach large samples. However, the disadvantages are usually the low return rates and literacy levels [130]. Furthermore, the absence of a valid survey with tested questions makes confidence in the validity of the results questionable [80].
Only one study [12] used the qualitative methodology of collective subject discourse (CSD) proposed by [131]. The DSC is anchored in the theory of social representations, which, through open questions, collects and analyzes individual testimonies in empirical opinion polls, identifying key expressions (ECH) and central ideas (CI). Thus, extracts from different individual testimonies are used to elaborate collective testimonies. These are written in the first person singular, representing the collective opinion.
The DSC makes it possible to reach numerically more representative samples expressing the thoughts of a given population. The accurate collection of subjective data and contemplating quantitative aspects of studies across diverse academic areas of knowledge are required [132]. The researcher must pay attention to avoid the extinction of the less recurrent answers because an individual’s speech is unique [133].
Most evaluated meals in Brazil were snacks, consisting predominantly of sweet preparations (such as “snacks”) or salty preparations (such as “lunch”), served alternately during the week. This composition of snacks is a common practice in Brazilian states and aims to meet the nutritional needs of students. Among the savory preparations, rice and beans stand out, a food combination that is part of the country’s food culture. For Maciel (2004), their consumption goes beyond regional differences, social class, or ethnic origin, constituting the basic food of Brazilians. Respect for food culture is important for guaranteeing the human right to adequate and healthy food [134]. In other countries, lunch was the most rated meal and generally included main courses, side dishes, and desserts. So, some typical preparations were verified, depending on the country.
It is understood that the school menu preparations do not necessarily indicate that the student likes and is satisfied with the food offered. It can characterize a solution to their physiological need. Many students consumed school meals because it was the only alternative to eat during the class break due to the absence of canteens and/or cafeterias in the school environment [12].
Due to hunger and lack of food offered by the family, children consume the food provided at school even if it is not to their total liking or preference. In this way, it causes an increase in the acceptability indexes of the program’s meals, which do not reflect the actual acceptance of the students [55]. Other studies have reported that school meals represent the only daily meal for many students. In this way, it is a vital tool for fighting hunger [6,8,26,92,135,136,137,138].
Some studies found that younger students rated school meals more positively and satisfied than older students. This finding may be related to the fact that with increasing age, children and adolescents become more aware of their food preferences [139]. Thus, they are the most frequent consumers of school meals [45,59,62,78,81,98,140,141].
School meals are planned to ensure effective consumption and still be appreciated by students, one should consider and understand the existence of several factors involved in this process, which directly influence the food choices of these individuals. It is known that food choices developed during childhood are the result of subjective perceptions and opinions about food, verified through the five bodily senses: taste, smell, touch, sight, and hearing. Therefore, children consider the palatability and organoleptic characteristics of foods (taste, smell, texture, and appearance) as determinant aspects of their food preferences that influence the composition of their consumption patterns [21,50,142,143].
Intervening factors can be the long lines to receive meals, time restrictions to eat, lack of variety of preparations, and consumption of food purchased outside of school [27]. Overall, food choice is mainly affected by parents, other children, and children’s advertising [144].
Nonetheless, it is considered that, in addition to these listed characteristics, food choice is affected by interdependent factors, namely, physiological and nutritional needs, genetic predisposition, personality parameters, and sociodemographic and cultural aspects [144,145]. The environment in which the food is offered interferes with its approval in the construction of the eating habits of this population [19].
The children are more likely to prefer foods that are familiar to them over those unfamiliar. This familiarity comes from their experiences with food, and it is necessary to expose them several times to encourage consumption patterns that encourage the practice of more varied and healthier eating habits [146,147]. In this way, it becomes a challenge to achieve a balance between healthy eating and eating accepted by students [54].
Hence, efforts should be directed toward greater acceptance and adherence of students, based on the verification and evaluation of their indices, as these act as necessary devices that, when measured through specific methods, allow assessment of the quality of school meals provided by schools [148]. Moreover, they avoid wasting food and public resources when purchasing rejected foodstuffs [149].
This review has some limitations. Some studies, written in a language other than English, were translated through a translation platform. Therefore, some information may have been lost due to language barriers. Additionally, there is a wide variety of methods to assess the acceptance of school menus, many of which have their evaluation parameters. Thus, comparing them in terms of validity and efficacy is a relevant limitation.
5. Conclusions
This systematic review found many studies that used methods to assess the acceptance of school menus offered by SFPs in different countries. Brazil, South Korea, and the United States were the countries that most investigated this issue, probably because they have the largest SFPs, considering the time of existence and coverage. Only in Brazil is evaluating acceptability mandatory. The most prevalent evaluated meal was lunch since most students go to school during the day and spend morning and afternoon studying. Moreover, the most evaluated teaching stage was elementary.
About 70% of the studies used the hedonic or Likert scale, with a higher prevalence for the 5-point scale. Thus, it is the most widely used method, probably due to its low cost, simplicity, ease of elaboration, speed of application, and greater possibility of student understanding. Furthermore, it presents more attractive techniques, can be used with untrained tasters, and can evaluate many sensory stimuli. It is a method already used by the industry to develop or reformulate products.
However, it is essential to know the study’s target audience, establish the best application method, and if it will evaluate the complete meal or isolated dishes. When using the hedonic scale to evaluate the acceptability of a whole meal, schools may have difficulties understanding which preparation in a meal brought the results closer to acceptability or rejection. When evaluating leftovers, it can be easier to identify the most rejected dishes.
Some authors state that facial scales can confuse or introduce an unintentional bias, as a face representing “disgust” can be interpreted as conveying anger, and one intended to show “likes” can suggest “happiness”, rather than representing the child’s opinion about the food. They support the choice of emojis for acceptance assessment; however, none of the studies included in this review used emojis.
The method of mathematical formulas and/or visual estimation evaluating consumption and leftovers, despite being used by about 40% of the studies, is difficult to compare due to the different mathematical formulas used for the evaluation. In addition, some studies did not fully describe the data collection procedures, which may compromise the reliability of the results. Therefore, despite being a good way to evaluate preferences for a meal, studies must fully describe all the necessary steps for reproducibility in further studies.
Questionnaires and/or interviews with objective and/or subjective questions and the qualitative methodology (collective subject discourse) must be adapted to the stage of cognitive development of each age group to achieve their goals of being applicable and understandable. Therefore, they were less used in the studies because researchers look for methods that can be applied to different age groups.
Further studies involving numerical scale methods adapted to the target audience are necessary. Thus, it will be possible to continuously evaluate the menus or foods provided by SFPs and compare scientific data worldwide. In this way, macro and micro policies can be developed so that the school community served by these programs has an adequate consumption of the food and meals offered, contributing to the integral development of students.
Supplementary Materials
The following supporting information can be downloaded at: https://www.mdpi.com/article/10.3390/ijerph20032242/s1, Table S1. Full-text articles excluded with reasons; Table S2. Database and terms used to search references on the methods of sensory evaluation and acceptance of school menus from school feeding programs around the world; Table S3. Quality criteria of the selected studies for the systematic review of the sensory evaluation methods and acceptance of school menus from school feeding programs around the world.
Author Contributions
S.A.S.: conceptualization, methodology, article screening and selection, data extraction and synthesis, data interpretation, writing—original draft preparation, and writing—review and editing; S.A.B. and D.d.C.M.: article screening and selection, data extraction and synthesis, data interpretation, and writing—review and editing; R.P.Z., R.B.A.B., and V.C.G.: overall supervision, critical review of manuscript and provision of constructive comments, project administration. All authors have read and agreed to the published version of the manuscript.
Funding
This research was funded by the University of Brasília by the Edital PPGNH 002/2022.
Institutional Review Board Statement
Not applicable.
Informed Consent Statement
Not applicable.
Data Availability Statement
Not applicable.
Acknowledgments
Coordination for the Improvement of Higher Education Personnel (CAPES).
Conflicts of Interest
The authors declare that they have no known competing financial interest or personal relationships that could have appeared to influence the work reported in this paper.
References
- Shrestha, R.M.; Schreinemachers, P.; Nyangmi, M.G.; Sah, M.; Phuong, J.; Manandhar, S.; Yang, R.Y. Home-Grown School Feeding: Assessment of a Pilot Program in Nepal. BMC Public Health 2020, 20, 28. [Google Scholar] [CrossRef] [PubMed]
- World Food Programme (WFP). State of School Feeding Worldwide 2020; World Food Programme: Rome, Italy, 2020; ISBN 9789295050006. [Google Scholar]
- FAO. Brief to the State of Food Security and Nutrition in the World 2021; FAO: Rome, Italy, 2021; ISBN 9789251343258. [Google Scholar]
- Bundy Rethinking School Feeding Social Safety Nets, Child Development, and the Education Sector; World Bank: Washington, DC, USA, 2009; ISBN 9780821379745.
- Kwon, S.; Kim, O.; Lee, Y. Effects of Students’ Satisfaction with School Meal Programs on School Happiness in South Korea. Nutr. Res. Pract. 2018, 12, 342–347. [Google Scholar] [CrossRef] [PubMed]
- Balestrin, M.; Teixeira, C.; Rosane, B.; Kirchner, M. Aceitação da Alimentação em uma Escola Estadual do Município de Caiçara-Rs Acceptance of School Meals at a Public State School in Caiçara-RS. Rev. Eletrônica Extensão 2016, 12, 37–45. [Google Scholar]
- Bartolazze, L.A.; Cazal, M.D.M. Avaliação da Composição Nutricional e Aceitabilidade da Alimentação Escolar. Rev. Eletrônica Extensão 2019, 15, 7–17. [Google Scholar]
- Basaglia, P.; Marques, A.S.; Benatti, L. Aceitação Da Merenda Escolar Entre Alunos da Rede Estadual de Ensino da Cidade de Amparo-SP. Saúde Foco 2015, 7, 126–138. [Google Scholar]
- Carvalho, N.A.; Martins, K.A.; de Sousa, L.M.; Díaz, M.E.P. Feeding in Full-Time Public Schools: Do Students Adhere and Accept? Revista Nutrição 2017, 30, 357–368. [Google Scholar] [CrossRef]
- Conrado, S.; Novello, D. Aceitação e Análise Nutricional de Merenda Escolar por Alunos da Rede Municipal de Ensino Do Município de Inácio Martins/PR. Rev. Eletrônica Lato Sensu 2007, 1, 1–15. [Google Scholar]
- Lee, K.-A.; Lyu, E.-S. Comparison of Student Satisfaction with Foodservice of Middle School by Place for Meal Service in Busan Area. J. Korean Soc. Food Sci. Nutr. 2005, 4, 209–218. [Google Scholar]
- Leme, A.C.B.; Philippi, S.T.; Toassa, E.C. What Do the Adolescents Prefer: Food from School or Competitive Foods? Saude Soc. 2013, 22, 456–467. [Google Scholar] [CrossRef]
- Rossi, F.; Malvicini, G.; Pazzoni, A.; Maj, M.; Ciappellano, S. Rilevamento preferenze e consumi nella refezione scolastica. La Rivista della Societá Italiana di Scienza dell’Alimentazione 2006, 35, 25–34. [Google Scholar]
- Sanabria, M.C.; Frutos, D.; Preda, J.; Gónzalez Céspedes, L.; Cornelli, P. Adequacy and Acceptance of School Lunches in Two Public Schools from Asunción. Pediatría 2017, 44, 126–135. [Google Scholar] [CrossRef]
- Teo, C.R.P.A.; Corrêa, E.N.; Gallina, L.S.; Fransozi, C. National School Meal Program: Adhesion, Acceptance and Circumstances of Food Distribution in School. Nutr. Rev. Soc. Bras. Aliment. Nutr. 2009, 34, 165–185. [Google Scholar]
- Ali, J.; Akbar, M. Understanding Students’preferences on School Mid-Day Meal Menu in India. Br. Food J. 2015, 117, 805–819. [Google Scholar] [CrossRef]
- Fritts, J.R.; Fort, C.; Quinn Corr, A.; Liang, Q.; Alla, L.; Cravener, T.; Hayes, J.E.; Rolls, B.J.; D’Adamo, C.; Keller, K.L. Herbs and Spices Increase Liking and Preference for Vegetables among Rural High School Students. Food Qual. Prefer. 2018, 68, 125–134. [Google Scholar] [CrossRef]
- Mensah, C.; Appietu, M.E. Examining Boarding School Foodservice Satisfaction and Patronage of Sources of Meals. J. Culin. Sci. Technol. 2019, 18, 507–526. [Google Scholar] [CrossRef]
- de Oliveira, M.F.B.; do Carmo, C.N.; da Menezes, E.M.S.; Colares, L.G.T.; Ribeiro, B.G. Acceptance Evaluation of School Meals Through Different Method Approaches by Children in Brazil. J. Culin. Sci. Technol. 2015, 13, 49–65. [Google Scholar] [CrossRef]
- Latorres, J.M.; Mitterer-Daltoé, M.L.; Queiroz, M.I. Hedonic and Word Association Techniques Confirm a Successful Way of Introducing Fish into Public School Meals. J. Sens. Stud. 2016, 31, 206–212. [Google Scholar] [CrossRef]
- Laureati, M.; Pagliarini, E. New Developments in Sensory and Consumer Research with Children; Elsevier Ltd.: Amsterdam, The Netherlands, 2018; Volume 2, ISBN 9780081017432. [Google Scholar]
- Chu, Y.L.; Warren, C.A.; Sceets, C.E.; Murano, P.; Marquart, L.; Reicks, M. Acceptance of Two US Department of Agriculture Commodity Whole-Grain Products: A School-Based Study in Texas and Minnesota. J. Am. Diet. Assoc. 2011, 111, 1380–1384. [Google Scholar] [CrossRef]
- Chesser, V.L. Assessment of Middle School Students’ Attitudes and Factors Influencing Their Participation in the National School Lunch Program (NSLP). Ph.D. Thesis, Texas Woman’s University, Denton, TX, USA, 2013. [Google Scholar]
- Rodríguez-Tadeo, A.; Begoña, P.V.; Jesus, P.C.M.; Gaspar, R.B.; Eduardo, G.M.-L. Assessing Food Acceptance in Schoolar Children: Qualitative Visual Record versus Food Waste Analysis. Nutr. Hosp. 2014, 29, 1054–1061. [Google Scholar] [CrossRef]
- Marlette, M.A.; Templeton, S.B.; Panemangalore, M. Food type, food preparations, and competitive food purchases impact school lunch plate waste by sixth-grade students. J. Am. Diet. Assoc. 2005, 105, 1779–1782. [Google Scholar] [CrossRef]
- Mota, C.; Mastroeni, S.; Mastroeni, M. Consumo Da Refeição Escolar Na Rede Pública Municipal de Ensino. Rev. Bras. Estud. Pedagógicos 2013, 94, 168–184. [Google Scholar] [CrossRef]
- Payán, D.D.; Sloane, D.C.; Illum, J.; Farris, T.; Lewis, L.B. Perceived Barriers and Facilitators to Healthy Eating and School Lunch Meals among Adolescents: A Qualitative Study. Am. J. Health Behav. 2017, 41, 661–669. [Google Scholar] [CrossRef] [PubMed]
- Davidson, F.R.R. Critical Factors for School Lunch Acceptance in Washington, D.C. Ecol. Food Nutr. 1979, 8, 3–9. [Google Scholar] [CrossRef]
- Vale, D.; De Oliveira Lyra, C.; Dos Santos, T.T.; De Souza, C.V.S.; Roncalli, A.G. Acceptance of School Food by Brazilian Adolescents: Individual and School Context Determinants. Cienc. Saude Coletiva 2021, 26, 637–650. [Google Scholar] [CrossRef]
- Byker, C.J.; Farris, A.R.; Marcenelle, M.; Davis, G.C.; Serrano, E.L. Food Waste in a School Nutrition Program After Implementation of New Lunch Program Guidelines. J. Nutr. Educ. Behav. 2014, 46, 406–411. [Google Scholar] [CrossRef]
- Smith, S.L.; Cunningham-Sabo, L. Food Choice, Plate Waste and Nutrient Intake of Elementary-and Middle-School Students Participating in the US National School Lunch Program. Public Health Nutr. 2014, 17, 1255–1263. [Google Scholar] [CrossRef]
- Falasconi, L.; Vittuari, M.; Politano, A.; Segrè, A. Food Waste in School Catering: An Italian Case Study. Sustainability 2015, 7, 14745–14760. [Google Scholar] [CrossRef]
- Eriksson, M.; Persson Osowski, C.; Malefors, C.; Björkman, J.; Eriksson, E. Quantification of Food Waste in Public Catering Services—A Case Study from a Swedish Municipality. Waste Manag. 2017, 61, 415–422. [Google Scholar] [CrossRef]
- Giboreau, A.; Schwartz, C.; Morizet, D.; Meiselman, H.L. Measuring Food Waste and Consumption by Children Using Photography. Nutrients 2019, 11, 2410. [Google Scholar] [CrossRef]
- Boschini, M.; Falasconi, L.; Cicatiello, C.; Franco, S. Why the Waste? A Large-Scale Study on the Causes of Food Waste at School Canteens. J. Clean Prod. 2020, 246, 118994. [Google Scholar] [CrossRef]
- Favuzzi, N.; Trerotoli, P.; Forte, M.G.; Bartolomeo, N.; Serio, G.; Lagravinese, D.; Vino, F. Evaluation of an Alimentary Education Intervention on School Canteen Waste at a Primary School in Bari, Italy. Int. J. Environ. Res. Public Health 2020, 17, 2558. [Google Scholar] [CrossRef]
- UN Environment Program. Food Waste Index Report 2021; United Nations: New York, NY, USA, 2021; ISBN 9789280738513. [Google Scholar]
- Food and Agriculture Organization of the United Nations. 12.3.1 Global Food Losses|Sustainable Development Goals. Available online: https://www.fao.org/sustainable-development-goals/indicators/12.3.1/en/ (accessed on 30 November 2022).
- Head, M.K.; Glesbrecht, F.G.; Johnson, G.N. Food Acceptability Research: Comparative Utility of Three Types of Data From School Children. J. Food Sci. 1977, 42, 246–251. [Google Scholar] [CrossRef]
- Devan, K.S.; Gregoire, M.B.; Spears, M.C. Evaluation of a Vegetable Preparation Training Program: Part II: Assessment by Plate Waste Observation and Student and Sensory Panel Ratings. Master’s Thesis, Kansas State University, Manhattan, KS, USA, 1988. [Google Scholar]
- Stalls, S. Sensory Testing of Reduced-Fat Bar Cookies by Fourth Grades Students; Texas Woman’s University: Denton, TX, USA, 1997. [Google Scholar]
- Kim, E.K.; Kim, E.M. The Assessment of Children’s Satisfaction with Foodservice in Elementary Schools Located in Seoul and Kangnung. Korean J. Diet. Cult. 1997, 12, 411–417. [Google Scholar]
- Baxter, S.D.; Thompson, W.O.; Davis, H.C. Fourth-Grade Children’s Observed Consumption of, and Preferences for, School Lunch Foods. Nutr. Res. 2000, 20, 439–443. [Google Scholar] [CrossRef]
- Brandão, T.M. Avaliação da Aceitação e Preferências de Cardápios do Programa de Merenda Escolar em Escolas Municipais do Ensino Fundamental da Cidade de Cmapinas; Universidade Estadual de Campinas: Campinas, Brazil, 2000. [Google Scholar]
- Sturion, G.L. Programa de Alimentação Escolar: Avaliação do Desempenho em dez Municípios Brasileiros; Universidade Estadual de Campinas: Campinas, Brazil, 2002. [Google Scholar]
- Pagliarini, E.; Ratti, S.; Balzaretti, C.; Dragoni, I. Evaluation of a Hedonic Scaling Method for Measuring the Acceptability of School Lunches by Children. Ital. J. Food Sci. 2003, 15, 215–224. [Google Scholar]
- Hong, W.-S.; Chang, H.-J. The Relationship between Food Service Satisfaction and Plate Wastes in Elementary School Students. Korean J. Soc. Food Cookery Sci. 2003, 19, 390–395. [Google Scholar]
- Flávio, E.F.; de Barcelos, M.F.P.; Lima, A.L. De Chemical Evaluation and Acceptance of Meals Offered by a Public School in Lavras–MG. Ciência Agrotecnologia 2004, 28, 840–847. [Google Scholar] [CrossRef]
- de Martins, R.C.B.; de Medeiros, M.A.T.; Ragonha, G.M.; Olbi, J.H.; Segatti, M.E.P.; Osele, M.R. Acceptability of the School Meal Program in the Elementary Public Schools. Saúde Revista 2004, 6, 71–78. [Google Scholar]
- Pagliarini, E.; Gabbiadini, N.; Ratti, S. Consumer Testing with Children on Food Combinations for School Lunch. Food Qual. Prefer. 2005, 16, 131–138. [Google Scholar] [CrossRef]
- Yoon, J.; Choo, Y.J.; Chung, S.-J.; Ryu, S.H. Satisfaction of Elementary Students Eating School Lunch; Association with Level of Involvement in School Lunch Service. Korean J. Community Nutr. 2005, 10, 668–676. [Google Scholar]
- Jang, H.-R.; Kim, H.Y.L. Survey on the Satisfaction Degree for School Lunch Program of Elementary School Students in Yongin. Korean J. Food Nutr. 2005, 18, 155–160. [Google Scholar]
- Lee, H.-S.; Jang, M.-H. Survey of Students Satisfaction with School Food-Service Programs in Gangwon Province. Korean J. Food Nutr. 2005, 18, 175–191. [Google Scholar]
- Stroebele, N.; Barz, R.L.; Wittrock, D.; Lesh, L.; Hill, J.O. A “Small-Changes” Approach to Improving the Nutritional Quality of School Menu Items. J. Child Nutr. Management. A Publ. Sch. Nutr. Assoc. 2006, 30. [Google Scholar]
- de Pecorari, R.C.F. Uma Proposta de Inovação No Cardápio Escolar Baseada na Avaliação do Programa de Alimentação Escolar de Piracicaba-SP; Universidade Estadual Paulista: São Paulo, Brazil, 2006. [Google Scholar]
- Flávio, E.F. Avaliação Da Alimentação Escolar Oferecida Aos Alunos Do Ensino Fundamental Das Escolas Municipais de Lavras, MG. Ciência Agrotecnologia 2006, 32, 1879–1887. [Google Scholar] [CrossRef]
- Byun, G.-I.; Jung, B.-H. A Study on the Preference and Satisfaction on the Menu of School Lunch Service of High School Students in Gyeongju Area. Korean J. Food Cult. 2006, 21, 481–490. [Google Scholar]
- Muniz, V.M.; de Carvalho, A.T. National School Feeding Program in a Municipality of Paraíba State: A Study under the Viewpoint of Those Who Benefit from the Program. Rev. Nutr. 2007, 20, 285–296. [Google Scholar] [CrossRef]
- Danelon, M.A.S. Programa de Alimentação Escolar em Unidades de Tempo Integra: Experiências e Desafios de Gestão. Ph.D. Thesis, Universidade de São Paulo, São Paulo, Brazil, 2007. [Google Scholar]
- Park, K.; Jang, M. Survey on Satisfaction of Fifth and Sixth Grade Students from Elementary School Foodservice in Won-Ju. J. Korean Diet. Assoc. 2008, 14, 13–22. [Google Scholar]
- da Santos, I.H.V.S.; Ximenes, R.M.; Prado, D.F. Avaliação Do Cardápio e Da Aceitabilidade Da Merenda Oferecida Em Uma Escola Estadual de Ensino Fundamental de Porto Velho, Rondônia. Saber Científico 2008, 1, 100–111. [Google Scholar]
- Danelon, M.S.; da Fonseca, M.C.P.; da Silva, M.V. Preferências Alimentares No Ambiente Escolar. Segurança Aliment. Nutr. 2008, 15, 66–84. [Google Scholar] [CrossRef]
- Abranches, M.V.; de Paula, H.A.A.; Mata, G.M.S.C.; Salvador, B.C.; Marinho, M.S.; Priore, S.E. Avaliação Da Adequação Alimentar de Creches Pública e Privada No Contexto Do Programa Nacional de Alimentação Escolar. Nutr. Rev 2009, 34, 43–57. [Google Scholar]
- Bleil, R.A.T.; Salay, E.; da Silva, M.V. Adesão Ao Programa de Alimentação Escolar Por Alunos de Instituições Públicas de Ensino No Município de Toledo, PR. Segurança Aliment. Nutr. 2009, 16, 65–82. [Google Scholar] [CrossRef]
- Caporale, G.; Policastro, S.; Tuorila, H.; Monteleone, E. Hedonic Ratings and Consumption of School Lunch among Preschool Children. Food Qual. Prefer. 2009, 20, 482–489. [Google Scholar] [CrossRef]
- Song, H.J.; Moon, H.K. Comparing School Lunch Program Served at Dining Room with Program at Classroom for Sanitation and Contentment at One Middle School. Korean J. Community Nutr. 2010, 15, 369–378. [Google Scholar]
- Lazor, K.; Chapman, N.; Levine, E. Soy Goes to School: Acceptance of Healthful, Vegetarian Options in Maryland Middle School Lunches. J. Sch. Health 2010, 80, 200–206. [Google Scholar] [CrossRef]
- Pegolo, G.E.; da Silva, M.V. Consumo de Energia e Nutrientes e a Adesão Ao Programa Nacional de Alimentação Escolar (PNAE) Por Escolares de Um Município Paulista. Segurança Aliment. Nutr. 2010, 17, 50–62. [Google Scholar] [CrossRef]
- Matihara, C.H.; Trevisani, T.S.; Garutti, S. Valor Nutricinal Da Nerenda Escolar e Sua Aceitabilidade. Saúde Pesqui. 2010, 3, 71–77. [Google Scholar]
- Lee, K.H.; Park, E.S. School Foodservice Satisfaction and Menu Preferences of High School Students: Focused on Ik-San, Cheonbuk. Korean J. Community Nutr. 2010, 15, 108–123. [Google Scholar]
- Dias, P.H.A.; Kinasz, T.R.; da Campos, M.P.F.d.F. Alimentação Escolar Para Jovens e Adultos No Município de Cuiabá—MT: Um Estudo Sobre a Qualidade, Aceitação e Resto Ingestão. Rev. Aliment. Nutr. 2013, 24, 79–85. [Google Scholar]
- Cruz, L.D.; Santos, A.J.A.O.; Santos, A.A.O.; Gomes, A.B.L.; de Andrade, F.A.M.; Marcellini, P.S. Análise de Aceitação Da Merenda Escolar Dos Alunos Das Escolas Municipais Urbanas de Itabaiana-SE. Sci. Plena 2013, 9. [Google Scholar]
- Barrios, L.; Bustos, N.; Lera, L.; Kain, J. National School Food Program: Calories Provided and Consumed by Preschool Children for Breakfast and Lunch. Rev. Chil. Nutr. 2013, 40, 330–335. [Google Scholar]
- da Silva, C.A.M.; Marques, L.A.; Bonomo, É.; de Bezerra, O.M.P.A.; da Corrêa, M.S.; Passos, L.S.F.; de Souza, A.A.; Barros, B.F.; de Souza, D.M.S.; dos Reis, J.A.; et al. The Brazilian School Nutrition Program from the Standpoint of Students Attending State Schools in Minas Gerais, Brazil. Ciência Saúde Coletiva 2013, 18, 963. [Google Scholar] [PubMed]
- Yang, I.-S.; Yi, B.-S.; Park, M.-K.; Baek, S.-H.; Chung, Y.-S.; Jeong, J.-Y.; Kim, Y.-J.; Kim, H.-Y. Evaluation of the Quality Attribute and Satisfaction on School Foodservice in 2010. Korean J. Community Nutr. 2013, 18, 491. [Google Scholar] [CrossRef]
- Turconi, G.; Testa, L.; Moro, S.; Rossi, M.; Roggi, C.; Maccarini, L. Acceptability, Waste and Nutritional Adequacy of Primary School Canteen Menus: An Observational Study in Pavia, Northern Italy. J. Nutr. Food Sci. 2013, 3, 1–6. [Google Scholar] [CrossRef]
- Angeles-Agdeppa, I.; Neufingerl, N.; Magsadia, C.; Hiemstra, H.; Patalen, C.; Eilander, A. Energy and Nutrient Intake and Acceptability of Nutritionally Balanced School Meals in Filipino Students. Food Nutr. Bull. 2014, 35, 361–371. [Google Scholar] [CrossRef] [PubMed]
- de Valeriani, T.S.M.; Sturion, G.L. Índices de Adesão e Aceitação No Programa de Alimentação Escolar Com Gestão Escolarizada. Rev. Hig. Aliment. 2014, 28, 212. [Google Scholar]
- Carlini, N.R.B.S.; da Costa, F.F.P.; dos Mesquita, R.V.S.C. Aceitabilidade e Adesão à Alimentação Escolar Por Estudantes Do IF Sertão Pernambucano—Campus Salgueiro. Rev. Semiárido Visu 2015, 3, 3–10. [Google Scholar] [CrossRef]
- Smith, S.L. It’s Not Healthy If They Don’t Eat It: School Lunch Plate Waste and Strategies to Increase Vegetable Consumption. Ph.D. Thesis, Colorado State University, Fort Collins, CO, USA, 2015. [Google Scholar]
- Tuorila, H.; Palmujoki, I.; Kytö, E.; Törnwall, O.; Vehkalahti, K. School Meal Acceptance Depends on the Dish, Student, and Context. Food Qual. Prefer. 2015, 46, 126–136. [Google Scholar] [CrossRef]
- Ferreira, N.C.; da Sales, G.S.; Coelho, F.B.; de Moreira, R.A.M.; Schott, E.; Martins, M.L.B. Aceitabilidade Da Alimentação Oferecida Pelo Programa Nacional de Alimentação Escolar No Municópio de Palmas-TO. Rev. Cereus 2015, 7, 150. [Google Scholar]
- Smith, S.; Cunningham-Sabo, L.; Auld, G. Satisfaction of Middle School Lunch Program Participants and Non-Participants with the School Lunch Experience. J. Child Nutr. Manag. 2015, 39, n2. [Google Scholar]
- Silva, M.V.; Nascimento, M.C.P.S.; de Oliveira, J.B.; Fontan, G.C.R. Accession Assessment and Acceptability of the School Feeding Program Menus in Municipal Schools in Itapetinga—BA: Food Waste Indicators. Rev. Eletrônica Gestão Educ. Tecnol. Ambient. 2016, 20, 73. [Google Scholar] [CrossRef]
- Silva, M.F.P.; Barros, J.D.S. School Feeding: Accession and Acceptability of School Meals for Students of Youth and Adult Education in Cajazeiras, Paraíba, Brazil. Int. J. Res. Soc. Sci. 2016, 6, 94–101. [Google Scholar]
- Maietta, O.W.; Gorgitano, M.T. School Meals and Pupil Satisfaction. Evidence from Italian Primary Schools. Food Policy 2016, 62, 41–55. [Google Scholar] [CrossRef]
- Bez, A. Aceitação Da Alimentação e Análise Do Cardápio Escolar de Uma Escola Municipal De Francisco Beltrão-PR. Rev. Assoc. Bras. Nutr. RASBRAN 2017, 2, 12–19. [Google Scholar]
- da Silva, M.X.; de Brandão, B.C.O.; Accioly, E.; da Pierucci, A.P.T.R.; Pedrosa, C. Can Food Education in Public Schools Improve Knowledge About Food and Promote the Acceptance of Meals Planned by the National School Feeding Program? DEMETRA Aliment. Nutr. Saúde 2017, 12, 865–879. [Google Scholar] [CrossRef]
- Pedraza, D.F.; de Melo, N.L.S.; Araújo, É.M.N.; Silva, F.A. The National School Feeding Program in Public Schools. Rev. Bras. Promoção Saúde 2017, 30, 161–169. [Google Scholar] [CrossRef]
- de Raphaelli, C.O.; Passos, L.D.F.; de Couto, S.F.; Helbig, E.; Madruga, S.W. Adhesion and Acceptability of Elementary School Menus in Rural Schools Chirle. Braz. J. Food Technol. 2017, 20. [Google Scholar] [CrossRef]
- JUNAEB. Informe Final de Satisfacción 2016. “Estudio Evaluación de La Satisfacción de los Usuarios del Programa de Alimentación Escolar—JUNAEB”. Available online: https://www.junaeb.cl/wp-content/uploads/2013/02/INFORME-FINAL-SATISFACCIÓN-2016-1.pdf (accessed on 23 January 2023).
- Rocha, N.P.; Filgueiras, M.; De S Albuquerque, F.M.; de Milagres, L.C.; Castro, A.P.P.; Silva, M.A.; da Costa, G.D.; Priore, S.E.; de Novaes, J.F. Análise Do Programa Nacional de Alimentação Escolar No Município de Viçosa, MG, Brasil. Rev. Saude Publica 2018, 52, 16. [Google Scholar] [CrossRef]
- de Souza, Á.M.; Rosas, L.V.; de Almeida, R.; dos Santos, V.S.; Lima, R.A. Análise De Aceitação E Rejeição Da Merenda Escolar Oferecida Aos Alunos Do Ensino Básico Do Município De Atalaia Do Norte-Am, Brasil. South Am. J. Basic Educ. Tech. Technol. 2018, 5. [Google Scholar]
- Daniel, M.M.; Moreira, D.C.F. Avaliação Da Adesão, Qualidade e Aceitabilidade Da Alimentação Escolar Entre Os Alunos Das Escolas Municipais de Três Pontas-Mg. Saúde Rev. 2018, 18, 55–65. [Google Scholar] [CrossRef]
- Beintema, J.J.S.; Gallego-Castillo, S.; Londoño-Hernandez, L.F.; Restrepo-Manjarres, J.; Talsma, E.F. Scaling-up Biofortified Beans High in Iron and Zinc through the School-Feeding Program: A Sensory Acceptance Study with Schoolchildren from Two Departments in Southwest Colombia. Food Sci. Nutr. 2018, 6, 1138–1145. [Google Scholar] [CrossRef]
- de Souza, V.R.; Ferreira, A.B.; de São José, J.F.B.; da Silva, É.M.M.; Silva, D.A. Influence of Intervention on the Menu’s Nutritional and Sensorqualities and on the Food Waste of Children’s Education Center. Cienc. Saude Coletiva 2019, 24, 411–418. [Google Scholar] [CrossRef] [PubMed]
- Niño-Bautista, L.; Gamboa-Delgado, E.M.; Serrano-Mantilla, T. Perception of Satisfaction among Beneficiaries of the School Food Program of Bucaramanga-Colombia. Rev. Univ. Ind. Santander. Salud 2019, 51, 240–250. [Google Scholar] [CrossRef]
- Lee, K.E. Students’ Dietary Habits, Food Service Satisfaction, and Attitude toward School Meals Enhance Meal Consumption in School Food Service. Nutr. Res. Pract. 2019, 13, 555–563. [Google Scholar] [CrossRef] [PubMed]
- USDA. School Nutrition and Meal Cost Study Final Report Volume 1: School Meal Program Operations and School Nutrition Environments; USDA: Washington, DC, USA, 2019; Volume 4. [Google Scholar]
- Assan, J.K.; Simon, L.; Kharisma, D.D.; Adaboh, A.A.; Assan, N.; Al Mamun, A. Assessing the Impact of Public-Private Funded Midday Meal Programs on the Educational Attainment and Well-Being of School Children in Uttar Pradesh, India. CASTE Glob. J. Soc. Exclusion 2020, 1, 193–214. [Google Scholar] [CrossRef]
- Joyce, J.M.; Harris, K.; Mailey, E.L.; Rosenkranz, R.R.; Rosenkranz, S.K. Acceptability and Feasibility of Best Practice School Lunches by Elementary School-Aged Children in a Serve Setting: A Randomized Crossover Trial. Int. J. Environ. Res. Public Health 2020, 17, 6299. [Google Scholar] [CrossRef]
- Peres, F.D.; Andrade, P.A.D.; Valentim, J.K.; Parreira, D.P.; de Oliveira, D.S.; de Paula, K.L.C.; Mendes, J.P.; Pietramale, R.T.R.; Ziemniczak, H.M. Acceptability of Goat’s Milk in High and Elementary School Networks. Acta Sci. 2020, 42, 1–6. [Google Scholar] [CrossRef]
- Guimarães, A.R.D. Análise Quali-Quantitativa Da Alimentação Escolar Na Rede de Ensino Em Um Município Baiano/Quali-Quantitative Analysis of School Feeding in the Teaching Network in a Baian Municipality. Braz. J. Health Rev. 2020, 3, 15054–15064. [Google Scholar] [CrossRef]
- Donadini, G.; Spigno, G.; Porretta, S. Preschooler Liking of Meal Components: The Impact of Familiarity, Neophobia, and Sensory Characteristics. J. Sens. Stud. 2021, 36, e12649. [Google Scholar] [CrossRef]
- Araya, M.; Castillo-Montes, M. Aceptabilidad de Los Almuerzos Del Programa de Alimentación Escolar y Estimaciones de Pérdidas Económicas Asociadas En La Comuna de Coquimbo, Chile. Rev. Chil. Nutr. 2021, 48, 908–916. [Google Scholar] [CrossRef]
- Donadini, G.; Spigno, G.; Fumi, M.D.; Porretta, S. School Lunch Acceptance in Pre-Schoolers. Liking of Meals, Individual Meal Components and Quantification of Leftovers for Vegetable and Fish Dishes in a Real Eating Situation in Italy. Int. J. Gastron. Food Sci. 2022, 28, 100520. [Google Scholar] [CrossRef]
- Pinto, R.L. Efetividade de Intervenção Multicomponente Na Adesão e Aceitabilidade à Alimentação Escolar: Ensaio Randomizado de Base Escolar de Múltiplos Braços Em Sumidouro—RJ; Universidade do Estado do Rio de Janeiro: Rio de Janeiro, Brazil, 2022. [Google Scholar]
- Yamaguchi, M.; Takagi, A. School-Based Feeding Program for Undernourished Children in the Philippines. Jpn. J. Nutr. Diet. 2018, 76, S98–S104. [Google Scholar] [CrossRef]
- Cupertino, A.; Ginani, V.; Cupertino, A.P.; Braz, R. School Feeding Programs: What Happens Globally? Int. J. Environ. Res. Public Health 2022, 19, 2265. [Google Scholar] [CrossRef]
- FNDE; Ministério da Educação. Resolução N°26 de 17 de Junho de 2013.Dispõe Sobre o Atendimento da Alimentação Escolar Aos Alunos Da Educação Básica No Âmbito Do Programa Nacional de Alimentação Escolar—PNAE. Diário Of. União 2013, 18, 1–44. [Google Scholar]
- da Gomes, V.S. Desempenho do Modelo Anova Comparado a Testes Estatísticos Não-Paramétricos No Tratamento dos Resultados de Testes de Escala Hedônica; Universidade Federal Fluminense: Niterói, Brazil, 2011. [Google Scholar]
- Silva, A.C.C.; da Silva, N.A.; Pereira, M.C.S.; Vassimon, H.S. Foods Containing Functional Ingredients in Its Formulation Are Healthy? A Review of Article Published in Brazilian Journals. Rev. Conex. Ciência 2016, 11, 133–144. [Google Scholar]
- Lévy, C.M.; Köster, E.P. The Relevance of Initial Hedonic Judgements in the Prediction of Subtle Food Choices. Food Qual. Prefer. 1999, 10, 185–200. [Google Scholar] [CrossRef]
- Lawless, H.T.; Cardello, A.V.; Chapman, K.W.; Lesher, L.L.; Given, Z.; Schutz, H.G. A Comparison of the Effectiveness of Hedonic Scales and End-Anchor Compression Effects. J. Sens. Stud. 2010, 25, 18–34. [Google Scholar] [CrossRef]
- Mihafu, F.D.; Issa, J.Y.; Kamiyango, M.W. Implication of Sensory Evaluation and Quality Assessment in Food Product Development: A Review. Curr. Res. Nutr. Food Sci. 2020, 8, 690–702. [Google Scholar] [CrossRef]
- Ruiz-Capillas, C.; Herrero, A.M.; Pintado, T.; Delgado-Pando, G. Sensory Analysis and Consumer Research in New Meat Products Development. Foods 2021, 10, 429. [Google Scholar] [CrossRef]
- Bergara-Almeida, S.; Aparecida, M.; Da Silva, A.P. Hedonic Scale with Reference: Performance in Obtaining Predictive Models. Food Qual. Prefer. 2002, 13, 57–64. [Google Scholar] [CrossRef]
- Daroub, H.; Olabi, A.; Toufeili, I. Designing and Testing of an Arabic Version of the Hedonic Scale for Use in Acceptability Tests. Food Qual. Prefer. 2010, 21, 33–43. [Google Scholar] [CrossRef]
- Yang, J.; Lee, J. Korean Consumers’ Acceptability of Commercial Food Products and Usage of the 9-Point Hedonic Scale. J. Sens. Stud. 2018, 33, e12467. [Google Scholar] [CrossRef]
- Popper, R.; Kroll, J.J. Consumer Testing of Food Products Using Children; Woodhead Publishing Limited: Sawston, UK, 2011. [Google Scholar]
- Jaeger, S.R.; Ares, G. Dominant Meanings of Facial Emoji: Insights from Chinese Consumers and Comparison with Meanings from Internet Resources. Food Qual. Prefer. 2017, 62, 275–283. [Google Scholar] [CrossRef]
- Swaney-Stueve, M.; Jepsen, T.; Deubler, G. The Emoji Scale: A Facial Scale for the 21st Century. Food Qual. Prefer. 2018, 68, 183–190. [Google Scholar] [CrossRef]
- Howe, S.M. Factors Differentiating Participants and Non-Participants of the National School Lunch Program; Kansas State University: Manhattan, KS, USA, 1979. [Google Scholar]
- Manual Para Aplicação Dos Testes de Aceitabilidade No PNAE—Portal do FNDE. Available online: https://www.fnde.gov.br/component/k2/item/5166-manual-para-aplica%C3%A7%C3%A3o-dos-testes-de-aceitabilidade-no-pnae (accessed on 30 November 2022).
- Miller, M.B. Food Acceptance and Attitudes toward Healthier School Lunches for Third Grade Students in the Beaumont Independent School District; Lamar University: Beaumont, TX, USA, 1996. [Google Scholar]
- Borgers, N.; Hox, J.; Sikkel, D. Response Quality in Survey Research with Children and Adolescents: The Effect of Labeled Response Options and Vague Quantifiers. Int. J. Public Opin. Res. 2003, 15, 83–94. [Google Scholar] [CrossRef]
- Bell, A. Designing and Testing Questionnaires for Children. J. Res. Nurs. 2007, 12, 461–469. [Google Scholar] [CrossRef]
- Haddad, S.; King, S.; Osmond, P.; Heidari, S. Questionnaire Design to Determine Children’s Thermal Sensation, Preference and Acceptability in the Classroom. In Proceedings of the 28th International PLEA Conference on Sustainable Architecture + Urban Design: Opportunities, Limits and Needs—Towards an Environmentally Responsible Architecture, PLEA, Lima, Peru, 7–9 November 2012. [Google Scholar]
- Davies, V.F. Validação de um Questionário On-Line de Avaliação do Consumo Alimentar de Crianças de 7 A 10 Anos Tese; Universidade Federal de Santa Catarina: Florianópolis, Brazil, 2014. [Google Scholar]
- Fargas-Malet, M.; McSherry, D.; Larkin, E.; Robinson, C. Research with Children: Methodological Issues and Innovative Techniques. J. Early Child. Res. 2010, 8, 175–192. [Google Scholar] [CrossRef]
- Lefevre, F.; Lefevre, A.M.C. O Sujeito Coletivo Que Fala. Interface Comun. Saúde Educ. 2006, 10, 517–524. [Google Scholar] [CrossRef]
- Lemos, I.C.S.; de Araújo Delmondes, G.; de Queiroz Dias, D.; de Menezes, I.R.A.; Fernandes, G.P.; Kerntopf, M.R. Discourse of the Collective Subject as a Method for Analysis of Data in Ethnobiological Research. In Methods and Techniques in Ethnobiology and Ethnoecology. Springer Protocols Handbooks; Albuquerque, U., de Lucena, R., Cruz da Cunha, L., Alves, R., Eds.; Humana Press: New York, NY, USA, 2019. [Google Scholar] [CrossRef]
- Delgado, L.M.M. Uso da Plataforma Moodle Como Apoio Ao Ensino Presencial: Um Estudo De Caso; Faculdade de Letras-UFRJ: Rio de Janeiro, Brazil, 2009. [Google Scholar]
- Guerra, L.D. da S.; Cervato-Mancuso, A.M.; Bezerra, A.C.D. Food: A Disputed Human Right—A Thematic Focus for Comprehension and Action in Food and Nutritional Security. Cienc. Saude Coletiva 2019, 24, 3369–3394. [Google Scholar] [CrossRef]
- de Castro, H.A.S.; da Silva, E.J.; da Dias, L.N.S.; Schimith, C.D. Challenges to School Food Advice Activities. Rev. Amaz. Organ. Sustentabilidade 2020, 9, 32. [Google Scholar] [CrossRef]
- Gallina, L.S.; Teo, C.R.P.A.; Munaro, P.S.; de Oliveira, V.S.H. Representations on Food Security in the Speeches of a Council of School Feeding. Saúde Soc. 2012, 21, 89–102. [Google Scholar] [CrossRef]
- Mendonça, P.R.; Slob, E.M.G.B. Hygienic-Sanitary Conditions in School Food and Nutrition Units: Literature Review. Rev. Saúde Desenvolv. 2020, 4. [Google Scholar]
- Santos, L.M.P.; Dos Santos, S.M.C.; Santana, L.A.A.; Henrique, F.C.S.; Mazza, R.P.D.; Santos, L.A.D.S.; Dos Santos, L.S. Evaluation of Food Security and Anti-Hunger Public Policies in Brazil, 1995-2002. 4—National School Nutrition Program. Cad. Saude Publica 2007, 23, 2681–2693. [Google Scholar] [CrossRef] [PubMed]
- Alfaro, B.; Rios, Y.; Arranz, S.; Varela, P. Understanding Children’s Healthiness and Hedonic Perception of School Meals via Structured Sorting. Appetite 2020, 144, 104466. [Google Scholar] [CrossRef]
- Kjosen, M.; Moore, C.; Cullen, K. Middle School Student Perceptions of School Lunch Following Revised Federal School Meal Guidelines. J. Child Nutr. Manag. 2015, 39. [Google Scholar]
- Meyer, M.K. Upper-Elementary Students’ Perception of School Meals. J. Child Nutr. Manag. 2005, 29. [Google Scholar]
- Birch, L.L.; Fisher, J.O. Development of Eating Behaviour among Children. Pediatrics 1998, 101, 539–549. [Google Scholar] [CrossRef]
- Taylor, J.P.; Evers, S.; McKenna, M. Determinants of Healthy Eating in Children and Youth. Can. J. Public Health 2005, 96, S22–S29. [Google Scholar] [CrossRef]
- Risvas, G.; Panagiotakos, D.B.; Zampelas, A. Factors Affecting Food Choice in Greek Primary-School Students: ELPYDES Study. Public Health Nutr. 2008, 11, 639–646. [Google Scholar] [CrossRef]
- Shepherd, R. Social Determinants of Food Choice. Proc. Nutr. Soc. 1999, 58, 807–812. [Google Scholar] [CrossRef]
- Cervato-Mancuso, A.M.; Westphal, M.F.; Araki, E.L.; Bógus, C.M. School Feeding Programs’ Role in Forming Eating Habits. Rev. Paul. Pediatr. 2013, 31, 324–330. [Google Scholar] [CrossRef]
- Rossi, A.; Moreira, E.A.M.; Rauen, M.S. Determinants of Eating Behavior: A Review Focusing on the Family. Rev. Nutr. 2008, 21, 739–748. [Google Scholar] [CrossRef]
- da Silva, T.F.; Vieira, V.B.R. Adesão e Adeitabilidade de Preparações Do Cardápio de Uma Escola Municipal Do Interior Do Estado de São Paulo/SP. Rev. Científica UNILAGO 2019, 1, 1–10. [Google Scholar]
- da Bodonese, M.C.S. Avaliação Do Estado Nutricional de Escolares Da Rede Estadual de Ensino de Cuiabá e Várzea Grande, MT e Sua Relação Com a Adesão à Alimentação Escolar; Universidade Federal de Mato Grosso: Cuiabá, Brazil, 2019. [Google Scholar]
Disclaimer/Publisher’s Note: The statements, opinions and data contained in all publications are solely those of the individual author(s) and contributor(s) and not of MDPI and/or the editor(s). MDPI and/or the editor(s) disclaim responsibility for any injury to people or property resulting from any ideas, methods, instructions or products referred to in the content. |
© 2023 by the authors. Licensee MDPI, Basel, Switzerland. This article is an open access article distributed under the terms and conditions of the Creative Commons Attribution (CC BY) license (https://creativecommons.org/licenses/by/4.0/).