
Effects of Bilateral Extracephalic Transcranial Direct Current Stimulation on Lower Limb Kinetics in Countermovement Jumps


Abstract
1. Introduction
2. Methods
2.1. Participants
2.2. Experimental Protocol
2.3. Intervention
2.4. Data Collection
2.4.1. Sagittal Kinematics Data
2.4.2. 3D Force Plates
2.5. Data Analysis
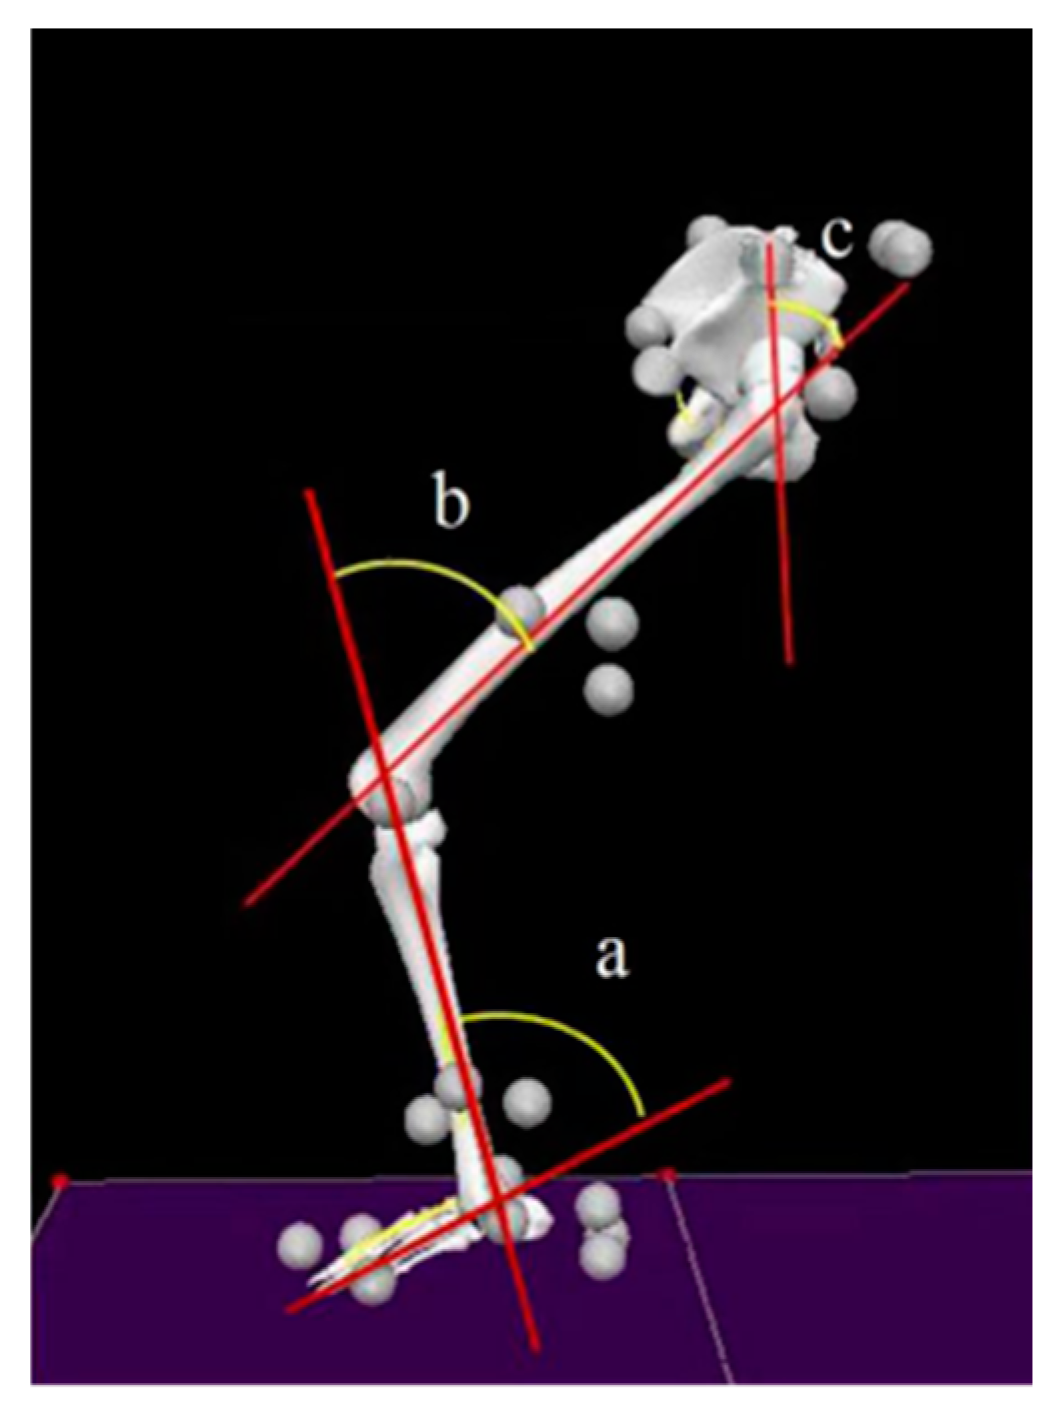
2.5.1. Sagittal Plane Kinematics
2.5.2. Joint Kinetics
2.5.3. Joint Energy
2.6. Statistical Analysis
3. Results
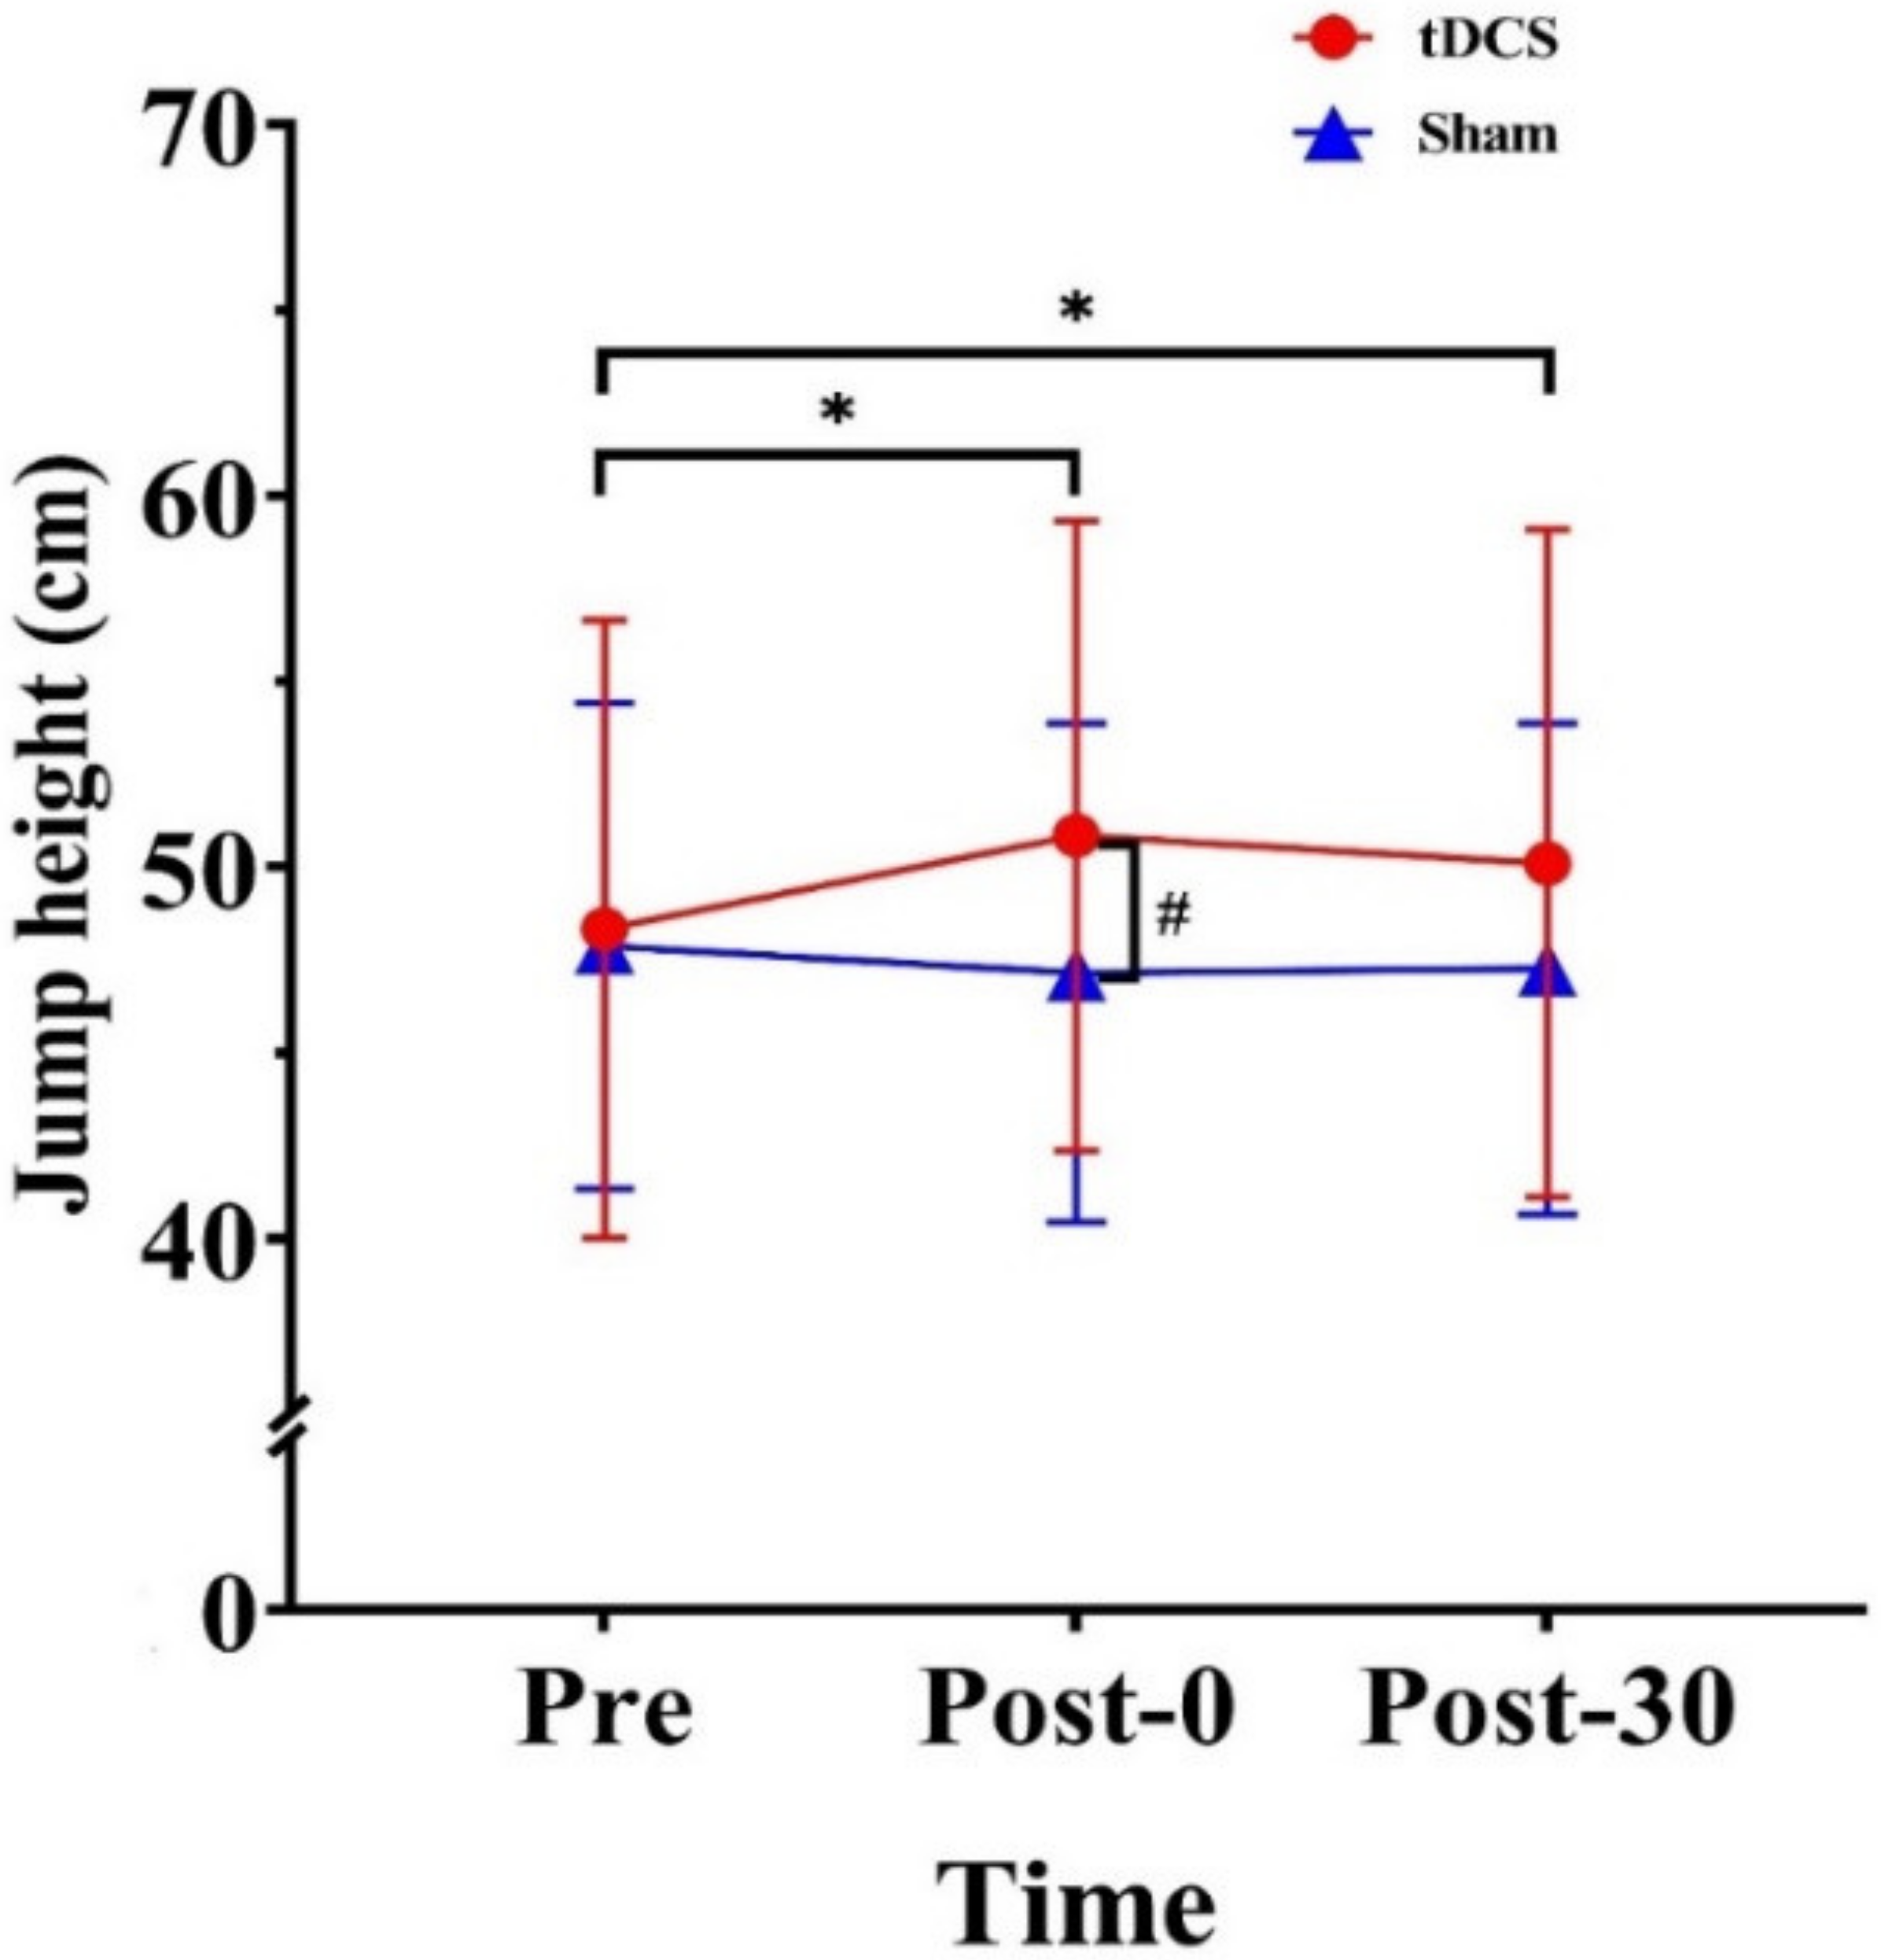
3.1. Jump Height
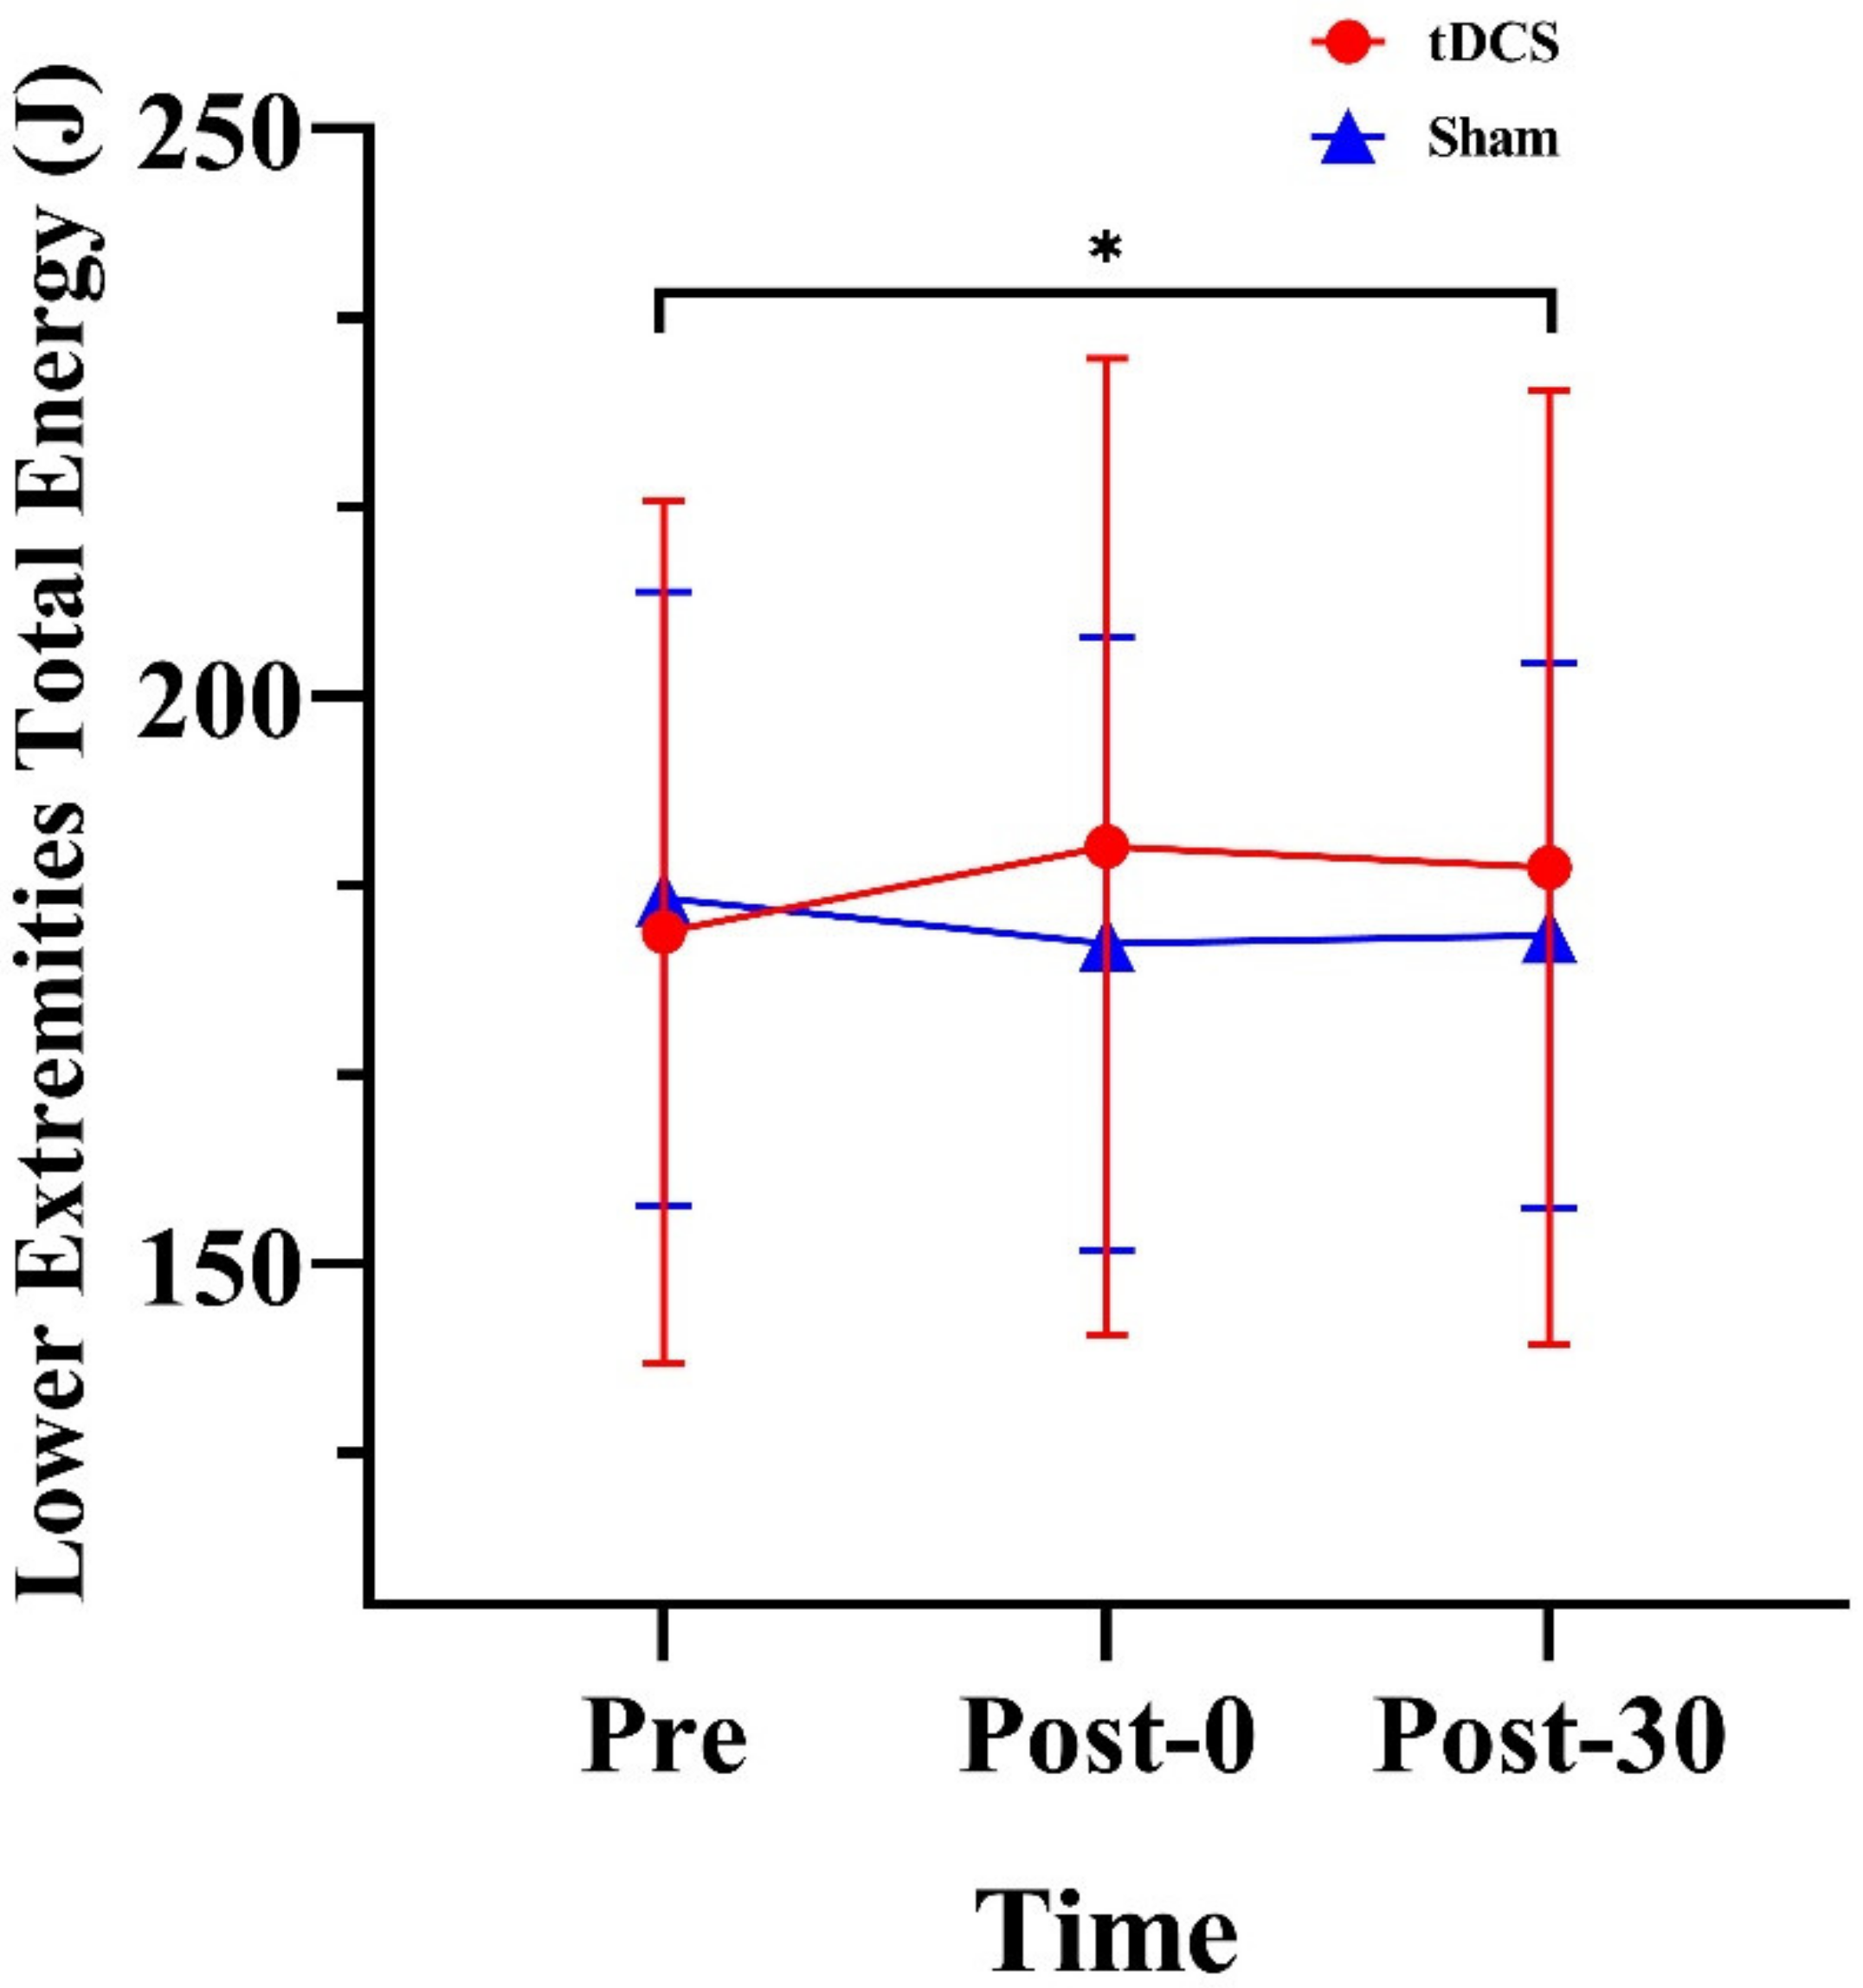
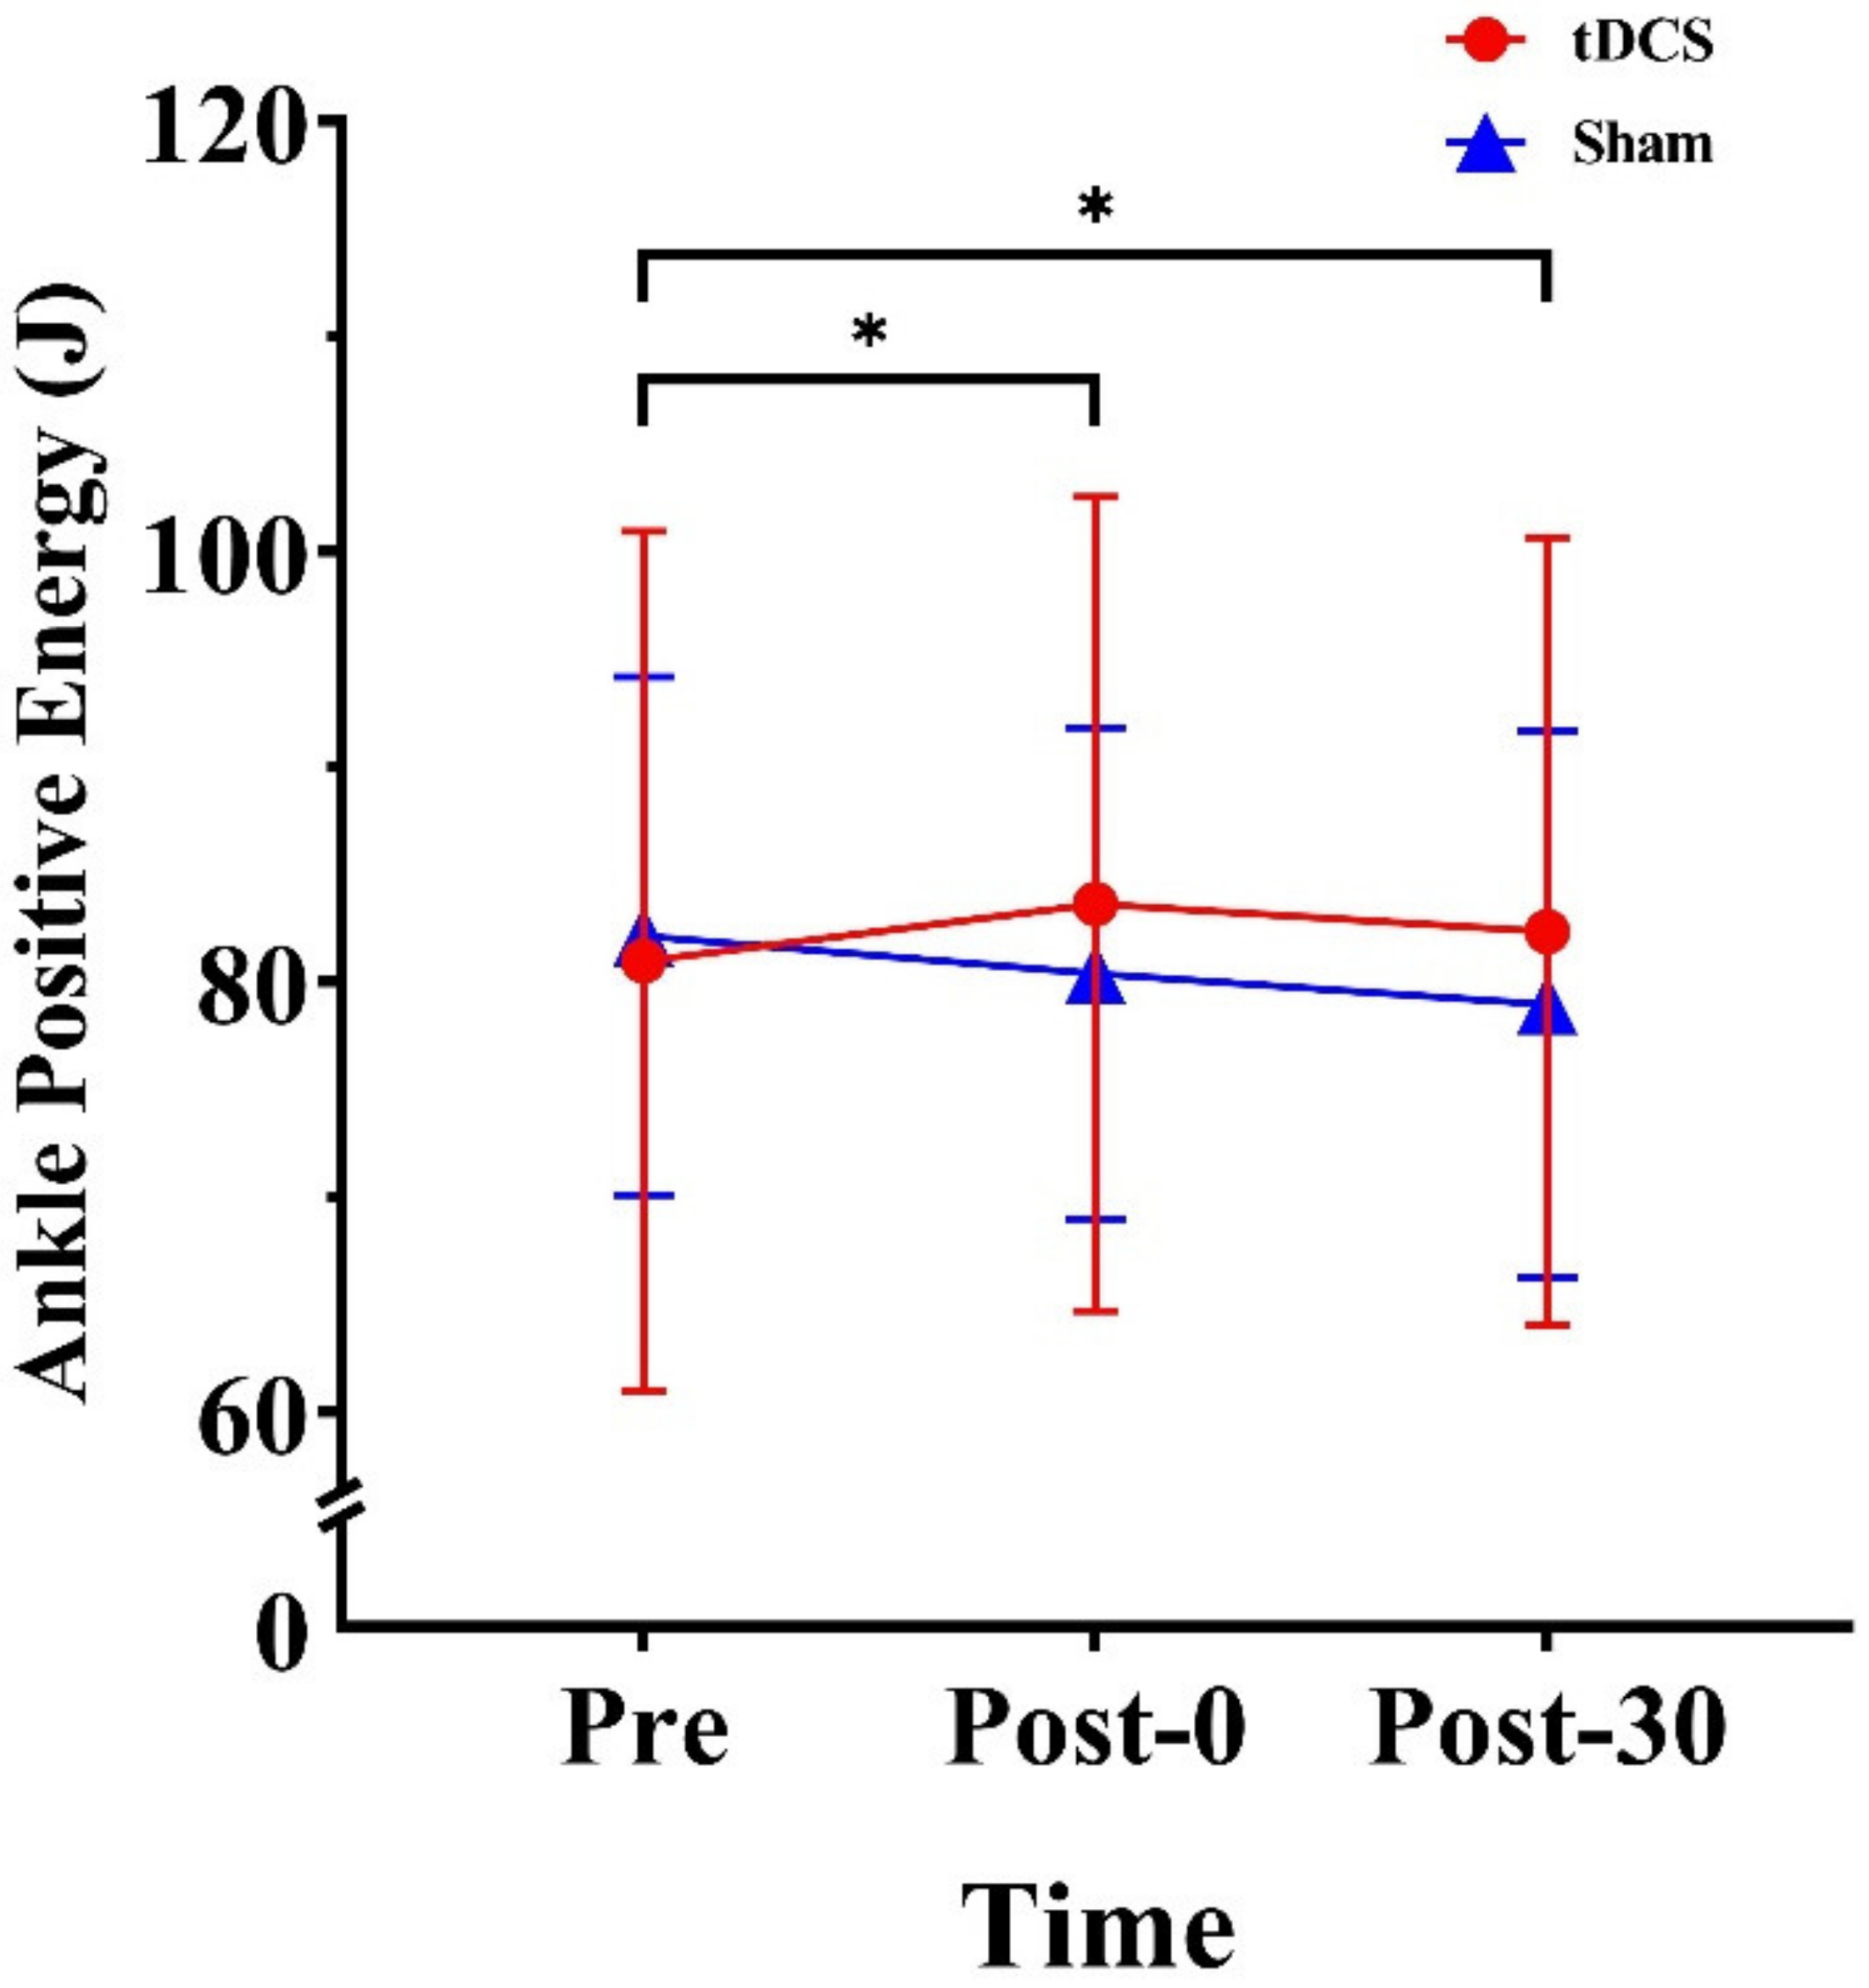
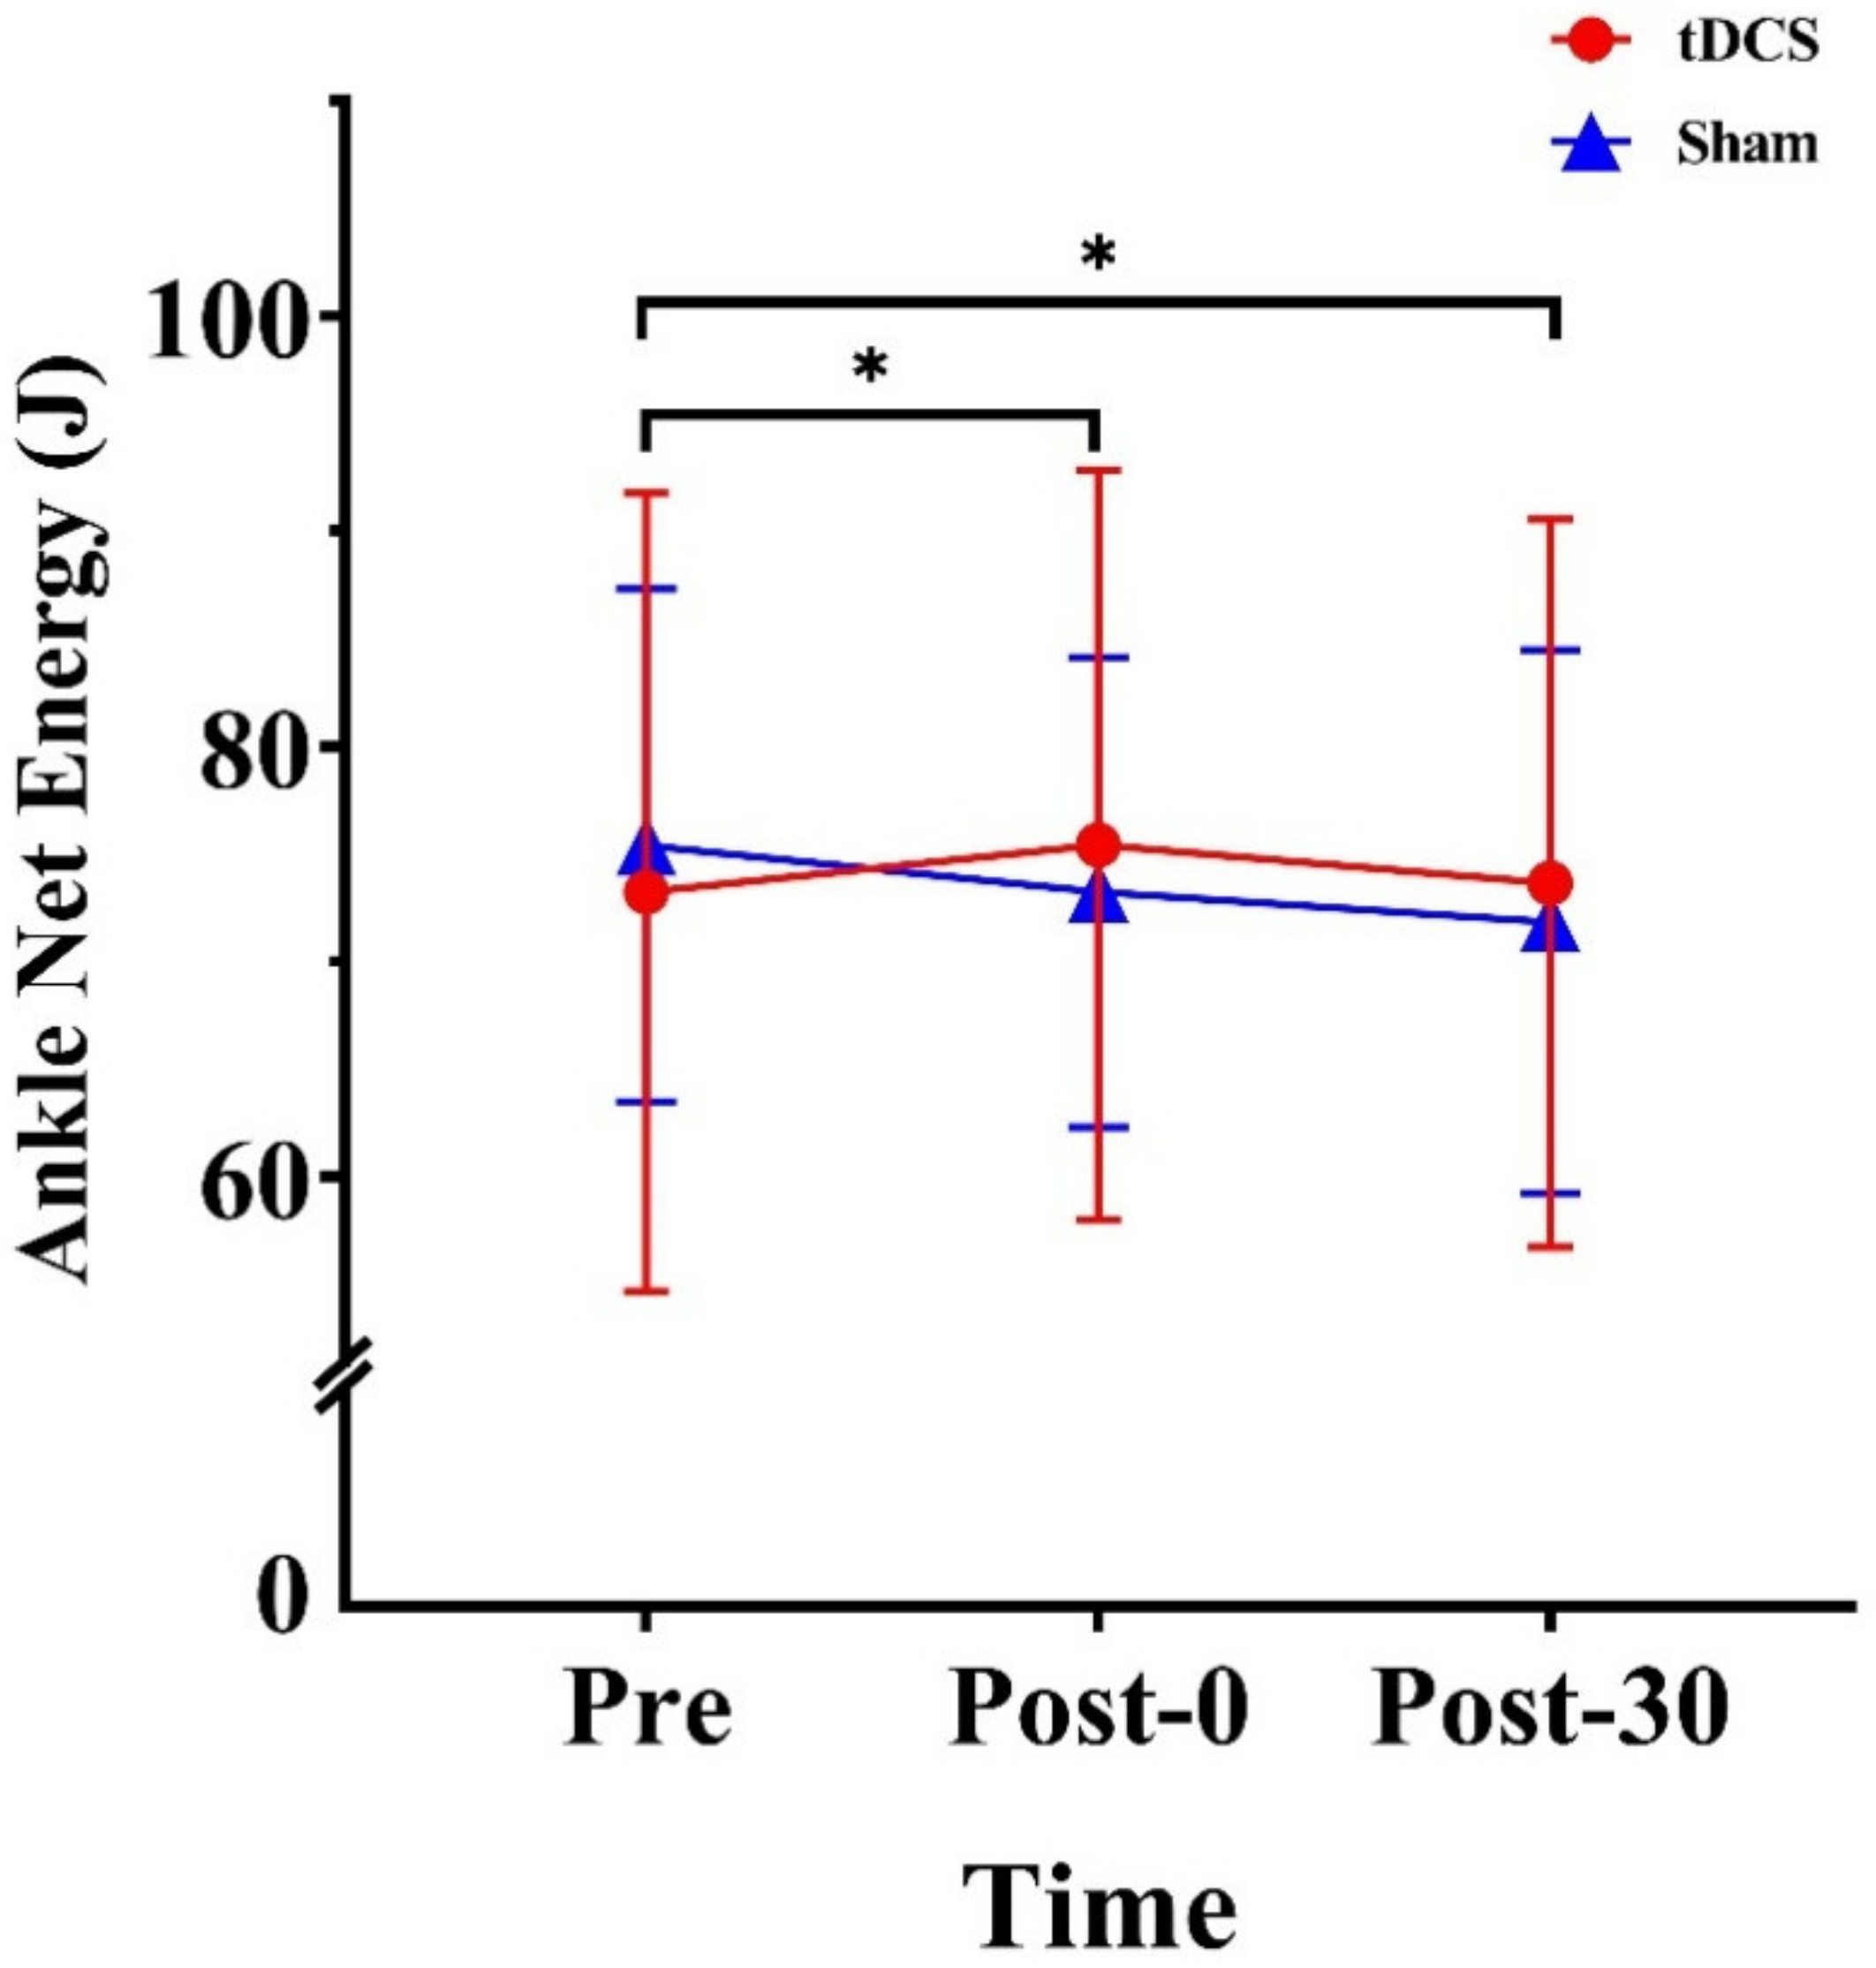
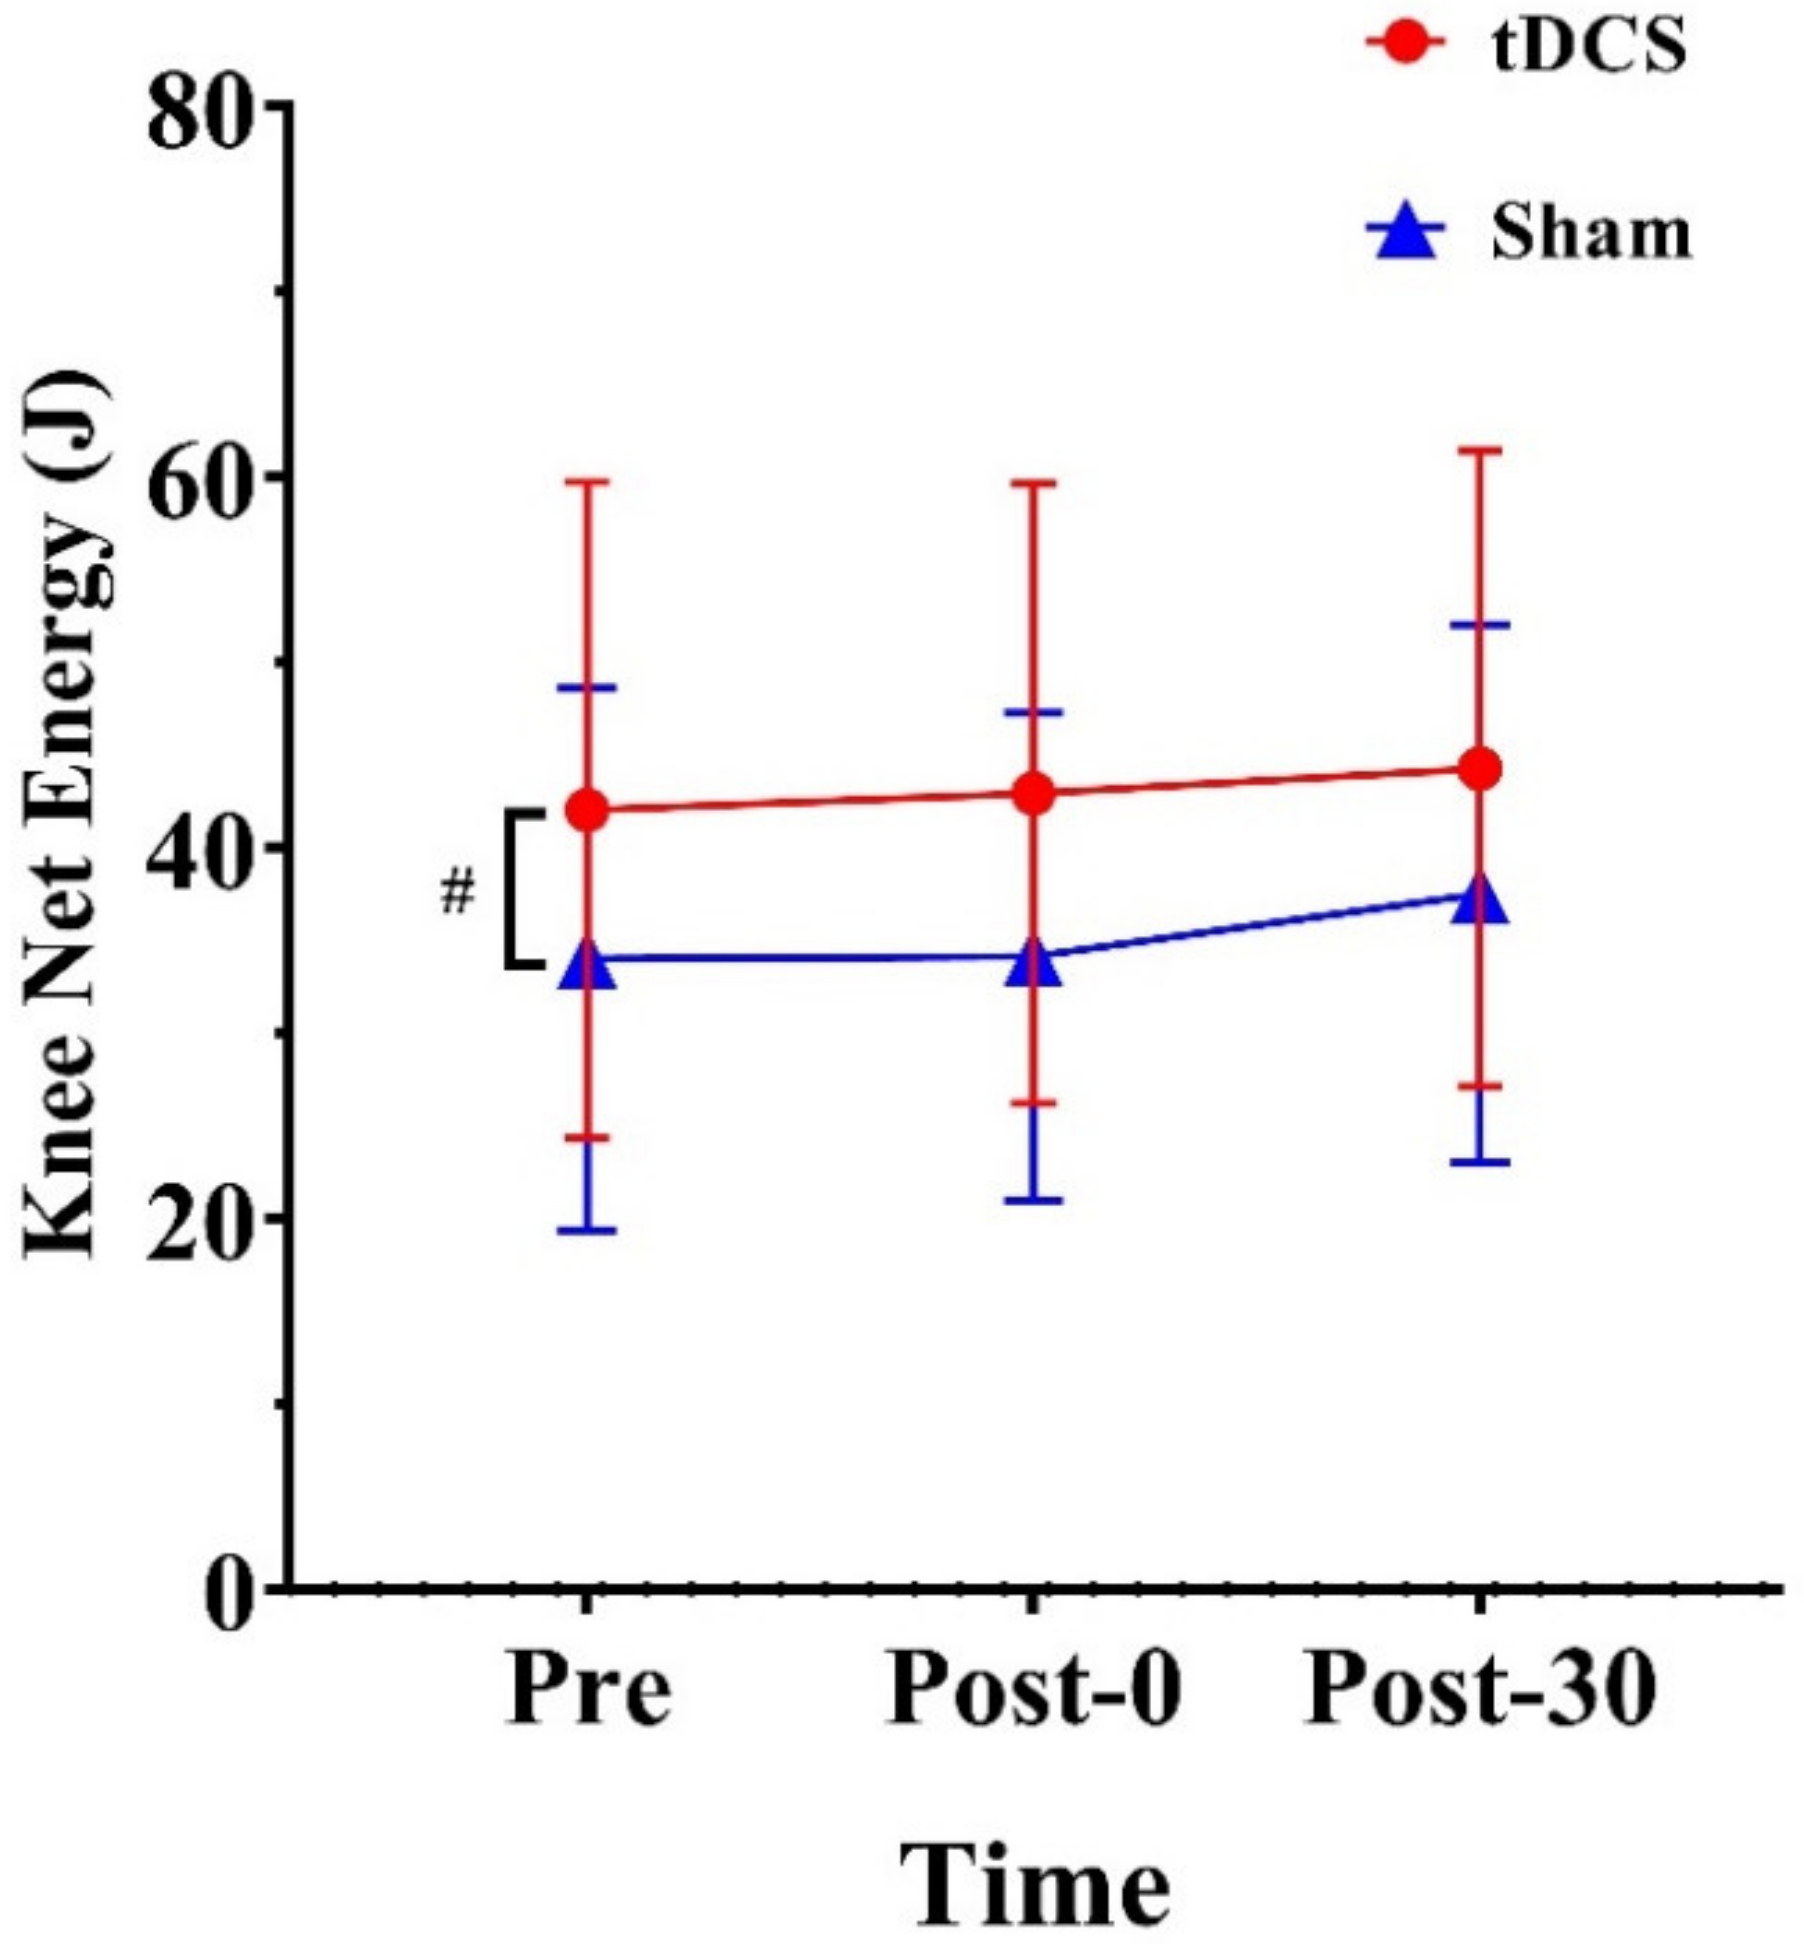
3.2. Energy of the Lower Extremities
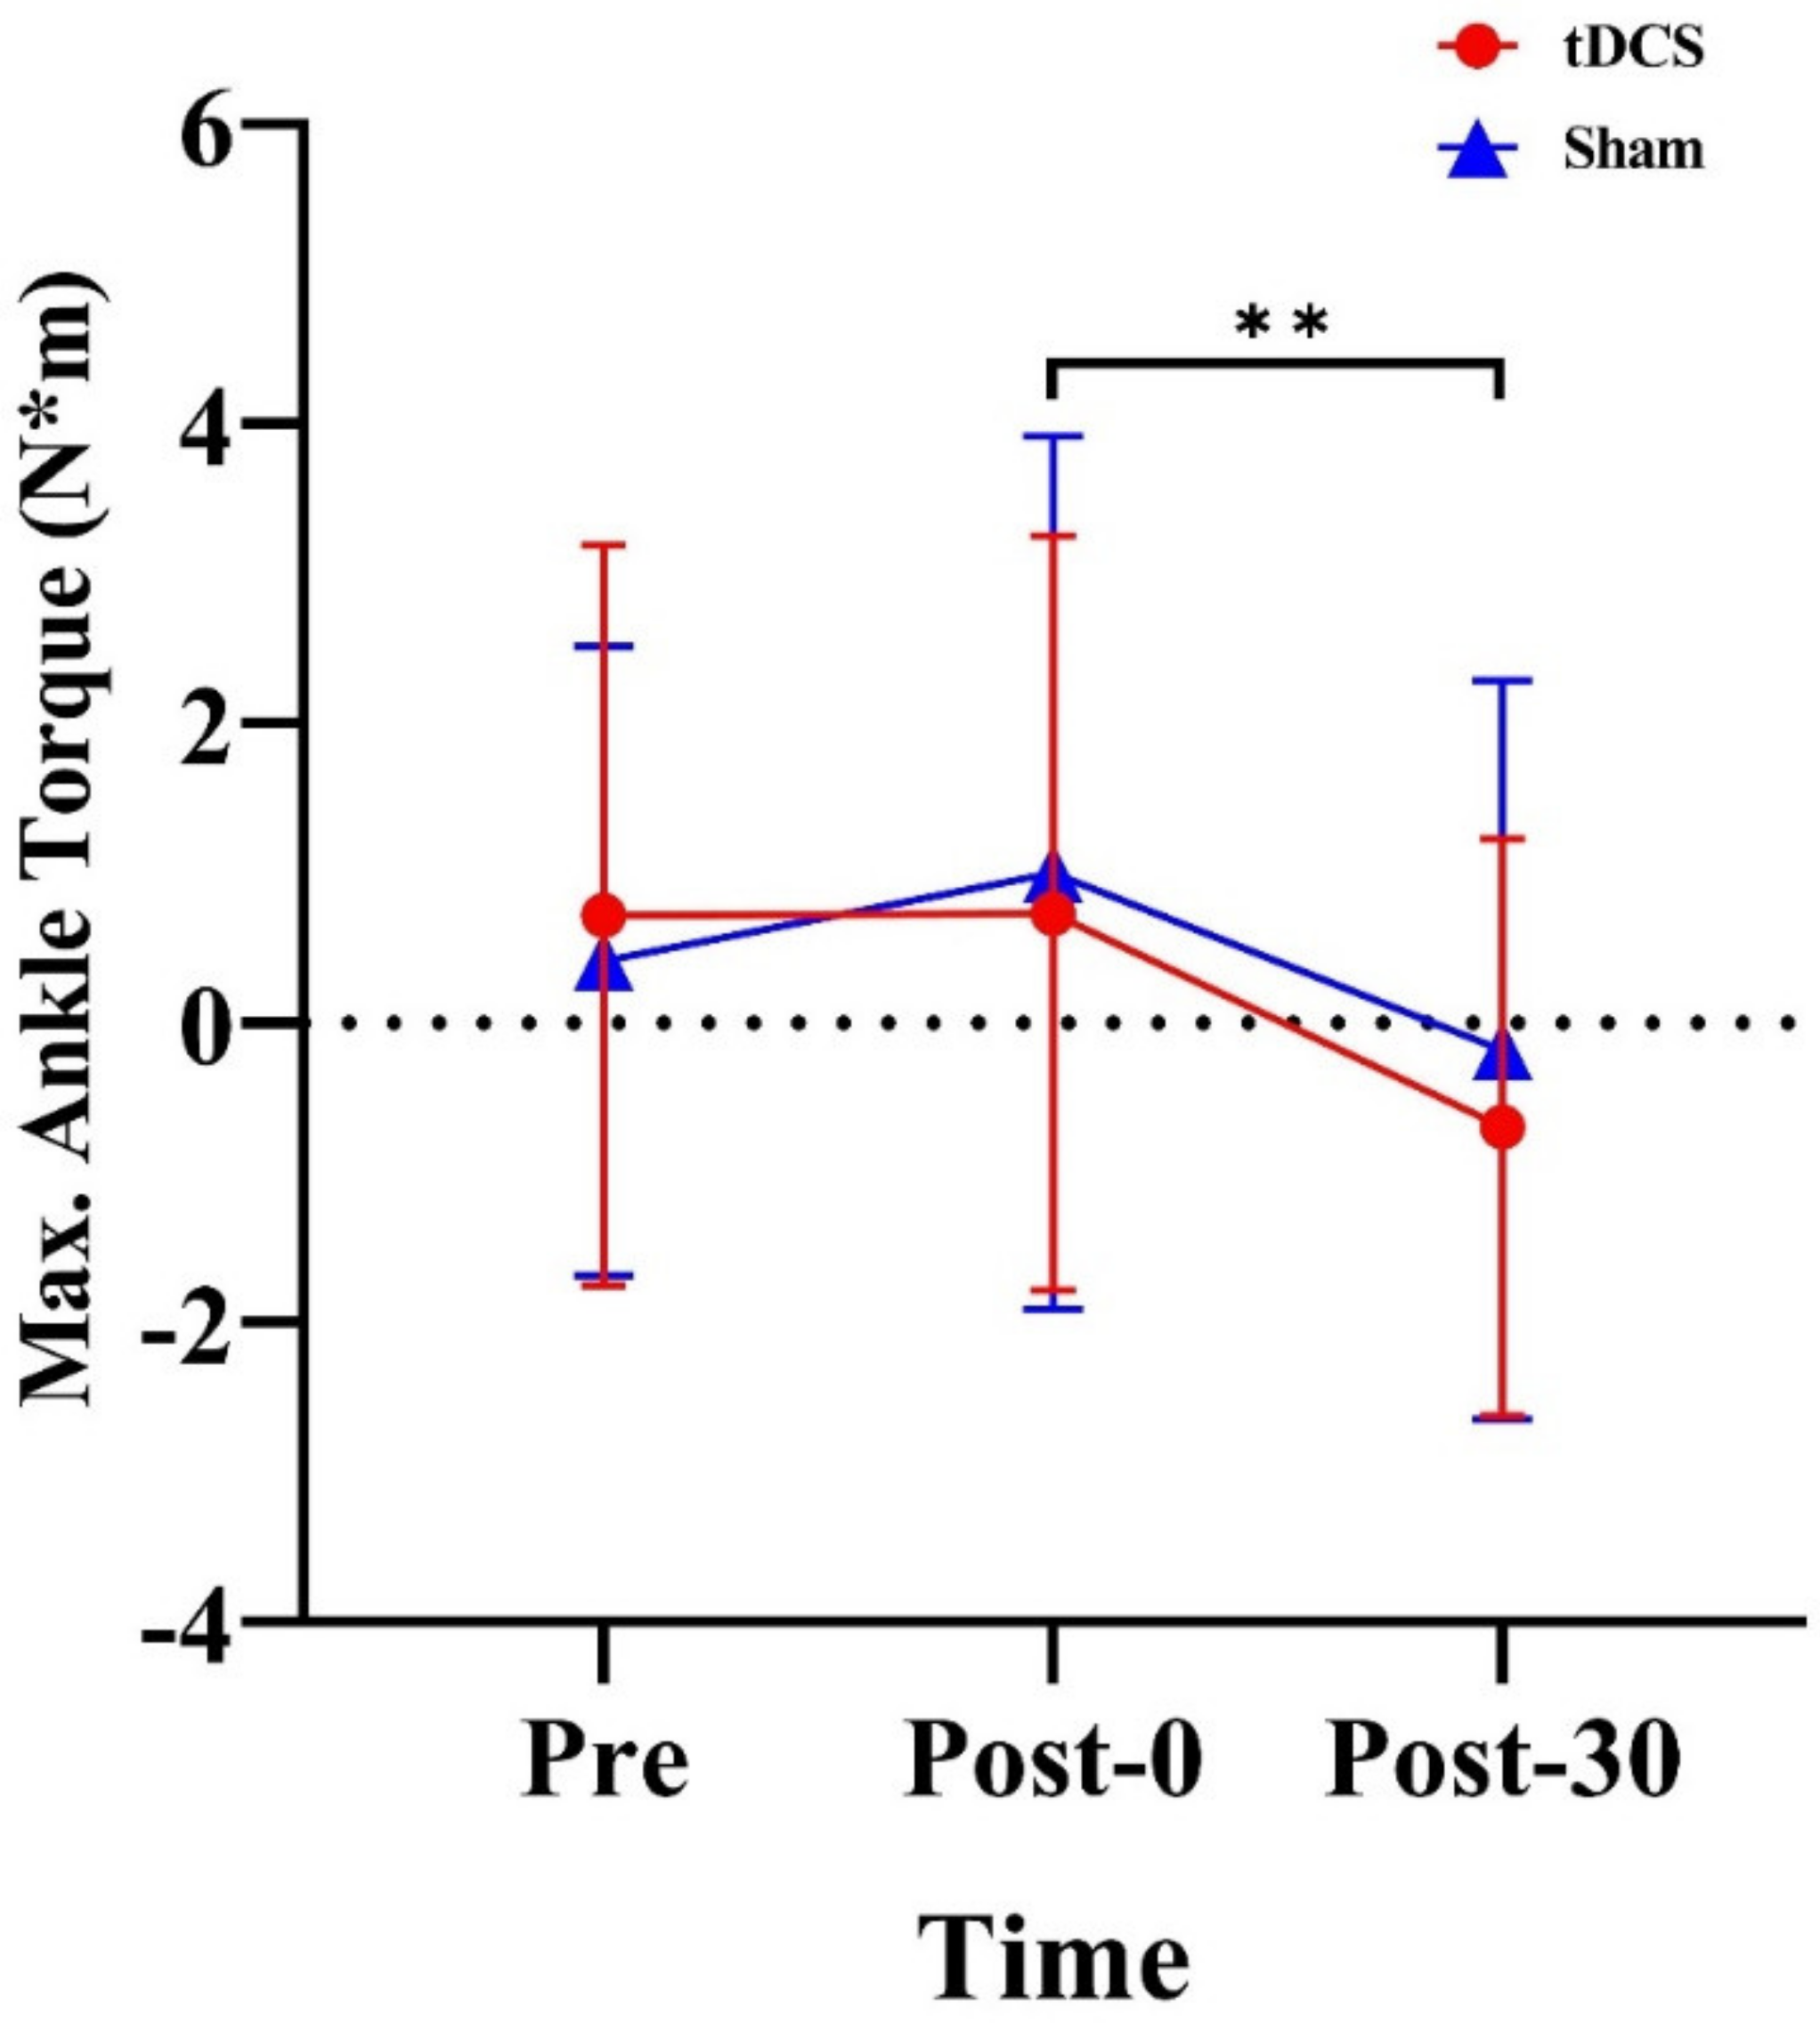
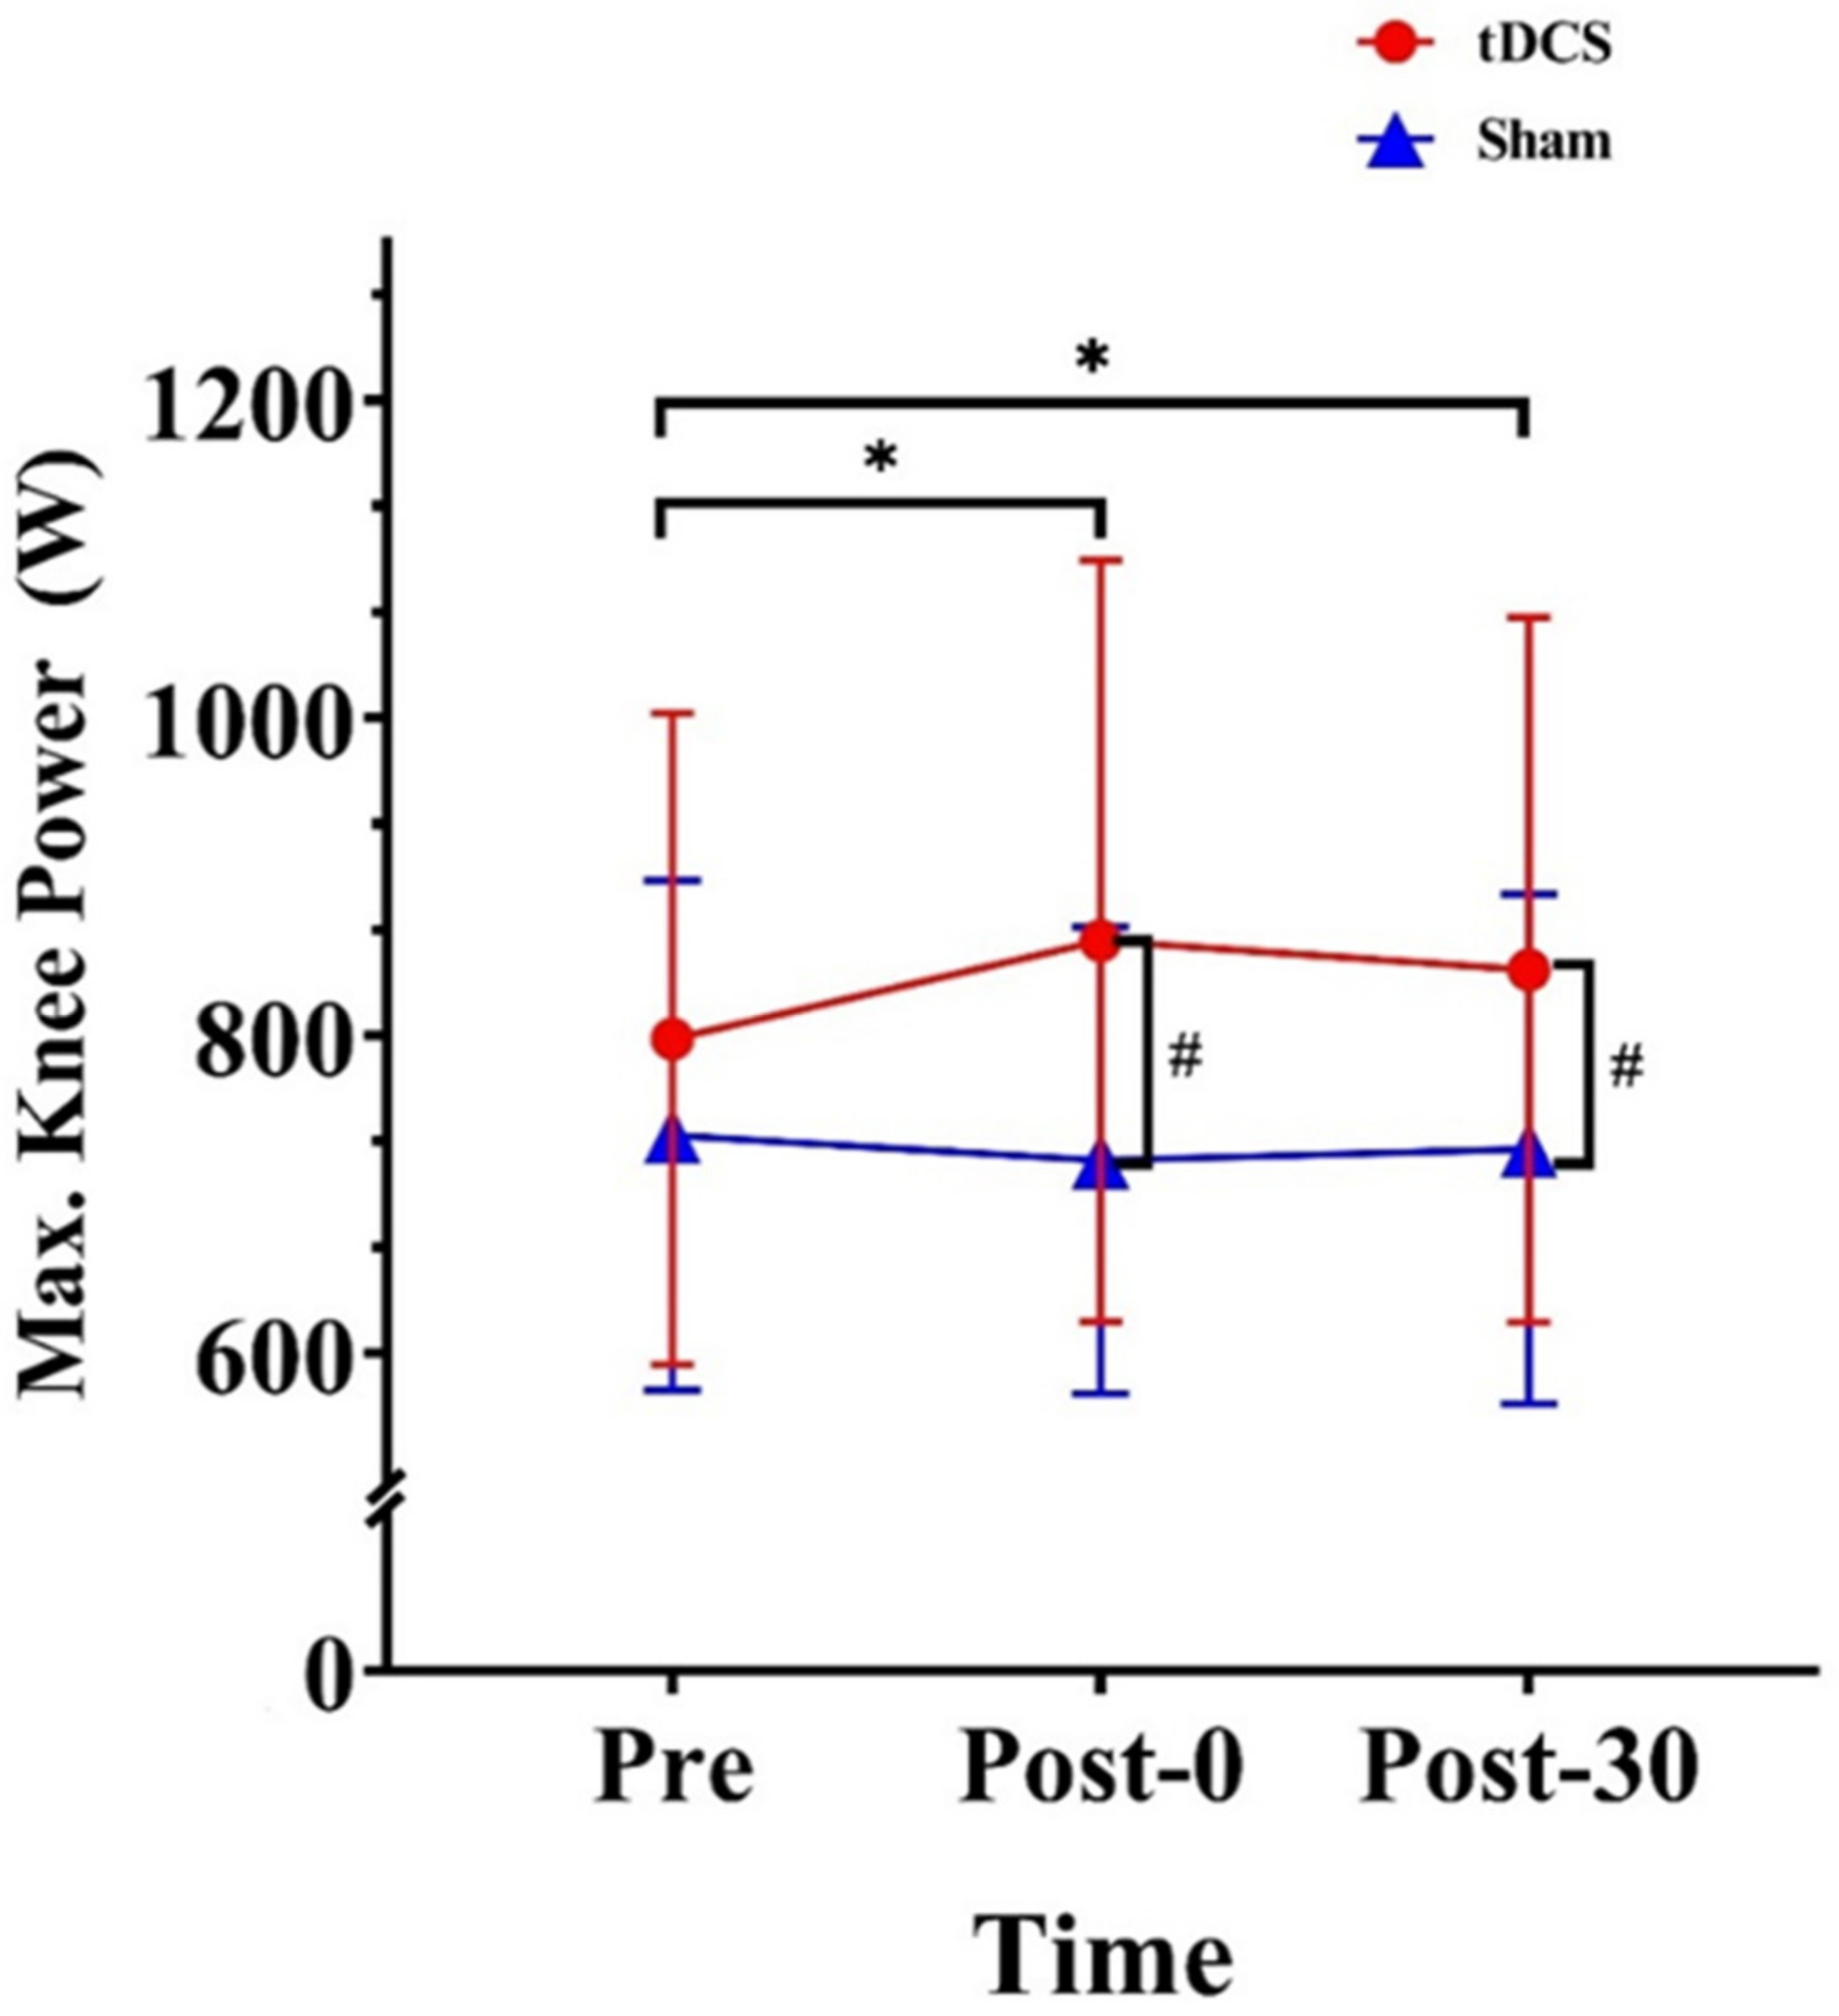
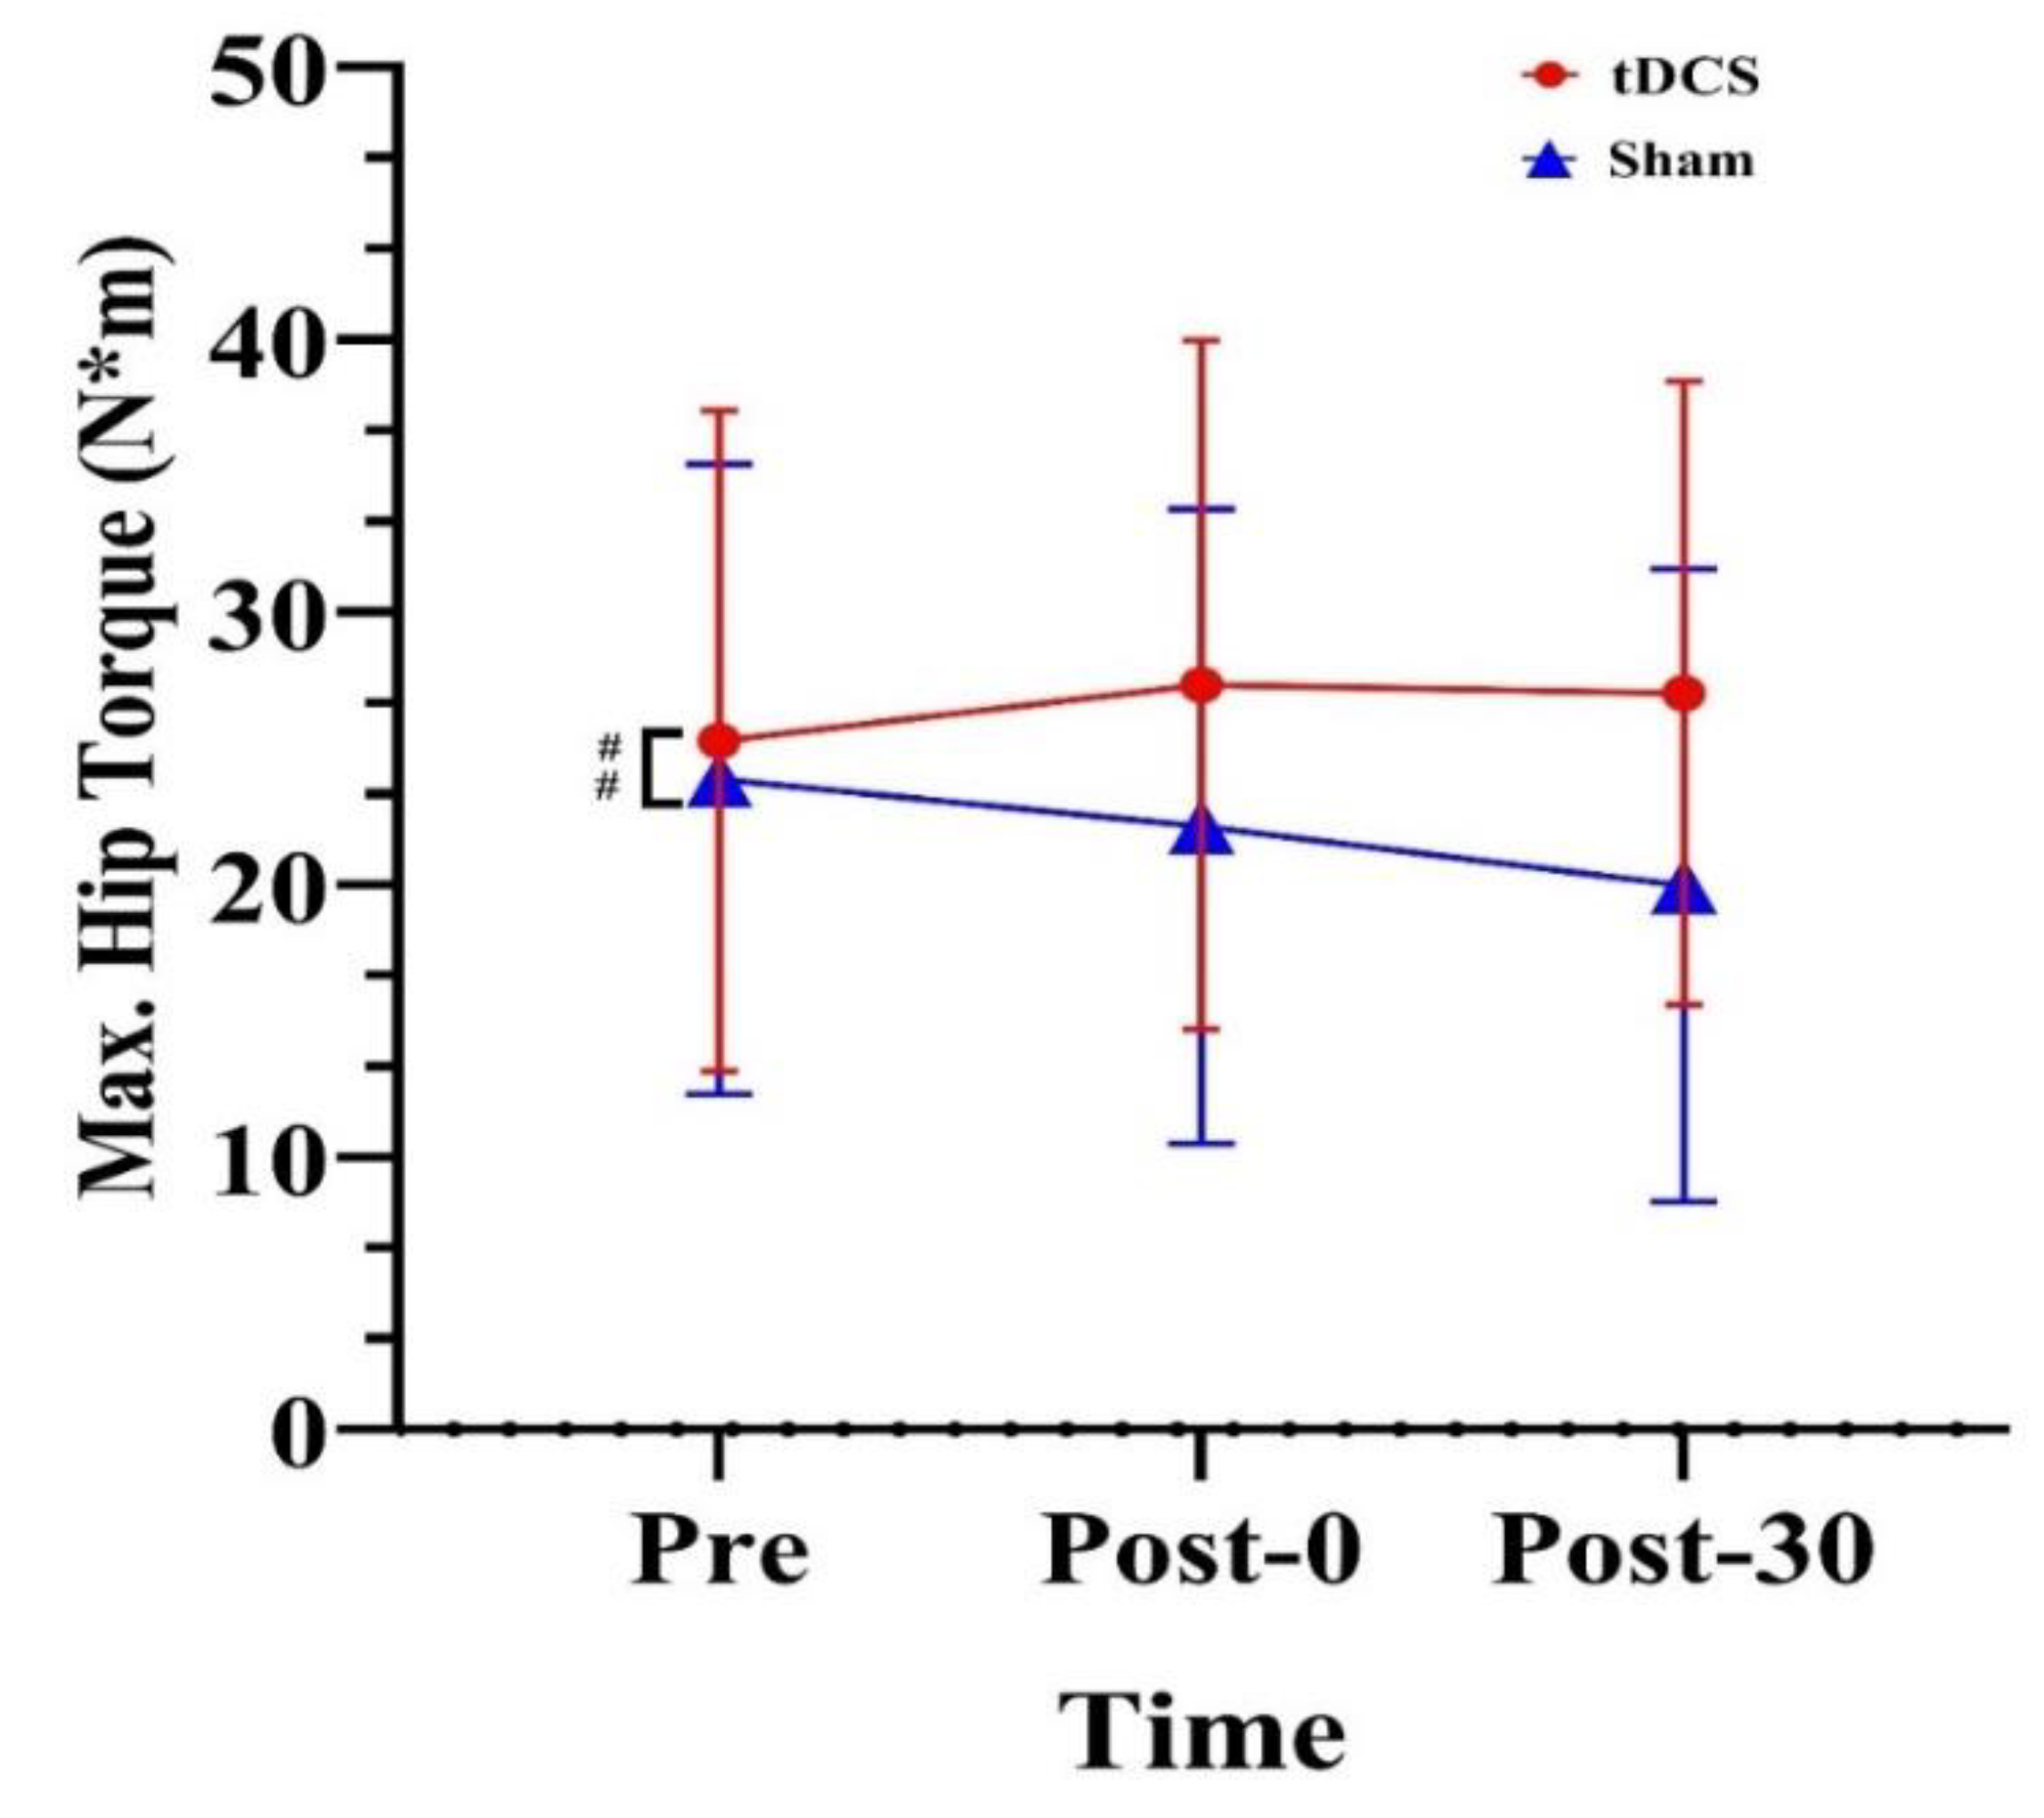
3.3. Kinetics of Lower Extremities
4. Discussion
4.1. Effect of tDCS on Jump Height
4.2. Effects of tDCS on Lower Limb Energy
4.3. Effects of tDCS on Lower Limb Kinetics
4.4. Mechanism
4.5. Limitations
5. Conclusions
Author Contributions
Funding
Institutional Review Board Statement
Informed Consent Statement
Data Availability Statement
Conflicts of Interest
References
- Berton, R.; Lixandrão, M.E.; Pinto, E.S.C.M.; Tricoli, V. Effects of weightlifting exercise, traditional resistance and plyometric training on countermovement jump performance: A meta-analysis. J. Sport. Sci. 2018, 36, 2038–2044. [Google Scholar] [CrossRef]
- Markovic, G. Does plyometric training improve vertical jump height? A meta-analytical review. Br. J. Sport. Med. 2007, 41, 349–355; discussion 355. [Google Scholar] [CrossRef] [PubMed]
- Vanezis, A.; Lees, A. A biomechanical analysis of good and poor performers of the vertical jump. Ergonomics 2005, 48, 1594–1603. [Google Scholar] [CrossRef]
- Van Hooren, B.; Zolotarjova, J. The Difference Between Countermovement and Squat Jump Performances: A Review of Underlying Mechanisms With Practical Applications. J. Strength Cond. Res. 2017, 31, 2011–2020. [Google Scholar] [CrossRef] [PubMed]
- Behm, D.G.; Young, J.D.; Whitten, J.H.D.; Reid, J.C.; Quigley, P.J.; Low, J.; Li, Y.; Lima, C.D.; Hodgson, D.D.; Chaouachi, A.; et al. Effectiveness of Traditional Strength vs. Power Training on Muscle Strength, Power and Speed with Youth: A Systematic Review and Meta-Analysis. Front. Physiol. 2017, 8, 423. [Google Scholar] [CrossRef]
- Bruhn, S.; Kullmann, N.; Gollhofer, A. The effects of a sensorimotor training and a strength training on postural stabilisation, maximum isometric contraction and jump performance. Int. J. Sport. Med. 2004, 25, 56–60. [Google Scholar] [CrossRef]
- Taborri, J.; Agostini, V.; Artemiadis, P.K.; Ghislieri, M.; Jacobs, D.A.; Roh, J.; Rossi, S. Feasibility of Muscle Synergy Outcomes in Clinics, Robotics, and Sports: A Systematic Review. Appl. Bionics Biomech. 2018, 2018, 3934698. [Google Scholar] [CrossRef]
- Singh, R.E.; Iqbal, K.; White, G.; Hutchinson, T.E. A Systematic Review on Muscle Synergies: From Building Blocks of Motor Behavior to a Neurorehabilitation Tool. Appl. Bionics Biomech. 2018, 2018, 3615368. [Google Scholar] [CrossRef]
- Cogiamanian, F.; Marceglia, S.; Ardolino, G.; Barbieri, S.; Priori, A. Improved isometric force endurance after transcranial direct current stimulation over the human motor cortical areas. Eur. J. Neurosci. 2007, 26, 242–249. [Google Scholar] [CrossRef]
- Williams, P.S.; Hoffman, R.L.; Clark, B.C. Preliminary evidence that anodal transcranial direct current stimulation enhances time to task failure of a sustained submaximal contraction. PLoS ONE 2013, 8, e81418. [Google Scholar] [CrossRef]
- Hendy, A.M.; Kidgell, D.J. Anodal-tDCS applied during unilateral strength training increases strength and corticospinal excitability in the untrained homologous muscle. Exp. Brain Res. 2014, 232, 3243–3252. [Google Scholar] [CrossRef] [PubMed]
- Zhu, Z.; Zhou, J.; Manor, B.; Wang, X.; Fu, W.; Liu, Y. Commentary: “Brain-Doping,” Is It a Real Threat? Front. Physiol. 2019, 10, 1489. [Google Scholar] [CrossRef]
- Nitsche, M.A.; Paulus, W. Excitability changes induced in the human motor cortex by weak transcranial direct current stimulation. J. Physiol. 2000, 527 Pt 3, 633–639. [Google Scholar] [CrossRef] [PubMed]
- Stagg, C.J.; Nitsche, M.A. Physiological basis of transcranial direct current stimulation. Neurosci. A Rev. J. Bringing Neurobiol. Neurol. Psychiatry 2011, 17, 37–53. [Google Scholar] [CrossRef] [PubMed]
- Angius, L.; Hopker, J.; Mauger, A.R. The Ergogenic Effects of Transcranial Direct Current Stimulation on Exercise Performance. Front. Physiol. 2017, 8, 90. [Google Scholar] [CrossRef]
- Halakoo, S.; Ehsani, F.; Hosnian, M.; Zoghi, M.; Jaberzadeh, S. The comparative effects of unilateral and bilateral transcranial direct current stimulation on motor learning and motor performance: A systematic review of literature and meta-analysis. J. Clin. Neurosci. Off. J. Neurosurg. Soc. Australas. 2020, 72, 8–14. [Google Scholar] [CrossRef]
- Holgado, D.; Vadillo, M.A.; Sanabria, D. The effects of transcranial direct current stimulation on objective and subjective indexes of exercise performance: A systematic review and meta-analysis. Brain Stimul. 2019, 12, 242–250. [Google Scholar] [CrossRef]
- Leite, J.; Carvalho, S.; Fregni, F.; Gonçalves, Ó.F. Task-specific effects of tDCS-induced cortical excitability changes on cognitive and motor sequence set shifting performance. PLoS ONE 2011, 6, e24140. [Google Scholar] [CrossRef]
- Angius, L.; Mauger, A.R.; Hopker, J.; Pascual-Leone, A.; Santarnecchi, E.; Marcora, S.M. Bilateral extracephalic transcranial direct current stimulation improves endurance performance in healthy individuals. Brain Stimul. 2018, 11, 108–117. [Google Scholar] [CrossRef]
- Angius, L.; Pageaux, B.; Hopker, J.; Marcora, S.M.; Mauger, A.R. Transcranial direct current stimulation improves isometric time to exhaustion of the knee extensors. Neuroscience 2016, 339, 363–375. [Google Scholar] [CrossRef]
- Lattari, E.; Campos, C.; Lamego, M.K.; Legey, S.; Neto, G.M.; Rocha, N.B.; Oliveira, A.J.; Carpenter, C.S.; Machado, S. Can Transcranial Direct Current Stimulation Improve Muscle Power in Individuals With Advanced Weight-Training Experience? J. Strength Cond. Res. 2020, 34, 97–103. [Google Scholar] [CrossRef] [PubMed]
- Grosprêtre, S.; Grandperrin, Y.; Nicolier, M.; Gimenez, P.; Vidal, C.; Tio, G.; Haffen, E.; Bennabi, D. Effect of transcranial direct current stimulation on the psychomotor, cognitive, and motor performances of power athletes. Sci. Rep. 2021, 11, 9731. [Google Scholar] [CrossRef] [PubMed]
- Chen, C.H.; Chen, Y.C.; Jiang, R.S.; Lo, L.Y.; Wang, I.L.; Chiu, C.H. Transcranial Direct Current Stimulation Decreases the Decline of Speed during Repeated Sprinting in Basketball Athletes. Int. J. Environ. Res. Public Health 2021, 18, 6967. [Google Scholar] [CrossRef] [PubMed]
- Romero-Arenas, S.; Calderón-Nadal, G.; Alix-Fages, C.; Jerez-Martínez, A.; Colomer-Poveda, D.; Márquez, G. Transcranial Direct Current Stimulation Does Not Improve Countermovement Jump Performance in Young Healthy Men. J. Strength Cond. Res. 2021, 35, 2918–2921. [Google Scholar] [CrossRef]
- Park, S.B.; Han, D.H.; Hong, J.; Lee, J.W. Transcranial Direct Current Stimulation of Motor Cortex Enhances Spike Performances of Professional Female Volleyball Players. J. Mot. Behav. 2022, 55, 18–30. [Google Scholar] [CrossRef] [PubMed]
- Fertonani, A.; Miniussi, C. Transcranial Electrical Stimulation: What We Know and Do Not Know About Mechanisms. Neurosci. Rev. J. Bringing Neurobiol. Neurol. Psychiatry 2017, 23, 109–123. [Google Scholar] [CrossRef] [PubMed]
- Herwig, U.; Satrapi, P.; Schönfeldt-Lecuona, C. Using the international 10-20 EEG system for positioning of transcranial magnetic stimulation. Brain Topogr. 2003, 16, 95–99. [Google Scholar] [CrossRef] [PubMed]
- Zhang, S.; Fu, W.; Liu, Y. Changes in Lower-Limb Biomechanics, Soft Tissue Vibrations, and Muscle Activation During Unanticipated Bipedal Landings. J. Hum. Kinet. 2019, 67, 25–35. [Google Scholar] [CrossRef]
- Zhu, Z.; Fu, W.; Shao, E.; Li, L.; Song, L.; Wang, W.; Liu, Y. Acute Effects of Midsole Bending Stiffness on Lower Extremity Biomechanics during Layup Jumps. Appl. Sci. 2020, 10, 397. [Google Scholar] [CrossRef]
- Smith, G.; Lake, M.; Lees, A.; Worsfold, P. Measurement procedures affect the interpretation of metatarsophalangeal joint function during accelerated sprinting. J. Sport. Sci. 2012, 30, 1521–1527. [Google Scholar] [CrossRef]
- Gan, T.; Huang, Y.; Hao, X.; Hu, L.; Zheng, Y.; Yang, Z. Anodal tDCS Over the Left Frontal Eye Field Improves Sustained Visual Search Performance. Perception 2022, 51, 263–275. [Google Scholar] [CrossRef] [PubMed]
- Matsunaga, K.; Nitsche, M.A.; Tsuji, S.; Rothwell, J.C. Effect of transcranial DC sensorimotor cortex stimulation on somatosensory evoked potentials in humans. Clin. Neurophysiol. Off. J. Int. Fed. Clin. Neurophysiol. 2004, 115, 456–460. [Google Scholar] [CrossRef]
- Workman, C.D.; Fietsam, A.C.; Rudroff, T. Different Effects of 2 mA and 4 mA Transcranial Direct Current Stimulation on Muscle Activity and Torque in a Maximal Isokinetic Fatigue Task. Front. Hum. Neurosci. 2020, 14, 240. [Google Scholar] [CrossRef] [PubMed]
- Ma, M.; Xu, Y.; Xiang, Z.; Yang, X.; Guo, J.; Zhao, Y.; Hou, Z.; Feng, Y.; Chen, J.; Yuan, Y. Functional whole-brain mechanisms underlying effects of tDCS on athletic performance of male rowing athletes revealed by resting-state fMRI. Front. Psychol. 2022, 13, 1002548. [Google Scholar] [CrossRef] [PubMed]
- Lu, P.; Hanson, N.J.; Wen, L.; Guo, F.; Tian, X. Transcranial Direct Current Stimulation Enhances Muscle Strength of Non-dominant Knee in Healthy Young Males. Front. Physiol. 2021, 12, 788719. [Google Scholar] [CrossRef] [PubMed]
- Liebetanz, D.; Nitsche, M.A.; Tergau, F.; Paulus, W. Pharmacological approach to the mechanisms of transcranial DC-stimulation-induced after-effects of human motor cortex excitability. Brain 2002, 125, 2238–2247. [Google Scholar] [CrossRef] [PubMed]
- Dossena, F.; Rossi, C.; La Torre, A.; Bonato, M. The role of lower limbs during tennis serve. J. Sport. Med. Phys. Fit. 2018, 58, 210–215. [Google Scholar] [CrossRef]
- Ozer, D.; Senbursa, G.; Baltaci, G.; Hayran, M. The effect on neuromuscular stability, performance, multi-joint coordination and proprioception of barefoot, taping or preventative bracing. Foot 2009, 19, 205–210. [Google Scholar] [CrossRef]
- Requena, B.; González-Badillo, J.J.; de Villareal, E.S.; Ereline, J.; García, I.; Gapeyeva, H.; Pääsuke, M. Functional performance, maximal strength, and power characteristics in isometric and dynamic actions of lower extremities in soccer players. J. Strength Cond. Res. 2009, 23, 1391–1401. [Google Scholar] [CrossRef]
- Nitsche, M.A.; Fricke, K.; Henschke, U.; Schlitterlau, A.; Liebetanz, D.; Lang, N.; Henning, S.; Tergau, F.; Paulus, W. Pharmacological modulation of cortical excitability shifts induced by transcranial direct current stimulation in humans. J. Physiol. 2003, 553, 293–301. [Google Scholar] [CrossRef]
- Paulus, W. Outlasting excitability shifts induced by direct current stimulation of the human brain. Suppl. Clin. Neurophysiol. 2004, 57, 708–714. [Google Scholar] [CrossRef] [PubMed]
- Stagg, C.J.; Best, J.G.; Stephenson, M.C.; O’Shea, J.; Wylezinska, M.; Kincses, Z.T.; Morris, P.G.; Matthews, P.M.; Johansen-Berg, H. Polarity-sensitive modulation of cortical neurotransmitters by transcranial stimulation. J. Neurosci. Off. J. Soc. Neurosci. 2009, 29, 5202–5206. [Google Scholar] [CrossRef] [PubMed]
- Rawji, V.; Ciocca, M.; Zacharia, A.; Soares, D.; Truong, D.; Bikson, M.; Rothwell, J.; Bestmann, S. tDCS changes in motor excitability are specific to orientation of current flow. Brain Stimul. 2018, 11, 289–298. [Google Scholar] [CrossRef] [PubMed]
- Hannah, R.; Iacovou, A.; Rothwell, J.C. Direction of TDCS current flow in human sensorimotor cortex influences behavioural learning. Brain Stimul. 2019, 12, 684–692. [Google Scholar] [CrossRef]
- Laakso, I.; Tanaka, S.; Koyama, S.; De Santis, V.; Hirata, A. Inter-subject Variability in Electric Fields of Motor Cortical tDCS. Brain Stimul. 2015, 8, 906–913. [Google Scholar] [CrossRef]
- Xiao, S.; Wang, B.; Zhang, X.; Zhou, J.; Fu, W. Acute Effects of High-Definition Transcranial Direct Current Stimulation on Foot Muscle Strength, Passive Ankle Kinesthesia, and Static Balance: A Pilot Study. Brain Sci. 2020, 10, 246. [Google Scholar] [CrossRef]


| Variables | tDCS | Sham | ||||
|---|---|---|---|---|---|---|
| Pre | Post-0 | Post-30 | Pre | Post-0 | Post-30 | |
| Jump height (cm) | 48.34 (8.32) | 50.85 (8.48) | 50.10 (8.99) | 47.89 (6.54) | 47.16 (6.71) | 47.26 (6.61) |
| Joints | Variables | tDCS | Sham | ||||
|---|---|---|---|---|---|---|---|
| Pre | Post-0 | Post-30 | Pre | Post-0 | Post-30 | ||
| Ankle | Negative energy (J) | −7.72 (3.57) | −8.2 (4.00) | −8.7 (3.92) | −6.73 (2.56) | −7.16 (2.60) | −7.10 (2.70) |
| Positive energy (J) | 80.96 (19.97) | 83.61 (18.92) | 82.34 (18.30) | 82.13 (12.04) | 80.38 (11.42) | 78.95 (12.69) | |
| Net energy (J) | 73.24 (18.55) | 75.41 (17.43) | 73.64 (16.91) | 75.41 (11.93) | 73.22 (10.92) | 71.84 (12.65) | |
| Knee | Negative energy (J) | −57.16 (19.22) | −55.85 (21.26) | −56.47 (21.27) | −55.25 (19.33) | −55.86 (20.26) | −54.79 (20.33) |
| Positive energy (J) | 97.21 (25.06) | 98.79 (23.69) | 100.76 (23.51) | 89.27 (16.74) | 90.01 (19.95) | 92.32 (18.74) | |
| Net energy (J) | 42.05 (17.71) | 42.88 (16.61) | 44.29 (17.171) | 34.01 (14.65) | 34.15 (13.15) | 37.52 (14.52) | |
| Hip | Negative energy (J) | −57.60 (12.65) | −55.94 (16.55) | −58.50 (19.84) | −53.86 (13.49) | −52.51 (15.48) | −53.58 (15.44) |
| Positive energy (J) | 121.55 (29.64) | 124.34 (36.75) | 125.51 (40.21) | 126.63 (33.46) | 123.33 (31.48) | 123.16 (30.88) | |
| Net energy (J) | 63.95 (22.26) | 68.36 (25.83) | 67.01 (24.98) | 72.77 (21.36) | 70.82 (18.43) | 69.58 (18.67) | |
| Total net energy of lower limbs (J) | 179.23 (38.55) | 186.75 (43.25) | 184.93 (42.57) | 182.19 (27.13) | 178.19 (27.84) | 178.95 (24.40) | |
| Joints | Variables | tDCS | Sham | ||||
|---|---|---|---|---|---|---|---|
| Pre | Post-0 | Post-30 | Pre | Post-0 | Post-30 | ||
| Ankle | Max. torque (N·m) | 0.72 (2.47) | 0.73 (2.52) | −0.69 (1.93) | 0.41 (2.10) | 1.0 (2.91) | −0.18 (2.47) |
| Min. torque (N·m) | −142.43 (50.03) | −144.10 (47.54) | −146.12 (53.17) | −145.84 (39.19) | −137.91 (34.37) | −137.2 (34.53) | |
| Max. power (W) | 1052.39 (272.87) | 1043.69 (257.60) | 1032.09 (259.61) | 1103.71 (195.94) | 1054.74 (145.32) | 1035.89 (167.78) | |
| Min. power (W) | −47.73 (26.58) | −51.63 (28.17) | −50.94 (24.68) | −41.36 (19.43) | −43.04 (15.54) | −38.28 (14.24) | |
| Knee | Max. torque (N·m) | 128.18 (31.37) | 126.58 (30.66) | 128.17 (27.69) | 115.29 (18.38) | 119.95 (28.98) | 121.99 (26.64) |
| Min. torque (N·m) | −47.67 (19.44) | −47.98 (18.84) | −48.23 (17.13) | −50.69 (18.50) | −47.00 (14.04) | −45.21 (17.19) | |
| Max. power (W) | 798.03 (205.03) | 859.82 (239.87) | 841.52 (222.00) | 737.42 (160.51) | 721.45 (146.92) | 728.69 (160.33) | |
| Min. power (W) | −650.24 (274.87) | −662.61 (269.32) | −663.60 (252.46) | −696.23 (244.16) | −654.87 (185.87) | −627.68 (230.95) | |
| Hip | Max. torque (N·m) | 25.27 (12.13) | 27.32 (12.64) | 27.03 (11.44) | 23.86 (11.56) | 22.13 (11.63) | 19.97 (11.61) |
| Min. torque (N·m) | −163.46 (33.78) | −165.56 (31.27) | −166.31 (31.52) | −158.28 (22.14) | −157.93 (22.60) | −155.82 (21.96) | |
| Max. power (W) | 578.89 (135.86) | 604.53 (154.24) | 597.44 (174.26) | 588.94 (125.72) | 585.02 (117.72) | 576.28 (117.54) | |
Disclaimer/Publisher’s Note: The statements, opinions and data contained in all publications are solely those of the individual author(s) and contributor(s) and not of MDPI and/or the editor(s). MDPI and/or the editor(s) disclaim responsibility for any injury to people or property resulting from any ideas, methods, instructions or products referred to in the content. |
© 2023 by the authors. Licensee MDPI, Basel, Switzerland. This article is an open access article distributed under the terms and conditions of the Creative Commons Attribution (CC BY) license (https://creativecommons.org/licenses/by/4.0/).
Share and Cite
Zhiqiang, Z.; Wei, W.; Yunqi, T.; Yu, L. Effects of Bilateral Extracephalic Transcranial Direct Current Stimulation on Lower Limb Kinetics in Countermovement Jumps. Int. J. Environ. Res. Public Health 2023, 20, 2241. https://doi.org/10.3390/ijerph20032241
Zhiqiang Z, Wei W, Yunqi T, Yu L. Effects of Bilateral Extracephalic Transcranial Direct Current Stimulation on Lower Limb Kinetics in Countermovement Jumps. International Journal of Environmental Research and Public Health. 2023; 20(3):2241. https://doi.org/10.3390/ijerph20032241
Chicago/Turabian StyleZhiqiang, Zhu, Wang Wei, Tang Yunqi, and Liu Yu. 2023. "Effects of Bilateral Extracephalic Transcranial Direct Current Stimulation on Lower Limb Kinetics in Countermovement Jumps" International Journal of Environmental Research and Public Health 20, no. 3: 2241. https://doi.org/10.3390/ijerph20032241
APA StyleZhiqiang, Z., Wei, W., Yunqi, T., & Yu, L. (2023). Effects of Bilateral Extracephalic Transcranial Direct Current Stimulation on Lower Limb Kinetics in Countermovement Jumps. International Journal of Environmental Research and Public Health, 20(3), 2241. https://doi.org/10.3390/ijerph20032241