Abstract
The development of efficient methods for evaluating pesticide residues is essential in order to ensure the safety and quality of agricultural products since the Republic of Korea implemented the Positive List System (PLS). The objective of this research was to establish a method for the simultaneous analysis of 322 pesticide residues in fruits and vegetables (such as coffee, potato, corn, and chili pepper), using the quick, easy, cheap, effective, rugged, and safe (QuEChERS) approach in combination with gas chromatography-tandem mass spectrometry (GC-MS/MS). This study introduces a robust, high-throughput GC-MS/MS method for screening the target pesticide residues in agricultural products, achieving the PLS criterion of 0.01 mg/kg LOQ. Despite some compounds not aligning with the CODEX recovery guideline, sufficient reproducibility was confirmed, attesting to the method’s applicability in qualitative analyses. A health risk assessment conducted using estimated daily intake/acceptable daily intake ratios indicated low risks associated with product consumption (<0.035391%), thereby confirming their safety. This efficient method holds significant implications for the safe distribution of agricultural products, including during import inspections.
1. Introduction
Pesticides are essential substances in agriculture that protect crops against harmful insects to maximize yields and enhance the quality of agricultural products. Despite the apparent benefits of pesticides, their indiscriminate use causes problems because residues in agricultural products can have adverse effects on human health and cause environmental pollution [,,]. The agricultural products in each country are cultivated according to the individual conditions in that country, and the type of pesticide used varies according to the environment and the type of pest emerging during the cultivation period [,]. Hence, each country defines their own maximum residue limits (MRLs) for agricultural products to ensure efficient and rigorous pesticide management and control, to guarantee the safety of domestic and imported agricultural products, and to conduct continuous monitoring of the agricultural products being distributed [,]. In addition, consumers often base decisions regarding the purchase of agricultural products on health and safety concerns; therefore, restricting the use of pesticides on agricultural products and analyzing for pesticide residues are important.
Pesticide residue analyses are broadly classified into individual methods and multiclass multiresidue methods (MRMs) based on the purpose of the analysis [,]. Individual methods are highly reliable because the analysis is optimized for individual compounds; however, these methods are less frequently applied for pesticide residue analysis, owing to the time and cost required for detecting multiple pesticides [,]. In contrast, MRMs aim to analyze different classes of pesticides in a single analysis, which is conducive for the rapid processing of a large number of agricultural products [,]. Based on this efficiency, MRMs are mainly used in the routine monitoring of various pesticide residues and are widely used worldwide for the safety management of pesticide residues [,].
In the field of multi-pesticide residue analysis, gas chromatography-mass spectrometry (GC-MS) and liquid chromatography (LC) techniques are acceptable. Especially, GC-MS or GC-tandem MS (GC-MS/MS) offers high sensitivity and selectivity, a broad analytical spectrum, quantitative accuracy, exceptional resolution, and fast measurement speed, as well as high-quality identification of various substances. However, a highly suitable sample preparation approach such as quick, easy, cheap, effective, rugged, and safe (QuEChERS) has been recognized and is required before instrumental analysis [,,]. In contrast to the long extraction times required when using organic solvents to extract pesticides from different samples, the analysis time and processing steps are minimized in QuEChERS, which still exhibits high recoveries of 60–120% for various nonpolar and polar pesticides [,,]. Since its adoption as an Association of Official Analytical Chemists (AOAC) method in 2003, the recently improved QuEChERS method has been approved as an official method of analysis in a number of European countries (EN 15662 method) (Figure 1) [].
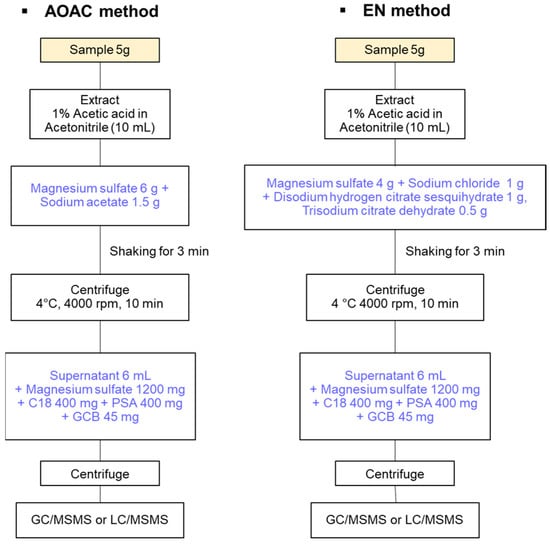
Figure 1.
Procedure of types of QuEChERS methods.
Several previous studies have developed MRMs using the QuEChERS method to analyze various pesticides [,,]; however, for such MRMs to be utilized in the Republic of Korea, these methods must be validated for foods frequently consumed by Koreans [,,,,]. In 2019, the government of the Republic of Korea introduced the Positive List System (PLS), which applies a uniform MRL criterion (0.01 mg/kg) to all imported agricultural products for which a specific MRL has not been established in Korea. Moreover, mandatory testing of pesticide residues on imported agricultural products has been instituted. Nevertheless, numerous pesticides still lack established analytical standards from the Korean Ministry of Food and Drug Safety (Figure 2 and Table S1).
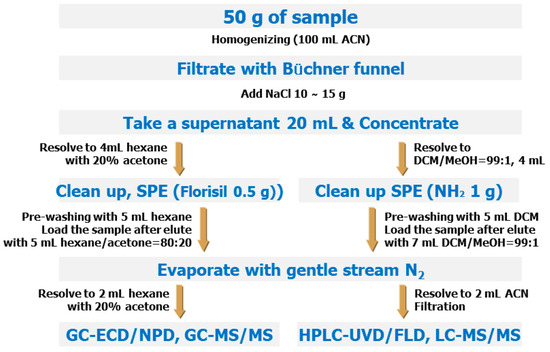
Figure 2.
Analytical method for MRMs of the Korean Food Standards Codex.
This study undertook the challenge of simultaneously screening 322 pesticides (359 compounds in total, including isomers and metabolites) that are predominantly used in Korean agriculture. The screening was conducted using GC-MS/MS and validated on four types of agricultural products that are heavily imported and frequently consumed in the Republic of Korea: coffee, potato, corn, and chili pepper [,,,]. Given the dietary habits of Koreans, these agricultural products are particularly suitable for a study aimed at minimizing the health risks posed by residual pesticides. The Limit of Quantification (LOQ) of the method satisfied the PLS criterion of 0.01 mg/kg, and the linearity, accuracy, and precision of the method were verified. Therefore, the findings of this study could significantly contribute to the development of screening standards and safety management, and aid in food safety management in Korea.
2. Materials and Methods
2.1. Chemicals and Reagents
The standard materials of 322 pesticides (359 compounds in total, including isomers and metabolites) used in the analysis were purchased from AccuStandard (New Haven, CT, USA), Chemservice (West Chester, PA, USA), Dr. Ehrenstorfer (Augsburg, Germany), Wako (Osaka, Japan), Fluka (Udligenswil, Switzerland), Sigma-Aldrich (St. Louis, MO, USA), and Supelco (Bellefonte, PA, USA). The acetonitrile (ACN) and acetone used in the extraction and purification processes were high-purity GC- or pesticide residue-grade solvents purchased from Merck (Darmstadt, Germany). The solid-phase extraction (SPE) kit, used in this study, was purchased from Applied Separation (Hamilton, PA, USA). Polytetrafluoroethylene membrane filters (PTFE, 0.2 μm) and EN QuEChERS salts (QuEChERS EN 15662 Method Extraction Kits) were purchased from Thermo Fisher Scientific (Waltham, MA, USA).
2.2. Standard Solutions
The 322 standard pesticide solutions (1000 mg/L) were separately prepared in 20 mL of acetone. The commercial standard solutions were also purchased and kept at −18 °C until use. The working standard solution comprised a mixture of each standard stock solution diluted to a set certain concentration with acetone in a brown bottle and stored at 4 °C. The working solution was diluted before use in each analysis.
2.3. Analysis by GC–Triple Quadrupole MS/MS
The GC system used for the simultaneous analysis of the pesticide residues was a GC-2010 (Shimadzu, Japan) with a split/splitless injector (SSI) and MS/MS systems (TQ8040, Shimadzu, Japan). The column used to separate the pesticide compounds was a DB-5MS (30 m × 0.25 mm × 0.25 μm, Agilent, Santa Clara, CA, USA). The GC was operated in splitless mode to analyze the 322 pesticide compounds in a 2 μL injection. To ensure the efficient separation of the compounds on the GC column, the initial oven temperature was set at 70 °C, which was maintained for 1 min at 0.8 mL/min of the He carrier gas. The temperature was then increased at a constant rate to a final temperature of 300 °C, which enabled the separation of 322 pesticides within 40 min. The detailed measurement conditions are shown in Table 1.

Table 1.
Instrumental conditions for the analyses of pesticides.
After separating the compounds on the capillary column, they were ionized using positive mode electron ionization (EI) at 70 eV, which is commonly used in pesticide residue analysis. The conditions were as follows: source temperature, 200 °C; transfer line temperature, 250 °C; manifold temperature, 40 °C; and detector voltage, 1400 V. The compounds were detected using the multiple reaction monitoring (MRM) mode, with a solvent delay of 3 min to protect the detector by allowing the solvent to pass through. The He carrier gas and Ar collision cell gas both had a purity of ≥99.999%.
Table 2 presents the optimal MRM conditions for the 322 pesticide compounds (Figure S2). To establish the optimal MRM analysis conditions, the 322 pesticides were thoroughly mixed and prepared to a 5 mg/L working standard solution. The solution was injected into the device in full scan mode (Figure 3), and the total ion chromatogram (TIC), mass spectrum, and retention time were obtained for each pesticide. Since the molecular masses of all 322 pesticide compounds were ≤500, the full scan range was set at 50–500 m/z, and each spectrum was compared with that of known pesticide compounds in the NIST library to confirm the similarity and verify an accuracy of the qualitative information for each pesticide.
Table 2.
GC-MS/MS parameters for the analysis of 322 pesticides.
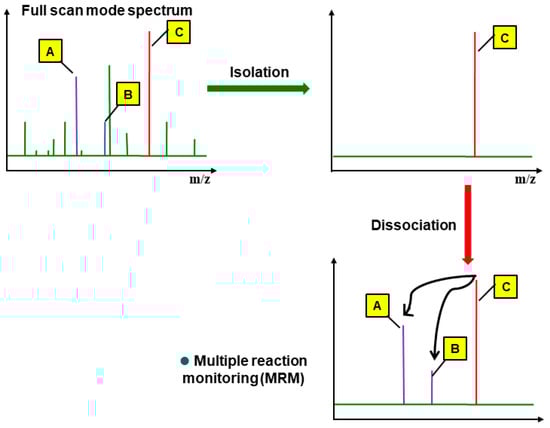
Figure 3.
Procedure of multiple reaction monitoring (MRM). A, B, and C are representing qualitative ion 2, qualitative ion 1, and quantitative ion, respectively.
From the full scan spectrum, a representative ion was selected as the precursor ion based on the molecular structure and unique mass fragments of each pesticide compound. The precursor ions that passed through the first quadrupole analyzer were reionized at 5–50 eV in the collision cell, and the resulting product ions passed through the second quadrupole analyzer to obtain the ion chromatogram of the individual mass fragments (Figure 3). At least two product ions were selected for each pesticide compound by comparing and considering the peak shapes and sensitivities, and then selecting suitable ion signals and collision energies. The confirmation criteria for the pesticide compounds were as follows: two or more product ions had to be detected and the height ratio of each ion had to match that in the reference spectrum. For quantification, the chromatographic area ratio of the product ions was compared to that in the standard.
In quadrupole MS analyses, several ions can simultaneously reach the detector within a short time to produce ambiguous peak shapes, resulting in reduced sensitivity. To prevent this problem, the dwell time of the MRM ions was set within a range of 0.15–0.29 s and the scan speed was set to 0.2–0.82 s/scan.
2.4. Sample Preparation and Extraction
Figure 4 shows a sample preparation process. After homogenizing the samples using a large-volume grinder, 10 g of chili pepper and potato samples and 5 g of low-water-content coffee and corn samples (purchased from local supermarkets) were accurately weighed. The low-water-content samples were mixed with 10 mL of distilled water and the mixtures were left to stand for 30 min for moistening before extraction. For pretreatment, the EN15662 QuEChERS method, including pH control, was applied []. The prepared sample was placed in a 50 mL polypropylene centrifuge tube to which 10 mL of ACN was added as an organic solvent. The sample underwent vigorous vortex mixing for 1 min to ensure that the solvent and the sample were adequately mixed. The EN kit (MgSO4, 4 g; NaCl, 1 g; sodium hydrogen citrate sesquihydrate, 0.5 g; and sodium citrate dihydrate, 1 g) was added to the tube and after 1 min of vigorous shaking, the mixture was centrifuged for 10 min (4000× g at 4 °C). During this process, the water and organic solvent (ACN) layers clearly separated and the pesticide compounds remaining in the sample were mostly transferred to the organic solvent layer. The pesticides and the water in the sample mixed with the ACN, and the powerful dehydration capabilities of the MgSO4 and NaCl forcefully separated the water from the organic solvent. The centrifugation process considerably reduced the time required to separate the water and organic solvent layers.
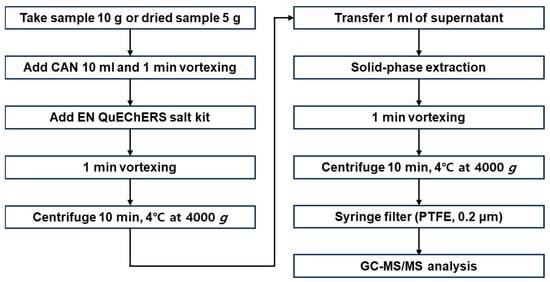
Figure 4.
Schematic diagram of sample preparation.
To a 2 mL centrifuge tube containing 150 mg of MgSO4 and 25 mg of a primary secondary amine (PSA) sorbent, 1 mL of the supernatant obtained in the extraction process was added and the lid was closed for 1 min of vigorous shaking. Next, the mixture was centrifuged for 15 min (4000× g at 4 °C) to ensure the adequate separation of the layers. The supernatant was passed through a membrane filter (PTFE, 0.2 μm), and the final extract was transferred to a brown vial for analysis [].
2.5. Method Validation
The method for the simultaneous analysis of 322 pesticides was validated according to the CODEX guidelines for pesticide residue analysis (CAC/GL40) and the Guideline of Standard Procedures of Test Methods for Foods and Other Substances (April, 2016) published by the Ministry of Food and Drug Safety (MFDS, Republic of Korea) []. The method developed in this study was validated for linearity, LOQ, recovery, and reproducibility.
The linearity was determined via serial dilution of a working standard solution containing a mixture of the 322 pesticides to 5, 10, 50, 100, and 200 ng mL−1 to obtain a calibration curve for each compound. The LOQ was determined by diluting the working standard solution with purified extracts of the coffee, potato, corn, and chili pepper samples, which were selected as representative agricultural products for the validation. On the resulting chromatograms, the concentration of the standard solution with a signal-to-noise ratio (S/N) of 10 was determined and verified []. For the recovery and reproducibility, the coffee, potato, corn, and chili pepper samples were spiked with various concentrations of the working standard solution (0.005, 0.01, 0.05, 0.1, and 0.2 mg/L) and left to stand for 30 min to allow the pesticide compounds to adequately mix with the sample. The spiked samples were then extracted and analyzed using the method developed in this study. The percentage recovery (%) was determined by comparing the experimentally determined concentration with the added amount of pesticide. To verify the reproducibility, the relative standard deviation (RSD) of the recoveries was calculated from five repeated measurements per concentration.
Matrix Effects (ME) are defined by the CODEX as influences on the measured concentration or the amount of the target analyte due to other components within the sample. The extent of the ME, determined by contrasting the response of the analyte in a pure standard solution with its response in a sample extract, can differ significantly (Figure S1). The ME is evaluated by comparing the slope of the calibration curves for the standards in the solvents against the standards prepared in the ME. The ME is calculated using Equation (1): [].
If the ME exhibits a suppression or enhancement of 0–20%, it is referred to as a Soft Matrix Effect, which is generally negligible and does not significantly impact the analysis. However, if the suppression or enhancement is between 20 and 50%, the ME is considered Medium, which may influence the analysis. In cases where the suppression or enhancement exceeds 50%, the ME is classified as Strong []. In such instances, it is necessary to implement measures to mitigate the ME’s impact on the analysis. One recommended approach is to use matrix-matched calibration, which involves the preparation of calibration standards in untreated or non-detect samples following the same pretreatment process. This helps in reducing the analytical error due to the ME when the sample extract and matrix-matched standard are injected into the instrument for analysis. Another potential approach to tackle a Strong ME could be sample dilution. The ME % values are presented in Tables S2–S5.
2.6. Monitoring Using the Multiresidue Method for Pesticide Residue Analysis
The field applicability of the MRMs developed in this study was verified by determining the current state of pesticide residues in selected agricultural products distributed in the Republic of Korea. Samples were collected from three cities in the Republic of Korea: Busan, Ulsan, and Gimhae. The agricultural products selected for the monitoring were those commonly available at markets and frequently consumed by Koreans []. A total of 135 samples were purchased and tested. To collect accurate data and assess the pesticide exposure of the national population from the consumption of agricultural products, the selected samples were agricultural products from the final stage before consumption, such as those available at major supermarkets or wholesale markets, rather than those from the production stage, because the goal was to examine agricultural products right after purchase and before consumption. Table 3 presents the type and number of the sampled agricultural products.
Table 3.
Collected samples.
Based on the type of agricultural product, 1 kg of fresh product or 0.3 kg of dried product was purchased to ensure that a representative amount of each sample was collected, as per the Korean Food Code requirements []. The collected samples were immediately transferred to the laboratory and the entire amount was homogenized in a large-volume grinder and pretreated according to the method developed in this study. Excess samples remaining after the experiments were divided among the sealed containers and stored in a freezer (−18 °C) to prevent the partial degradation of the pesticides by light or temperature in case reanalysis was required.
3. Results and Discussion
3.1. Analytical Method Validation
3.1.1. Linearity
To determine the linearity of the 322 pesticide compounds, the working standard solutions were prepared at five concentrations (0.005, 0.01, 0.05, 0.1, and 0.2 mg/L) in the LOQ range of 0.005–0.2 mg/L and injected into the device for analysis. The coefficient of determination (R2) was ≥0.98 in all cases, indicating a high level of linearity and confirming that the method was suitable for quantitative analyses. Table S6 presents the correlation coefficients for the four agricultural products.
3.1.2. Recovery
To determine the recovery, the analysis was repeated five times at each spiking level for each target sample. The number of pesticides within the mean recovery range of 60–120% was 349 out of 359 for coffee, 348 for potato, 339 for corn, and 346 for chili pepper. The standard deviation (SD) of the repeated recovery tests was mostly within 30%, which satisfied the CODEX requirement for pesticide residue analysis (Table 4 and Figures S3–S6). The primary aim of this study was the development of a high-throughput screening tool capable of rapidly detecting a broad spectrum of pesticides. Achieving an RSD of 15% or less is indeed desirable, yet not consistently feasible given the intrinsic variability of the matrices and the multitude of target compounds. Despite certain constraints, this methodology, with its capacity for swift screening of a wide array of pesticides across diverse commodities, carries significant practical implications. Thus, it needs refinement and optimization with a specific focus on commodities such as coffee and chili pepper in subsequent research endeavors.
Table 4.
Average recovery (Ave., %) and SD (%) for the GC-MS/MS method applied to the studied samples (n = 5) at spiked level (0.01 mg/kg).
3.1.3. Limit of Quantification
Among the target pesticides in this study, certain compounds did not have an established MRL for specific agricultural products. Thus, to develop a method that can detect pesticides at a level of ≤0.01 mg/kg, which is the PLS criterion of non-detection required for pesticides, 0.01 mg/kg extracts of coffee, potato, corn, and chili pepper samples were prepared using the pretreatment method developed in this study. A S/N ratio of ≥10 was obtained for all 322 pesticides in the four samples. This confirms that the developed method is suitable for determining if a given agricultural product is in compliance with the ≤0.01 mg/kg MRL required by the PLS. Figure S2 shows chromatograms for GC-MS/MS pesticides.
Based on the results, the MRM developed in this study was confirmed to comply with the international standard and enables the simultaneous qualitative and quantitative analyses of pesticide compounds using a single pretreatment process. Certain compounds were not within the guideline recovery range; however, a certain level of reproducibility was maintained at a low LOQ of ≤0.01 mg/kg. This indicates that, although the method may not be suitable for the quantitative analyses of these compounds, it can be used for qualitative analyses to confirm the presence of pesticide residues in food products.
3.2. Pesticide Residue Concentration in Agricultural Products
To investigate the current state of pesticide residues in commercially available agricultural products, ten products that are frequently consumed in high amounts (chili pepper, carrot, garlic stem, mango, wheat, banana, almond, cabbage, coffee, and pineapple) were purchased from major supermarkets or wholesale markets in regions of the Republic of Korea, including Busan, Gimhae, and Yangsan. The amount of each product that was purchased was determined based on the level of consumption by the national population. Consequently, the highest number of samples taken was for bananas (24 samples) and the lowest number was for garlic stems (seven samples). A total of 135 samples of agricultural products were collected; the number of samples per agricultural product and the detection results are shown in Table 5.
Table 5.
Pesticides frequencies, concentrations, and maximum residue limits in agricultural products.
In the 135 samples of ten types of agricultural products, three pesticides were detected: chlorpyrifos, fludioxonil, and prochloraz, and an exposure assessment was conducted. The daily intake was estimated based on the amount of pesticide detected and the corresponding consumption of the agricultural product. Table 6 shows the estimated daily intake (EDI) against the acceptable daily intake (ADI) (EDI/ADI %), which is calculated using the 7th Korea National Health and Nutrition Examination Survey (KNHANES VII-1). Considering Korean dietary habits, the EDI of pesticides was calculated according to pesticide intake amount (mg) per kg of body weight.
Table 6.
Exposure assessment of pesticides in agricultural products.
The exposure assessments on the three pesticides, chlorpyrifos, fludioxonil, and prochloraz, revealed that the values of the EDI against the ADI (EDI/ADI) were 0.002995%, 0.000187% (Mango), 0.000062% (Pineapple), and 0.035391%, respectively. This indicated that the health risk from consuming the residual pesticides on the collected agricultural products was considerably low and would further decrease during processes such as washing and cooking [,].
4. Conclusions
The proposed GC-MS/MS, combined with the QuEChERS method, has been successfully employed for the simultaneous multi-pesticide residue analysis in Korean agricultural products. This methodology demonstrated high selectivity and sensitivity with satisfying the PLS criterion of 0.01 mg/kg for the LOQ. Moreover, the EDI and ADI were also calculated to facilitate the assessment of potential health risks (EDI/ADI) posed by the analyzed products. The findings of this research establish the comprehensive screening standard method for various pesticides and advances food safety management. Further studies expanding to other types of pesticides in various agricultural products will be essential for improving food safety measurement and public health in Korea.
Supplementary Materials
The following supporting information can be downloaded at: https://www.mdpi.com/article/10.3390/foods12163001/s1.
Author Contributions
Conceptualization, B.-S.C.; methodology, W.-J.C., W.-S.K. and C.-W.P.; software, W.-J.C., W.-S.K. and C.-W.P.; validation, B.-S.C. and D.-U.L.; formal analysis, W.-J.C., W.-S.K. and C.-W.P.; investigation, B.-S.C.; resources, W.-J.C., W.-S.K. and C.-W.P.; data curation, B.-S.C. and D.-U.L.; writing—original draft preparation, B.-S.C. and D.-U.L.; writing—review and editing, D.-U.L. and M.-J.M.; visualization, B.-S.C. and D.-U.L.; supervision, M.-J.M.; project administration, B.-S.C. and M.-J.M.; funding acquisition, B.-S.C. and M.-J.M. All authors have read and agreed to the published version of the manuscript.
Funding
This research received no external funding.
Data Availability Statement
All available data are contained within the article.
Conflicts of Interest
The authors declare no conflict of interest.
References
- Kalyabina, V.P.; Esimbekova, E.N.; Kopylova, K.V.; Kratasyuk, V.A. Pesticides: Formulants, Distribution Pathways and Effects on Human Health—A Review. Toxicol. Rep. 2021, 8, 1179–1192. [Google Scholar] [CrossRef] [PubMed]
- Pathak, V.M.; Verma, V.K.; Rawat, B.S.; Kaur, B.; Babu, N.; Sharma, A.; Dewali, S.; Yadav, M.; Kumari, R.; Singh, S. Current Status of Pesticide Effects on Environment, Human Health and It’s Eco-Friendly Management as Bioremediation: A Comprehensive Review. Front. Microbiol. 2022, 13, 2833. [Google Scholar] [CrossRef] [PubMed]
- Aktar, W.; Sengupta, D.; Chowdhury, A. Impact of Pesticides Use in Agriculture: Their Benefits and Hazards. Interdiscip. Toxicol. 2009, 2, 1. [Google Scholar] [CrossRef]
- Tang, F.H.M.; Lenzen, M.; McBratney, A.; Maggi, F. Risk of Pesticide Pollution at the Global Scale. Nat. Geosci. 2021, 14, 206–210. [Google Scholar] [CrossRef]
- World Health Organization; Food and Agriculture Organization of the United Nations. Global Situation of Pesticide Management in Agriculture and Public Health: Report of a 2018 WHO-FAO Survey; Food and Agriculture Organization: Rome, Italy, 2019. [Google Scholar]
- Yeung, M.T.; Kerr, W.A.; Coomber, B.; Lantz, M.; McConnell, A.; Yeung, M.T.; Kerr, W.A.; Coomber, B.; Lantz, M.; McConnell, A. Why Maximum Residue Limits for Pesticides Are an Important International Issue. In Declining International Cooperation on Pesticide Regulation: Frittering Away Food Security; Springer Nature (Palgrave Macmillan Imprint): Cham, Switzerland, 2017; pp. 1–9. [Google Scholar]
- U. S. Department of Agriculture Maximum Residue Limits (MRL) Database. Available online: https://www.fas.usda.gov/maximum-residue-limits-mrl-database (accessed on 19 June 2023).
- Saito-Shida, S.; Nemoto, S.; Akiyama, H. Multiresidue Method for Determining Multiclass Acidic Pesticides in Agricultural Foods by Liquid Chromatography-Tandem Mass Spectrometry. Anal. Methods 2021, 13, 894–902. [Google Scholar] [CrossRef] [PubMed]
- Tauseef, M.; Rafique, N.; Ahmad, I.; Ishtiaq, M.; Samad, A.; Saba, S.; Ahad, K.; Mehboob, F. Analysis of Multiple Pesticide Residues in Rice by LC–MS/MS. Chem. Pap. 2021, 75, 2871–2879. [Google Scholar]
- Parshintsev, J.; Hyötyläinen, T. Methods for Characterization of Organic Compounds in Atmospheric Aerosol Particles. Anal. Bioanal. Chem. 2015, 407, 5877–5897. [Google Scholar] [CrossRef]
- Hofmann, A.E.; Chimiak, L.; Dallas, B.; Griep-Raming, J.; Juchelka, D.; Makarov, A.; Schwieters, J.; Eiler, J.M. Using Orbitrap Mass Spectrometry to Assess the Isotopic Compositions of Individual Compounds in Mixtures. Int. J. Mass Spectrom. 2020, 457, 116410. [Google Scholar] [CrossRef]
- Lehotay, S.J. Multiclass, Multiresidue Analysis of Pesticides, Strategies For. In Encyclopedia of Analytical Chemistry: Applications, Theory and Instrumentation; Palgrave Macmillan, John Wiley & Sons: Hoboken, NJ, USA, 2006. [Google Scholar]
- Wang, Y.; Han, J.; Zhang, J.; Li, X.; Bai, R.; Hu, F. A Monitoring Survey and Health Risk Assessment for Pesticide Residues on Codonopsis Radix in China. Sci. Rep. 2022, 12, 8133. [Google Scholar] [CrossRef]
- Campanale, C.; Massarelli, C.; Losacco, D.; Bisaccia, D.; Triozzi, M.; Uricchio, V.F. The Monitoring of Pesticides in Water Matrices and the Analytical Criticalities: A Review. TrAC-Trends Anal. Chem. 2021, 144, 116423. [Google Scholar] [CrossRef]
- Sarraf, M.; Beig-babaei, A.; Naji-Tabasi, S. Application of QuEChERS Method for Extraction of Functional Compounds. SN Appl. Sci. 2020, 2, 1858. [Google Scholar] [CrossRef]
- Perestrelo, R.; Silva, P.; Porto-Figueira, P.; Pereira, J.A.M.; Silva, C.; Medina, S.; Câmara, J.S. QuEChERS-Fundamentals, Relevant Improvements, Applications and Future Trends. Anal. Chim. Acta 2019, 1070, 1–28. [Google Scholar] [CrossRef] [PubMed]
- Eslami, Z.; Mahdavi, V.; Tajdar-oranj, B. Probabilistic health risk assessment based on Monte Carlo simulation for pesticide residues in date fruits of Iran. Environ. Sci. Pollut. Res. 2021, 28, 42037–42050. [Google Scholar]
- García-Vara, M.; Postigo, C.; Palma, P.; de Alda, M.L. Development of QuEChERS-Based Multiresidue Analytical Methods to Determine Pesticides in Corn, Grapes and Alfalfa. Food Chem. 2023, 405, 134870. [Google Scholar] [CrossRef] [PubMed]
- Kim, L.; Lee, D.; Cho, H.-K.; Choi, S.-D. Review of the QuEChERS Method for the Analysis of Organic Pollutants: Persistent Organic Pollutants, Polycyclic Aromatic Hydrocarbons, and Pharmaceuticals. Trends Environ. Anal. Chem. 2019, 22, e00063. [Google Scholar] [CrossRef]
- Musarurwa, H.; Chimuka, L.; Pakade, V.E.; Tavengwa, N.T. Recent Developments and Applications of QuEChERS Based Techniques on Food Samples during Pesticide Analysis. J. Food Compos. Anal. 2019, 84, 103314. [Google Scholar]
- Lehotay, S.J.; Son, K.A.; Kwon, H.; Koesukwiwat, U.; Fu, W.; Mastovska, K.; Hoh, E.; Leepipatpiboon, N. Comparison of QuEChERS Sample Preparation Methods for the Analysis of Pesticide Residues in Fruits and Vegetables. J. Chromatogr. A 2010, 1217, 2548–2560. [Google Scholar] [CrossRef]
- Andersson, A.; Palsheden, H. Comparison of the efficiency of different GLC multi-residue methods on crops containing pesticide residues. Fresenius J. Anal. Chem. 1991, 339, 365–367. [Google Scholar] [CrossRef]
- Anastassiades, M.; Lehotay, S.J.; Stajnbaher, D.; Schenck, F.J. Fast and Easy Multiresidue Method Employing Acetonitrile Extraction/Partitioning and “Dispersive Solid-Phase Extraction” for the Determination of Pesticide Residues in Produce. J. AOAC Int. 2003, 86, 412–431. [Google Scholar]
- Luke, M.A.; Froberg, J.E.; Masumoto, H.T. Extraction and cleanup of organochlorine, organophosphate, organonitrogen, and hydrocarbon pesticides in produce for determination by gas-liquid chromatography. J. Assoc. Off. Anal. Chem. 1975, 58, 1020–1026. [Google Scholar] [CrossRef]
- Jo, H.-W.; Park, M.-K.; Heo, H.; Jeon, H.-J.; Choi, S.-D.; Lee, S.-E.; Moon, J.-K. Simultaneous Determination of 13 Mycotoxins in Feedstuffs Using QuEChERS Extraction. Appl. Biol. Chem. 2021, 64, 34. [Google Scholar]
- Yuan, X.; Kim, C.J.; Lee, R.; Kim, M.; Shin, H.J.; Kim, L.; Jeong, W.T.; Shin, Y.; Kyung, K.S.; Noh, H.H. Validation of a Multi-Residue Analysis Method for 287 Pesticides in Citrus Fruits Mandarin Orange and Grapefruit Using Liquid Chromatography–Tandem Mass Spectrometry. Foods 2022, 11, 3522. [Google Scholar]
- Ali, S.E.A.; Aziz, M.E.A.; Mohamed, S.E. Determination of Pesticides Residues in Eggplant and Tomatoes from Central Marked in Khartoum State Using Quechers Method and Gas Liquid Chromatography-Mass Spectrometry. Biomed. J. Sci. Tech. Res. 2020, 24, 18165–18173. [Google Scholar]
- Ngabirano, H.; Birungi, G. Pesticide Residues in Vegetables Produced in Rural South-Western Uganda. Food Chem. 2022, 370, 130972. [Google Scholar]
- Belarbi, S.; Vivier, M.; Zaghouani, W.; De Sloovere, A.; Agasse-Peulon, V.; Cardinael, P. Comparison of new approach of GC-HRMS (Q-Orbitrap) to GC–MS/MS (triple-quadrupole) in analyzing the pesticide residues and contaminants in complex food matrices. Food Chem. 2021, 359, 129932. [Google Scholar]
- Zhang, Y.; Si, W.; Chen, L.; Shen, G.; Bai, B.; Zhou, C. Determination and dietary risk assessment of 284 pesticide residues in local fruit cultivars in Shanghai, China. Sci. Rep. 2021, 11, 9681. [Google Scholar] [PubMed]
- Lee, J.; Kim, L.; Shin, Y.; Lee, J.; Lee, J.; Kim, E.; Moon, J.-K.; Kim, J.-H. Rapid and Simultaneous Analysis of 360 Pesticides in Brown Rice, Spinach, Orange, and Potato Using Microbore GC-MS/MS. J. Agric. Food Chem. 2017, 65, 3387–3395. [Google Scholar]
- European Standards CSN EN 15662; Foods of Plant Origin—Multimethod for the Determination of Pesticide Residues Using GC- and LC-Based Analysis Following Acetonitrile Extraction/Partitioning and Clean-Up by Dispersive SPE–Modular QuEChERS-Method. European Committee for Standardization: Brussels, Belgium, 2018.
- Ministry of Food and Drug Safety (MFDS). Guideline of Standard Procedures of Test Methods for Foods and Other Substances; Ministry of Food and Drug Safety (MFDS): Cheongju, Republic of Korea, 2016.
- World Health Organization; Food and Agriculture Organization of the United Nations. Confirmation of Pesticides by GC/MS/MS; Food and Agriculture Organization: Rome, Italy, 2010. [Google Scholar]
- Bozena, L.; Magdalena, J. Influence of QuEChERS modifications on recovery and matrix effect during the multi-residue pesticide analysis in soil by GC/MS/MS and GC/ECD/NPD. Environ. Sci. Pollut. Res. 2017, 24, 7124–7138. [Google Scholar]
- Guidance Document on Pesticide Analytical Methods for Risk Assessment and Post-Approval Control and Monitoring Purposes, SANTE/2020/12830, Rev.1. Available online: https://food.ec.europa.eu/system/files/2021-03/pesticides_ppp_app-proc_guide_res_mrl-guidelines-2020-12830.pdf (accessed on 24 February 2021).
- Lee, H.; Cho, M.; Park, M.; Kim, M.; Seo, J.-A.; Kim, D.H.; Bae, S.; Kim, M.S.; Kim, J.A.; Lee, J.-G. Effect of Rice Milling, Washing, and Cooking on Reducing Pesticide Residues. Food Sci. Biotechnol. 2023. [Google Scholar] [CrossRef]
- Wu, Y.; An, Q.; Li, D.; Wu, J.; Pan, C. Comparison of Different Home/Commercial Washing Strategies for Ten Typical Pesticide Residue Removal Effects in Kumquat, Spinach and Cucumber. Int. J. Environ. Res. Public Health 2019, 16, 472. [Google Scholar] [PubMed]
Disclaimer/Publisher’s Note: The statements, opinions and data contained in all publications are solely those of the individual author(s) and contributor(s) and not of MDPI and/or the editor(s). MDPI and/or the editor(s) disclaim responsibility for any injury to people or property resulting from any ideas, methods, instructions or products referred to in the content. |
© 2023 by the authors. Licensee MDPI, Basel, Switzerland. This article is an open access article distributed under the terms and conditions of the Creative Commons Attribution (CC BY) license (https://creativecommons.org/licenses/by/4.0/).