Abstract
Glaucoma is a chronic eye disease that may lead to permanent vision loss if it is not diagnosed and treated at an early stage. The disease originates from an irregular behavior in the drainage flow of the eye that eventually leads to an increase in intraocular pressure, which in the severe stage of the disease deteriorates the optic nerve head and leads to vision loss. Medical follow-ups to observe the retinal area are needed periodically by ophthalmologists, who require an extensive degree of skill and experience to interpret the results appropriately. To improve on this issue, algorithms based on deep learning techniques have been designed to screen and diagnose glaucoma based on retinal fundus image input and to analyze images of the optic nerve and retinal structures. Therefore, the objective of this paper is to provide a systematic analysis of 52 state-of-the-art relevant studies on the screening and diagnosis of glaucoma, which include a particular dataset used in the development of the algorithms, performance metrics, and modalities employed in each article. Furthermore, this review analyzes and evaluates the used methods and compares their strengths and weaknesses in an organized manner. It also explored a wide range of diagnostic procedures, such as image pre-processing, localization, classification, and segmentation. In conclusion, automated glaucoma diagnosis has shown considerable promise when deep learning algorithms are applied. Such algorithms could increase the accuracy and efficiency of glaucoma diagnosis in a better and faster manner.
1. Introduction
Glaucoma is an eye disorder that is associated with the loss of retinal ganglion cells, whereby their axons gradually deteriorate over time, which leads to permanent vision loss if the condition goes untreated. Globally, 80 million individuals of different ages are affected by this disease, and it was considered the major cause of blindness in 2020 [1]. The main cause of this disease can be attributed to an imbalance between aqueous humor fluid drainage and flow that can result in increased intraocular pressure, which is a major risk factor for this disorder. The chance of getting glaucoma may additionally be increased by other elements such as age, race, and family history.
Extensive eye tests using tonometry, sight field tests, and an evaluation of the optic nerve head are crucial procedures for the diagnosis of glaucoma [2]. However, these tests usually take a lot of time, are costly, and require special equipment and expertise. Due to these limitations, there is an increasing trend in applying deep learning algorithms for automated glaucoma detection using fundus images.
Fundus imaging is a noninvasive modality that is easily accessible and provides essential information about the eye and optic nerve heads, including structural alterations used to indicate glaucoma presence. This image captures a detailed description of every aspect of the retina, including the size, shape, and color of significant regions such as the optic disc (OD), optic cup (OC), blood vessels, neuroretinal rim, and fovea [3,4]. Figure 1 shows the main structures in a retinal fundus image [5].
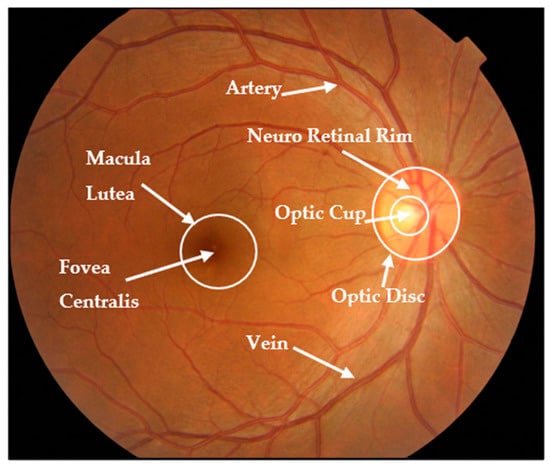
Figure 1.
Fundus image structure.
In the past few years, deep learning algorithms have shown good performance in diagnosing glaucoma based on fundus images, according to several studies that reported high sensitivity and specificity rates. However, this approach faces numerous challenges and constraints, such as the need to gather large and heterogeneous datasets, potential algorithm bias, and bureaucracy issues in healthcare system validation [6,7,8].
The goal of this review paper is to present a comprehensive overview of the most recent techniques for detecting glaucoma by means of deep learning methods applied to retinal fundus images. A discussion of the strengths and limitations of these techniques in addition to their potential to improve glaucoma screening accuracy and efficiency is also included in this paper. This review was based only on reliable academic databases, where recent articles were gathered from 2019 to 2023. We hope that this paper provides insight into the current state of glaucoma screening and helps identify gaps in the research and development in this area.
1.1. Information Sources
According to [5,9,10], an extensive search has been performed for glaucoma diagnosis-related articles by utilizing reputable databases, such as Scopus, ScienceDirect, IEEE Xplore, WoS, and PubMed Central. The compiled list comprises both medical and technical literature and provides a comprehensive representation of all research activities in this field.
1.2. Study Selection Procedures
To identify relevant papers, a two-stage approach was executed that involved screening and filtering processes. Both stages used the same criteria for including or excluding relevant papers. During the first stage, duplicate studies were removed as well as articles that were unrelated according to the preliminary review of the titles and abstracts. In the second stage, we thoroughly reviewed, analyzed, and summarized the remaining papers in order to obtain a set of relevant studies.
1.3. Search Mechanism
This study was conducted using a range of search keywords in highly reputable databases, such as IEEE Xplore, ScienceDirect, PubMed, Scopus, and WoS. Our search query comprised of two parts, linked with the operator “AND”. The first and second parts consist of different sets of keywords, with the former including “glaucoma” and “fundus images”, and “optic disc” and the latter comprising “deep learning”, “convolutional neural network”, and “CNN”. Within each part, the operator “OR” was used to connect the keywords. We only focused on scientific studies published in journals, and thus excluded conferences, books, and other forms of literature, while at the same time prioritizing only the current and relevant research on the use of deep learning in retinal disease, particularly glaucoma of all types including open-angle, angle-closure, and normal-tension glaucoma. Our research query and inclusion criteria are detailed in Figure 2. In addition, this work did not distinguish between patients who had previous treatment experience and those who did not. Both treatment-experienced and treatment-naïve patients were mixed up, since most of the works focused only on the resultant disease lesions.
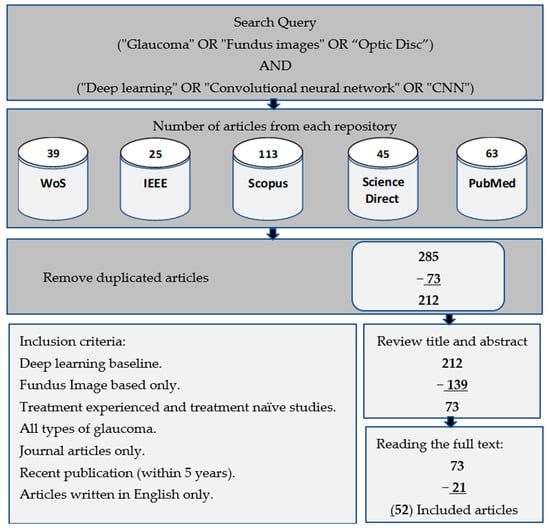
Figure 2.
Workflow process for selecting relevant studies based on research queries and inclusion criteria.
Figure 3 shows the relationship between the number of articles collected from reliable databases in conjunction with the year of publication for each article. The collected articles included a presentation of the latest proposed deep learning techniques in the field of glaucoma diagnosis.
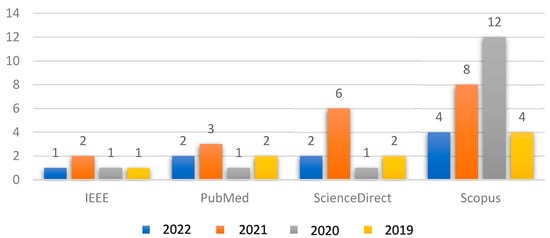
Figure 3.
Relationship between the collected articles with respect to the years of publication.
1.4. Paper Organization
The main objective of this review is to conduct a detailed analysis of various deep learning techniques recently used in the diagnosis of glaucoma diseases through the analysis of fundus images. In addition, it provides an extensive overview of the various datasets available for glaucoma disease, including their ground truth descriptions. This review additionally provides further details about deep learning frameworks, which are frequently employed in the diagnosis of retinal diseases, as well as widely used methodologies for image processing and evaluation metrics.
The review also takes into account a number of current research techniques that are related to this research focus. In brief, this review aims to provide readers with an in-depth and up-to-date understanding of the recent developments in the field of AI-based diagnosis of retinal diseases, especially with regard to glaucoma.
The organization of this article is as follows: Section 2 presents a brief summary of the various forms of glaucoma, the risk factors, the datasets readily accessible online for glaucoma diagnosis, and the evaluation metrics that are commonly utilized to measure the effectiveness of these models. Section 3 provides a breakdown of the different image pre-processing techniques that are very common for fundus imaging analysis. In Section 4, the most commonly used approaches for the detection of glaucoma are discussed along with specific backbone models that are used for both classification and segmentation tasks in fundus image analysis. Finally, Section 5 discusses several potential research gaps and the corresponding recommendations, as well as their limitations, and Section 6 concludes the article.
2. Glaucoma Overview: Types, Factors, and Datasets
Glaucoma, a complicated and progressive eye disease, has several kinds, phases, and risk factors. Understanding these categories and recognizing the risk factors is essential for proper diagnosis and treatment. Furthermore, the use of well-known public databases improves the reliability of diagnostic procedure outcomes and facilitates comparisons with related studies on this disease.
2.1. Types of Glaucoma
There are several types of glaucoma, which are open-angle glaucoma, angle-closure glaucoma, and normal-tension glaucoma [11,12]. Open-angle glaucoma, which is the most common type of glaucoma, occurs when the drainage angle in the eye becomes less efficient over time, leading to increased pressure inside the eye. Angle-closure glaucoma, on the other hand, occurs when the iris bulges outward and blocks the drainage angle, leading to a sudden increase in eye pressure [13]. Normal-tension glaucoma is a less common type that occurs when the optic nerve is damaged, even though the eye pressure is within the normal range. Treatment options for glaucoma include eye drops, medication, laser therapy, and surgery, and the choice of treatment depends on the type and severity of the disease [14].
2.2. Risk Factors for Glaucoma
There are several risk factors associated with glaucoma that include age, family history, high eye pressure, thin corneas, and certain medical conditions, such as diabetes and high blood pressure [15,16]. Other risk factors may include a history of eye injuries, long-term use of steroid medications, and a high degree of nearsightedness or farsightedness. Additionally, individuals of African, Hispanic, or Asian descent may be at higher risk of developing certain types of glaucoma. Figure 4 demonstrates the majority of glaucoma risk factors. Even though some risk factors are out of a patient’s control, regular eye tests and frequent early screening for glaucoma might be helpful in recognizing and treating this medical condition. Patients with risk factors must get their eyes checked out by an eye specialist on an ongoing schedule to check for glaucoma symptoms and hence prevent the likelihood of vision loss [17,18].
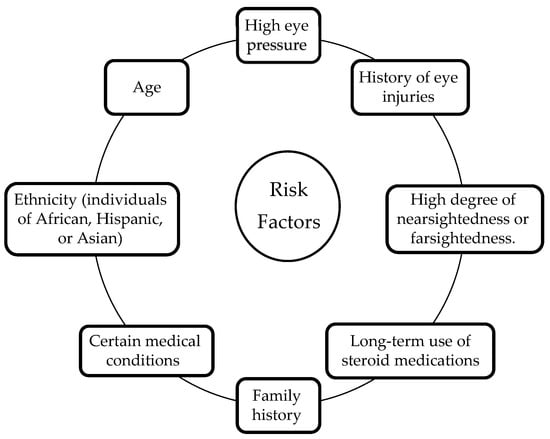
Figure 4.
Glaucoma risk factors.
2.3. Retinal Fundus Image Datasets
For the purpose of diagnosing glaucoma, there are a wide variety of datasets that are freely available online that include datasets on retinal images, optical coherence tomography (OCT) scans, and individual clinical data with glaucoma condition [6,19]. These datasets often come with expert annotated labels, whereby the labels provide additional information on the exact location and severity of retinal damage resulting from glaucoma. Such information can be utilized as the ground truth for the development and evaluation of automated glaucoma screening tools, which needs to be verified by trained ophthalmologists or qualified experts in the field. Using these data, the development of novel methods for the early detection and monitoring of glaucoma has been facilitated. Consequently, public datasets have emerged as an essential resource for researchers, physicians, and other healthcare professionals aiming to enhance glaucoma diagnosis and treatment [20,21]. Table 1 shows some of the frequently employed public datasets for glaucoma diagnosis. Each of these datasets has distinct features that can be dedicated to particular applications or types of research topics as well. Typically, both healthy and glaucoma-affected images are included in the datasets, which is an important factor to enable the creation and assessment of algorithms that are capable of distinguishing between healthy and affected eyes.

Table 1.
Overview of fundus image datasets for glaucoma diagnosis.
Figure 5 shows the distribution of the available datasets and the number of times they were used by researchers for glaucoma diagnosis. These public datasets contain fundus images according to certain criteria with specific accuracy and dimensions, and they are often divided into two or more groups for the purpose of training, validation, and testing. In addition, some researchers use specialized datasets that are collected locally from hospitals specializing in the respective eye diseases. DRISHTI-GS1, RIM-ONE, and ORIGA are the most commonly used datasets among the reviewed articles.
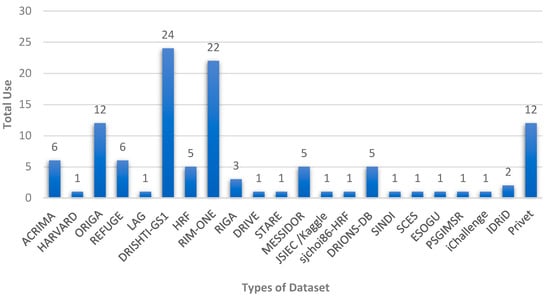
Figure 5.
Different public datasets available for automated glaucoma diagnosis systems.
3. Feature Enhancement and Evaluation
The purpose of image enhancement techniques is to increase the quality of images, which is an essential process for improving the analysis of images. Furthermore, ROI localization improves image analysis efficacy by detecting and extracting specific parts within an image that are relevant to a specific task. Finally, these operations, in addition to classification and/or segmentation operations, usually require evaluation measures that demonstrate the effectiveness of the systems applied to the data.
3.1. Pre-Processing Techniques
Retinal fundus imaging is a crucial modality used in diagnosing and monitoring various eye diseases. Despite advancements in retinal imaging technology, several challenges still exist, such as low image quality due to image artifacts, poor illumination, and motion blur [42,43].
In order to create accurate and reliable prediction models, it is common practice to pre-process fundus images prior to the training phase to minimize the effects of noise that can arise from the use of different image-capturing equipment in various illumination settings. Basically, deep learning networks often require fixed input dimensions for efficient processing. These networks commonly operate on fixed-size tensors as input, which means that the images need to be resized or transformed to a consistent size before being fed into the network.
Due to the complexity of the retinal structure, important biomarkers and lesions may not be easily identifiable in images of poor quality. In addition to noise reduction techniques, pre-processing techniques are utilized to enhance the important features of fundus images prior to the implementation of deep learning models [44,45,46]. Table 2 provides a list of commonly employed pre-processing methods for color fundus images in the diagnosis of retinal diseases.
Table 2.
General pre-processing methods for fundus images.
3.2. Optic Nerve Head Localization
In most of the automated image processing operations that are employed for diagnostic purposes, the medical images are usually coupled with localization information that is helpful for diagnostic operations.
For fundus images, which are usually used to diagnose glaucoma, the locations of the optic disc or optic nerve head are crucial in diagnosing the disease. The optic disc is the entry point of the optic nerve, which transmits visual data to the brain. It is often called the “optic nerve head” with a circular shape area on the retina [47].
In general, the process of localizing this structure will help to identify abnormalities for diagnosing diseases later on. This process reduces the attention area size, which usually increases the diagnostic accuracy since only these specific areas are analyzed. However, this approach relies on the assumption that the rest of the areas are less important for diagnosing the disease.
To locate the optic disc or optic nerve head, there are several techniques that localize the center of the optic disc and calculate its radius to be used as input for the segmentation process [48]. For the optic cup, its localization information is less crucial as it is located within the optic disc and is often easily identified.
The following list describes some of the image processing techniques that are commonly used to perform localization of the optic disc and/or the optic cup [49]. These techniques include the following:
- Threshold: A certain boundary value is set to separate the optic disc and optic cup from the surrounding retina, depending on the density of image pixels;
- Edge Detection: Identify and detect edges of the optical disc and optical cup based on sudden changes in pixel values using algorithms such as the Sobel operator or Canny edge detector;
- Template Matching: Locating the optical disc or optic cup in the image using a binary template that matches their shapes;
- Machine Learning/Deep Learning: Training a network to identify the optic disc and optic cup in a fundus image based on a set of predefined features such as texture, size, and shape.
After successful localization of the optic disc and optic cup, this information will be used as an input to implement further image processing methods such as isolating these structures, determining their sizes, and identifying any irregularities that may be present.
3.3. Performance Metrics
Performance metrics are essential components used as an evaluation measure for deep learning applications to evaluate their accuracy and efficiency among the numerous proposed segmentation and classification methods [50]. For glaucoma diagnosis, the segmentation output of the retinal fundus image is crucial information used to detect the specific areas in which the disease is present.
The standard performance metrics that are involved in the segmentation task are Jaccard index, Dice similarity coefficient (DSC), and sensitivity, which are frequently utilized to assess the effectiveness of the segmentation process. These metrics measure how closely the segmentation result matches the actual disease-affected areas, namely, the ground truth [51,52].
For the classification task, the purpose of performance metrics is to measure how well the algorithm has correctly categorized the images as either having glaucoma or being in a healthy state. Hence, it is important to collect basic information on the number of correctly classified images. The performance of a classification task is typically evaluated using metrics such as the accuracy, precision, recall, F1 score, and area under the receiver operating characteristic curve (AUC-ROC).
Hence, holistic performance metrics are essential for assessing the performance of glaucoma diagnosis classification and segmentation applications. These metrics assist researchers in assessing the methods’ precision and figuring out how well they detect the presence of glaucoma.
The evaluation and comparison of various glaucoma diagnosis techniques depend heavily on the choice of appropriate performance metrics. Table 3 lists the most commonly used metrics along with their descriptions [47,53,54].
Table 3.
Evaluation metrics for automated glaucoma screening and diagnosis systems.
Depending on the extracted articles, different sets of evaluation matrices were employed, which are appropriate to the architecture of each network, whether for segmentation or classification tasks, which reveal the strength of the performance. Figure 6 shows the distribution of the most used evaluation matrices in the collected papers.
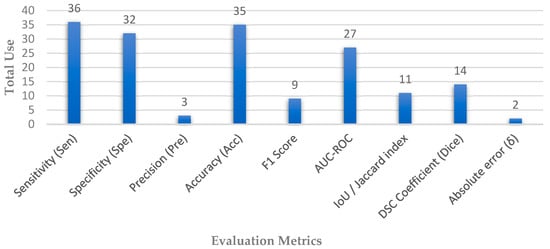
Figure 6.
Distribution of evaluation metrics used in automated glaucoma diagnosis systems.
4. Glaucoma Detection
There are two primary tasks in which deep learning algorithms have played a vital role in diagnosing retinal-based diseases: classification and segmentation. The classification task involves the process of categorizing input images into different disease categories. On the other hand, the segmentation task involves the process of identifying critical lesions and significant biomarker areas from a given fundus image of a patient, which is used to discover more details about the type and nature of retinal diseases. Several deep learning models have been created and evaluated for these tasks [10,43,55]. Figure 7 depicts an overarching deep learning framework for diagnosing retinal disease.
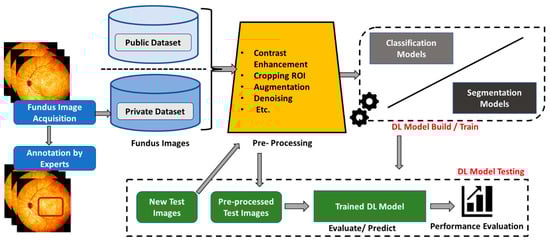
Figure 7.
Overall deep learning framework for glaucoma diagnosis.
4.1. Glaucoma Diagnosis
Glaucoma is a significant contributor to the irreversible loss of vision worldwide. Scientists have dedicated their efforts to developing diverse deep learning models aimed at identifying diseases from fundus images, similar to several other retinal ailments. Table 4 outlines a list of the experimental findings for the deep learning-based diagnosis of glaucoma.
Li et al. [26] proposed an “Attention-based AG-CNN” method that utilizes deep features highlighted by the visualized maps of pathological regions to automatically detect glaucoma. The guided back-propagation technique was used to locate small pathological regions based on predicted attention maps, enabling the refinement of attention maps to highlight the most important regions for glaucoma detection. This method has significant potential for automated glaucoma detection and identification of pathological regions in fundus images. Correspondingly, Wang et al. [56] trained deep models for glaucoma classification based on the transfer learning strategy of the VGG-16 and AlexNet architectures. In addition, images of the optic nerve head were customized from different publicly available datasets, which they divided into two subsets. One subset was augmented using various data augmentation techniques such as random scaling, shearing, rotation, and flipping, while the second subset of images was reconstructed by producing 3D topographical maps of the ONH using shading information from 2D images. After that, the generated datasets were evaluated for glaucoma classification and produced better performance than normal CNN classification models.
In another work, Gheisari et al. [57] introduced a new method for improving the accuracy of glaucoma classification by integrating the CNN frameworks of VGG16 and ResNet50 with the RNN-LSTM model. To enhance the classification performance, the proposed architecture combines static structural features with dynamic vessel features. The LSTM-based RNN was used because of its capacity to select and retain pertinent information from the image sequence in the hybrid module. To increase the accuracy of the hybrid module of glaucoma classification, a fully connected layer was added at the end of the network. On the other hand, Nayak et al. [58] suggested a new type of network architecture called “ECNet” based on fundus images for effective glaucoma detection. Convolutional, compression, ReLU, and summation layers form the basic structure of the model to extract the significant disease features. A real-coded genetic algorithm (RCGA) was used to optimize the learnable layer weights, as opposed to gradient-based algorithms, which may lead to an overfitting problem, and thus, the need for a larger training dataset. A variety of classifiers were used for the classification task, with RCGA and SVM producing the best outcomes.
Additionally, Li et al. [59] proposed a deep learning approach for identifying glaucomatous damage in fundus images using pre-trained ResNet101. To address the vanishing gradient problem during training, skip connections between the layers were utilized. These connections perform identity mapping without adding additional parameters or computational complexity. The authors also explored the integration of short medical history data with fundus images, which resulted in a slight performance improvement in the model. Furthermore, Hemelings et al. [60] proposed a novel model for glaucoma detection using deep learning and active learning techniques. The model incorporates transfer learning from ResNet-50 architecture and utilizes pre-processing techniques such as ROI extraction and data augmentation. An active learning strategy through uncertainty sampling was utilized to leverage uncertainty information from an unlabeled dataset to reduce the labeling cost. Furthermore, the model generates interpretable heat maps to support decision-making. For the same reason, Juneja et al. [61] introduced a new method called “GC-NET” for glaucoma classification using retinal fundus images. Their approach involved three pre-processing techniques, namely, image cropping, augmentation, and denoising, to eliminate irrelevant details from the input images. They then utilized a 76-layer deep CNN-based model, which included an ‘Add layer’ in every block to minimize data loss by combining the previous block output with the next block output, except for the first and final blocks.
On the one hand, Liu et al. [62] proposed a DL framework, “GD-CNN” for automatic diagnosis of glaucoma using fundus images that was trained on a large dataset of positive and negative cases from different sources. The network is based on the ResNet model and the stochastic gradient descent optimizer for binary classification. To improve the generalization ability of the model, an online DL system was introduced in which ophthalmologists iteratively confirmed the model’s classification results, whereby the confirmed samples were used for fine-tuning before making new predictions. Moreover, Bajwa et al. [63] proposed a two-stage cascade model for glaucoma screening. In the first stage, a heuristic method based on regions with CNN (RCNN) was used for the extraction and localization of OD from a retinal fundus image. This stage includes a sub-model using a rule-based algorithm to generate semi-automated annotations for OD, used during the training of the RCNN. In the second stage, a deep CNN was used to classify the extracted ROI images into two classes: glaucoma and non-glaucoma.
Apart from this, Kim et al. [64] proposed a two-pronged approach for glaucoma classification and localization. The first approach involves the glaucoma classification phase using three different CNN architectures (VGGNet, InceptionNet, and ResNet) with a variety of regularization techniques being used to increase the model’s generalization. The ResNet-152-M network produced the best diagnostic results. The second approach utilizes localization detection based on a weekly supervised method called “Grad-CAM” to identify glaucoma regions in an input image without using any segmentation data. This work also involved the development of a web-based application for locating and diagnosing glaucoma in a limited medical setting. In another work, Hung et al. [65] proposed the use of a pre-trained Efficient-Net-b0 as a base and incorporated additional patient features such as age, gender, and high myopia for binary and ternary classification of glaucoma. The binary classification sub-model task is to distinguish between glaucoma and the non-glaucoma optic disc, whereas the ternary sub-model aims to classify input images into a healthy optic disc, high-tension glaucoma, or normal-tension glaucoma. To avoid the possibility of overfitting as well as increasing the model performance, pre-processing techniques are applied first to the input images.
However, Cho et al. [66] proposed ternary classification framework of glaucoma stages based on an ensemble deep learning system. The system consists of 56 sub-models created by combining two types of fundus images, seven image filters, and four CNN architectures. A set of pre-processing techniques is first applied to the input images that include data augmentation, resizing, and filtering. Based on the average probabilities of all sub-models, the final classification decision is made, and the class with the highest probability is chosen to be the output. Leonardo et al. [67] proposed the integration of generative modeling and deep learning to improve the diagnostic performance of glaucoma by converting low-quality images into better-quality images using U-Net-based generative adversarial networks. Furthermore, the quality of the generated images was evaluated using a pre-trained CNN (EfficientNetB0), where low-quality images were excluded, while high-quality images were preserved. In addition, Alghamdi et al. [68] proposed employing three CNN architectures based on transfer, supervised, and semi-supervised learning techniques, where the three models were trained on public databases of fundus images without applying any pre-processing or enhancement techniques to the selected data. First, the transfer learning algorithm was applied to a limited dataset, and then semi-supervised learning was applied to the labeled and unlabeled datasets. Finally, unsupervised learning was applied with the supervised learning stage by using a 6-layer CNN autoencoder model to extract the necessary features.
In comparison, Devecioglu et al. [40] employed heterogeneous “Self-Organized Operational Neural Networks (Self-ONNs)” as an alternative diagnosis system to address dataset limitations and reduce the computing burden. For the purpose of evaluating the quality of the proposed model in comparison to several other trained CNN models, it was found that the proposed model produced superior performance compared to the benchmarked models. Furthermore, Juneja et al. [69] proposed a classification system based on a modified Xception network to extract precise features from the optic disc and optic cup located in the center of the retinal fundus image using fewer layers and larger filter sizes that enable self-learning for diagnosing glaucoma at the early stages. In addition, the input images are cropped and augmented to reduce the image size and computational time in order to improve the performance of the proposed model.
Carvalho et al. [70] have proposed an automated system for diagnosing glaucoma using retinal imaging, which is based on an adapted three-dimensional convolutional neural network (3DCNN). In contrast to other methods, the proposed system does not require optic disc segmentation masks. The system converts each two-dimensional input image into four volumes that represent the red, green, blue, and gray levels using a specialized technique that deeply extracts low-level features. The conventional VGG16 architecture is modified to process the generated volumes, and it is found that a better performance is achieved by increasing the number of layers. The gray-level images exhibit superior results for glaucoma classification compared to the RGB channels. Moreover, Joshi et al. [41] have presented a method for the early diagnosis of glaucoma using an ensemble of three pre-trained convolutional neural network architectures based on transfer learning: ResNet50, VGG16Net, and GoogLeNet. The proposed method employs pre-processed retinal fundus images from both public and private databases to extract features using convolutional neural networks. The extracted features then become the input to a classifier to categorize the images as normal or abnormal using the maximum voting technique.
Apart from this, Almansour et al. [71] have designed a comprehensive deep learning framework for the early detection of glaucoma by identifying morphological symptoms “(peripapillary atrophy)” in retinal fundus images. The detection methodology was executed through two deep learning models that operate sequentially on both public and local dataset images. The first model uses a mask region-based CNN (R-CNN) to localize and crop the region of interest, which acts as a pre-processing technique to enhance the performance of the framework. The second model employs three pre-trained CNN algorithms, VGG-16, ResNet-50, and Inception-V3, to classify the presence of symptoms (i.e., detect glaucoma) in the cropped regions. Aamir et al. [72] proposed a framework for the detection and classification of glaucoma using retinal fundus images based on a multi-level deep convolutional neural network “(ML-DCNN)” architecture. The proposed framework consists of three stages. In the first stage, a pre-processing step is performed using an adaptive histogram equalization technique to reduce image noise. The pre-processed images are then fed into the second stage, where a CNN detection network “DN-CNN” based on feature learning is used to detect glaucoma. Finally, the detected samples are classified into three statistical levels (Early, Moderate, and Advanced) using a CNN classification network that is dedicated to each level.
For the same reason, Islam et al. [73] proposed a classification framework for glaucoma diagnosis using two distinct datasets derived from the cropped OD/OC in addition to the segmented blood vessel dataset built using the U-Net architecture. The datasets were pre-processed with multiple augmentation methods to increase the dataset size and perform generalization. After that, four deep learning algorithms (EfficientNet, MobileNet, DenseNet, and GoogLeNet) were applied to classify the images into two categories. The EfficientNet b3 model offers the best performance for cropped fundus images. Moreover, Liao et al. [74] proposed a deep learning framework for glaucoma detection that highlights distinct areas identified by the network, providing a clinically interpretable view of the disease. The framework includes a ResNet backbone network for feature extraction, multi-layer average pooling to bridge the gap in information at different scales, and evidence activation mapping for reliable diagnosis.
On the one hand, Sudhan et al. [75] have put forth a framework that is based on deep learning techniques to achieve the tasks of segmentation and classification of glaucoma. In their proposed approach, the commonly used U-Net architecture is employed for the purpose of segmentation. Once segmentation is completed, a pre-trained DenseNet-201 architecture is employed to extract the features from the segmented images. Subsequently, a DCNN (Deep Convolutional Neural Network) architecture is utilized to classify the images and identify glaucoma cases. Furthermore, Nawaz et al. [76] employed EfficientNet-B0 to extract deep features from fundus images. These features were then fed into the “Bi-directional Feature Pyramid Network” module of (EfficientDet-D0), which applies bi-directional key point fusion iteratively on the extracted features. The resulting localized area that contains the glaucoma lesion was then used to predict the presence of glaucoma.
In another study, Diaz-Pinto et al. [77] fine-tuned five deep learning models (VGG16, VGG19, InceptionV3, ResNet50, and Xception) for glaucoma classification after pre-training the models on ImageNet. The last fully connected layer of each model was replaced with a global average pooling layer, followed by a fully connected layer with two nodes and a SoftMax classifier. Their findings concluded that Xception achieved the best performance. In the same way, Serte et al. [78] aimed to develop a glaucoma detection model that uses graph-based saliency to crop the optic disc and remove irrelevant portions of fundus images. The model then locates the optic disc and feeds it into a set of three powerful CNN architectures: namely, AlexNet, ResNet-50, and ResNet-152.
Moreover, Jos’e Martinsa et al. [79] proposed a U-shaped architecture for jointly segmenting the optic disc and optic cup, comprising four depth levels in the encoding path with two depth-wise separable convolution blocks in each level. To enhance the spatial context in the decoding path, skip connections were added at every depth level. The encoder-to-decoder path transition was augmented with an ASPP module featuring four parallel padded atrous convolutions. Furthermore, a classification network utilizing a MobileNetV2 model as a feature extractor was developed to generate a confidence level classifier to detect glaucoma. Correspondingly, Natarajan et al. [7] introduced “UNet-SNet,” which is a new and effective two-stage framework for achieving high segmentation and classification accuracies. In the first stage, a regularized U-Net is utilized as a semantic segmentation network to perform optic disc segmentation. In the second stage, a glaucoma detection model is implemented using a fine-tuned SqueezeNet CNN.
Table 4.
Glaucoma diagnosis performance comparison.
Table 4.
Glaucoma diagnosis performance comparison.
| Reference | Dataset | Camera | ACC | SEN | SPE | AUC | F1 |
|---|---|---|---|---|---|---|---|
| Li et al. [26] | Private—LAG | Topcon, Canon, Zeiss | 0.962 | 0.954 | 0.967 | 0.983 | 0.954 |
| RIM-ONE | 0.852 | 0.848 | 0.855 | 0.916 | 0.837 | ||
| Wang et al. [56] | DRIONS-DB, HRF-dataset, RIM-ONE, and DRISHTI-GS1 | - | 0.943 | 0.907 | 0.979 | 0.991 | - |
| Gheisari et al. [57] | Private | Carl Zeiss | - | 0.950 | 0.960 | 0.990 | 0.961 |
| Nayak et al. [58] | Private | Zeiss FF 450 | 0.980 | 0.975 | 0.988 | - | 0.983 |
| Li et al. [59] | Private | Zeiss Visucam 500, Canon CR2 | 0.953 | 0.962 | 0.939 | 0.994 | - |
| Hemelings et al. [60] | Private | Zeiss Visucam | - | 0.980 | 0.910 | 0.995 | - |
| Juneja et al. [61] | DRISHTI-GS and RIM-ONE | - | 0.975 | 0.988 | 0.962 | - | - |
| Liu et al. [62] | Private | Topcon, Canon, Carl Zeiss | - | 0.962 | 0.977 | 0.996 | - |
| Bajwa et al. [63] | ORIGA, HRF, and OCT & CFI | - | - | 0.712 | - | 0.874 | - |
| Kim et al. [64] | Private | - | 0.960 | 0.960 | 1.000 | 0.990 | - |
| Hung et al. [65] | Private | Zeiss Visucam, Canon CR-2AF, and KOWA | 0.910 | 0.860 | 0.940 | 0.980 | 0.860 |
| Cho et al. [66] | Private | Nonmyd7, KOWA | 0.881 | - | - | 0.975 | - |
| Leonardo et al. [67] | ORIGA, DRISHTI-GS, REFUGE, RIM-ONE (r1, r2, r3), and ACRIMA | - | 0.931 | 0.883 | 0.957 | - | - |
| Alghamdi et al. [68] | RIM-ONE and RIGA | - | 0.938 | 0.989 | 0.905 | - | - |
| Devecioglu et al. [40] | ACRIMA | - | 0.945 | 0.945 | 0.924 | - | 0.939 |
| RIM-ONE | - | 0.753 | 0.682 | 0.827 | - | 0.739 | |
| ESOGU | - | 1.000 | 1.000 | 1.000 | - | 1.000 | |
| Juneja et al. [69] | - | - | 0.935 | 0.950 | 0.990 | 0.990 | - |
| De Sales et al. [70] | DRISHTI-GS and RIM-ONEv2 | - | 0.964 | 1.000 | 0.930 | 0.965 | - |
| Joshi et al. [41] | DRISHTI-GS, HRF, DRIONS-DB, and one privet dataset PSGIMSR | - | 0.890 | 0.813 | 0.955 | - | 0.871 |
| Almansour et al. [71] | (RIGA, HRF, Kaggle, ORIGA, and Eyepacs) and one privet dataset (KAIMRC) | - | 0.780 | - | - | 0.870 | - |
| Aamir et al. [72] | Private | - | 0.994 | 0.970 | 0.990 | 0.982 | - |
| Liao et al. [74] | ORIGA | - | - | - | - | 0.880 | - |
| Sudhan et al. [75] | ORIGA | - | 0.969 | 0.970 | 0.963 | - | 0.963 |
| Nawaz et al. [76] | ORIGA | - | 0.972 | 0.970 | - | 0.979 | - |
| Diaz-Pinto et al. [77] | ACRIMA, DRISHTIGS1, sjchoi86-HRF, RIM-ONE, HRF | - | - | 0.934 | 0.858 | 0.960 | - |
| Serte et al. [78] | HARVARD | - | 0.880 | 0.860 | 0.900 | 0.940 | - |
| Jos’e et al. [79] | ORIGA, DRISHTI-GS, RIM-ONE-r1, RIM-ONE-r2, RIM-ONE-r3, iChallenge, and RIGA | - | 0.870 | 0.850 | 0.880 | 0.930 | - |
| Natarajan et al. [7] | ACRIMA | - | 0.999 | 1.000 | 0.998 | 1.000 | 0.998 |
| Drishti- GS1 | - | 0.971 | 1.000 | 0.903 | 0.999 | 0.979 | |
| RIM-ONEv1 | - | 1.000 | 1.000 | 1.000 | 1.000 | 1.000 | |
| RIM-ONEv2 | - | 0.999 | 0.990 | 0.995 | 0.998 | 0.992 | |
| Islam et al. [73] | HRF and ACRIMA | - | 0.990 | 1.000 | 0.978 | 0.989 | - |
Table 5 shows the summary of the review and investigation of the glaucoma diagnosis systems developed in the selected studies.
Table 5.
Summary on glaucoma diagnosis systems.
4.2. Optic Disc/Optic Cup Segmentation
Several essential biomarkers utilized in diagnosing glaucoma include the Optic Disc and Optic Cup. The cup-to-disc ratio is obtained by calculating the ratio of the diameter of vertical cup diameter over the vertical disc diameter. Consequently, precise segmentation of OD/OC has turned out to be crucial for glaucoma diagnosis, and a considerable amount of research has been conducted in this regard. Recent studies centered on deep learning-based segmentation of OD/OC are examined in the subsequent sections, and their corresponding experimental outcomes are presented in Table 6.
Civit-Masot et al. [80] have proposed a diagnostic aid tool for glaucoma that employs two independent sub-models to generate a diagnosis report for ophthalmologists. The first sub-model utilized two generalized U-Net architectures to segment the optic disc and optic cup independently by extracting their physical and positional characteristics. The second sub-model used a pre-trained MobileNet-V2 architecture to directly classify the fundus image without applying any segmentation network. The outputs of both sub-models were combined to create a comprehensive report that was used to assist ophthalmologists in the diagnosis process. In a similar manner, Pascal et al. [81] developed a multi-task DL model for glaucoma diagnosis that uses a modified U-Net architecture with a pre-trained VGG-16 backbone. The model’s goal is to segment the OD and OC, to localize the fovea, and to detect glaucoma based on retinal fundus images, all through a specialized optimization scheme and additional skip connections between the encoder and decoder layers.
Apart from that, Shanmugam et al. [82] proposed a glaucoma recognition model that uses deep learning-based segmentation to estimate the cup-to-disc ratio and fed the resultant segmentation mask to a random forest classifier to classify fundus images into either glaucoma or normal categories. Their model employs a modified U-Net called “Au-Net” to segment the OD and OC, which are used to estimate the CDR values. Moreover, Cheng et al. [83] developed a “Disc-aware Ensemble Network (DENet)” for glaucoma screening. Their proposed network represents fundus image information at both global and local levels, combining four sub-models: ResNet for direct image classification, U-Net for disc area segmentation, probability screening from the segmented disc area, and polar transformation to improve segmentation accuracy. These four outputs were combined to provide the final screening result.
Furthermore, Sreng et al. [84] proposed a two-stage deep learning framework for glaucoma screening using a combination of various convolutional neural networks. The first stage segmented the OD area using a modified DeepLabv3+ architecture based on five network configurations. The second stage used eleven pre-trained CNNs to extract the OD area features utilizing three ways: transfer learning, support vector machine, or a hybrid of transfer learning and support vector machine. On the one hand, Yu et al. [85] proposed a glaucoma detection model that uses a modified U-Net architecture with pre-trained ResNet34 as the backbone for segmenting the OD and OC. The segmentation process occurs in two stages, a conventional U-Net is first used to segment the ROI before a modified U-Net is used to obtain more accurate segmentation outputs for the OD and OC in the second stage. Additional post-processing techniques were also applied to calculate the vertical diameter CDR.
Similarly, Natarajan et al. [86] proposed a glaucoma detection framework using a combination of pre-processing, segmentation, and classification techniques. The images were pre-processed using CLAHE and then segmented into super-pixels (ROI) using only the green channel information. The modified kernel fuzzy C-means algorithm was applied for accurate detection of the OD and OC. A set of GLCM features was extracted from the last segmentation stage, which were then fed to the VGG16 classifier to determine the stage of the glaucoma disease. Moreover, Ganesh et al. [87] developed a DL model called “GD-Ynet” for optic disc segmentation and binary glaucoma classification. The model is based on a modified U-Net architecture that uses inception modules instead of basic convolutional layers to extract low-level features. The proposed model uses contextual features of activation maps to capture the ROI and perform optic disc segmentation. Then, aggregated transformations are used to perform binary classification for glaucoma detection from the detected optic disc.
Furthermore, Juneja et al. [88] proposed the Glaucoma Network (G-Net), which is a deep convolutional neural network framework for glaucoma diagnosis from retinal fundus images. G-Net also used a modified U-Net architecture with two separate CNNs working together to segment the (OD) and (OC), which is then used as the input to calculate the CDR. The input images are pre-processed and cropped, and only the red channel is utilized for OD segmentation, while all three channels of RGB are used for OC segmentation. The resultant data is augmented before it is fed to G-Net to detect glaucoma using the calculated CDR. For the same reason, Veena et al. [89] proposed a framework for glaucoma diagnosis also using two separate CNN models to accurately segment the optic cup and optic disc; these two pieces of information are also used to determine the CDR ratio. The models each have 39 layers of CNN to extract a greater set of features with the aim of reducing feature inconsistency. The images are pre-processed using morphological operations to improve the contrast level, Sobel filter for feature extraction, and Watershed algorithm for optic nerve localization. The resultant output is then inputted to both models to calculate the CDR.
In another work, Tabassum et al. [90] proposed a “Dense Cup Disc Encoder-Decoder Network” to segment the OD and OC without performing any localization or pre-/post-processing methods. The encoder facilitates feature reuse, and the decoder allows information reuse, thereby reducing the need for feature upsampling and lowering the number of network parameters without sacrificing the performance. Moreover, Liu et al. [91] proposed a deep separable convolution network with a dense connection as its core, complemented by a multi-scale image pyramid to enhance the network capacity. Image morphology was also used for post-processing the segmentation outcomes, and the optic disc’s center was localized using a CNN and Hough circle detection. A high-precision segmentation network was then trained using the extracted region of interest to accurately segment the optic disc and cup.
Furthermore, Nazir et al. [92] proposed a deep learning approach for the automated segmentation of the optic disc and optic cup from retinal images using a customized Mask-RCNN model. They applied a data augmentation technique by adding blurriness variations to increase the data diversity and generate the ground truth annotations. The authors incorporated the “DenseNet-77” model at the feature computation level of Mask-RCNN to compute a broader range of key points, enabling more precise localization of the OD and OC regions across various sample conditions. In addition, Rakhshanda et al. [93] employed a pixel-wise semantic segmentation model to identify the optic disc and optic cup using an encoder–decoder network. Augmented data are combined with the existing training data, which are then processed by a VGG-16 network to generate a set of feature vectors for OD, OC, and background classification. The segmentation outcomes are then utilized to calculate the CDR, which assists in the diagnosis and analysis of glaucoma.
On the one hand, Wang et al. [94] proposed an asymmetrical segmentation network that combines U-Net with a novel cross-connection subnetwork and decoding convolutional block for OD segmentation. The network also employs multi-scale input features to mitigate the impact of consecutive pooling operations. The integration of these features enhances the network’s ability to detect morphological variations in the respective regions-of-interest, while minimizing the loss of important features in the images. Similarly, Kumar et al. [95] proposed a novel approach for generating precise and accurate ground truth data by incorporating morphological operations. The U-Net architecture of 19 CNN layers with encoder and decoder blocks is utilized to discern spatial features. As a result, the model managed to improve the prediction performance of the optic disc region with greater precision and accuracy.
For the same reason, Panda et al. [96] proposed a glaucoma diagnosis deep learning approach for segmenting the optic disc and optic cup in fundus images with a limited number of training samples. This approach employs post-processing techniques, residual learning with skip connections, patch-based training, and other techniques to produce smoother boundaries and an even more accurate cup-to-disc ratio. Furthermore, Fu et al. [97] proposed a data-driven deep learning technique that employs the use of a U-Net architecture to segment the optic disc in abnormal retinal fundus images. The method employs the use of model-driven probability bubbles to determine the precise position of the optic disc and eliminate interference from light lesions, which eventually improves segmentation accuracy. Similarly, Zhao et al. [98] introduced a simplified approach that improves the accuracy of segmentation of fundus images, reduces the number of parameters, and reduces processing time by employing attention U-Net architecture and transfer learning, whereby the attention gate is placed between the encoder and decoder to put more emphasize on selected target regions.
Another attention-based network was suggested by Hu et al. [99] through an encoder–decoder-based segmentation network that includes a multi-scale weight-shared attention module and a densely linked depth-wise separable convolution module to address the issues brought on by differences in acquisition devices. The multi-scale weight-shared attention module, which is located at the top layer of the encoder, integrates both multi-scale OD and OC feature information using both channel and spatial attention processes. The densely connected depth-wise separable convolution module is integrated as the output layer of the network. Moreover, Baixin et al. [100] introduced a semantic segmentation model named the “Aggregation Channel Attention Network”, which relies heavily on contextual data. The model uses an encoder–decoder framework where a pre-trained DenseNet sub-model is included in the encoding layer and feature information from various resolutions is included in the decoding layer, which is subsequently integrated with an attention mechanism. The network can maintain spatial information using high-level characteristics to direct low-level features. To further improve network efficiency, the classification framework is also strengthened by means of cross-entropy information.
Furthermore, Shankaranarayana et al. [101] introduced a deep learning model for estimating retinal depth from a single fundus image by employing a fully convolutional network topology with a dilated residual inception block to perform multiscale feature extraction. A new pre-trained strategy called pseudo-depth reconstruction was proposed to take control over the problem of insufficient data for depth estimation. This study made another contribution by introducing a fully convolutional guided network to perform semantic segmentation based on a multi-modal fusion block that extracts the features from two separate modalities. Furthermore, Bengani et al. [102] proposed an encoder–decoder deep learning model that employs semi-supervised and transfer learning techniques to segment the optic disc in retinal fundus images. In order to extract features from unlabeled images, an autoencoder reconstructs the input images and applies a network constraint. The transfer learning technique is used to transform the pre-trained model into a segmentation network, where it is fine-tuned using ground truth labels. In the same way, Wang et al. [103] presented a patch-based output space adversarial learning context that can perform the segmentation for the optic disc and optic cup simultaneously. The approach employs a lightweight segmentation network and unsupervised domain adaptation to address domain shift challenges. The framework uses a patch-based approach for fine-grained discrimination of local segmentation details. The segmentation network combines the designs of DeepLabv3+ and MobileNetV2 to extract multi-scale discriminative context features while minimizing the computational burden.
Table 6.
Segmentation performance comparison of the reviewed related papers.
Table 6.
Segmentation performance comparison of the reviewed related papers.
| Reference | Dataset | OD/OC | ACC | SEN | SPE | PRE | AUC | IoU/Jacc | F1 | DSC | δ |
|---|---|---|---|---|---|---|---|---|---|---|---|
| Civit-Masot et al. [80] | DRISHTI-GS | OD | 0.880 | 0.910 | 0.860 | - | 0.960 | - | - | 0.930 | - |
| OC | - | - | - | - | - | - | - | 0.890 | - | ||
| RIM-ONEv3 | OD | - | - | - | - | - | - | - | 0.920 | - | |
| OC | - | - | - | - | - | - | - | 0.840 | - | ||
| Pascal et al. [81] | REFUGE | OD | - | - | - | - | 0.967 | - | - | 0.952 | - |
| OC | - | - | - | - | - | - | - | 0.875 | - | ||
| Shanmugam et al. [82] | DRISHTI-GS | OD | 0.990 | 0.870 | 0.920 | - | - | - | - | - | - |
| OC | 0.990 | 0.860 | 0.950 | - | - | - | - | - | - | ||
| Fu et al. [83] | SCES | OD | 0.843 | 0.848 | 0.838 | - | 0.918 | - | - | - | - |
| SINDI | 0.750 | 0.788 | 0.712 | - | 0.817 | - | - | - | - | ||
| REFUGE | OD | 0.955 | - | - | - | 0.951 | - | - | - | - | |
| Sreng et al. [84] | ACRIMA | 0.995 | - | - | - | 0.999 | - | - | - | - | |
| ORIGA | 0.90 | - | - | - | 0.92 | - | - | - | - | ||
| RIM–ONE | 0.973 | - | - | - | 1 | - | - | - | - | ||
| DRISHTI–GS1 | 0.868 | - | - | - | 0.916 | - | - | - | - | ||
| Yu et al. [85] | RIM–ONE | OD | - | - | - | - | - | 0.926 | - | 0.961 | - |
| OC | - | - | - | - | - | 0.743 | - | 0.845 | - | ||
| DRISHTI–GS1 | OD | - | - | - | - | - | 0.949 | - | 0.974 | - | |
| OC | - | - | - | - | - | 0.804 | - | 0.888 | - | ||
| Natarajan et al. [86] | DRIONS | OD/OC | 0.947 | 0.956 | 0.904 | 0.997 | - | - | - | - | - |
| Ganesh et al. [87] | DRISHTI-GS | OD | 0.998 | 0.981 | 0.980 | 0.997 | - | 0.995 | - | ||
| Juneja et al. [88] | DRISHTI-GS | OD | 0.959 | - | - | - | - | 0.906 | 0.935 | 0.950 | - |
| OC | 0.947 | - | - | - | - | 0.880 | 0.916 | 0.936 | - | ||
| Veena et al. [89] | DRISHTI -GS | OD | 0.985 | - | - | - | - | 0.932 | 0.954 | 0.987 | - |
| OC | 0.973 | - | - | - | - | 0.921 | 0.954 | 0.971 | - | ||
| Tabassum et al. [90] | DRISHTI-GS | OD | 0.997 | 0.975 | 0.997 | - | 0.969 | 0.918 | - | 0.959 | - |
| OC | 0.997 | 0.957 | 0.998 | - | 0.957 | 0.863 | - | 0.924 | - | ||
| RIM-ONE | OD | 0.996 | 0.973 | 0.997 | - | 0.987 | 0.910 | - | 0.958 | - | |
| OC | 0.996 | 0.952 | 0.998 | - | 0.909 | 0.753 | - | 0.862 | - | ||
| Liu et al. [91] | DRISHTI-GS | OD | - | 0.978 | - | 0.978 | - | 0.957 | - | 0.978 | - |
| OC | - | 0.922 | - | 0.915 | - | 0.844 | - | 0.912 | - | ||
| REFUGE | OD | - | 0.981 | - | 0.941 | - | 0.924 | - | 0.960 | - | |
| OC | - | 0.921 | - | 0.875 | - | 0.807 | - | 0.890 | - | ||
| Nazir et al. [92] | ORIGA | OD | 0.979 | - | - | 0.959 | - | 0.981 | 0.953 | - | - |
| OC | 0.951 | - | - | 0.971 | - | 0.963 | 0.970 | - | - | ||
| Rakhshanda et al. [93] | DRISHTI–GS1 | OD | 0.997 | 0.965 | 0.998 | - | 0.996 | - | - | 0.949 | - |
| OC | 0.996 | 0.944 | 0.997 | - | 0.957 | - | - | 0.860 | - | ||
| Wang et al. [94] | MESSIDOR | OD | - | 0.983 | - | - | - | 0.969 | - | 0.984 | - |
| ORIGA | - | 0.990 | - | - | - | 0.960 | - | 0.980 | - | ||
| REFUGE | - | 0.965 | - | - | - | 0.942 | - | 0.969 | - | ||
| Kumar et al. [95] | DRIONS-DB | OD | 0.997 | - | - | - | - | 0.983 | - | - | - |
| RIM-ONE | - | - | - | - | - | 0.979 | - | - | - | ||
| IDRiD | - | - | - | - | - | 0.976 | - | - | - | ||
| Panda et al. [96] | RIM-ONE | OD | - | - | - | - | - | - | - | 0.950 | - |
| OC | - | - | - | - | - | - | - | 0.851 | - | ||
| ORIGA | OD | - | - | - | - | - | - | - | 0.938 | - | |
| OC | - | - | - | - | - | - | - | 0.889 | - | ||
| DRISHTI–GS1 | OD | - | - | - | - | - | - | - | 0.953 | - | |
| OC | - | - | - | - | - | - | - | 0.900 | - | ||
| Fu et al. [97] | (DRIVE, Kaggle, MESSIDOR, and NIVE) | OD | - | - | - | - | 0.991 | - | - | - | - |
| - | - | - | - | - | - | - | - | - | |||
| - | - | - | - | - | - | - | - | - | |||
| - | - | - | - | - | - | - | - | - | |||
| X. Zhao et al. [98] | DRISHTI-GS | OD | 0.998 | 0.949 | 0.999 | - | - | 0.930 | - | 0.964 | - |
| OC | 0.995 | 0.877 | 0.998 | - | - | 0.785 | - | 0.879 | - | ||
| RIM-ONEv3 | OD | 0.996 | 0.924 | 0.999 | - | - | 0.887 | - | 0.940 | - | |
| OC | 0.997 | 0.813 | 0.999 | - | - | 0.724 | - | 0.840 | - | ||
| Hu et al. [99] | RIM-ONE-r3 | OD | - | - | - | - | - | 0.917 | - | 0.956 | - |
| OC | - | - | - | - | - | 0.724 | - | 0.824 | - | ||
| REFUGE | OD | - | - | - | - | - | 0.931 | - | 0.964 | - | |
| OC | - | - | - | - | - | 0.813 | - | 0.894 | - | ||
| DRISHTI-GS | OD | - | - | - | - | - | 0.950 | - | 0.974 | - | |
| OC | - | - | - | - | - | 0.834 | - | 0.900 | - | ||
| MESSIDOR | OD | - | - | - | - | - | 0.944 | - | 0.970 | - | |
| IDRiD | OD | - | - | - | - | - | 0.931 | - | 0.964 | - | |
| Shankaranarayana et al. [101] | ORIGA | OD/OC | - | - | - | - | - | - | - | - | 0.067 |
| RIMONE r3 | OD/OC | - | - | - | - | - | - | - | - | 0.066 | |
| DRISHTI–GS1 | OD/OC | - | - | - | - | - | - | - | - | 0.105 | |
| Bengani et al. [102] | DRISHTI GS1 | OD | 0.996 | 0.954 | 0.999 | - | - | 0.931 | - | 0.967 | - |
| RIM-ONE | OD | 0.995 | 0.873 | 0.998 | - | - | 0.882 | - | 0.902 | - | |
| Wang et al. [103] | DRISHTI-GS | OD/OC | - | - | - | - | - | - | - | - | 0.082 |
| RIM-ONE-r3 | OD/OC | - | - | - | - | - | - | - | - | 0.081 |
Table 7 shows the summary of the review and investigation of the OD/OC segmentation systems developed in the selected studies.
Table 7.
Summary on OD/OC segmentation systems.
5. Research Gaps, Recommendations and Limitations
5.1. Research Gaps
Glaucoma detection is a crucial task in the field of ophthalmology, as early detection can prevent blindness. In general, the reviewed articles successfully designed an automated system to diagnose glaucoma using retinal images. However, there are still some research gaps in the existing systems, as illustrated in Table 8.
Table 8.
Research gaps.
5.2. Future Recommendations
To analyze the retina, researchers normally follow several steps that depend on the research objective and the proposed techniques. The researchers may include some objectives that include enhancement, localization, segmentation, or classification. Enhancement, localization, and segmentation tasks are usually implicit steps in a classification module. For a glaucoma diagnosis system, feature extraction and classification are the most necessary steps, while the other steps can be optional depending on the proposed algorithm. Additionally, researchers often explore modifications and variations of the architectures used to further enhance the performance of glaucoma diagnosis. ResNet and GoogLeNet have shown promising performance for glaucoma diagnosis; however, the specific architecture choice may depend on the dataset and research context. The fundamental processes and essential observations for glaucoma diagnosis are outlined as follows:
- Pre-processing is crucial for effective analysis;
- Annotating a diverse set of labels is more important than having a large quantity of annotations;
- Performance can be improved through fine-tuning and augmentation techniques;
- Complex features can be captured by applying deeper neural networks;
- Sufficient training data is critical for producing a high-accuracy system;
- Additional loss functions can be integrated to prevent overfitting in specific domains;
- Multi-scale CNN can also provide better feature extraction through various scale strategies;
- Medical expertise is valuable for understanding the underlying structure of diseases.
5.3. Limitations of the Study
The reviewed studies have a common limitation due to the same source of development databases. Nevertheless, the reviewed works are fairly diverse and are representative samples of the chosen sources. However, an intelligent eye disease screening and diagnosing system for various diseases should be integrated, not limited to glaucoma only. Furthermore, analyzing research activities that use deep learning methods for the diagnosis of these critical retinal diseases may not necessarily reflect the views and responses of the broader research community.
6. Conclusions
In the field of healthcare, digital image processing and computer vision methods are employed for disease screening and diagnostic purposes. Among the various eye disorders, glaucoma is one of the chronic conditions that can result in irreversible loss of vision because of damage to the optic nerve. Color fundus imaging is a good imaging modality for medical image analysis, whereby the deep learning models have been extensively researched for the automated diagnosis systems. This review presents a process-based approach to deep learning in glaucoma diagnosis that discusses publicly available datasets and their ground truth descriptions. Some datasets comprise high-quality images taken in a controlled environment, while others have images captured in diverse environmental conditions, which can steer deep model behavior towards practical applications. Combining datasets can be used to train a robust model for real clinical implementation. Pre-processing techniques, such as image augmentation and filtering, are generally able to improve disease-relevant feature extraction. Different backbones of deep models have been explored for classification and segmentation tasks that also include different learning paradigms, such as ensemble and transfer learning techniques, in order to improve the proposed model performance. The deep learning approach has shown good performance for retinal disease diagnosis and has even surpassed expert performance in some cases. However, integrating DL models into clinical practice remains a big future challenge due to limited data, interpretability needs, validation requirements, and trust-building. To tackle this, efforts have focused on improving data quality, enhancing interpretability, establishing protocols, and addressing ethical concerns through transparency and bias mitigation.
Author Contributions
Conceptualization, M.J.M.Z. and M.A.Z.; validation, A.A.I., N.A.M.K. and A.M.M.; writing—original draft preparation, M.J.M.Z. and M.A.Z.; writing—review and editing, M.J.M.Z. and M.A.Z.; visualization, M.J.M.Z., M.A.Z., A.A.I. and S.R.A.; supervision, M.A.Z. and N.A.M.K. All authors have read and agreed to the published version of the manuscript.
Funding
This research was funded by Universiti Kebangsaan Malaysia under Dana Padanan Kolaborasi with grant number DPK-2023-006 and Asia-Pacific Telecommunity under the Extra Budgetary Contribution from the Republic of Korea Fund with grant number KK-2022-026.
Institutional Review Board Statement
Ethical review and approval were waived for this study due to the nature of the study.
Informed Consent Statement
Not applicable.
Data Availability Statement
Not applicable.
Conflicts of Interest
The authors declare no conflict of interest.
References
- Borwankar, S.; Sen, R.; Kakani, B. Improved Glaucoma Diagnosis Using Deep Learning. In Proceedings of the 2020 IEEE International Conference on Electronics, Computing and Communication Technologies (CONECCT), Bangalore, India, 2–4 July 2020; pp. 2–5. [Google Scholar] [CrossRef]
- Huang, X.; Sun, J.; Gupta, K.; Montesano, G.; Crabb, D.P.; Garway-Heath, D.F.; Brusini, P.; Lanzetta, P.; Oddone, F.; Turpin, A.; et al. Detecting Glaucoma from Multi-Modal Data Using Probabilistic Deep Learning. Front. Med. 2022, 9, 923096. [Google Scholar] [CrossRef]
- Mahdi, H.; Abbadi, N. El Glaucoma Diagnosis Based on Retinal Fundus Image: A Review. Iraqi J. Sci. 2022, 63, 4022–4046. [Google Scholar] [CrossRef]
- Hemelings, R.; Elen, B.; Barbosa-Breda, J.; Blaschko, M.B.; De Boever, P.; Stalmans, I. Deep Learning on Fundus Images Detects Glaucoma beyond the Optic Disc. Sci. Rep. 2021, 11, 20313. [Google Scholar] [CrossRef] [PubMed]
- Saeed, A.Q.; Abdullah, S.N.H.S.; Che-Hamzah, J.; Ghani, A.T.A. Accuracy of Using Generative Adversarial Networks for Glaucoma Detection: Systematic Review and Bibliometric Analysis. J. Med. Internet Res. 2021, 23, e27414. [Google Scholar] [CrossRef] [PubMed]
- Mohamed, N.A.; Zulkifley, M.A.; Zaki, W.M.D.W.; Hussain, A. An Automated Glaucoma Screening System Using Cup-to-Disc Ratio via Simple Linear Iterative Clustering Superpixel Approach. Biomed. Signal Process. Control. 2019, 53, 101454. [Google Scholar] [CrossRef]
- Natarajan, D.; Sankaralingam, E.; Balraj, K.; Karuppusamy, S. A Deep Learning Framework for Glaucoma Detection Based on Robust Optic Disc Segmentation and Transfer Learning. Int. J. Imaging Syst. Technol. 2022, 32, 230–250. [Google Scholar] [CrossRef]
- Norouzifard, M.; Nemati, A.; Gholamhosseini, H.; Klette, R.; Nouri-Mahdavi, K.; Yousefi, S. Automated Glaucoma Diagnosis Using Deep and Transfer Learning: Proposal of a System for Clinical Testing. In Proceedings of the 2018 International Conference on Image and Vision Computing New Zealand (IVCNZ), Auckland, New Zealand, 19–21 November 2018. [Google Scholar] [CrossRef]
- Elizar, E.; Zulkifley, M.A.; Muharar, R.; Hairi, M.; Zaman, M. A Review on Multiscale-Deep-Learning Applications. Sensors 2022, 22, 7384. [Google Scholar] [CrossRef] [PubMed]
- Abdani, S.R.; Zulkifley, M.A.; Shahrimin, M.I.; Zulkifley, N.H. Computer-Assisted Pterygium Screening System: A Review. Diagnostics 2022, 12, 639. [Google Scholar] [CrossRef]
- Fan, R.; Alipour, K.; Bowd, C.; Christopher, M.; Brye, N.; Proudfoot, J.A.; Goldbaum, M.H.; Belghith, A.; Girkin, C.A.; Fazio, M.A.; et al. Detecting Glaucoma from Fundus Photographs Using Deep Learning without Convolutions: Transformer for Improved Generalization. Ophthalmol. Sci. 2023, 3, 100233. [Google Scholar] [CrossRef]
- Zhou, Q.; Guo, J.; Chen, Z.; Chen, W.; Deng, C.; Yu, T.; Li, F.; Yan, X.; Hu, T.; Wang, L.; et al. Deep Learning-Based Classification of the Anterior Chamber Angle in Glaucoma Gonioscopy. Biomed. Opt. Express 2022, 13, 4668. [Google Scholar] [CrossRef]
- Afroze, T.; Akther, S.; Chowdhury, M.A.; Hossain, E.; Hossain, M.S.; Andersson, K. Glaucoma Detection Using Inception Convolutional Neural Network V3. Commun. Comput. Inf. Sci. 2021, 1435, 17–28. [Google Scholar]
- Chai, Y.; Bian, Y.; Liu, H.; Li, J.; Xu, J. Glaucoma Diagnosis in the Chinese Context: An Uncertainty Information-Centric Bayesian Deep Learning Model. Inf. Process. Manag. 2021, 58, 102454. [Google Scholar] [CrossRef]
- Balasopoulou, A.; Κokkinos, P.; Pagoulatos, D.; Plotas, P.; Makri, O.E.; Georgakopoulos, C.D.; Vantarakis, A.; Li, Y.; Liu, J.J.; Qi, P.; et al. Symposium Recent Advances and Challenges in the Management of Retinoblastoma Globe—Saving Treatments. BMC Ophthalmol. 2017, 17, 1. [Google Scholar]
- Ferro Desideri, L.; Rutigliani, C.; Corazza, P.; Nastasi, A.; Roda, M.; Nicolo, M.; Traverso, C.E.; Vagge, A. The Upcoming Role of Artificial Intelligence (AI) for Retinal and Glaucomatous Diseases. J. Optom. 2022, 15, S50–S57. [Google Scholar] [CrossRef]
- Xue, Y.; Zhu, J.; Huang, X.; Xu, X.; Li, X.; Zheng, Y.; Zhu, Z.; Jin, K.; Ye, J.; Gong, W.; et al. A Multi-Feature Deep Learning System to Enhance Glaucoma Severity Diagnosis with High Accuracy and Fast Speed. J. Biomed. Inform. 2022, 136, 104233. [Google Scholar] [CrossRef] [PubMed]
- Raghavendra, U.; Fujita, H.; Bhandary, S.V.; Gudigar, A.; Tan, J.H.; Acharya, U.R. Deep Convolution Neural Network for Accurate Diagnosis of Glaucoma Using Digital Fundus Images. Inf. Sci. 2018, 441, 41–49. [Google Scholar] [CrossRef]
- Schottenhamm, J.; Würfl, T.; Mardin, S.; Ploner, S.B.; Husvogt, L.; Hohberger, B.; Lämmer, R.; Mardin, C.; Maier, A. Glaucoma Classification in 3x3 Mm En Face Macular Scans Using Deep Learning in Different Plexus. Biomed. Opt. Express 2021, 12, 7434. [Google Scholar] [CrossRef] [PubMed]
- Saba, T.; Bokhari, S.T.F.; Sharif, M.; Yasmin, M.; Raza, M. Fundus Image Classification Methods for the Detection of Glaucoma: A Review. Microsc. Res. Tech. 2018, 81, 1105–1121. [Google Scholar] [CrossRef]
- An, G.; Omodaka, K.; Hashimoto, K.; Tsuda, S.; Shiga, Y.; Takada, N.; Kikawa, T.; Yokota, H.; Akiba, M.; Nakazawa, T. Glaucoma Diagnosis with Machine Learning Based on Optical Coherence Tomography and Color Fundus Images. J. Healthc. Eng. 2019, 2019, 4061313. [Google Scholar] [CrossRef]
- Elangovan, P.; Nath, M.K. Glaucoma Assessment from Color Fundus Images Using Convolutional Neural Network. Int. J. Imaging Syst. Technol. 2021, 31, 955–971. [Google Scholar] [CrossRef]
- Ajesh, F.; Ravi, R.; Rajakumar, G. Early diagnosis of glaucoma using multi-feature analysis and DBN based classification. J. Ambient. Intell. Humaniz. Comput. 2021, 12, 4027–4036. [Google Scholar] [CrossRef]
- Zhang, Z.; Liu, J.; Yin, F.; Wong, D.W.K.; Tan, N.M.; Cheung, C.; Hamzah, H.B.; Ho, M.; Wong, T.Y. Introduing ORIGA: An Online Retinal Fundus Image Database for Glaucoma Analysis and Research. Arvo 2011, 3065–3068. [Google Scholar] [CrossRef]
- Orlando, J.I.; Fu, H.; Barbossa Breda, J.; van Keer, K.; Bathula, D.R.; Diaz-Pinto, A.; Fang, R.; Heng, P.A.; Kim, J.; Lee, J.H.; et al. REFUGE Challenge: A Unified Framework for Evaluating Automated Methods for Glaucoma Assessment from Fundus Photographs. Med. Image Anal. 2020, 59, 101570. [Google Scholar] [CrossRef] [PubMed]
- Li, L.; Xu, M.; Liu, H.; Li, Y.; Wang, X.; Jiang, L.; Wang, Z.; Fan, X.; Wang, N. A Large-Scale Database and a CNN Model for Attention-Based Glaucoma Detection. IEEE Trans. Med. Imaging 2019, 39, 413–424. [Google Scholar] [CrossRef] [PubMed]
- Phasuk, S.; Poopresert, P.; Yaemsuk, A.; Suvannachart, P.; Itthipanichpong, R.; Chansangpetch, S.; Manassakorn, A.; Tantisevi, V.; Rojanapongpun, P.; Tantibundhit, C. Automated Glaucoma Screening from Retinal Fundus Image Using Deep Learning. In Proceedings of the 2019 41st Annual International Conference of the IEEE Engineering in Medicine and Biology Society (EMBC), Berlin, Germany, 23–27 July 2019; pp. 904–907. [Google Scholar]
- Serte, S.; Serener, A. A Generalized Deep Learning Model for Glaucoma Detection. In Proceedings of the 2019 3rd International Symposium on Multidisciplinary Studies and Innovative Technologies (ISMSIT), Ankara, Turkey, 11–13 October 2019; pp. 1–5. [Google Scholar] [CrossRef]
- Fumero, F.; Alayon, S.; Sanchez, J.L.; Sigut, J.; Gonzalez-Hernandez, M. RIM-ONE: An Open Retinal Image Database for Optic Nerve Evaluation. In Proceedings of the 2011 24th International Symposium on Computer-Based Medical Systems (CBMS), Bristol, UK, 27–30 June 2011; pp. 2–7. [Google Scholar] [CrossRef]
- Almazroa, A.A.; Alodhayb, S.; Osman, E.; Ramadan, E.; Hummadi, M.; Dlaim, M.; Alkatee, M.; Raahemifar, K.; Lakshminarayanan, V. Retinal Fundus Images for Glaucoma Analysis: The RIGA Dataset. SPIE 2018, 10579, 55–62. [Google Scholar] [CrossRef]
- Budai, A.; Bock, R.; Maier, A.; Hornegger, J.; Michelson, G. Robust Vessel Segmentation in Fundus Images. Int. J. Biomed. Imaging 2013, 2013, 154860. [Google Scholar] [CrossRef]
- Decencière, E.; Zhang, X.; Cazuguel, G.; Lay, B.; Cochener, B.; Trone, C.; Gain, P.; Ordóñez-Varela, J.R.; Massin, P.; Erginay, A.; et al. Feedback on a Publicly Distributed Image Database: The Messidor Database. Image Anal. Stereol. 2014, 33, 231–234. [Google Scholar] [CrossRef]
- Zheng, C.; Yao, Q.; Lu, J.; Xie, X.; Lin, S.; Wang, Z.; Wang, S.; Fan, Z.; Qiao, T. Detection of Referable Horizontal Strabismus in Children’s Primary Gaze Photographs Using Deep Learning. Transl. Vis. Sci. Technol. 2021, 10, 33. [Google Scholar] [CrossRef]
- Abbas, Q. Glaucoma-Deep: Detection of Glaucoma Eye Disease on Retinal Fundus Images Using Deep Learning. Int. J. Adv. Comput. Sci. Appl. 2017, 41–45. [Google Scholar] [CrossRef]
- Neto, A.; Camara, J.; Cunha, A. Evaluations of Deep Learning Approaches for Glaucoma Screening Using Retinal Images from Mobile Device. Sensors 2022, 22, 1449. [Google Scholar] [CrossRef]
- Mahum, R.; Rehman, S.U.; Okon, O.D.; Alabrah, A.; Meraj, T.; Rauf, H.T. A Novel Hybrid Approach Based on Deep Cnn to Detect Glaucoma Using Fundus Imaging. Electron. 2022, 11, 26. [Google Scholar] [CrossRef]
- Baskaran, M.; Foo, R.C.; Cheng, C.Y.; Narayanaswamy, A.K.; Zheng, Y.F.; Wu, R.; Saw, S.M.; Foster, P.J.; Wong, T.Y.; Aung, T. The Prevalence and Types of Glaucoma in an Urban Chinese Population: The Singapore Chinese Eye Study. JAMA Ophthalmol. 2015, 133, 874–880. [Google Scholar] [CrossRef] [PubMed]
- Bajwa, M.N.; Singh, G.A.P.; Neumeier, W.; Malik, M.I.; Dengel, A.; Ahmed, S. G1020: A Benchmark Retinal Fundus Image Dataset for Computer-Aided Glaucoma Detection. In Proceedings of the 2020 International Joint Conference on Neural Networks (IJCNN), Glasgow, UK, 19–24 July 2020; pp. 1–7. [Google Scholar] [CrossRef]
- Kovalyk, O.; Morales-Sánchez, J.; Verdú-Monedero, R.; Sellés-Navarro, I.; Palazón-Cabanes, A.; Sancho-Gómez, J.L. PAPILA: Dataset with Fundus Images and Clinical Data of Both Eyes of the Same Patient for Glaucoma Assessment. Sci. Data 2022, 9, 291. [Google Scholar] [CrossRef] [PubMed]
- Devecioglu, O.C.; Malik, J.; Ince, T.; Kiranyaz, S.; Atalay, E.; Gabbouj, M. Real-Time Glaucoma Detection from Digital Fundus Images Using Self-ONNs. IEEE Access 2021, 9, 140031–140041. [Google Scholar] [CrossRef]
- Joshi, S.; Partibane, B.; Hatamleh, W.A.; Tarazi, H.; Yadav, C.S.; Krah, D. Glaucoma Detection Using Image Processing and Supervised Learning for Classification. J. Healthc. Eng. 2022, 2022, 2988262. [Google Scholar] [CrossRef]
- Zhao, R.; Chen, X.; Liu, X.; Chen, Z.; Guo, F.; Li, S. Direct Cup-to-Disc Ratio Estimation for Glaucoma Screening via Semi-Supervised Learning. IEEE J. Biomed. Health Inform. 2020, 24, 1104–1113. [Google Scholar] [CrossRef]
- Goutam, B.; Hashmi, M.F.; Geem, Z.W.; Bokde, N.D. A Comprehensive Review of Deep Learning Strategies in Retinal Disease Diagnosis Using Fundus Images. IEEE Access 2022, 10, 57796–57823. [Google Scholar] [CrossRef]
- Sulot, D.; Alonso-Caneiro, D.; Ksieniewicz, P.; Krzyzanowska-Berkowska, P.; Iskander, D.R. Glaucoma Classification Based on Scanning Laser Ophthalmoscopic Images Using a Deep Learning Ensemble Method. PLoS ONE 2021, 16, e0252339. [Google Scholar] [CrossRef]
- Parashar, D.; Agrawal, D. 2-D Compact Variational Mode Decomposition- Based Automatic Classification of Glaucoma Stages from Fundus Images. IEEE Trans. Instrum. Meas. 2021, 70, 1–10. [Google Scholar] [CrossRef]
- Zulkifley, M.A.; Moubark, A.M.; Saputro, A.H.; Abdani, S.R. Automated Apple Recognition System Using Semantic Segmentation Networks with Group and Shuffle Operators. Agric. 2022, 12, 756. [Google Scholar] [CrossRef]
- Viola Stella Mary, M.C.; Rajsingh, E.B.; Naik, G.R. Retinal Fundus Image Analysis for Diagnosis of Glaucoma: A Comprehensive Survey. IEEE Access 2016, 4, 4327–4354. [Google Scholar] [CrossRef]
- Fu, H.; Cheng, J.; Xu, Y.; Wong, D.W.K.; Liu, J.; Cao, X. Joint Optic Disc and Cup Segmentation Based on Multi-Label Deep Network and Polar Transformation. IEEE Trans. Med. Imaging 2018, 37, 1597–1605. [Google Scholar] [CrossRef] [PubMed]
- Hoover, A. Locating Blood Vessels in Retinal Images by Piecewise Threshold Probing of a Matched Filter Response. IEEE Trans. Med. Imaging 2000, 19, 203–210. [Google Scholar] [CrossRef] [PubMed]
- Shabbir, A.; Rasheed, A.; Shehraz, H.; Saleem, A.; Zafar, B.; Sajid, M.; Ali, N.; Dar, S.H.; Shehryar, T. Detection of Glaucoma Using Retinal Fundus Images: A Comprehensive Review. Math. Biosci. Eng. 2021, 18, 2033–2076. [Google Scholar] [CrossRef] [PubMed]
- Hagiwara, Y.; Koh, J.E.W.; Tan, J.H.; Bhandary, S.V.; Laude, A.; Ciaccio, E.J.; Tong, L.; Acharya, U.R. Computer-Aided Diagnosis of Glaucoma Using Fundus Images: A Review. Comput. Methods Programs Biomed. 2018, 165, 1–12. [Google Scholar] [CrossRef] [PubMed]
- Serener, A.; Serte, S. Transfer Learning for Early and Advanced Glaucoma Detection with Convolutional Neural Networks. In Proceedings of the 2019 Medical Technologies Congress (TIPTEKNO), Izmir, Turkey, 3–5 October 2019; pp. 1–4. [Google Scholar] [CrossRef]
- Ramesh, P.V.; Subramaniam, T.; Ray, P.; Devadas, A.K.; Ramesh, S.V.; Ansar, S.M.; Ramesh, M.K.; Rajasekaran, R.; Parthasarathi, S. Utilizing Human Intelligence in Artificial Intelligence for Detecting Glaucomatous Fundus Images Using Human-in-the-Loop Machine Learning. Indian J. Ophthalmol. 2022, 70, 1131–1138. [Google Scholar] [CrossRef]
- Mohd Stofa, M.; Zulkifley, M.A.; Mohd Zainuri, M.A.A. Skin Lesions Classification and Segmentation: A Review. Int. J. Adv. Comput. Sci. Appl. 2021, 12, 532–541. [Google Scholar] [CrossRef]
- Chai, Y.; Liu, H.; Xu, J. Glaucoma Diagnosis Based on Both Hidden Features and Domain Knowledge through Deep Learning Models. Knowledge-Based Syst. 2018, 161, 147–156. [Google Scholar] [CrossRef]
- Wang, P.; Yuan, M.; He, Y.; Sun, J. 3D Augmented Fundus Images for Identifying Glaucoma via Transferred Convolutional Neural Networks. Int. Ophthalmol. 2021, 41, 2065–2072. [Google Scholar] [CrossRef]
- Gheisari, S.; Shariflou, S.; Phu, J.; Kennedy, P.J.; Agar, A.; Kalloniatis, M.; Golzan, S.M. A Combined Convolutional and Recurrent Neural Network for Enhanced Glaucoma Detection. Sci. Rep. 2021, 11, 1–11. [Google Scholar] [CrossRef]
- Nayak, D.R.; Das, D.; Majhi, B.; Bhandary, S.V.; Acharya, U.R. ECNet: An Evolutionary Convolutional Network for Automated Glaucoma Detection Using Fundus Images. Biomed. Signal Process. Control. 2021, 67, 102559. [Google Scholar] [CrossRef]
- Li, F.; Yan, L.; Wang, Y.; Shi, J.; Chen, H.; Zhang, X.; Jiang, M.; Wu, Z.; Zhou, K. Deep Learning-Based Automated Detection of Glaucomatous Optic Neuropathy on Color Fundus Photographs. Graefe’s Arch. Clin. Exp. Ophthalmol. 2020, 258, 851–867. [Google Scholar] [CrossRef] [PubMed]
- Hemelings, R.; Elen, B.; Barbosa-Breda, J.; Lemmens, S.; Meire, M.; Pourjavan, S.; Vandewalle, E.; Van de Veire, S.; Blaschko, M.B.; De Boever, P.; et al. Accurate Prediction of Glaucoma from Colour Fundus Images with a Convolutional Neural Network That Relies on Active and Transfer Learning. Acta Ophthalmol. 2020, 98, e94–e100. [Google Scholar] [CrossRef] [PubMed]
- Juneja, M.; Thakur, N.; Thakur, S.; Uniyal, A.; Wani, A.; Jindal, P. GC-NET for Classification of Glaucoma in the Retinal Fundus Image. Mach. Vis. Appl. 2020, 31, 1–18. [Google Scholar] [CrossRef]
- Liu, H.; Li, L.; Wormstone, I.M.; Qiao, C.; Zhang, C.; Liu, P.; Li, S.; Wang, H.; Mou, D.; Pang, R.; et al. Development and Validation of a Deep Learning System to Detect Glaucomatous Optic Neuropathy Using Fundus Photographs. JAMA Ophthalmol. 2019, 137, 1353–1360. [Google Scholar] [CrossRef]
- Bajwa, M.N.; Malik, M.I.; Siddiqui, S.A.; Dengel, A.; Shafait, F.; Neumeier, W.; Ahmed, S. Two-Stage Framework for Optic Disc Localization and Glaucoma Classification in Retinal Fundus Images Using Deep Learning. BMC Med. Inform. Decis. Mak. 2019, 19, 136. [Google Scholar] [CrossRef]
- Kim, M.; Han, J.C.; Hyun, S.H.; Janssens, O.; Van Hoecke, S.; Kee, C.; De Neve, W. Medinoid: Computer-Aided Diagnosis and Localization of Glaucoma Using Deep Learning. Appl. Sci. 2019, 9, 3064. [Google Scholar] [CrossRef]
- Hung, K.H.; Kao, Y.C.; Tang, Y.H.; Chen, Y.T.; Wang, C.H.; Wang, Y.C.; Lee, O.K.S. Application of a Deep Learning System in Glaucoma Screening and Further Classification with Colour Fundus Photographs: A Case Control Study. BMC Ophthalmol. 2022, 22, 483. [Google Scholar] [CrossRef]
- Cho, H.; Hwang, Y.H.; Chung, J.K.; Lee, K.B.; Park, J.S.; Kim, H.G.; Jeong, J.H. Deep Learning Ensemble Method for Classifying Glaucoma Stages Using Fundus Photographs and Convolutional Neural Networks. Curr. Eye Res. 2021, 46, 1516–1524. [Google Scholar] [CrossRef]
- Leonardo, R.; Goncalves, J.; Carreiro, A.; Simoes, B.; Oliveira, T.; Soares, F. Impact of Generative Modeling for Fundus Image Augmentation with Improved and Degraded Quality in the Classification of Glaucoma. IEEE Access 2022, 10, 111636–111649. [Google Scholar] [CrossRef]
- Alghamdi, M.; Abdel-Mottaleb, M. A Comparative Study of Deep Learning Models for Diagnosing Glaucoma from Fundus Images. IEEE Access 2021, 9, 23894–23906. [Google Scholar] [CrossRef]
- Juneja, M.; Thakur, S.; Uniyal, A.; Wani, A.; Thakur, N.; Jindal, P. Deep Learning-Based Classification Network for Glaucoma in Retinal Images. Comput. Electr. Eng. 2022, 101, 108009. [Google Scholar] [CrossRef]
- de Sales Carvalho, N.R.; da Conceição Leal Carvalho Rodrigues, M.; de Carvalho Filho, A.O.; Mathew, M.J. Automatic Method for Glaucoma Diagnosis Using a Three-Dimensional Convoluted Neural Network. Neurocomputing 2021, 438, 72–83. [Google Scholar] [CrossRef]
- Almansour, A.; Alawad, M.; Aljouie, A.; Almatar, H.; Qureshi, W.; Alabdulkader, B.; Alkanhal, N.; Abdul, W.; Almufarrej, M.; Gangadharan, S.; et al. Peripapillary Atrophy Classification Using CNN Deep Learning for Glaucoma Screening. PLoS ONE 2022, 17, e0275446. [Google Scholar] [CrossRef] [PubMed]
- Aamir, M.; Irfan, M.; Ali, T.; Ali, G.; Shaf, A.; Alqahtani Saeed, S.; Al-Beshri, A.; Alasbali, T.; Mahnashi, M.H. An Adoptive Threshold-Based Multi-Level Deep Convolutional Neural Network for Glaucoma Eye Disease Detection and Classification. Diagnostics 2020, 10, 602. [Google Scholar] [CrossRef]
- Islam, M.T.; Mashfu, S.T.; Faisal, A.; Siam, S.C.; Naheen, I.T.; Khan, R. Deep Learning-Based Glaucoma Detection with Cropped Optic Cup and Disc and Blood Vessel Segmentation. IEEE Access 2022, 10, 2828–2841. [Google Scholar] [CrossRef]
- Liao, W.; Zou, B.; Zhao, R.; Chen, Y.; He, Z.; Zhou, M. Clinical Interpretable Deep Learning Model for Glaucoma Diagnosis. IEEE J. Biomed. Health Informatics 2020, 24, 1405–1412. [Google Scholar] [CrossRef]
- Sudhan, M.B.; Sinthuja, M.; Pravinth Raja, S.; Amutharaj, J.; Charlyn Pushpa Latha, G.; Sheeba Rachel, S.; Anitha, T.; Rajendran, T.; Waji, Y.A. Segmentation and Classification of Glaucoma Using U-Net with Deep Learning Model. J. Healthc. Eng. 2022, 2022, 1601354. [Google Scholar] [CrossRef]
- Nawaz, M.; Nazir, T.; Javed, A.; Tariq, U.; Yong, H.S.; Khan, M.A.; Cha, J. An Efficient Deep Learning Approach to Automatic Glaucoma Detection Using Optic Disc and Optic Cup Localization. Sensors 2022, 22, 434. [Google Scholar] [CrossRef]
- Diaz-Pinto, A.; Morales, S.; Naranjo, V.; Köhler, T.; Mossi, J.M.; Navea, A. CNNs for Automatic Glaucoma Assessment Using Fundus Images: An Extensive Validation. Biomed. Eng. Online 2019, 18, 29. [Google Scholar] [CrossRef]
- Serte, S.; Serener, A. Graph-Based Saliency and Ensembles of Convolutional Neural Networks for Glaucoma Detection. IET Image Process. 2021, 15, 797–804. [Google Scholar] [CrossRef]
- Martins, J.; Cardoso, J.S.; Soares, F. Offline Computer-Aided Diagnosis for Glaucoma Detection Using Fundus Images Targeted at Mobile Devices. Computer. Methods Programs Biomed 2020, 192, 105341. [Google Scholar] [CrossRef]
- Civit-Masot, J.; Dominguez-Morales, M.J.; Vicente-Diaz, S.; Civit, A. Dual Machine-Learning System to Aid Glaucoma Diagnosis Using Disc and Cup Feature Extraction. IEEE Access 2020, 8, 127519–127529. [Google Scholar] [CrossRef]
- Pascal, L.; Perdomo, O.J.; Bost, X.; Huet, B.; Otálora, S.; Zuluaga, M.A. Multi-Task Deep Learning for Glaucoma Detection from Color Fundus Images. Sci. Rep. 2022, 12, 1–10. [Google Scholar] [CrossRef]
- Shanmugam, P.; Raja, J.; Pitchai, R. An Automatic Recognition of Glaucoma in Fundus Images Using Deep Learning and Random Forest Classifier. Appl. Soft Comput. 2021, 109, 107512. [Google Scholar] [CrossRef]
- Fu, H.; Cheng, J.; Xu, Y.; Zhang, C.; Wong, D.W.K.; Liu, J.; Cao, X. Disc-Aware Ensemble Network for Glaucoma Screening from Fundus Image. IEEE Trans. Med. Imaging 2018, 37, 2493–2501. [Google Scholar] [CrossRef] [PubMed]
- Sreng, S.; Maneerat, N.; Hamamoto, K.; Win, K.Y. Deep Learning for Optic Disc Segmentation and Glaucoma Diagnosis on Retinal Images. Appl. Sci. 2020, 10, 4916. [Google Scholar] [CrossRef]
- Yu, S.; Xiao, D.; Frost, S.; Kanagasingam, Y. Robust Optic Disc and Cup Segmentation with Deep Learning for Glaucoma Detection. Comput. Med. Imaging Graph. 2019, 74, 61–71. [Google Scholar] [CrossRef]
- Natarajan, D.; Sankaralingam, E.; Balraj, K.; Thangaraj, V. Automated Segmentation Algorithm with Deep Learning Framework for Early Detection of Glaucoma. Concurr. Comput. Pract. Exp. 2021, 33, e6181. [Google Scholar] [CrossRef]
- Ganesh, S.S.; Kannayeram, G.; Karthick, A.; Muhibbullah, M. A Novel Context Aware Joint Segmentation and Classification Framework for Glaucoma Detection. Comput. Math. Methods Med. 2021, 2021, 2921737. [Google Scholar] [CrossRef]
- Juneja, M.; Singh, S.; Agarwal, N.; Bali, S.; Gupta, S.; Thakur, N.; Jindal, P. Automated Detection of Glaucoma Using Deep Learning Convolution Network (G-Net). Multimed. Tools Appl. 2020, 79, 15531–15553. [Google Scholar] [CrossRef]
- Veena, H.N.; Muruganandham, A.; Senthil Kumaran, T. A Novel Optic Disc and Optic Cup Segmentation Technique to Diagnose Glaucoma Using Deep Learning Convolutional Neural Network over Retinal Fundus Images. J. King Saud Univ. Comput. Inf. Sci. 2022, 34, 6187–6198. [Google Scholar] [CrossRef]
- Tabassum, M.; Khan, T.M.; Arsalan, M.; Naqvi, S.S.; Ahmed, M.; Madni, H.A.; Mirza, J. CDED-Net: Joint Segmentation of Optic Disc and Optic Cup for Glaucoma Screening. IEEE Access 2020, 8, 102733–102747. [Google Scholar] [CrossRef]
- Liu, B.; Pan, D.; Song, H. Joint Optic Disc and Cup Segmentation Based on Densely Connected Depthwise Separable Convolution Deep Network. BMC Med. Imaging 2021, 21, 14. [Google Scholar] [CrossRef] [PubMed]
- Nazir, T.; Irtaza, A.; Starovoitov, V. Optic Disc and Optic Cup Segmentation for Glaucoma Detection from Blur Retinal Images Using Improved Mask-RCNN. Int. J. Opt. 2021, 2021, 6641980. [Google Scholar] [CrossRef]
- Imtiaz, R.; Khan, T.M.; Naqvi, S.S.; Arsalan, M.; Nawaz, S.J. Screening of Glaucoma Disease from Retinal Vessel Images Using Semantic Segmentation. Comput. Electr. Eng. 2021, 91, 107036. [Google Scholar] [CrossRef]
- Wang, L.; Gu, J.; Chen, Y.; Liang, Y.; Zhang, W.; Pu, J.; Chen, H. Automated Segmentation of the Optic Disc from Fundus Images Using an Asymmetric Deep Learning Network. Pattern Recognit. 2021, 112, 107810. [Google Scholar] [CrossRef]
- Kumar, E.S.; Bindu, C.S. Two-Stage Framework for Optic Disc Segmentation and Estimation of Cup-to-Disc Ratio Using Deep Learning Technique. J. Ambient Intell. Humaniz. Comput. 2021, 1–13. [Google Scholar] [CrossRef]
- Panda, R.; Puhan, N.B.; Mandal, B.; Panda, G. GlaucoNet: Patch-Based Residual Deep Learning Network for Optic Disc and Cup Segmentation Towards Glaucoma Assessment. SN Comput. Sci. 2021, 2, 99. [Google Scholar] [CrossRef]
- Fu, Y.; Chen, J.; Li, J.; Pan, D.; Yue, X.; Zhu, Y. Optic Disc Segmentation by U-Net and Probability Bubble in Abnormal Fundus Images. Pattern Recognit. 2021, 117, 107971. [Google Scholar] [CrossRef]
- Zhao, X.; Wang, S.; Zhao, J.; Wei, H. Application of an Attention U-Net Incorporating Transfer Learning for Optic Disc and Cup Segmentation. Signal Image Video Process. 2020, 15, 913–921. [Google Scholar] [CrossRef]
- Hu, Q.I.Z.; Hen, X.I.C.; Eng, Q.I.M.; Iahuan, J.; Ong, S.; Uo, G.A.L.; Ang, M.E.N.G.W.; Hi, F.E.I.S.; Hongyue, Z.; Hen, C.; et al. GDCSeg-Net: General Optic Disc and Cup Segmentation Network for Multi-Device Fundus Images. Biomed. Opt. Express 2021, 12, 6529–6544. [Google Scholar] [CrossRef]
- Jin, B.; Liu, P.; Wang, P.; Shi, L.; Zhao, J. Optic Disc Segmentation Using Attention-Based U-Net and the Improved Cross-Entropy Convolutional Neural Network. Entropy 2020, 22, 844. [Google Scholar] [CrossRef] [PubMed]
- Shankaranarayana, S.M.; Ram, K.; Mitra, K.; Sivaprakasam, M. Fully Convolutional Networks for Monocular Retinal Depth Estimation and Optic Disc-Cup Segmentation. IEEE J. Biomed. Health Informatics 2019, 23, 1417–1426. [Google Scholar] [CrossRef]
- Bengani, S.; Arul, A.; Vadivel, S. Automatic Segmentation of Optic Disc in Retinal Fundus Images Using Semi-Supervised Deep Learning. Multimedia Tools Appl. 2020, 80, 3443–3468. [Google Scholar] [CrossRef]
- Wang, S.; Yu, L.; Member, S.; Yang, X.; Fu, C. Patch-Based Output Space Adversarial Learning for Joint Optic Disc and Cup Segmentation. IEEE Trans. Med. Imaging 2019, 38, 2485–2495. [Google Scholar] [CrossRef]
Disclaimer/Publisher’s Note: The statements, opinions and data contained in all publications are solely those of the individual author(s) and contributor(s) and not of MDPI and/or the editor(s). MDPI and/or the editor(s) disclaim responsibility for any injury to people or property resulting from any ideas, methods, instructions or products referred to in the content. |
© 2023 by the authors. Licensee MDPI, Basel, Switzerland. This article is an open access article distributed under the terms and conditions of the Creative Commons Attribution (CC BY) license (https://creativecommons.org/licenses/by/4.0/).