Abstract
Postoperative nausea and vomiting (PONV) are common complications after surgery. This study aimed to present the utilization of machine learning for predicting PONV and provide insights based on a large amount of data. This retrospective study included data on perioperative features of patients, such as patient characteristics and perioperative factors, from two hospitals. Logistic regression algorithms, random forest, light-gradient boosting machines, and multilayer perceptrons were used as machine learning algorithms to develop the models. The dataset of this study included 106,860 adult patients, with an overall incidence rate of 14.4% for PONV. The area under the receiver operating characteristic curve (AUROC) of the models was 0.60–0.67. In the prediction models that included only the known risk and mitigating factors of PONV, the AUROC of the models was 0.54–0.69. Some features were found to be associated with patient-controlled analgesia, with opioids being the most important feature in almost all models. In conclusion, machine learning provides valuable insights into PONV prediction, the selection of significant features for prediction, and feature engineering.
1. Introduction
Postoperative nausea and vomiting (PONV) is a common and distressing complication experienced by patients after surgery, particularly under general anesthesia [1,2,3,4]. This can lead to discomfort, delayed recovery, and even extended hospital stays, negatively affecting the overall patient experience and increasing healthcare costs [3,5,6]. Therefore, effective management of PONV is crucial for improving patient outcomes and satisfaction during the postoperative period [7].
Traditional approaches to managing PONV involve the administration of prophylactic antiemetic medications to high-risk patients based on clinical risk factors [7,8,9]. However, these approaches are often suboptimal as they may not accurately predict individual patient risks and can result in unnecessary medication use [10]. Consequently, there is a growing interest in developing more precise and personalized predictive models for PONV, leveraging machine learning algorithms to consider patient-specific data and risk factors.
In recent years, advancements in machine learning have revolutionized various fields, including healthcare [11,12]. In particular, machine learning holds great promise in the prediction and prevention of postoperative complications [13,14], such as PONV. The ability to accurately predict which patients are at higher risk for PONV would allow clinicians to tailor preventive strategies and interventions proactively, ultimately improving patient care and recovery.
This study aimed to present a predictive model for PONV that we developed through machine learning techniques using anonymized patient information, including demographic characteristics, medical history, surgical details, and medication administration records.
2. Materials and Methods
2.1. Study Design
This study used data that had been collected from the electronic medical records of two hospitals at Hallym University. Data were collected from 1 January 2013 to 30 April 2023. This study complied with the World Medical Association Declaration of Helsinki and was approved by the Institutional Regional Ethics Committee. The requirement for informed consent was waived because the data used were from patients whose treatment ended.
2.2. Participants
This study included data from patients who underwent surgery and excluded those aged <18 years who underwent surgery under non-general anesthesia, were unconscious, received postoperative ventilator care, underwent reoperation or discharge within 24 h after surgery, or had missing data.
2.3. Postoperative Nausea and Vomiting
PONV was defined as the occurrence of nausea or vomiting within 24 h after surgery.
2.4. Other Features
The dataset in this study included 103 features that consisted of patient characteristics and perioperative data: Age, the female sex, body mass index, alcohol, smoking, comorbidities (congestive heart failure, cardiac arrhythmias, valvular disease, pulmonary circulation disorders, peripheral vascular disorders, hypertension uncomplicated, hypertension complicated, paralysis, other neurological disorders, chronic pulmonary disease, diabetes uncomplicated, diabetes complicated, hypothyroidism, renal failure, liver disease, peptic ulcer disease excluding bleeding, acquired immune deficiency syndrome/human immunodeficiency virus, lymphoma, metastatic cancer, solid tumor without metastasis, rheumatoid arthritis/collagen vascular diseases, coagulopathy, obesity, weight loss, fluid and electrolyte disorders, blood loss anemia, deficiency anemia, alcohol abuse, drug abuse, psychoses, depression, gastroesophageal reflux disease, migraine), preoperative data (preoperative nausea vomiting, American Society of Anesthesiologists physical status, emergency), intraoperative data (anesthesia time, operation time, administered blood and fluid, urine output, estimated blood loss, unit of packed red blood cells, fresh frozen plasma and platelet concentration, arterial cannulation line, central venous cannulation line, Foley catheter, Levin-tube, type and dose of anesthetics, N2O, antiemetics and type of surgery) and postoperative data (type of patient-controlled analgesia [PCA], dose of opioid in PCA, rate of PCA, opioid dose in postanesthetic care [PACU], O2 supplying after surgery, frequency of administered opioid after PACU, opioid dose except for transdermal opioid patch after PACU and opioid dose of transdermal opioid patch after PACU).
2.5. Data Preprocessing
Data were divided into continuous and categorical categories. Continuous data were standardized by removing the mean and scaling it to the unit variance [15]. This study had an imbalance in the target PONV. There were more patients without PONV than those with PONV. In classification problems, imbalanced datasets negatively affect the accuracy of class predictions [16]. To solve this problem, we applied the synthetic minority oversampling technique (SMOTE) [17]. SMOTE is a method for generating new data of a minor class using the k-NN algorithm. Subsequently, we divided the entire dataset into training and test datasets in an 8:2 ratio. We randomly assigned similar rates of PONV to the training and test sets.
2.6. Machine Learning
We used five algorithms to develop the PONV prediction models. The four algorithms were as follows: logistic regression, random forest, light-gradient boosting machine, multilayer perceptron, and extreme boosting machine [18,19,20,21,22]. In the random forest, we used the balanced random forest built-in packages without SMOTE. A balanced random forest randomly under-samples each bootstrap sample to balance it [23]. Prediction models were developed by applying a training dataset to each algorithm.
Hyperparameter tuning and cross-validation using RandomSearchCV were conducted to obtain the models with the best performance. RandomSearchCV is a random combination of selected hyperparameters used to train the model [24]. The hyperparameters used in RandomSearchCV are summarized in Listing A1 in Appendix A. We determined a strategy to evaluate the performance of the five-fold cross-validated model on the training set as the area under the receiver operating characteristic curve (AUROC). Subsequently, the best models for each algorithm were evaluated using a test set.
Additionally, we developed simplified models that included features known to be associated with PONV in adults, which included female sex, smoking status, age, volatile anesthetics, duration of anesthesia, postoperative opioid use, risky surgery (laparoscopic surgery and obstetric gynecologic surgery), and preventive antiemetics. Although most known risks or mitigation factors follow the Fourth Consensus Guidelines for the Management of Postoperative Nausea and Vomiting [9], some features were missing or insufficient. Postoperative opioid use was determined when opioids were used within 24 h after surgery. Preventive antiemetics were determined when antiemetics were used intraoperatively or in the PACU before the occurrence of PONV. As we did not have data associated with a history of PONV, or motion sickness, we added data regarding preoperative nausea and vomiting. For risky surgeries, we included only laparoscopic surgery and obstetric and gynecologic surgery because we did not have data on cholecystectomy and bariatric surgery.
To obtain the feature importance, we used mutual information, which quantifies the dependency or association between two random variables. In the context of feature importance, mutual information is used to measure the amount of information gained regarding a target variable by knowing the value of a particular feature. This is a method to assess the relevance of a feature in predicting a target variable [25].
2.7. Statistics
Descriptive analyses were performed to compare the characteristics and perioperative data of the training and test sets. Categorical features were presented as numbers and percentages, and continuous features were presented as medians and interquartile ranges. The differences were evaluated as absolute standardized differences. Five metrics were calculated to assess the model performance; the AUROC was used as the primary metric, as well as recall, precision, f1-score, and accuracy. Bootstrapping (n = 1000) was performed to calculate 95% confidence intervals (CI). Python (version 3.7; PSF, Beaverton, OR, USA) was used to calculate the model metrics.
3. Results
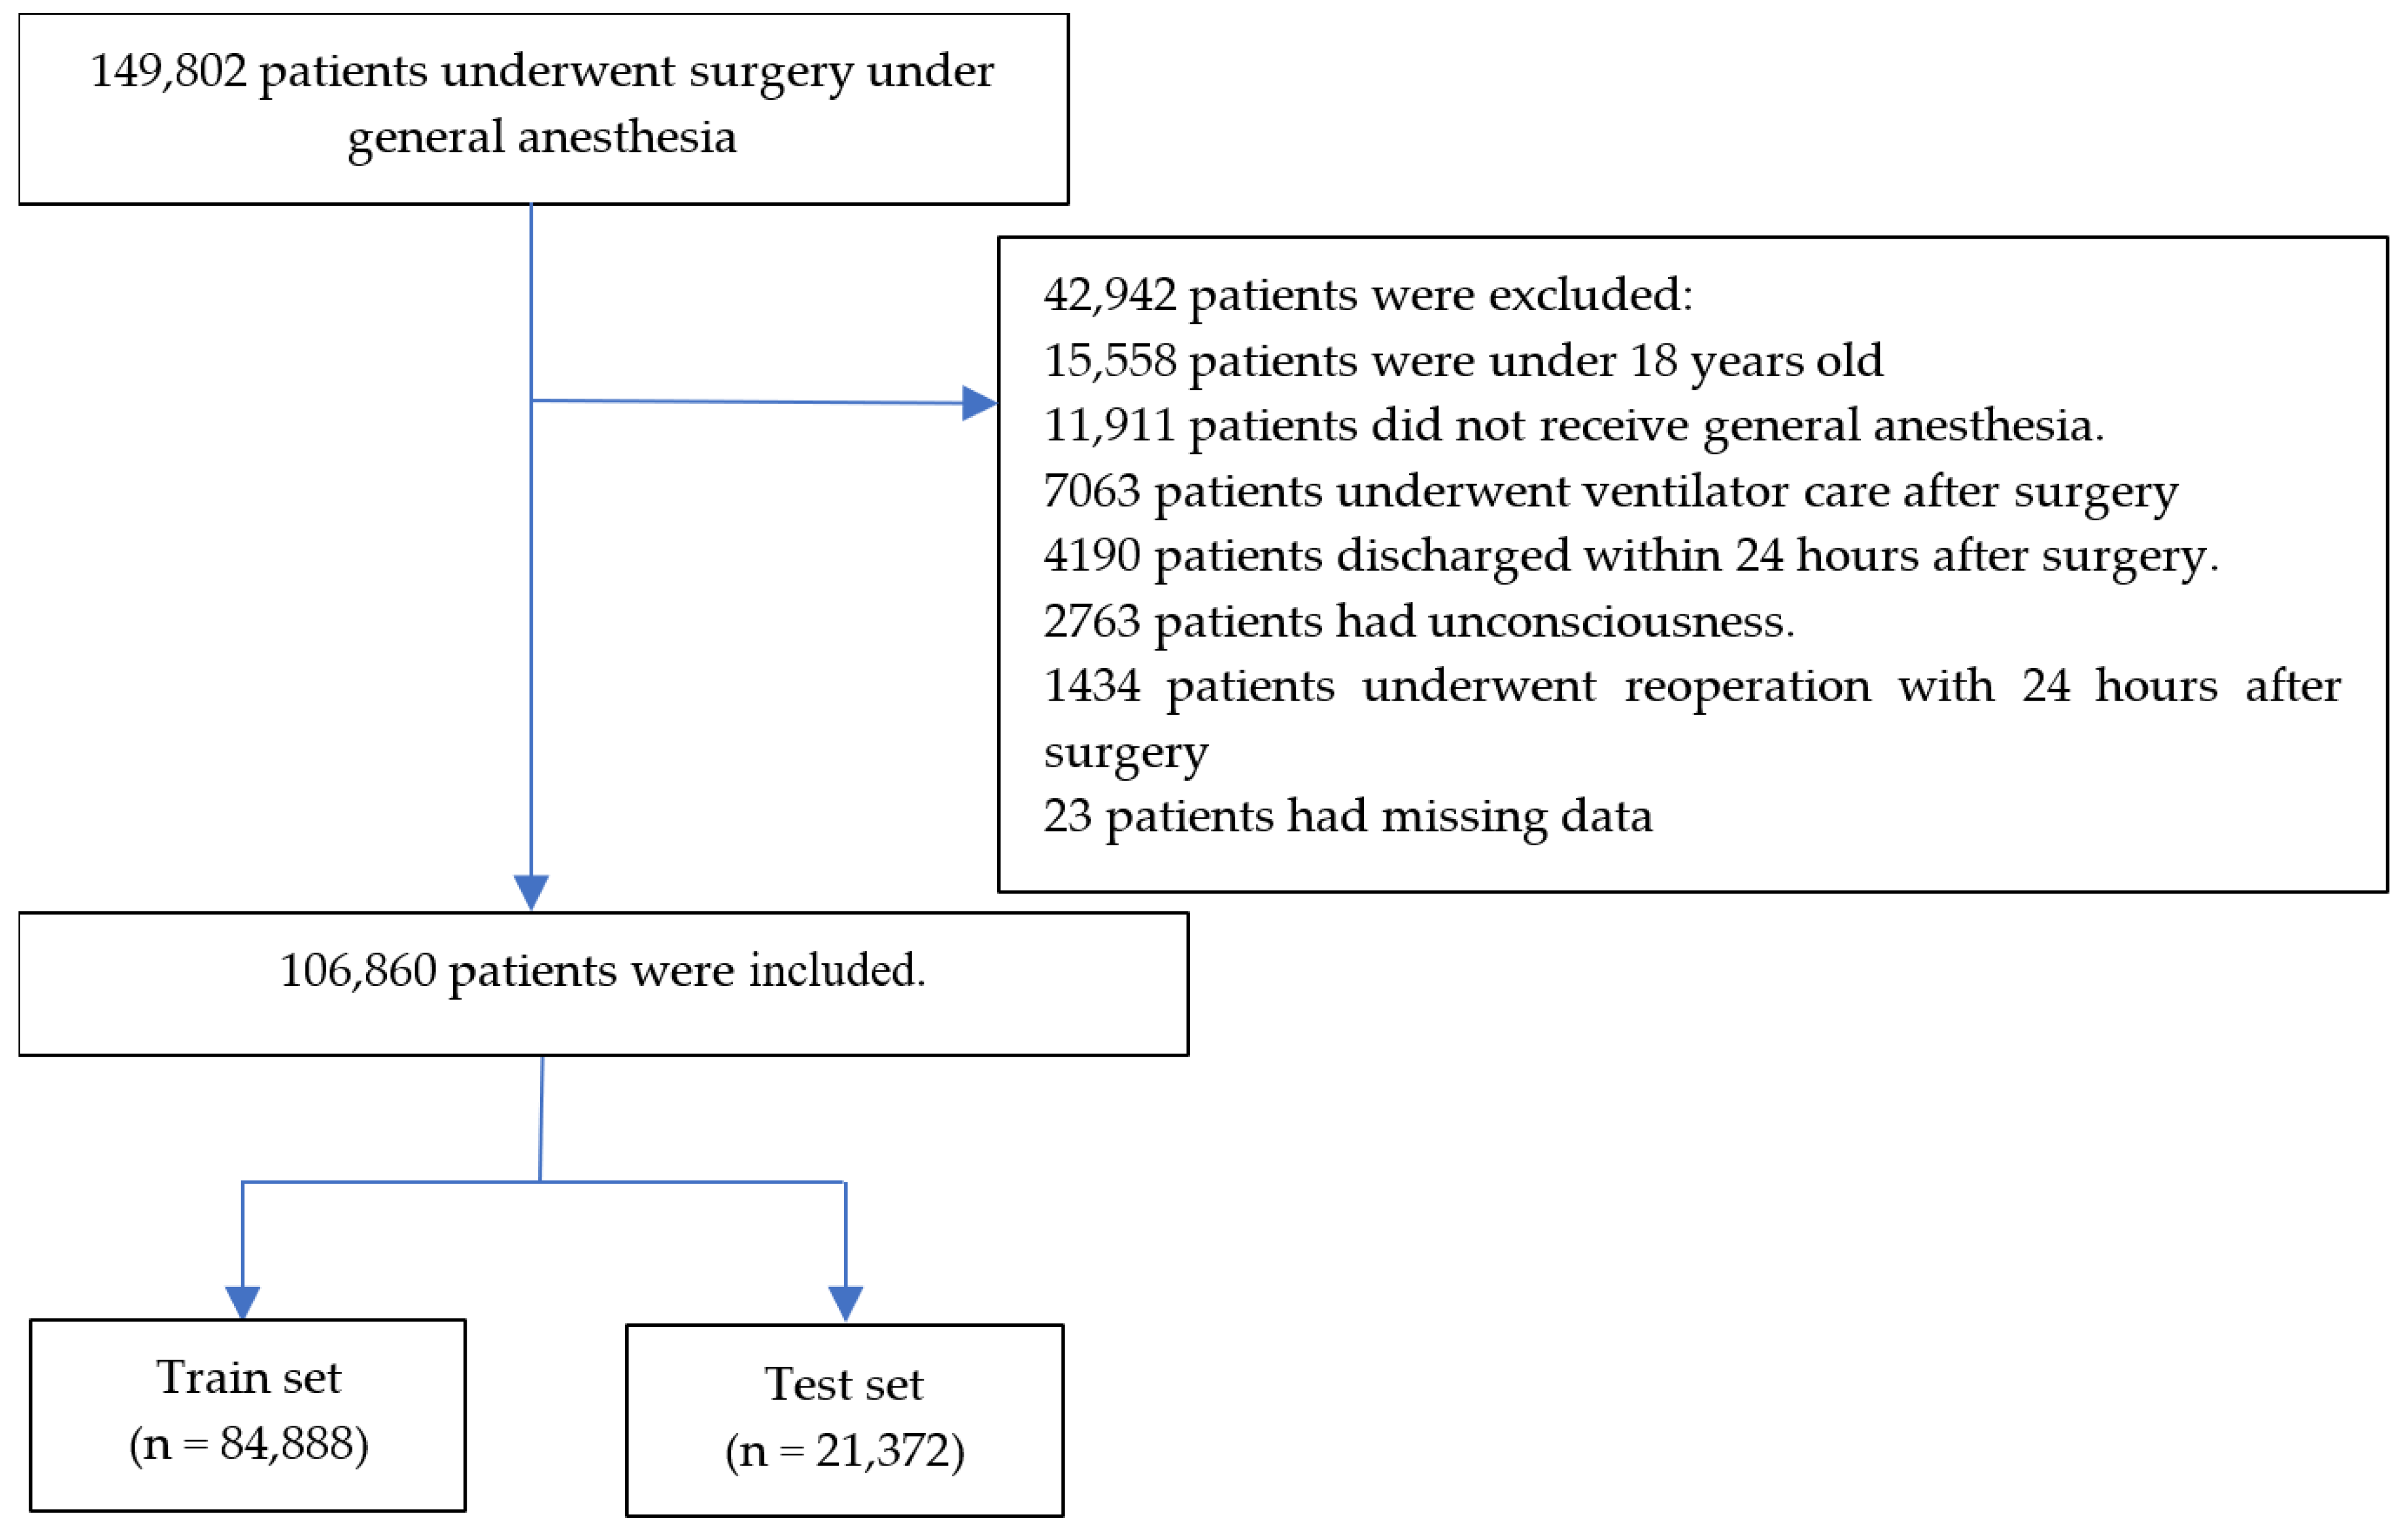
A total of 149,802 patients underwent surgery under general anesthesia from 1 January 2013 to 30 April 2023. After 42,942 patients were excluded, data of 106,860 patients were divided into training (n = 84,888) and test (n = 21,372) sets. Details are summarized in Figure 1. The numbers of PONV cases were 12,287 (14.5%) and 3072 (14.4%) in the training and test sets, respectively. Patient characteristics and perioperative data are summarized in Table 1 and Table 2, respectively. The absolute standardized difference between the training and test sets was below 0.1 for all features.
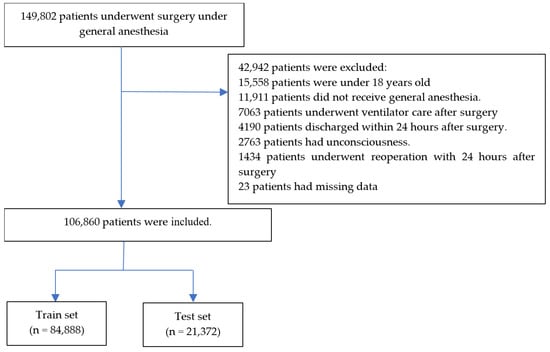
Figure 1.
Flow chart.

Table 1.
Characteristics data of patients.
Table 2.
Perioperative data of patients.
3.1. Performance of Models, including All Features
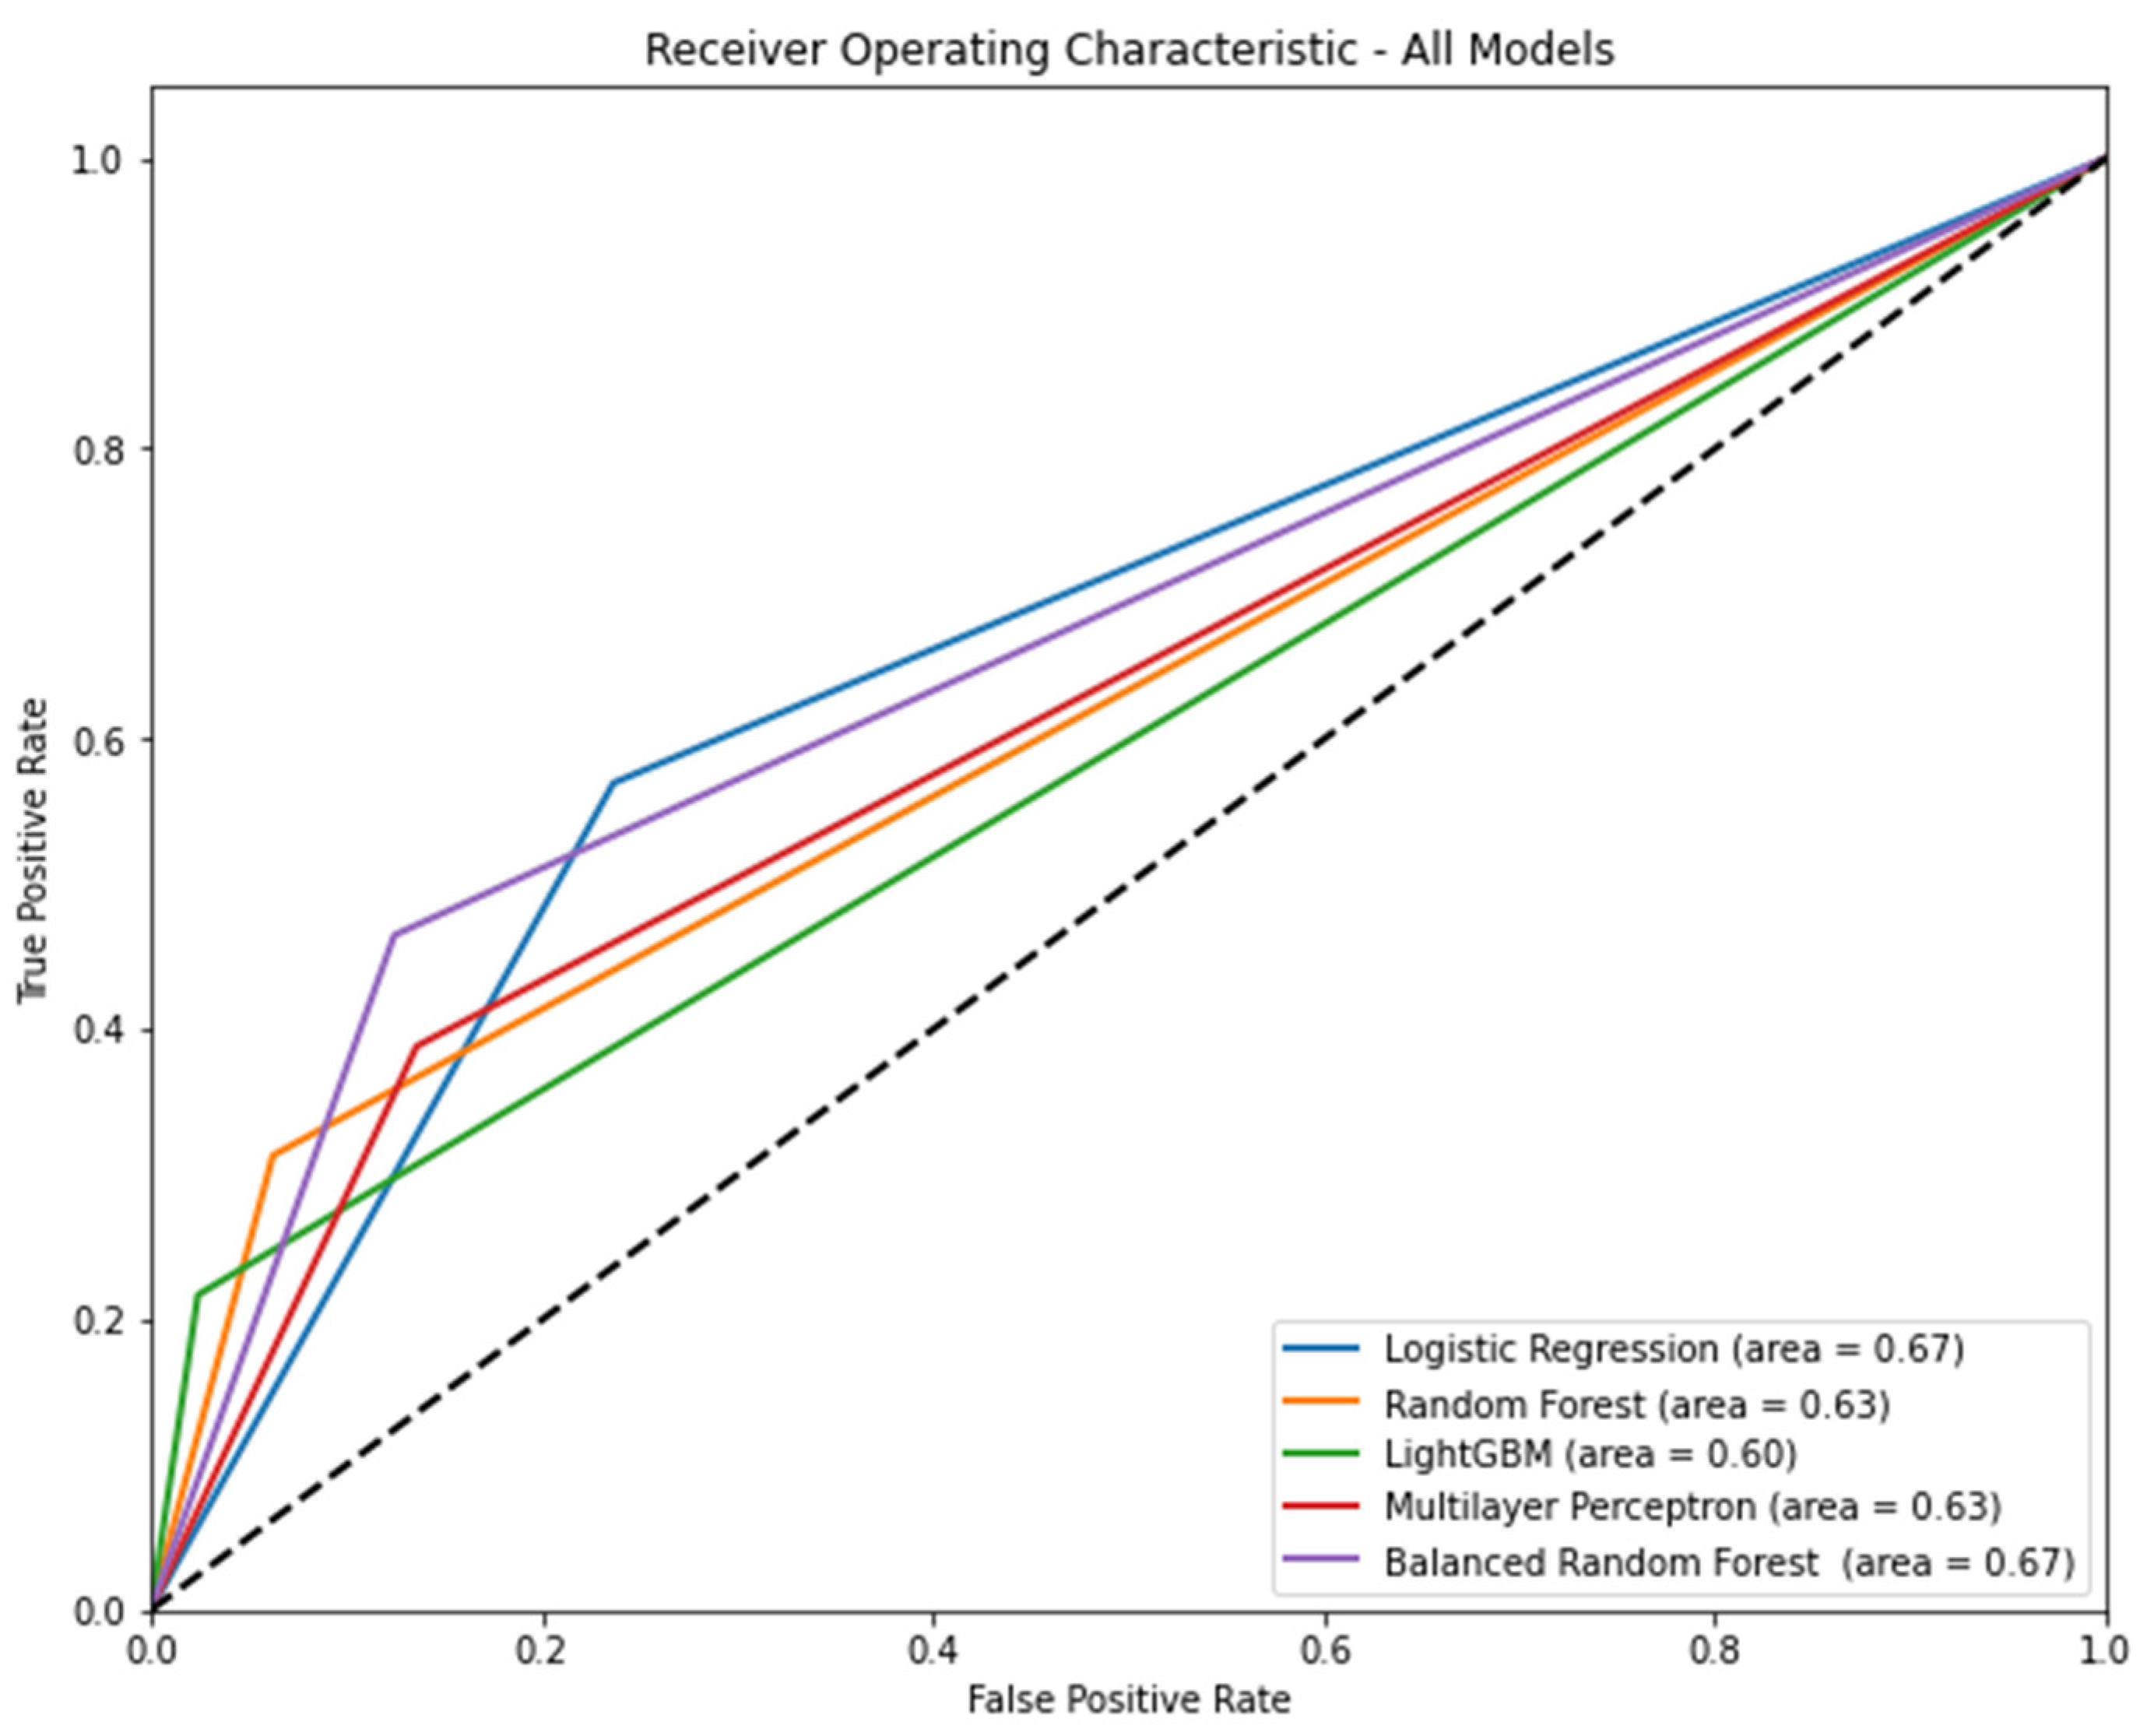
Figure 2 shows the AUROC for each model according to the algorithm. Logistic regression (AUROC [95% CI] = 0.67 [0.66–0.68]) and balanced random forest (AUROC [95% CI] = 0.67 [0.66–0.68]) had the highest AUROC. Table 3 shows the precision, recall, accuracy, and f1 score of each model according to the algorithm. In terms of precision, light GBM was the highest (0.60, 95% CI: 0.57–0.63). In terms of recall, logistic regression was the highest (0.57, 95% CI: 0.55–0.59). In terms of accuracy, light GBM was the highest (0.87, 95% CI: 0.86–0.87). In terms of f1 score, the balanced random forest was the highest (0.42, 95% CI: 0.41–0.44).

Figure 2.
The area under the receiver operating characteristic curve of each model according to algorithm when all features are included. Note: 95% confidence interval: logistic regression, 0.66–0.68; random forest, 0.62–0.63; light gradient boosting machine, 0.59–0.60; multilayer perceptron, 0.62–0.64; balanced random forest, 0.66–0.68.
Table 3.
Precision, recall, accuracy, and f1 score of each model according to the algorithm.
3.2. Performance of Models, including 10 Known Risks and Mitigating Factors
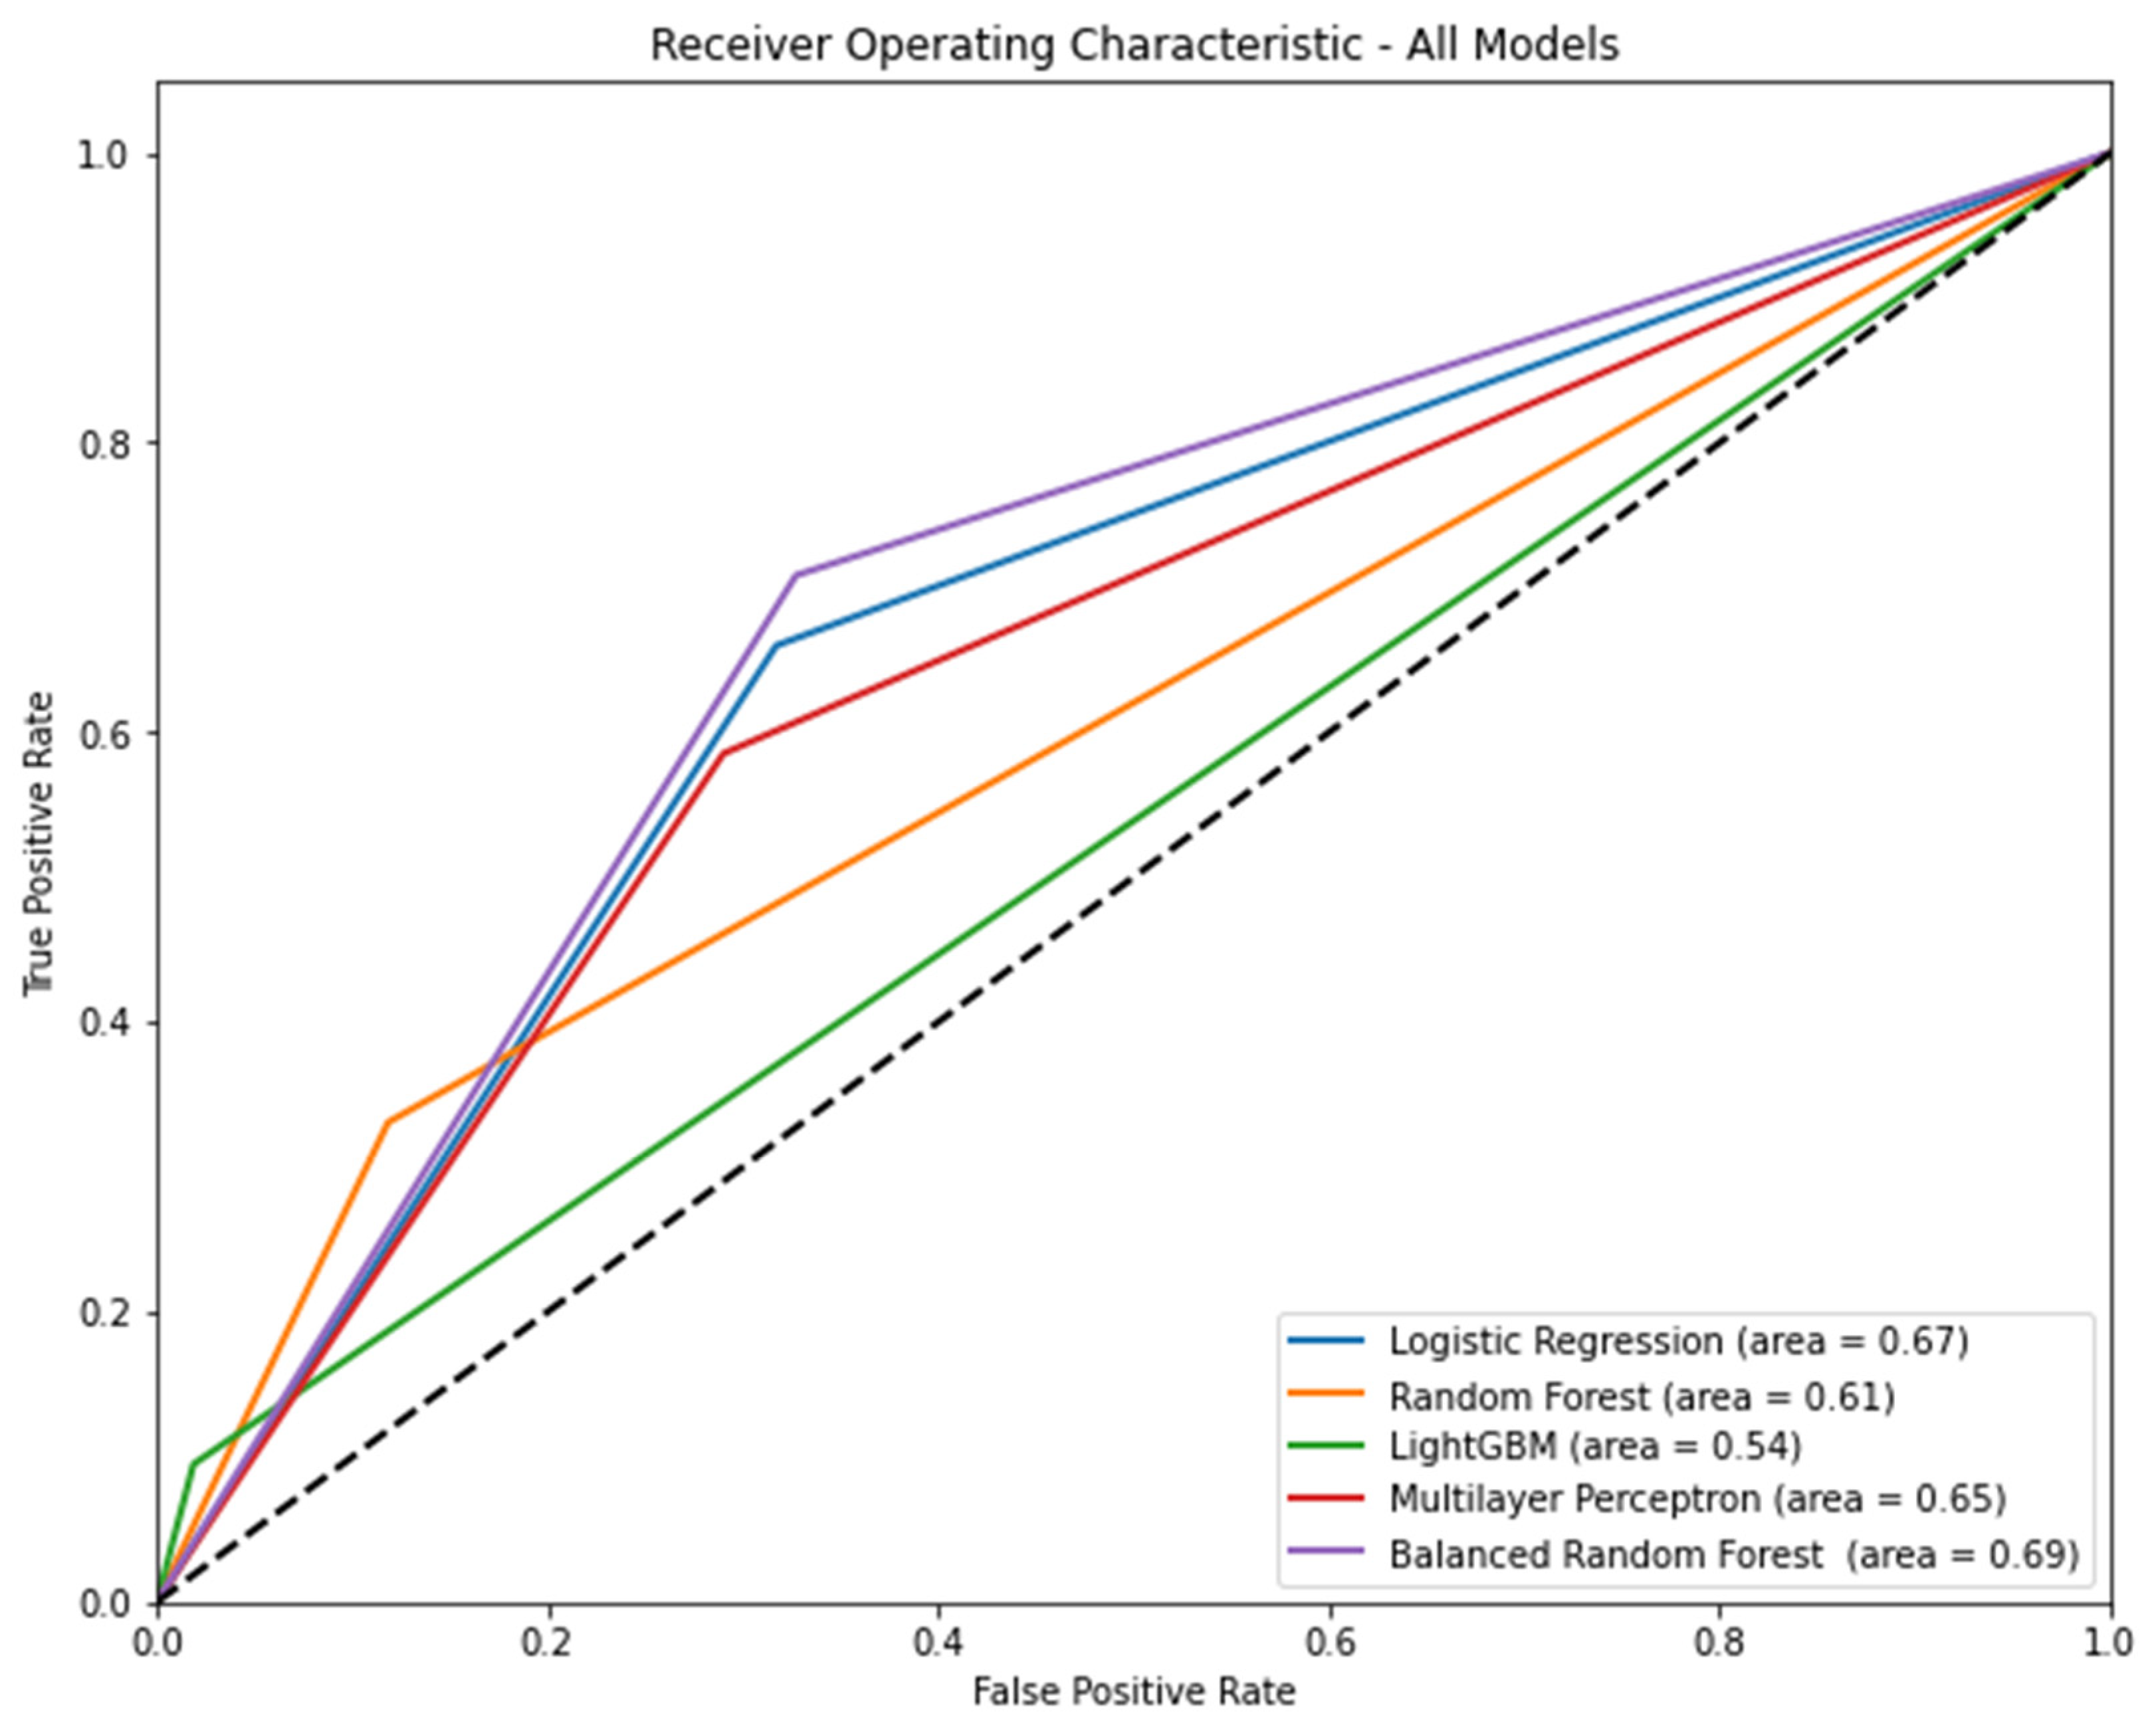
Figure 3 shows the AUROC of the models, including the known risks and mitigating factors according to the algorithm. Balanced random forest (AUROC [95% CI] = 0.69 [0.68–0.70]) had the highest AUROC. Table 4 shows the precision, recall, accuracy, and f1 score of each model according to the algorithm. In terms of precision, light GBM was the highest (0.46, 95% CI: 0.42–0.49). In terms of recall, balanced random forest was the highest (0.71, 95% CI: 0.69–0.72). In terms of accuracy, light GBM was the highest (0.85, 95% CI: 0.85–0.86). In terms of the f1 score, the balanced random forest was the highest (0.39, 95% CI: 0.38–0.40).
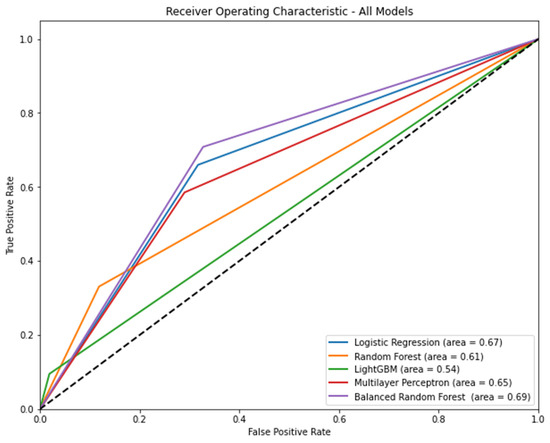
Figure 3.
The area under the receiver operating characteristic curve of models, including known risk and mitigating factors according to the algorithm Note: 95% confidence interval: logistic regression, 0.66–0.68; random forest, 0.60–0.61; light gradient boosting machine, 0.53–0.54; multilayer perceptron, 0.64–0.66; balanced random forest, 0.68–0.70.
Table 4.
Precision, recall, accuracy, and f1 score of models, including known risk and mitigating factors according to the algorithm.
3.3. Feature Importance
Table 5 lists the top 20 most important features in the models. The female sex, smoking status, obstetric and gynecologic surgery, and factors associated with postoperative opioid use were included in the five models. The importance of all features is summarized in Table A1 in Appendix B.
Table 5.
Top 20 importance features using mutual information according to model.
Table 6 shows the feature importance and score in the models that include 10 known risks and mitigating features. The female sex had the highest score in the three models (logistic regression, light gradient boosting machine, and balanced random forest), whereas postoperative opioids had the highest score in the two models (random forest and multilayer perceptron).
Table 6.
Feature importance and score in models that include 10 known risks and mitigating features.
In this study, we developed PONV prediction models with machine learning using the characteristics and perioperative data of 84,888 patients. In the evaluation of models using data from 21,372 patients, the performance of the models showed that AUROC ranged from 0.6 to 0.67 when all features were included. When the known risk and mitigating factors were included, the AUROC ranged from 0.54 to 0.69.
Shim et al. recently reported the prediction of PONV using machine learning in patients undergoing intravenous PCA [26]. Their study included 2149 patients and used seven algorithms and 13 features. Despite the small size of their data compared with ours, their AUROC ranged from 0.576 to 0.686 and was 0.643 when only Apfel risk factors were used. Their AUROC values were similar to those obtained in our study. On the other hand, Xie et al. also reported the probability of PONV for PCA using machine learning. Although they included 2222 patients and 21 features, their best AUROC value was 0.947. However, because their study included only patients who received PCA and the PCA regimen was limited, their models could not predict all patients undergoing general anesthesia. Zhou et al. reported the prediction of early postoperative PONV using multiple machine-learning and deep-learning algorithms [27]. Their study included 2149 patients and used seven algorithms and 15 features. They also had a small amount of data, but the AUROC values of the models ranged from 0.611 to 0.732. Some models showed better performance than ours. However, their data were obtained 10–15 years ago, and there were no recent data. Therefore, their models do not reflect the recent situation of anesthesia and surgery.
To develop models that can be applied to most patients under general anesthesia as much as possible, the training of the models included data from over 80,000 patients from two hospitals and 102 features. Additionally, we developed brief models that included only 10 known risks and mitigating factors. These factors are general categories that medical staff investigate or apply to general anesthesia. However, no model with excellent performance included only the 10 known risks and mitigating factors. In addition, the performance of some metrics was worse than that of models that included all features. If the removed features contain crucial information related to the target variable, their removal can result in poor performance. In this case, the model may lack the information necessary to make accurate predictions [28].
In models that included all features, the most important features were associated with opioids or PCA. In our study, if simplified models were developed with the most important features, models would have no choice but to include only the biased types of data, such as opioids and PCA, and other risk factors for PONV would have been excluded from the models. Incorporating or transforming some features may be needed to improve performance and ease of use, such as incorporating variable factors associated with postoperative opioid use. Although feature elimination sometimes helps in understanding the data, reducing computational requirements, reducing the effect of the curse of dimensionality, and improving predictor performance [29], a larger and more representative dataset can lead to better generalization [30]. The selection and transformation of features should be performed carefully, considering the specific characteristics of the data and the problem at hand.
Upon analyzing the results of feature importance, certain features consistently emerge as influential across multiple models. For instance, female sex was the variable that consistently held a substantial influence in all models, suggesting that sex might play a significant role in PONV prediction. Similarly, smoking status was another significant factor across all models, indicating its relevance in predicting the risk of PONV. Interestingly, the variables associated with opioid use demonstrated significant importance across all models, suggesting a robust association between opioid administration and the likelihood of PONV, similar to the conventional prediction of PONV. Predictions using machine learning also underscore the need for cautious opioid management strategies to mitigate the risk of PONV.
The strengths of this study include its meticulous approach to model development by utilizing a substantial dataset of over 80,000 patients and incorporating a rich set of features. This emphasis on data quantity and feature diversity provides a robust foundation for predictive modeling. In addition, the development of comprehensive models incorporating a wide range of features and simplified models based on known risk and mitigating factors acknowledges the practical need for predictive tools that can be applied to most patients undergoing general anesthesia. The integration of artificial intelligence into such medical information creates a new opportunity to design and improve new systems beyond existing systems [31].
This study also has several limitations.
- Our models acknowledged that including only known risk and mitigating factors did not exhibit strong performance and, in some cases, showed worse metrics than the models with all features. This limitation suggests that there may be unaccounted factors contributing to PONV that are not captured solely by known risks and mitigating factors.
- Although our study included a substantial number of patients, data were obtained from only two hospitals. This may raise questions regarding the diversity of patient populations and medical practices, potentially affecting the generalizability of the models to other healthcare settings.
- Some studies referenced for comparison had outdated data, which might not accurately reflect the current landscape of anesthesia and surgery. This emphasizes the importance of continuously updating the models based on recent data.
- This study highlighted the challenges of feature selection and the potential impacts of excluding informative features. However, further insight into the specific criteria and methods used for feature selection would enhance the transparency of the model development process.
4. Conclusions
Our study offers a valuable contribution to the realm of predictive modeling for PONV in patients undergoing general anesthesia. However, the performance of models based solely on known risks and mitigating factors highlights the complexity of PONV prediction and the need to consider additional contributing variables. Furthermore, the origin of the dataset from two hospitals warrants cautious interpretation when considering its generalizability across diverse healthcare settings. Prediction of PONV can lead to a significant reduction in PONV incidence by personalizing anesthesia and medication plans, efficiently allocating resources, improving patient experience, and strengthening recovery protocols. This can benefit patients by minimizing discomfort as well as making healthcare delivery and resource utilization more efficient. However, improved usability and performance of the model are needed to make this a reality.
Author Contributions
Conceptualization, Y.-S.K. and J.-J.L.; methodology, J.-H.K. and Y.-S.K.; software, M.-G.K. and B.-R.C.; validation, Y.-S.K.; formal analysis, S.-M.H.; investigation, B.-R.C. and M.-G.K.; resources, J.-J.L. and S.-Y.L.; data curation, J.-H.K.; writing—original draft preparation, Y.-S.K. and J.-H.K.; writing—editing, all authors; visualization, J.-H.K.; supervision, J.-J.L. and S.-Y.L.; project administration, J.L and S.-M.H. All authors have read and agreed to the published version of the manuscript.
Funding
This research was supported by a grant from the Medical Data-Driven Hospital Support Project through the Korea Health Information Service (KHIS), funded by the Ministry of Health and Welfare, Republic of Korea.
Institutional Review Board Statement
This study was conducted in accordance with the Declaration of Helsinki and was approved by the Clinical Research Ethics Committee of Chuncheon Sacred Hospital (No. 2023-05-003).
Informed Consent Statement
Not applicable.
Data Availability Statement
Restrictions apply to the data availability. Data were obtained from the Hallym Medical Center and made available from the clinical data warehouse with permission from the Hallym Medical Center.
Conflicts of Interest
The authors declare that this research was conducted in the absence of commercial or financial relationships that could be construed as potential conflict of interest.
Appendix A
| Listing A1. Definition of hyperparameter search space for each algorithm. |
| #Define the hyperparameter search space for each algorithm. param_dist_logreg = { ‘C’: [0.001, 0.01, 0.1, 1, 10, 100], ‘penalty’: [‘l1′, ‘l2′], ‘solver’: [‘liblinear’, ‘saga’], ‘max_iter’: [100, 200, 300, 500] } param_dist_rf = { ‘n_estimators’: [100, 200, 300, 500], ‘criterion’: [‘gini’, ‘entropy’], ‘max_depth’: [None, 5, 10, 20, 30], ‘min_samples_split’: [2, 5, 10], ‘min_samples_leaf’: [1, 2, 4], ‘class_weight’: [None, ‘balanced’, ‘balanced_subsample’] } param_dist_svm = { ‘C’: [0.001, 0.01, 0.1, 1, 10, 100], ‘kernel’: [‘linear,’ ‘poly, ‘ ‘rbf,’ ‘sigmoid’], ‘gamma’: [‘scale’, ‘auto’, 0.001, 0.01, 0.1, 1, 10, 100], } param_dist_lgbm = { ‘learning_rate’: [0.01, 0.1, 0.3], ‘n_estimators’: [100, 200, 300], ‘max_depth’: [3, 5, 7, −1], ‘num_leaves’: [31, 50, 100, 200], ‘subsample’: [0.8, 0.9, 1.0], ‘colsample_bytree’: [0.8, 0.9, 1.0], ‘reg_alpha’: [0, 0.01, 0.1], ‘reg_lambda’: [0, 0.01, 0.1] } param_dist_mlp = { ‘hidden_layer_sizes’: [(50,), (100,), (50, 50), (100, 50)], ‘activation’: [‘relu’, ‘logistic’], ‘solver’: [‘adam’, ‘sgd’], ‘learning_rate’: [‘constant, ‘ ‘invscaling, ‘ ‘adaptive’], ‘alpha’: [0.0001, 0.001, 0.01], ‘batch_size’: [16, 32, 64], ‘max_iter’: [100, 200, 300] }. |
Appendix B
Table A1.
Feature importance and score used mutual information in models that include all features.
Table A1.
Feature importance and score used mutual information in models that include all features.
| Logistic Regression | Random Forest | Light Gradient Boosting Machine | Multi-Layer Perceptron | Balanced Random Forest | |||||
|---|---|---|---|---|---|---|---|---|---|
| Feature | Score | Feature | Score | Feature | Score | Feature | Score | Feature | Score |
| Age, year | 0.014329 | Age, year | 0.014209 | Age, year | 0.010966 | Age, year | 0.011432 | Age, year | 0.035396 |
| Female | 0.150907 | Female | 0.133513 | Female | 0.09546 | Female | 0.057632 | Female | 0.109128 |
| Body mass index | 0.010811 | Body mass index | 0.006313 | Body mass index | 0 | Body mass index | 0.007466 | Body mass index | 0.004668 |
| Alcohol | 0.055069 | Alcohol | 0.039759 | Alcohol | 0.023542 | Alcohol | 0.019388 | Alcohol | 0.032532 |
| Smoking | 0.063328 | Smoking | 0.068043 | Smoking | 0.043676 | Smoking | 0.025659 | Smoking | 0.052161 |
| Congestive heart failure | 0.01305 | Congestive heart failure | 0.00061 | Congestive heart failure | 0.006554 | Congestive heart failure | 0.003448 | Congestive heart failure | 0.008212 |
| Cardiac arrhythmias | 0.013201 | Cardiac arrhythmias | 0 | Cardiac arrhythmias | 0.000727 | Cardiac arrhythmias | 0 | Cardiac arrhythmias | 0.004049 |
| Valvular disease | 0 | Valvular disease | 0 | Valvular disease | 0.000858 | Valvular disease | 0.004271 | Valvular disease | 0 |
| Pulmonary circulation disorders | 0.001711 | Pulmonary circulation disorders | 0 | Pulmonary circulation disorders | 0 | Pulmonary circulation disorders | 0 | Pulmonary circulation disorders | 0.001633 |
| Peripheral vascular disorders | 0.011444 | Peripheral vascular disorders | 0.002393 | Peripheral vascular disorders | 0.001461 | Peripheral vascular disorders | 0.002524 | Peripheral vascular disorders | 0 |
| Hypertension uncomplicated | 0.035809 | Hypertension uncomplicated | 0.003582 | Hypertension uncomplicated | 0 | Hypertension uncomplicated | 0.011136 | Hypertension uncomplicated | 0.004505 |
| Hypertension complicated | 0.022409 | Hypertension complicated | 0.010994 | Hypertension complicated | 0.004092 | Hypertension complicated | 0.004717 | Hypertension complicated | 0.004397 |
| Paralysis | 0.004824 | Paralysis | 0 | Paralysis | 0 | Paralysis | 0 | Paralysis | 0.00206 |
| Other neurological disorders | 0.007542 | Other neurological disorders | 0.00373 | Other neurological disorders | 7.43 × 10⁻⁵ | Other neurological disorders | 0 | Other neurological disorders | 0 |
| Chronic pulmonary disease | 0.036637 | Chronic pulmonary disease | 0.003064 | Chronic pulmonary disease | 0 | Chronic pulmonary disease | 0 | Chronic pulmonary disease | 0.001339 |
| Diabetes uncomplicated | 0.041356 | Diabetes uncomplicated | 0.009213 | Diabetes uncomplicated | 0.007142 | Diabetes uncomplicated | 0.001278 | Diabetes uncomplicated | 0.004796 |
| Diabetes complicated | 0.032078 | Diabetes complicated | 0.011004 | Diabetes complicated | 0.00391 | Diabetes complicated | 0.009505 | Diabetes complicated | 0 |
| Hypothyroidism | 0.002325 | Hypothyroidism | 0.005612 | Hypothyroidism | 0 | Hypothyroidism | 0.002583 | Hypothyroidism | 0.001331 |
| Renal failure | 0.026439 | Renal failure | 0.008957 | Renal failure | 0 | Renal failure | 0.0061 | Renal failure | 0.00426 |
| Liver disease | 0.022072 | Liver disease | 0.006019 | Liver disease | 0 | Liver disease | 0.002106 | Liver disease | 2.02 × 10⁻⁵ |
| Peptic ulcer disease excluding bleeding | 0.011524 | Peptic ulcer disease excluding bleeding | 0 | Peptic ulcer disease excluding bleeding | 0.000322 | Peptic ulcer disease excluding bleeding | 0.002732 | Peptic ulcer disease excluding bleeding | 0.004694 |
| AIDS/HIV | 0.004832 | AIDS/HIV | 0.004172 | AIDS/HIV | 0.004959 | AIDS/HIV | 0.002683 | AIDS/HIV | 0.00416 |
| Lymphoma | 0 | Lymphoma | 0.001566 | Lymphoma | 0 | Lymphoma | 0 | Lymphoma | 0.000138 |
| Metastatic cancer | 0.005225 | Metastatic cancer | 0 | Metastatic cancer | 0.002773 | Metastatic cancer | 0.000338 | Metastatic cancer | 0.012946 |
| Solid tumor without metastasis | 0.021974 | Solid tumor without metastasis | 0.01209 | Solid tumor without metastasis | 0.001404 | Solid tumor without metastasis | 0.001608 | Solid tumor without metastasis | 0.00237 |
| Rheumatoid arthritis/collagen vascular diseases | 0.00187 | Rheumatoid arthritis/collagen vascular diseases | 0 | Rheumatoid arthritis/collagen vascular diseases | 0 | Rheumatoid arthritis/collagen vascular diseases | 0 | Rheumatoid arthritis/collagen vascular diseases | 0.00218 |
| Coagulopathy | 0 | Coagulopathy | 0 | Coagulopathy | 0.007293 | Coagulopathy | 0 | Coagulopathy | 0 |
| Obesity | 0 | Obesity | 0 | Obesity | 0 | Obesity | 0 | Obesity | 0.000236 |
| Weight loss | 0.003957 | Weight loss | 0 | Weight loss | 0.008786 | Weight loss | 0.002254 | Weight loss | 0 |
| Fluid and electrolyte disorders | 0.00901 | Fluid and electrolyte disorders | 0.000449 | Fluid and electrolyte disorders | 0.004403 | Fluid and electrolyte disorders | 0.008499 | Fluid and electrolyte disorders | 0 |
| Blood loss anemia | 0.000666 | Blood loss anemia | 0 | Blood loss anemia | 0 | Blood loss anemia | 0 | Blood loss anemia | 0.011309 |
| Deficiency anemia | 0.016697 | Deficiency anemia | 0.004104 | Deficiency anemia | 0.00156 | Deficiency anemia | 0.009742 | Deficiency anemia | 0 |
| Alcohol abuse | 0.013662 | Alcohol abuse | 0.007081 | Alcohol abuse | 0.008237 | Alcohol abuse | 0.008525 | Alcohol abuse | 0.000989 |
| Drug abuse | 0.012531 | Drug abuse | 0 | Drug abuse | 0 | Drug abuse | 0.000605 | Drug abuse | 0.001179 |
| Psychoses | 0 | Psychoses | 0.00376 | Psychoses | 0.003083 | Psychoses | 0.001452 | Psychoses | 0 |
| Depression | 0.005406 | Depression | 0.005307 | Depression | 0.001237 | Depression | 0.001572 | Depression | 0 |
| GERD | 0.024686 | GERD | 0 | GERD | 0 | GERD | 0.007851 | GERD | 0.001501 |
| Migraine | 0.007358 | Migraine | 0 | Migraine | 0 | Migraine | 0.003449 | Migraine | 0.00197 |
| Preoperative nausea and vomiting | 0 | Preoperative nausea and vomiting | 0 | Preoperative nausea and vomiting | 0.003574 | Preoperative nausea and vomiting | 0.005058 | Preoperative nausea and vomiting | 0.002056 |
| Anesthesia time, hour | 0.008031 | Anesthesia time, hour | 0.038934 | Anesthesia time, hour | 0.030261 | Anesthesia time, hour | 0.000964 | Anesthesia time, hour | 0.072561 |
| Operation time, hour | 0.008312 | Operation time, hour | 0.041784 | Operation time, hour | 0.031438 | Operation time, hour | 0.006119 | Operation time, hour | 0.063561 |
| ASA PS | 0.029379 | ASA PS | 0.006369 | ASA PS | 0.007577 | ASA PS | 0.006162 | ASA PS | 0.026592 |
| Emergency | 0.011446 | Emergency | 0.014109 | Emergency | 0.00387 | Emergency | 0.002443 | Emergency | 0.016669 |
| Administered blood, mL | 0.007107 | Administered blood, mL | 0.01352 | Administered blood, mL | 0.001689 | Administered blood, mL | 0.004122 | Administered blood, mL | 0.018886 |
| Administered Fluid, mL | 0.00746 | Administered Fluid, mL | 0.038842 | Administered Fluid, mL | 0.017722 | Administered Fluid, mL | 0.003735 | Administered Fluid, mL | 0.081544 |
| Administered Urine, mL | 0.013733 | Administered Urine, mL | 0.045319 | Administered Urine, mL | 0.021812 | Administered Urine, mL | 0.002917 | Administered Urine, mL | 0.099572 |
| Estimated blood loss, mL | 0.020982 | Estimated blood loss, mL | 0.032045 | Estimated blood loss, mL | 0.00701 | Estimated blood loss, mL | 0.002474 | Estimated blood loss, mL | 0.081764 |
| Intraoperative PRC, unit | 0.002815 | Intraoperative PRC, unit | 0.008796 | Intraoperative PRC, unit | 0.009146 | Intraoperative PRC, unit | 0 | Intraoperative PRC, unit | 0.014102 |
| Intraoperative FFP, unit | 0 | Intraoperative FFP, unit | 0.001007 | Intraoperative FFP, unit | 0.000711 | Intraoperative FFP, unit | 0 | Intraoperative FFP, unit | 0.001156 |
| Intraoperative PC, unit | 0.005476 | Intraoperative PC, unit | 0 | Intraoperative PC, unit | 0.000244 | Intraoperative PC, unit | 0 | Intraoperative PC, unit | 0.000352 |
| A-line | 0.000496 | A-line | 0.019047 | A-line | 0.002371 | A-line | 0.005451 | A-line | 0.069996 |
| C-line | 0.005401 | C-line | 0.00958 | C-line | 0 | C-line | 0.003437 | C-line | 0.036275 |
| Foley | 0.008587 | Foley | 0.022761 | Foley | 0.002563 | Foley | 0.005108 | Foley | 0.059241 |
| Nasogastric tube | 0 | Nasogastric tube | 0.004042 | Nasogastric tube | 0.002305 | Nasogastric tube | 0.000118 | Nasogastric tube | 0 |
| Fasting time, hour | 0.005584 | Fasting time, hour | 0.003814 | Fasting time, hour | 0.00098 | Fasting time, hour | 0.002977 | Fasting time, hour | 0.012837 |
| Induction drug | 0 | Induction drug | 0.013387 | Induction drug | 0.000604 | Induction drug | 0.003543 | Induction drug | 0 |
| Maintenance agent | 0.007787 | Maintenance agent | 0.013547 | Maintenance agent | 0.008142 | Maintenance agent | 0.010943 | Maintenance agent | 0.010467 |
| N2O | 0.024304 | N2O | 0.011115 | N2O | 0.007055 | N2O | 0.001988 | N2O | 0.008418 |
| First intraoperative antiemetics | 0.016601 | First intraoperative antiemetics | 0.007223 | First intraoperative antiemetics | 0.00875 | First intraoperative antiemetics | 0.004457 | First intraoperative antiemetics | 0.014732 |
| Second intraoperative antiemetics | 0.004754 | Second intraoperative antiemetics | 0.0051 | Second intraoperative antiemetics | 0.002218 | Second intraoperative antiemetics | 0 | Second intraoperative antiemetics | 0.001557 |
| Type of PCA | 0.098404 | Type of PCA | 0.162091 | Type of PCA | 0.122345 | Type of PCA | 0.061605 | Type of PCA | 0.439285 |
| Total PCA dose, mg | 0.122888 | Total PCA dose, mg | 0.190948 | Total PCA dose, mg | 0.145924 | Total PCA dose, mg | 0.078757 | Total PCA dose, mg | 0.481962 |
| PCA flow (mg/h) | 0.114928 | PCA flow (mg/h) | 0.182959 | PCA flow (mg/h) | 0.145486 | PCA flow (mg/h) | 0.066347 | PCA flow (mg/h) | 0.480247 |
| Antiemetics of PCA | 0.092322 | Antiemetics of PCA | 0.167905 | Antiemetics of PCA | 0.130546 | Antiemetics of PCA | 0.061012 | Antiemetics of PCA | 0.434438 |
| Opioid dose at PACU, mg | 0 | Opioid dose at PACU, mg | 0.003604 | Opioid dose at PACU, mg | 0.011924 | Opioid dose at PACU, mg | 0 | Opioid dose at PACU, mg | 0.012209 |
| Preventive antiemetics in PACU | 0.028454 | Preventive antiemetics in PACU | 0.069763 | Preventive antiemetics in PACU | 0.091715 | Preventive antiemetics in PACU | 0.044332 | Preventive antiemetics in PACU | 0.117608 |
| O2 supply within 24 h after surgery | 0.011319 | O2 supply within 24 h after surgery | 0.014543 | O2 supply within 24 h after surgery | 0.000974 | O2 supply within 24 h after surgery | 0.00047 | O2 supply within 24 h after surgery | 0.041406 |
| Frequency of postoperative opioid rescue except for TDFP | 0.001584 | Frequency of postoperative opioid rescue except for TDFP | 0.011442 | Frequency of postoperative opioid rescue except for TDFP | 0.010494 | Frequency of postoperative opioid rescue except for TDFP | 0.008148 | Frequency of postoperative opioid rescue except for TDFP | 0.033191 |
| Dose of postoperative opioid rescue except for TDFP, mg | 0.006859 | Dose of postoperative opioid rescue except for TDFP, mg | 0.020091 | Dose of postoperative opioid rescue except for TDFP, mg | 0.00501 | Dose of postoperative opioid rescue except for TDFP, mg | 0 | Dose of postoperative opioid rescue except for TDFP, mg | 0.044087 |
| Postoperative TDFP within 24 h after surgery (μg/h) | 0 | Postoperative TDFP within 24 h after surgery (μg/h) | 0 | Postoperative TDFP within 24 h after surgery (μg/h) | 0.004694 | Postoperative TDFP within 24 h after surgery (μg/h) | 0.011601 | Postoperative TDFP within 24 h after surgery (μg/h) | 0.00893 |
| Intraoperative continuous infusion dose of propofol | 0.009027 | Intraoperative continuous infusion dose of propofol | 0.003551 | Intraoperative continuous infusion dose of propofol | 0.003871 | Intraoperative continuous infusion dose of propofol | 0.012563 | Intraoperative continuous infusion dose of propofol | 0.002748 |
| Intraoperative injection dose of propofol, mg | 0.031009 | Intraoperative injection dose of propofol, mg | 0.040009 | Intraoperative injection dose of propofol, mg | 0.035606 | Intraoperative injection dose of propofol, mg | 0.020658 | Intraoperative injection dose of propofol, mg | 0.042206 |
| Intraoperative dose of etomidate, mg | 0.003061 | Intraoperative dose of etomidate, mg | 0.012007 | Intraoperative dose of etomidate, mg | 0.001926 | Intraoperative dose of etomidate, mg | 0.001963 | Intraoperative dose of etomidate, mg | 0 |
| Intraoperative dose of ketamine, mg | 0 | Intraoperative dose of ketamine, mg | 0.012963 | Intraoperative dose of ketamine, mg | 0 | Intraoperative dose of ketamine, mg | 0.007965 | Intraoperative dose of ketamine, mg | 0 |
| Intraoperative dose of thiopental sodium, mg | 0 | Intraoperative dose of thiopental sodium, mg | 0.009748 | Intraoperative dose of thiopental sodium, mg | 0 | Intraoperative dose of thiopental sodium, mg | 0.00023 | Intraoperative dose of thiopental sodium, mg | 0 |
| Intraoperative dose of dexmedetomidine, mg | 0.003159 | Intraoperative dose of dexmedetomidine, mg | 0.001652 | Intraoperative dose of dexmedetomidine, mg | 0 | Intraoperative dose of dexmedetomidine, mg | 0 | Intraoperative dose of dexmedetomidine, mg | 0.010115 |
| Intraoperative dose of fentanyl, μg | 0.139895 | Intraoperative dose of fentanyl, μg | 0.206067 | Intraoperative dose of fentanyl, μg | 0.167898 | Intraoperative dose of fentanyl, μg | 0.080612 | Intraoperative dose of fentanyl, μg | 0.493458 |
| Intraoperative dose of alfentanil, mg | 0.007663 | Intraoperative dose of alfentanil, mg | 0.010001 | Intraoperative dose of alfentanil, mg | 0.011716 | Intraoperative dose of alfentanil, mg | 0 | Intraoperative dose of alfentanil, mg | 0.03767 |
| Intraoperative dose of sufentanil, mg | 0 | Intraoperative dose of sufentanil, mg | 0.004908 | Intraoperative dose of sufentanil, mg | 0.005716 | Intraoperative dose of sufentanil, mg | 0.00315 | Intraoperative dose of sufentanil, mg | 0.00679 |
| Intraoperative dose of pethidine, mg | 0.002121 | Intraoperative dose of pethidine, mg | 0 | Intraoperative dose of pethidine, mg | 0.001803 | Intraoperative dose of pethidine, mg | 0 | Intraoperative dose of pethidine, mg | 0.009948 |
| Intraoperative dose of morphine, mg | 0 | Intraoperative dose of morphine, mg | 0 | Intraoperative dose of morphine, mg | 0 | Intraoperative dose of morphine, mg | 0.000745 | Intraoperative dose of morphine, mg | 0 |
| Intraoperative dose of neostigmine, mg | 0.011668 | Intraoperative dose of neostigmine, mg | 0 | Intraoperative dose of neostigmine, mg | 0.005509 | Intraoperative dose of neostigmine, mg | 0.003925 | Intraoperative dose of neostigmine, mg | 0.006208 |
| Intraoperative dose of pyridostigmine, mg | 0.015152 | Intraoperative dose of pyridostigmine, mg | 0.007306 | Intraoperative dose of pyridostigmine, mg | 0.006987 | Intraoperative dose of pyridostigmine, mg | 0.007709 | Intraoperative dose of pyridostigmine, mg | 0.01198 |
| Intraoperative dose of sugammadex, mg | 0.004219 | Intraoperative dose of sugammadex, mg | 0.002466 | Intraoperative dose of sugammadex, mg | 0.007416 | Intraoperative dose of sugammadex, mg | 0.005625 | Intraoperative dose of sugammadex, mg | 0.006301 |
| Robotic surgery | 0.010594 | Robotic surgery | 0.009638 | Robotic surgery | 0.011253 | Robotic surgery | 0.002059 | Robotic surgery | 0.020797 |
| Laparoscopic surgery | 0.005243 | Laparoscopic surgery | 0.001475 | Laparoscopic surgery | 0.00509 | Laparoscopic surgery | 0.006372 | Laparoscopic surgery | 0.08291 |
| heart surgery | 0.001553 | heart surgery | 0 | heart surgery | 0.003475 | heart surgery | 0 | heart surgery | 0.002751 |
| Abdomen surgery | 0 | Abdomen surgery | 0.006568 | Abdomen surgery | 0.000849 | Abdomen surgery | 9.77 × 10⁻⁶ | Abdomen surgery | 0.064653 |
| Breast surgery | 0.015245 | Breast surgery | 0.008716 | Breast surgery | 0.00424 | Breast surgery | 0.003715 | Breast surgery | 0.026665 |
| Ear surgery | 0.000189 | Ear surgery | 0.003594 | Ear surgery | 0 | Ear surgery | 0 | Ear surgery | 0.014613 |
| Endocrinologic surgery | 0.007103 | Endocrinologic surgery | 0 | Endocrinologic surgery | 0.007086 | Endocrinologic surgery | 0.001702 | Endocrinologic surgery | 0.01862 |
| Eye surgery | 0.003236 | Eye surgery | 0 | Eye surgery | 0.002919 | Eye surgery | 0.001273 | Eye surgery | 0.003301 |
| Head and neck surgery | 0.032772 | Head and neck surgery | 0.028516 | Head and neck surgery | 0.028426 | Head and neck surgery | 0.018761 | Head and neck surgery | 0.088718 |
| Musculoskeletal surgery | 0.016588 | Musculoskeletal surgery | 0.022552 | Musculoskeletal surgery | 0.00291 | Musculoskeletal surgery | 0.00477 | Musculoskeletal surgery | 0.044453 |
| Neurosurgery | 0.004762 | Neurosurgery | 0.002645 | Neurosurgery | 0.002558 | Neurosurgery | 0 | Neurosurgery | 0.006022 |
| Obstetric and gynecologic surgery | 0.056 | Obstetric and gynecologic surgery | 0.038353 | Obstetric and gynecologic surgery | 0.037278 | Obstetric and gynecologic surgery | 0.025596 | Obstetric and gynecologic surgery | 0.094796 |
| Spine surgery | 0.001873 | Spine surgery | 0.008075 | Spine surgery | 0.00383 | Spine surgery | 0.001408 | Spine surgery | 0.001849 |
| Thoracic surgery | 0.006697 | Thoracic surgery | 0 | Thoracic surgery | 0.003808 | Thoracic surgery | 0 | Thoracic surgery | 0.004475 |
| Transplantation surgery | 0 | Transplantation surgery | 0 | Transplantation surgery | 0 | Transplantation surgery | 0.000324 | Transplantation surgery | 0.000534 |
| Urogenital surgery | 0.018391 | Urogenital surgery | 0.018924 | Urogenital surgery | 0.005083 | Urogenital surgery | 0.010378 | Urogenital surgery | 0.045068 |
| Vascular surgery | 0.010679 | Vascular surgery | 0.004212 | Vascular surgery | 0 | Vascular surgery | 0 | Vascular surgery | 0.000859 |
| Skin and soft tissue surgery | 0.010685 | Skin and soft tissue surgery | 0 | Skin and soft tissue surgery | 0.00063 | Skin and soft tissue surgery | 0.003378 | Skin and soft tissue surgery | 0.008169 |
| Other surgery | 0.00544 | Other surgery | 0.010513 | Other surgery | 0 | Other surgery | 0.006076 | Other surgery | 0 |
References
- Apipan, B.; Rummasak, D.; Wongsirichat, N. Postoperative nausea and vomiting after general anesthesia for oral and maxillofacial surgery. J. Dent. Anesth. Pain Med. 2016, 16, 273–281. [Google Scholar] [CrossRef] [PubMed]
- Pierre, S.; Whelan, R. Nausea and vomiting after surgery. Contin. Educ. Anaesth. Crit. Care Pain 2012, 13, 28–32. [Google Scholar] [CrossRef]
- Shaikh, S.I.; Nagarekha, D.; Hegade, G.; Marutheesh, M. Postoperative nausea and vomiting: A simple yet complex problem. Anesth. Essays Res. 2016, 10, 388–396. [Google Scholar] [CrossRef] [PubMed]
- Silva, A.C.; O’Ryan, F.; Poor, D.B. Postoperative nausea and vomiting (PONV) after orthognathic surgery: A retrospective study and literature review. J. Oral Maxillofac. Surg. 2006, 64, 1385–1397. [Google Scholar] [CrossRef] [PubMed]
- Chatterjee, S.; Rudra, A.; Sengupta, S. Current concepts in the management of postoperative nausea and vomiting. Anesthesiol. Res. Pract. 2011, 2011, 748031. [Google Scholar] [CrossRef] [PubMed]
- Sizemore, D.C.; Singh, A.; Dua, A.; Singh, K.; Grose, B.W. Postoperative Nausea. In StatPearls; StatPearls Publishing: Treasure Island, FL, USA, 2023. [Google Scholar]
- Elvir-Lazo, O.L.; White, P.F.; Yumul, R.; Cruz Eng, H. Management strategies for the treatment and prevention of postoperative/postdischarge nausea and vomiting: An updated review. F1000Research 2020, 9, 983. [Google Scholar] [CrossRef] [PubMed]
- Postoperative Nausea and Vomiting. Available online: https://www.uptodate.com/contents/postoperative-nausea-and-vomiting (accessed on 19 August 2023).
- Gan, T.J.; Belani, K.G.; Bergese, S.; Chung, F.; Diemunsch, P.; Habib, A.S.; Jin, Z.; Kovac, A.L.; Meyer, T.A.; Urman, R.D.; et al. Fourth Consensus Guidelines for the Management of Postoperative Nausea and Vomiting. Anesth. Analg. 2020, 131, 411–448. [Google Scholar] [CrossRef] [PubMed]
- Andrew, B.Y.; Habib, A.S.; Taicher, B.M. The Association of Guideline-Directed Prophylaxis with Postoperative Nausea and Vomiting in Pediatric Patients: A Single-Center, Retrospective Cohort Study. Anesth. Analg. 2023; in press. [Google Scholar]
- Habehh, H.; Gohel, S. Machine Learning in Healthcare. Curr. Genom. 2021, 22, 291–300. [Google Scholar] [CrossRef]
- Javaid, M.; Haleem, A.; Pratap Singh, R.; Suman, R.; Rab, S. Significance of machine learning in healthcare: Features, pillars and applications. Int. J. Intell. Netw. 2022, 3, 58–73. [Google Scholar] [CrossRef]
- El-Sherbini, A.H.; Hassan Virk, H.U.; Wang, Z.; Glicksberg, B.S.; Krittanawong, C. Machine-Learning-Based Prediction Modelling in Primary Care: State-of-the-Art Review. AI 2023, 4, 437–460. [Google Scholar] [CrossRef]
- Merath, K.; Hyer, J.M.; Mehta, R.; Farooq, A.; Bagante, F.; Sahara, K.; Tsilimigras, D.I.; Beal, E.; Paredes, A.Z.; Wu, L.; et al. Use of Machine Learning for Prediction of Patient Risk of Postoperative Complications After Liver, Pancreatic, and Colorectal Surgery. J. Gastrointest. Surg. 2020, 24, 1843–1851. [Google Scholar] [CrossRef] [PubMed]
- Sklearn Preprocessing Standard Scaler. Available online: https://scikit-learn.org/stable/modules/generated/sklearn.preprocessing.StandardScaler.html (accessed on 19 August 2023).
- Tyagi, S.; Mittal, S. Sampling approaches for imbalanced data classification problem in machine learning. In Proceedings of the ICRIC 2019: Recent Innovations in Computing, Jammu, India, 8–9 March 2020; pp. 209–221. [Google Scholar]
- Chawla, N.V.; Bowyer, K.W.; Hall, L.O.; Kegelmeyer, W.P. SMOTE: Synthetic minority over-sampling technique. J. Artif. Intell. Res. 2002, 16, 321–357. [Google Scholar] [CrossRef]
- Light GBM. Available online: https://lightgbm.readthedocs.io/en/v3.3.2/ (accessed on 30 January 2023).
- Sklearn Neural_Network MLP Classifier. Available online: https://scikit-learn.org/stable/modules/generated/sklearn.neural_network.MLPClassifier.html (accessed on 30 January 2023).
- sklearn.linear_model.LogisticRegression. Available online: https://scikit-learn.org/stable/modules/generated/sklearn.linear_model.LogisticRegression.html (accessed on 30 January 2023).
- Breiman, L. Random forests. Mach. Learn. 2001, 45, 5–32. [Google Scholar] [CrossRef]
- Yağcı, A.M.; Aytekin, T.; Gürgen, F.S. Balanced random forest for imbalanced data streams. In Proceedings of the 2016 24th Signal Processing and Communication Application Conference (SIU), Zonguldak, Turkey, 16–19 May 2016; pp. 1065–1068. [Google Scholar]
- BalancedRandomForestClassifier. Available online: https://imbalanced-learn.org/stable/references/generated/imblearn.ensemble.BalancedRandomForestClassifier.html (accessed on 19 August 2023).
- Putri, T.A.E.; Widiharih, T.; Santoso, R. Penerapan Tuning Hyperparameter Randomsearchcv Pada Adaptive Boosting Untuk Prediksi Kelangsungan Hidup Pasien Gagal Jantung. J. Gaussian 2023, 11, 397–406. [Google Scholar] [CrossRef]
- Barraza, N.; Moro, S.; Ferreyra, M.; de la Peña, A. Mutual information and sensitivity analysis for feature selection in customer targeting: A comparative study. J. Inf. Sci. 2019, 45, 53–67. [Google Scholar] [CrossRef]
- Shim, J.-G.; Ryu, K.-H.; Cho, E.-A.; Ahn, J.H.; Cha, Y.B.; Lim, G.; Lee, S.H. Machine learning for prediction of postoperative nausea and vomiting in patients with intravenous patient-controlled analgesia. PLoS ONE 2022, 17, e0277957. [Google Scholar] [CrossRef] [PubMed]
- Zhou, C.-M.; Wang, Y.; Xue, Q.; Yang, J.-J.; Zhu, Y. Predicting early postoperative PONV using multiple machine-learning- and deep-learning-algorithms. BMC Med. Res. Methodol. 2023, 23, 133. [Google Scholar] [CrossRef] [PubMed]
- Steyerberg, E.W.; Uno, H.; Ioannidis, J.P.A.; van Calster, B. Poor performance of clinical prediction models: The harm of commonly applied methods. J. Clin. Epidemiol. 2018, 98, 133–143. [Google Scholar] [CrossRef]
- Chandrashekar, G.; Sahin, F. A survey on feature selection methods. Comput. Electr. Eng. 2014, 40, 16–28. [Google Scholar] [CrossRef]
- Shorten, C.; Khoshgoftaar, T.M. A survey on Image Data Augmentation for Deep Learning. J. Big Data 2019, 6, 60. [Google Scholar] [CrossRef]
- Metha, S.; Chatterjee, A.N. An Investigation on the architecture of public health information system by using artificial intelligence. Seybold Rep. 2023, 18, 747–763. [Google Scholar]
Disclaimer/Publisher’s Note: The statements, opinions and data contained in all publications are solely those of the individual author(s) and contributor(s) and not of MDPI and/or the editor(s). MDPI and/or the editor(s) disclaim responsibility for any injury to people or property resulting from any ideas, methods, instructions or products referred to in the content. |
© 2023 by the authors. Licensee MDPI, Basel, Switzerland. This article is an open access article distributed under the terms and conditions of the Creative Commons Attribution (CC BY) license (https://creativecommons.org/licenses/by/4.0/).